
Abstract
Defective hematopoiesis supporting capacity of bone marrow (BM) stroma has been implicated in the pathophysiology of myelodysplastic syndromes (MDS). The aim of this study is to explore whether the BM stroma progenitors, namely the mesenchymal stem cells (MSCs), are primarily affected in MDS by evaluating the reserves, the functional properties, as well as the cytogenetic characteristics, in comparison to BM hematopoietic cells, in patients with de novo MDS (n = 13). The number, differentiation potential toward adipocytes/chondrocytes/osteoblasts and immunosuppressive function in terms of inhibition of mitogen-induced T-cell proliferation did not differ significantly between patient and normal (n = 20) MSCs. Patient MSCs did not show any aberrations in the production of proinflammatory or growth-promoting cytokines and did not harbor the cytogenetic abnormalities present in hematopoietic cells. Occasional patient and normal MSC cultures, however, developed irrelevant chromosomal alterations (trisomies 5 and 7) with uncertain pathophysiologic significance. Compared to controls, patient MSCs displayed impaired proliferative and clonogenic potential through passages that might represent a nonspecific abnormality associated with the chronic inflammatory process present in patients' BM. These data suggest that BM MSCs from MDS patients do not belong to the abnormal clone and do not represent the main cellular source contributing to the inflammatory marrow microenvironment.
Introduction
M
The hematopoiesis supportive cellular elements of BM stroma, namely the adipocytes, osteoblasts, and fibroblast-like cells, derive from a common progenitor cell, the mesenchymal stem cell (MSC) [13 –15]. In addition to their capacity to support hematopoiesis, MSCs also display local and systemic immunoregulatory and immunosuppressive properties [16 –18]. Since a common stem cell with wide differentiation potential, namely the multipotent adult progenitor cell (MAPC), has been proposed for BM HSCs and MSCs [19], it seems reasonable to assume that BM MSCs in MDS patients might belong to the abnormal clone and might be primarily defective. Alternatively, BM MSCs in MDS patients might display secondary genetic aberrations and/or functional defects due to the deranged release of proinflammatory mediators and inhibitory cytokines by the apoptotic hematopoietic cells and the activated cellular components of the BM microenvironment.
The possible involvement of BM MSCs in the pathogenetic/pathophysiologic process of MDS has not been extensively studied whereas existing data on the cytogenetic and functional integrity of BM MSCs in MDS patients have shown contradictory results [20 –26]. In the current study, we have investigated the reserves and qualitative characteristics of BM MSCs in MDS patients in terms of the proliferative and clonogenic potential, the differentiation capacity, and immunoregulatory properties. The cytogenetic characteristics of BM MSCs in comparison to BM hematopoietic cells as well as the chromosomal stability of BM MSCs during passages have been also studied.
Patients and Methods
Patients
Thirteen patients with de novo MDS and 20 age- and sex-matched healthy individuals, were studied. Patients were classified according to the World Health Organization (WHO) and the International Prognostic Scoring System (IPSS) and were studied on diagnosis before receiving any medication [27,28]. Patient characteristics are summarized in Table 1. The study has approved by the Ethics Committee of the University Hospital of Heraklion and informed consent according to the Helsinki Protocol was obtained from all subjects.
Abbreviations: BM, Bone marrow; MDS, myelodysplastic syndrome; MSCs, mesenchymal stem cells; No, number; Pt, patient; RA, refractory anemia; RAEB, RA with excess of blasts.
MSC cultures
BM cells from posterior iliac crest aspirates were diluted 1:1 in Dulbecco's modified Eagle's medium-Low Glucose (DMEM-LG; Gibco Invitrogen, Paisley, Scotland) supplemented with 100 IU/mL penicillin–streptomycin (PS; Gibco) and 10 IU/mL preservative-free heparin (Sigma, Saint Louis, MO). The BM mononuclear cells (BMMCs) were obtained following centrifugation on Histopaque-1077 (Sigma) and were cultured in DMEM-LG/10% fetal calf serum (FCS; Hyclone, Logan, UT)/100 IU/mL PS (MSC medium) at a concentration of 2 × 10⁵ cells/cm2 in 25-cm2 culture flasks at 37°C/5%CO2 fully humidified atmosphere. MSC cultures were expanded as previously described [29]. On 70%–90% confluence, cells were detached using 0.25% trypsin–1 mM EDTA (Gibco) and re-seeded for a total of 8 passages (P). Cell-free supernatants were stored at −70°C for measurement of tumor necrosis factor (TNF)-α, interleukin (IL)-1β, IL-6, stromal-derived factor (SDF)-1α, and vascular endothelial growth factor (VEGF) levels by an enzyme-linked immunosorbent assay (ELISA). All ELISA kits were purchased from R&D Systems (Quantikine, Minneapolis, MN) except the TNF-α kit (Biosource International Inc., Camarillo, CA).
MSC differentiation assays
Trypsinized MSCs from P2 were induced for adipogenic, osteogenic, and chondrogenic differentiation [30,31]. Adipogenic differentiation was induced following 21-day culture of cells in MSC medium supplemented with 10% FCS/0.5 mM 1-methyl-3-butylisoxanthine/1 μM dexamethasone (Dex)/0.2 μM indomethacin/10 μg/mL insulin and adipogenesis was assessed by Oil Red O staining. Osteogenic differentiation was induced following 21-day culture of cells in MSC medium supplemented with 0.1 μM Dex/0.15 mM ascorbate-2-phosphate/3 mM NaH2PO4 and osteogenesis was assessed by alkaline phosphatase (ALP)/von Kossa staining. For chondrogenic induction, MSCs were pelleted in 15-mL tubes and cultured for 21 days in DMEM-High Glucose (Gibco), supplemented with 6.25 μg/mL insulin/6.25 μg/mL transferrin/1.33 μg/mL linoleic acid/1.25 mg/mL bovine serum albumin/1 mM sodium pyruvate/0.17 mM ascorbate-2-phosphate/0.1 μM Dex/0.35 mM
Total RNA isolated from differentiated MSCs from patients and controls (RNeasy mini kit; QIAGEN, GmbH, Hilden, Germany) was reverse-transcribed (SUPERSCRIPT II; Gibco) and amplified by polymerase chain reaction (RT-PCR) for the evaluation of specific, differentiation-associated gene expression: adipose fatty acid-binding protein (aP2) and peroxisome proliferator-activated receptor-γ (PPARG) for adipocytes, ALP and runt-related transcription factor 2 (RUNX2) for osteocytes, collagen type II (COL2A1), and aggrecan (AGC1) for chondrocytes. Products were normalized according to β2-microglobulin (β 2 m) expression, using the ImageJ densitometry analysis system. Primer sequences and RT-PCR conditions have been reported previously [32].
Immunophenotypic characteristics of MSCs
Trypsinized MSCs from P1–P6 were immunophenotypically characterized using monoclonal antibodies against CD29 (4B4; Cyto-Stat/Beckman-Coulter, Fullerton, CA), CD44 (J173; Immunotech/Coulter, Marseille, France), CD73 (AD2; Becton Dickinson-Pharmingen, San Diego, CA), CD90 (F15.42; Immunotech/Coulter), CD105 (SN6; Caltag, Burlingame, CA), CD146 (P1H12; Becton Dickinson-Pharmingen), CD45 (IMMU19.2; Immunotech/Coulter), CD14 (RMO52; Immunotech/Coulter), and CD34 (QBend10; Beckman-Coulter). Data were processed in an Epics Elite flow cytometer (Coulter, Miami, FL).
Clonogenic potential of MSCs
Colony-forming unit fibroblast assay. A colony-forming unit fibroblast (CFU-F) assay was used for the evaluation of the clonogenic potential of MSCs through P1–P6 [32]. Trypsinized MSCs from P1 to P6 were seeded at 3 different concentrations (50–150 cells) in 60-mm plates for 14 days. CFU-Fs were quantified using Giemsa staining [30]. The number of CFU-F was estimated per 100 MSCs on the basis of the linear regression analysis obtained from the 3 different initial cell concentrations [31].
Limiting dilution assay. A limiting dilution assay (LDA) was used to indirectly evaluate the frequency of MSCs within BMMCs following 6-week culture of 7 different concentrations of BMMCs (250–10,000 cells/well) in 96-well flat bottom plates as previously described [32,33]. Wells with >50 adherent spindle-shaped cells were considered positive and MSC frequency corresponded to the dilution resulting in 37% negative wells [30,34].
Proliferative potential of MSCs
The proliferative potential of MSCs was evaluated by a methyl triazolyl tetrazolium (MTT)-based assay at P2 and also by estimating the population doubling time through P1–P6 [32]. The formula 2n = N x/N 0 was used for the calculation of the population doublings (n) at each passage based on the number of cells counted in the flask after trypsinization (N x) and the number of cells initially plated (N 0).
T-cell proliferation assay
PB samples from healthy donors were centrifuged on Histopaque-1077 to obtain the mononuclear cells and the CD3+ cell fraction was fractionated by indirect magnetic labeling (magnetic-activated cell sorting; MACS isolation kit, Miltenyi Biotec GmbH, Germany). In each experiment, purity of CD3+ cells was >96% as estimated by flow cytometry. To evaluate the capacity of MSCs from MDS patients and healthy subjects to suppress T-cell proliferative responses, we stimulated 5 × 10⁴ immunomagnetically sorted normal CD3+ cells with phytohemagglutinin (PHA; 2 μg/mL) or interleukin-2 (IL-2; 500 IU/mL) in the presence or absence of 104 irradiated (30 Gy) BM MSCs from MDS patients or allogeneic healthy controls in V-bottomed 96-well culture plates for 7 days in 0.2 mL RPMI-1640 medium (Gibco) containing 10% FCS [35,36]. T-cell proliferation was measured on day 7 following an 18-h pulse with 1 μCi/well 3 H-thymidine ( 3 H-TdR; Amersham, Buckingham, UK). 3 H-TdR incorporation was measured by using a liquid scintillation counter (LS1701 beta counter-Beckman, USA). The percentage of inhibition of T-cell proliferation by MSCs was calculated by dividing the difference of counts per minute (cpm) between cultures of T cells with and without MSCs in the presence of the activator by the cpm obtained from the cultures of T cells with the activator alone. Experiments were performed in triplicates.
Cytogenetic analysis of BM hematopoietic cells and culture-expanded MSCs
Chromosome-banding analysis. BM cells from MDS patients and healthy controls were cultured in RPMI-1640 medium supplemented with 5% FCS and 100 IU/mL PS at 37°C for 24 and 48 h. For chromosome preparation, colcemide (0.1 g/mL) was added for 2 and 24 h before harvesting. Following treatment with hypotonic KCl solution and fixation with a mixture of glacial acid and absolute methanol (1:3), a modified chromosome-banding technique (GAG; Giemsa bands by acetic saline-Giemsa) was used and 15–25 metaphase cells (range 5–25) were analyzed and classified according to the International System for Human Cytogenetic Nomenclature (ISCN) [37,38]. Similarly, MSCs from P2 were exposed to colcemide (0.1 g/mL) for 24 h and trypsinized. For chromosomal analysis, GAG banding was performed in all 13 MDS patients and in 5 healthy individuals. In 6 MDS patients, a chromosome analysis was also performed in MSCs from P4, P6, and P8. Whenever possible, 15–20 metaphase cells in each passage (range 0–40, median 13) were analyzed and classified according to the ISCN.
A chromosomal aberration was defined as clonal abnormality when at least 2 metaphases were demonstrating the same structural rearrangement or chromosome gain, whereas a chromosome loss had to be identified in at least 3 metaphases [38].
Fluorescence in situ hybridization. Fluorescence in situ hybridization (FISH) was performed using commercially available locus-specific probes for chromosome 5 [LSI EGR1(5q31)/D5S23,D5S721], chromosome 7 [LSI D7S486(7q31)/CEP7], and chromosome 8 (CEP8) following the protocol of the manufacturer (Abbott Laboratories, Abbott Park, Illinois). The signals of at least 200 interphase nuclei in each case were visualized and counted with a Zeiss Axioskop microscope (Zeiss, Jena, Germany) and documented with the analyzing system ISIS (MetaSystems, Altlussheim, Germany).
Statistical analysis
Statistical analysis was performed by means of the non-parametric Mann–Whitney test and the 2-way analysis of variance (ANOVA) test using the GraphPad Prism statistical software (San Diego, CA). Grouped data were expressed as means ± 1 standard deviation.
Results
Reserves, morphologic, and immunophenotypic characteristics of BM MSCs
MSCs cultures were successfully expanded in all MDS patients and healthy controls. The immunophenotypic analysis at the end of each passage demonstrated that cultures constituted of a homogenous cell population positive for CD73, CD90, CD146, CD105, CD29, CD44 surface antigens and negative for the hematopoietic markers CD45, CD14, and CD34 (Fig. 1). MSCs displayed also the characteristic spindle-like morphology (Fig. 2A). The estimated frequency of MSCs in the BMMC fraction according to the LDA did not differ significantly between MDS patients (21.74 ± 13.59 per 105 BMMCs) and healthy controls (24.84 ± 15.43 per 105 BMMCs; P = 0.7823). These data suggest that the reserves, morphologic, and immunophenotypic characteristics of BM MSCs in MDS patients are similar to the normal individuals.

Immunophenotypic characteristics of mesenchymal stem cells (MSCs). The graphs show the flow cytometric characteristics of MSCs at passage 2 from a representative myelodysplastic syndrome (MDS) patient. The forward scatter (FSC) versus side scatter (SSC) dot plot depicts the gate of MSCs population (R1). The open histograms show the expression of positive (CD73, CD105, CD90, CD44, CD146, CD29) and negative (CD34, CD14, CD45) surface markers in comparison to isotype-matched controls (gray-filled histograms) in MSCs gated in R1.
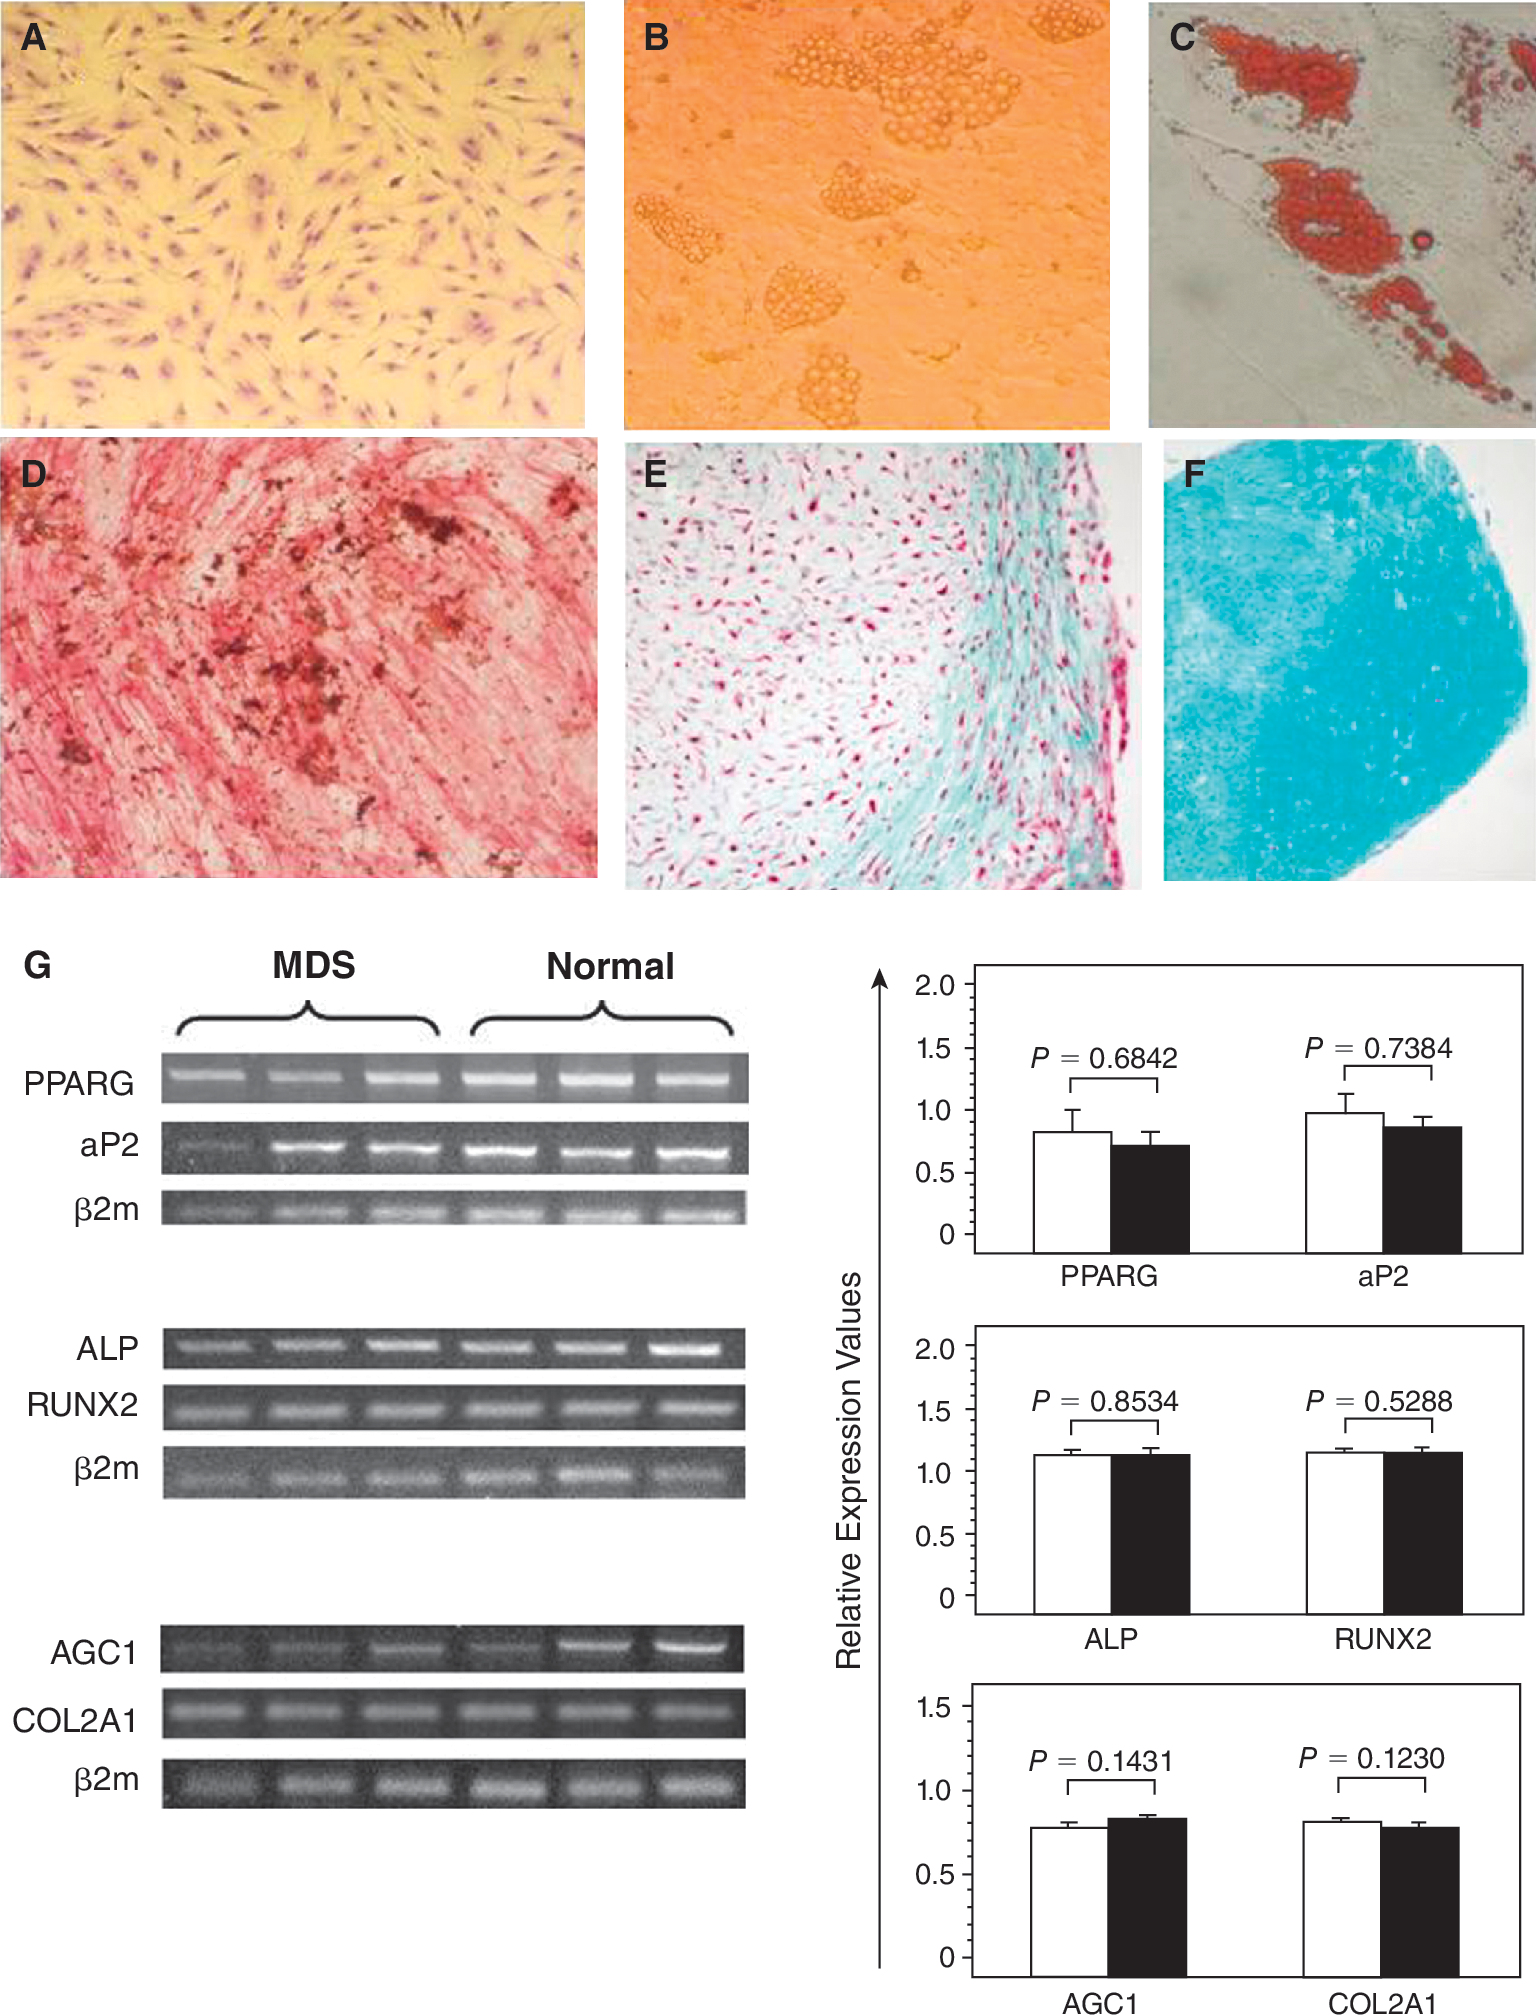
. Differentiation potential of mesenchymal stem cells (MSCs). The upper panel shows undifferentiated MSCs from P2 (
Differentiation potential of MSCs
Culture-expanded MSCs from MDS patients were able to differentiate into adipogenic, osteogenic, and chondrogenic lineages as was shown by the respective cytochemical stainings (Fig. 2B–2F). Furthermore, the adipogenic, osteogenic, and chondrogenic differentiating capacity assessed by the relative mRNA expression of aP2 and PPARG, ALP and RUNX2, COL2A1 and AGC1, respectively, did not differ significantly between MDS patients and controls (P = 0.7394 and P = 0.6842, P = 0.8534 and P = 0.5288, P = 0.123 and P = 0.1431, respectively; Fig. 2G). These data suggest that BM MSCs from MDS patients display normal differentiation potential.
Clonogenic and proliferative potential of MSCs
Data showing the clonogenic and proliferative potential of MSCs in MDS patients and healthy controls are presented in Figure 3. CFU-F recovery by culture-expanded MSCs was significantly lower in MDS patients compared to controls through P1–P6 culture period (F = 14.359, P < 0.01) suggesting defective clonogenic capacity of patient MSCs. The doubling time of MSCs during the P1–P6 culture period was significantly increased in MDS patients compared to controls (F = 67.58405, P < 0.001). Specifically, the MSC doubling time ranged from 4.62 ± 1.85 days (P1) to 9.28 ± 2.71 days (P6) in patients and from 2.31 ± 0.87 days (P1) to 5.06 ± 1.03 days (P6) in controls. In accordance with the cell doubling time data were the results from MTT assay at a representative passage (P2). The number of live cells corresponding to the obtained optical density gradually increased over the 13-day culture period, however, remained significantly lower in MDS patients compared to controls (F = 69.3220, P < 0.001) corroborating further the defective proliferative potential of MSCs in MDS.
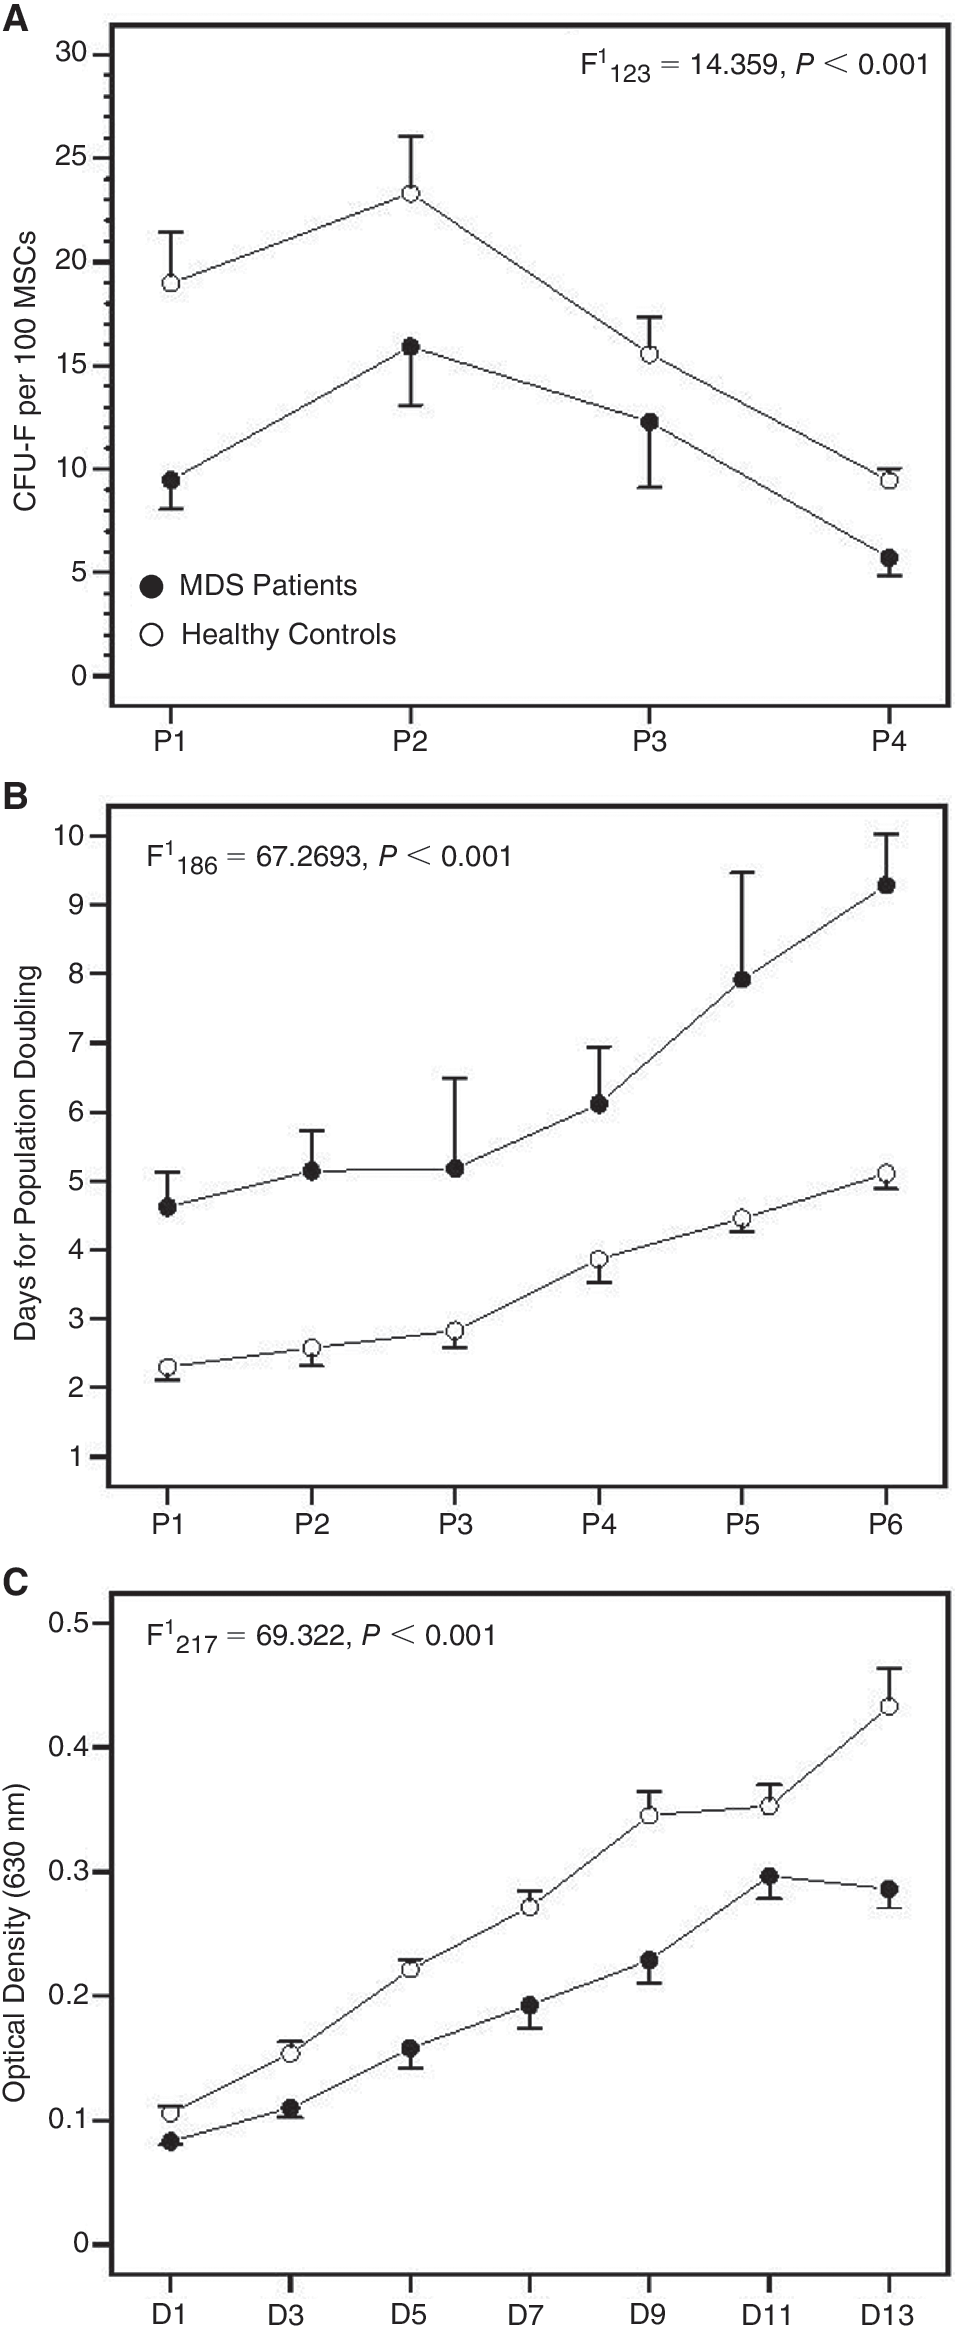
Clonogenic and proliferative potential of mesenchymal stem cells (MSCs) time course. (
Immunosuppressive properties of MSCs
To determine whether patient MSCs could efficiently inhibit T-cell proliferative responses, we mixed normal or patient MSCs with allogeneic normal T lymphocytes in the presence of PHA or IL-2 and we measured 3 H-TdR incorporation. As shown in Figure 4, a significant reduction was obtained in T-cell proliferation when cultures of purified T lymphocytes stimulated by PHA or IL-2 (3,377 ± 1,674 cpm and 16,934 ± 24,777 cpm, respectively) were performed in the presence of allogeneic normal MSCs (302 ± 99 cpm and 1,753 ± 1,734 cpm, respectively; P = 0.0034 and P = 0.0317, respectively). Similarly, T-cell proliferative responses to the above activators (21,608 ± 22,610 cpm and 56,211 ± 41,093 cpm, respectively) were significantly reduced in the presence of MSCs from MDS patients (657 ± 281 cpm and 10,561 ± 13,733 cpm, respectively; P = 0.0079 and P = 0.0463, respectively). The percentage of inhibition of PHA-induced or IL-2-induced T-cell proliferation by MSCs did not differ significantly between patients (90.59% ± 8.04% and 84.14% ± 10.68%) and controls (88.53% ± 6.45% and 82.39% ± 12.25%, respectively; P = 0.6905 and P = 1.0, respectively). Taken together these data suggest that MSCs from MDS patients display normal immunosuppressive properties in terms of the capacity to inhibit T-cell proliferation induced by mitogens.
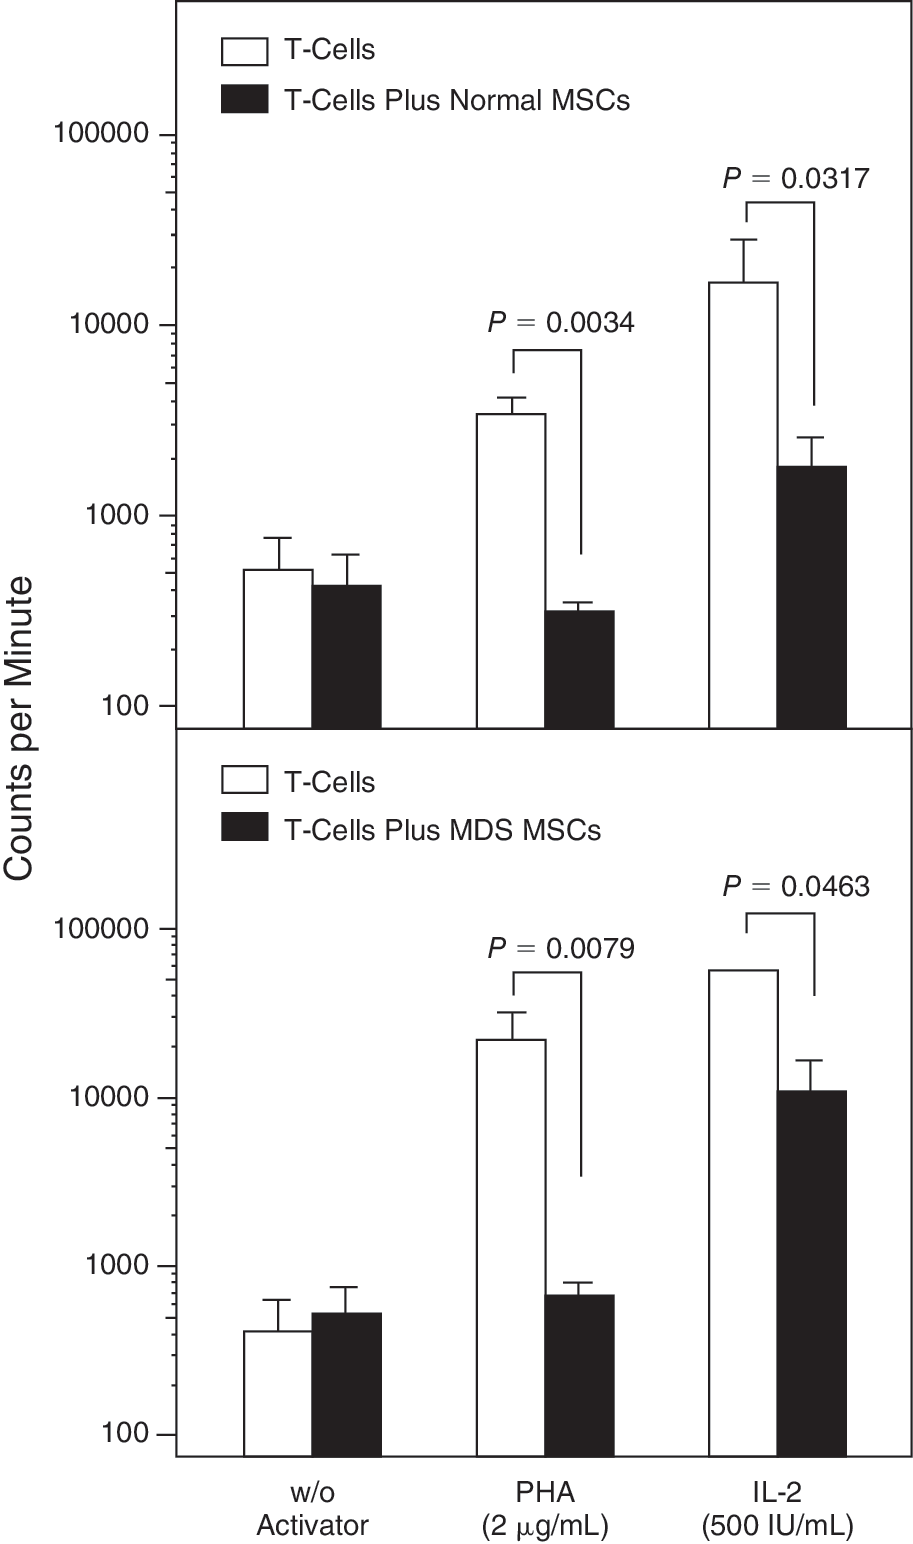
Inhibitory effect of mesenchymal stem cells (MSCs) on T-lymphocyte proliferation. The bars represent the proliferative responses (expressed in counts per minute upon 3H-TdR incorporation) of unstimulated and activator-induced T lymphocytes in the presence or absence of bone marrow (BM) MSCs from allogeneic normal (upper panel) or patient (lower panel) MSCs. Data are expressed as mean (±SEM) of triplicates of 5 separate experiments. Comparison of counts per minute in the presence or absence of MSCs was performed by means of the nonparametric Mann–Whitney test and the P values indicating the statistical significance are shown.
Cytokine production by MSCs
To investigate whether BM MSCs are the primary source of the proinflammatory cytokines known to be associated with the pathophysiology of MDS, we assessed TNF-α, IL-1β, and IL-6 levels in culture supernatants from P2, P4, and P6 (Table 2).No statistically significant difference was found between patients and controls in the levels of cytokines time course. Furthermore, the levels of the growth-promoting cytokines VEGF and SDF-1α during the P2–P6 culture period did not differ significantly between patients and controls (Table 2)suggesting that abnormal cytokine production by MSCs per se seems unlikely to be the cause of the impaired clonogenic and replicative capacity of MSCs in MDS.
Measurements have been performed by means of an enzyme-linked immunosorbent assay (ELISA).
Cytokine levels between MDS patients and healthy controls time course were performed by 2-way analysis of variance (ANOVA).
Abbreviations: IL, Interleukin; MDS, myelodysplastic syndromes; MSCs, mesenchymal stem cells; N.S. non-significant difference; P, passage; SDF-1α, stromal-derived factor-1α; TNF-α, tumor necrosis factor-α; VEGF, vascular endothelial growth factor.
Cytogenetic analysis of BM hematopoietic cells and MSCs
Cytogenetic analysis in MDS patients. Results from the cytogenetic analysis of patient BM hematopoietic cells and MSCs are shown in Table 1. In total, karyotype abnormalities were identified in BM hematopoietic cells in 8 out of 13 MDS patients. Specifically, 5 patients displayed interstitial deletion of the long arm of chromosome 5 [del(5q)] with an additional del(7q) subclone in 1 patient, 2 patients had trisomy 8 (+8), and 1 patient −Y. The chromosomal analysis of the corresponding MSCs did not show any of these abnormalities at P2–P8. The presence of del(5q) and trisomy 8 in hematopoietic cells and their absence in MSCs was verified by FISH analysis (data not shown). Interestingly, cultures of patient MSCs showed a clonal trisomy 5 in 3 cases and trisomy 7 in one case. Although the trisomy 5 was identified in only 1 out of 4 passages (P4 in one case and P6 in 2 cases) with classical cytogenetics, FISH analysis revealed the existence of the trisomy 5 in all passages analyzed (P2, P4, P6, P8; Table 3).Trisomy 7 was identified only in the only passage tested (P2) and was confirmed by FISH analysis. The absence of trisomies 5 and 7 in the corresponding hematopoietic cell cultures was confirmed by FISH analysis (data not shown).
Abbreviations: BM, Bone marrow; FISH, fluorescence in situ hybridization; MSCs, mesenchymal stem cells; ND, normal donor; No, number; Pt, patient.
Cytogenetic analysis of healthy subjects. As anticipated, chromosome analysis of BM hematopoietic cells from healthy individuals showed normal karyotype (Table 4).The chromosome analysis of the respective MSCs, however, showed a clonal trisomy 5 in one case at P2 (Fig. 5). Preexistence of trisomy 5 in BM hematopoietic cells of this subject was excluded by FISH.
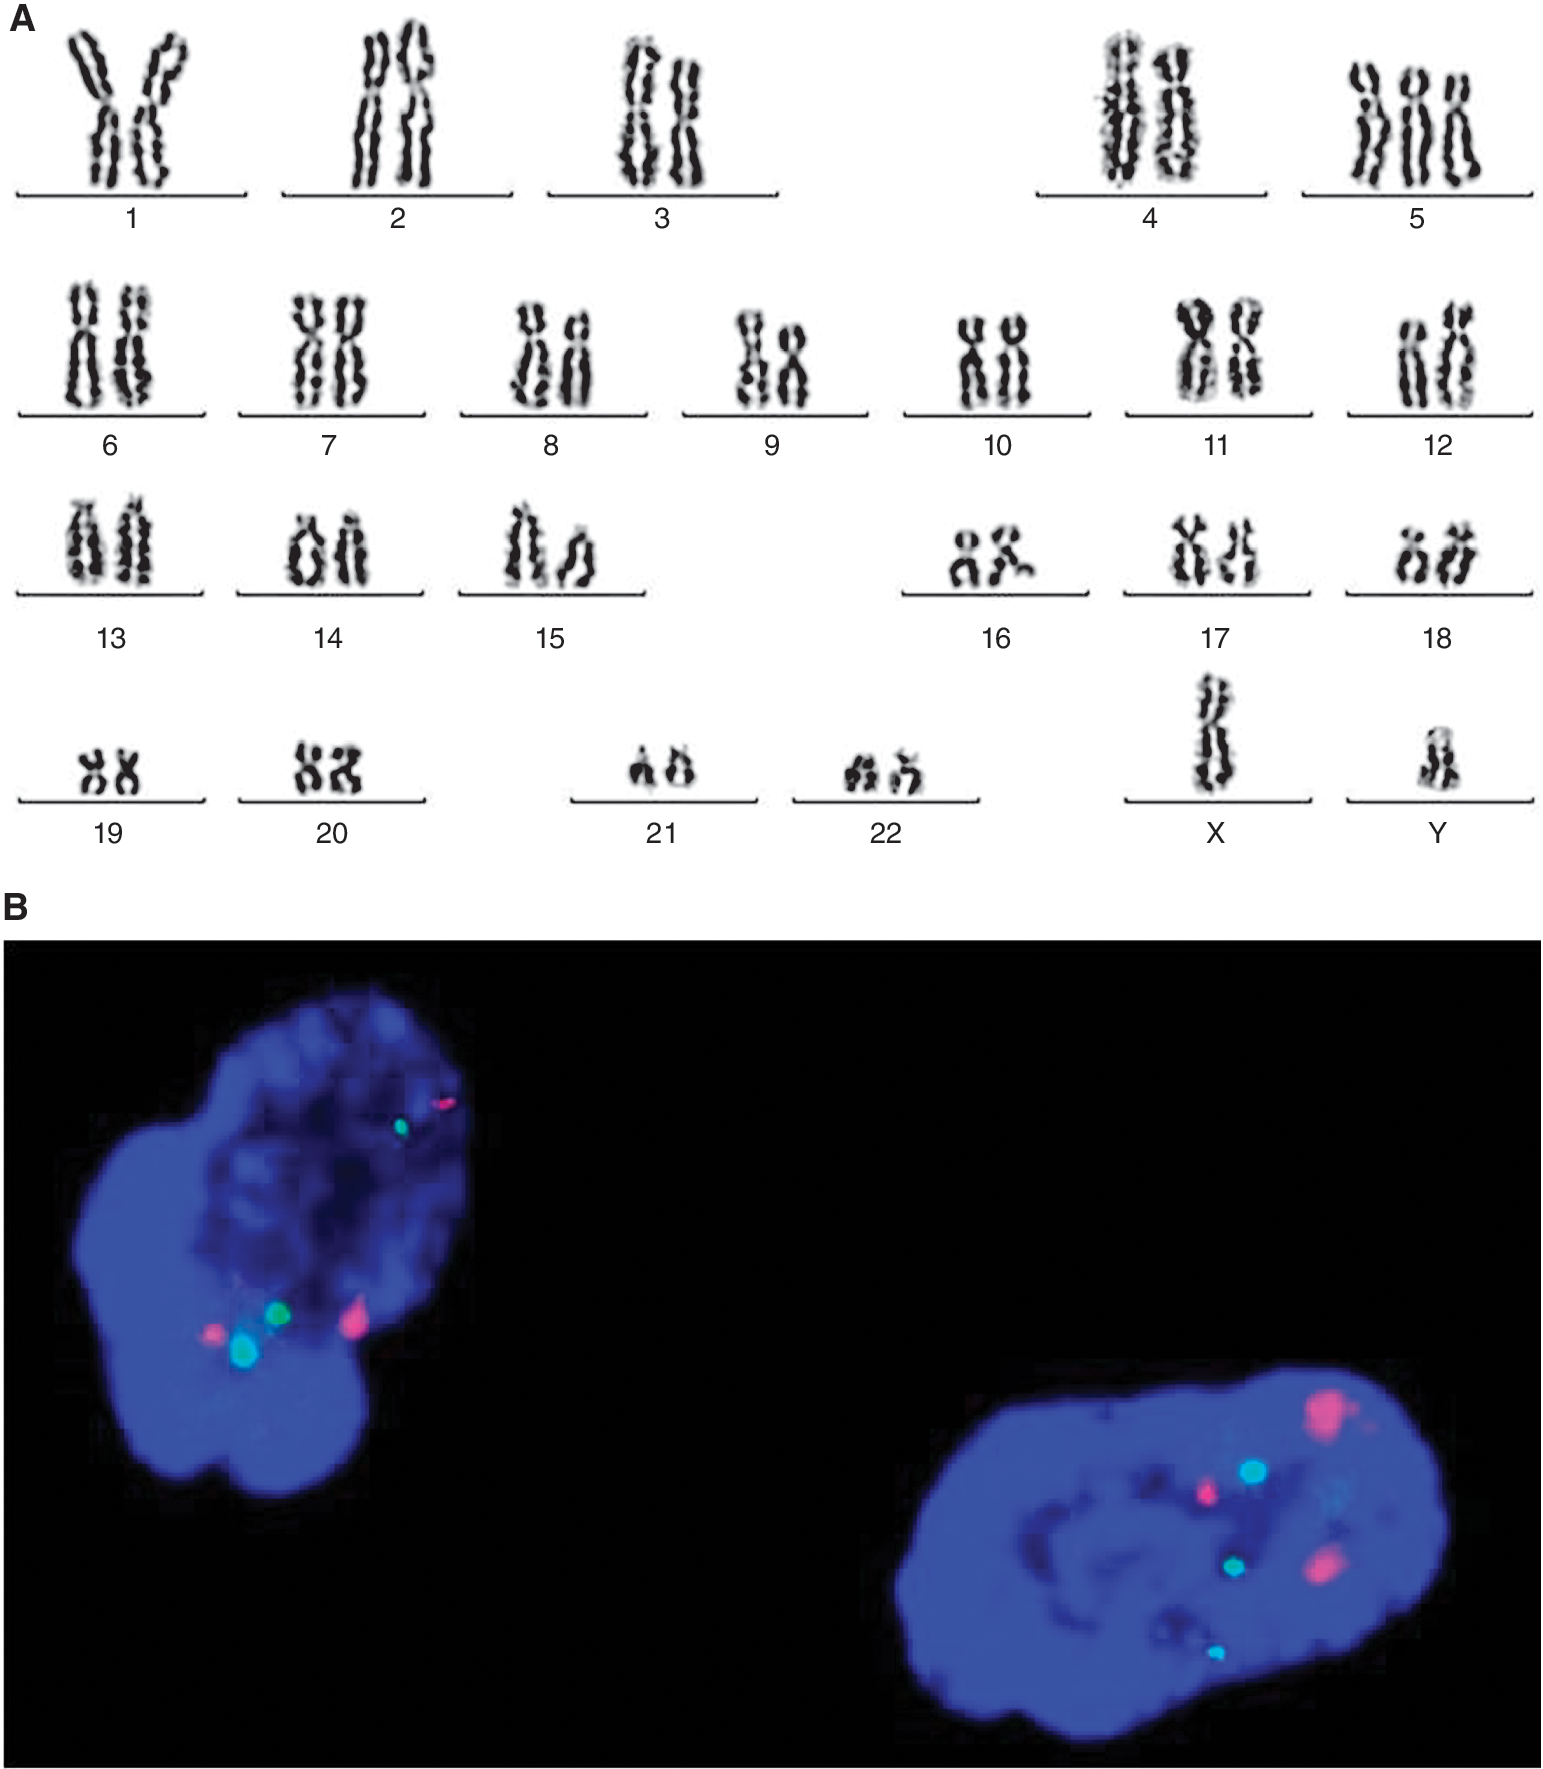
Cytogenetic analysis of mesenchymal stem cells (MSCs) derived from the normal donor-1 at P2. (
Abbreviations: BM, Bone marrow; MSCs, mesenchymal stem cells; ND, normal donor; No, number.
Because trisomies 5 and 7 were only identified in a small number of analyzed metaphases and in only 1 out of 4 passages in 4 patients and one control MSC cultures, while a FISH screening revealed the existence of trisomy 5 or 7 in interphase cells of all passages, an additional FISH screening with probes for chromosomes 5 and 7 was performed in all the remaining cases with normal MSC karyotype (healthy and patients MSCs) in all passages. No further cases with a masked trisomy 5 or 7 were identified. Taken together, these data show that although BM MSCs from MDS patients do not show the cytogenetic abnormalities present in BM hematopoietic cells, they may show irrelevant clonal abnormalities during passages. The pathophysiologic significance of this abnormality, however, is questionable because a similar abnormality was also identified in normal MSCs.
Discussion
The mechanisms leading to hematopoietic failure in patients with MDS are not entirely known; however, there is evidence suggesting that not only intrinsic abnormalities within the HSC compartment but also defective stromal support mechanisms may have a role [39]. In this study, we have evaluated the quantitative, functional, and cytogenetic characteristics of BM MSCs in patients with de novo MDS aiming to explore whether the BM stromal cells are primarily affected in these patients. The existing data on this field of research are limited and contradictory.
MSCs from all MDS patients studied were expanded successfully and were morphologically and immunophenotypically indistinguishable from the respective of the healthy controls. These observations are in agreement with data of Flores-Figueroa et al. also showing normal development and immunophenotypic characteristics of MDS-derived MSCs [21] whereas are in contrast with data of Lopez-Villar et al. suggesting that MDS MSCs occasionally fail to grow in vitro [26]. These inconsistencies might be attributed to the heterogeneity of MDS patients used in these studies in terms of WHO type and IPSS risk category. Despite the successful expansion of patient MSCs, we found that the rate of cellular growth through passages, assessed by the population doubling time, was significantly reduced in MDS patients compared to controls, suggesting defective proliferative capacity of MSCs. This finding was further substantiated by the MTT assay that also showed low rate of cell proliferation of MDS-derived MSCs in comparison to normal subjects as well as by the CFU-F clonogenic assay that revealed defective colony formation of patient MSCs through passages compared to normal MSCs. These abnormalities might represent a primary MSC defect or a premature cellular replicative exhaustion secondary to the long-term inflammatory process present in patients' BM. Similar abnormalities have been described in BM MSCs from patients with rheumatoid arthritis and have been attributed to shortened telomere length and cellular senescence associated with the inflammatory BM microenvironment [32].
Using a LDA, we found that the frequency of BM MSCs within the BMMC fraction was similar in patients and healthy controls suggesting normal reserves of MSCs in MDS BM. Regarding the MSC differentiation capacity, we showed that culture-expanded MSCs from the patients displayed normal osteogenic, chondrogenic, and adipogenic potential. Previous studies have suggested impaired chondrogenic or adipogenic potential of BM MSCs in MDS based mainly on the morphologic evaluation of immunohistochemically stained differentiated cells [25,26]. However, in our study we have evaluated the differentiation potential of MSCs based not only on the assessment of the morphological and cytochemical characteristics of cells upon differentiation but also on the quantification of differentiation-related specific gene mRNA expression. Normal differentiation potential of MDS-derived BM MSCs has been also proposed by others based on cytochemical findings [21].
MSCs normally display immunosuppressive properties and inhibit T-cell proliferation to alloantigens and mitogens [40]. Since aberrant immune responses and T-cell-mediated inhibition of hematopoiesis have been associated with the pathophysiology of MDS [10], we evaluated the capacity of BM MSCs from MDS patients to suppress T-cell immune responses in vitro. In contrast to previous reported data suggesting impaired immunosuppressive potential of MDS-derived BM MSCs [24,41], we found that patient MSCs sufficiently inhibited T-cell proliferation induced by mitogens. The discrepancy might be attributed to differences in the methodology. Our data suggest that BM MSCs is unlikely to have a major role in the aberrant T-cell responses occasionally seen in MDS patients. In accordance with this assumption was the normal production of TNF-α, IL-1β, and IL-6 by MSC stromal layers time course suggesting that the BM MSCs per se are not the main cellular source of these proinflammatory cytokines in patients' BM. Similarly, the levels of the growth-promoting cytokines VEGF and SDF-1α in patient MSC culture supernatants were within normal range time course.
The chromosome-banding analysis of BM hematopoietic cells revealed clonal abnormalities in 8 out of 13 MDS patients and, as expected, normal karyotype in 5 healthy controls studied. Chromosomal analysis of the corresponding MSC cultures showed karyotype abnormalities in 4 out of 13 MDS patients (trisomies 5 and 7) and in 1 out of 5 healthy individuals (trisomy 5) but different from those found in the BM hematopoietic cells. These data indicate that MSC cultures from MDS patients do not show the cytogenetic abnormalities present in the BM hematopoietic cells at diagnosis and, accordingly, they do not belong to the abnormal clone. Available data on the cytogenetic analysis of MSCs from MDS patients are controversial probably due to the methodology diversities. There are studies suggesting that MDS-derived MSCs do not harbor the cytogenetic aberrations present in the corresponding BM hematopoietic cells [20,42] and other showing clonal cytogenetic abnormalities [22,23,26]. Furthermore, different groups have shown a big variety in the kind of aberration reported, that is hypodiploidy, balanced translocations, whole chromosome gains, and deletions. Notably, most of the reported aberrations in BM MSCs are non-characteristic for MDS [43].
We have shown that patient MSC cultures displayed chromosomal stability until late passages. This finding is in accordance with results from other groups reporting normal karyotype until late MSC passages from patients with different hematologic disorders including MDS and healthy individuals [44,45]. The trisomy 5, found in MSC cultures from 3 MDS patients and one healthy control, has been described in acute lymphoblastic and myeloid leukemias as well as in neoplastic and non-neoplastic solid tumors [46 –50]. Trisomy 5 has also been reported as a probable nonrandom phenomenon in long-term cultures from solid tumor patients [51]. Because trisomy 5 was identified in both patient and normal MSC cultures and chromosome gains have already been described in cell cultures of normal tissues [52,53], we assume that the abnormality probably represents a nonrandom in vitro phenomenon with presently unknown significance. Trisomy 7, found in MSC cultures from one MDS patient, has not been described in hematologic malignancies [54,55] but it is a common finding in malignant and non-malignant tissues [56 –58]. It has been suggested, however, that trisomy 7 accumulates with age and may be associated with age progression rather than with a disease state [56]. Accordingly, the pathophysiologic significance of this abnormality in patient's MSC cultures remains uncertain.
In conclusion, data from this study show that BM MSCs from patients with de novo MDS are normal in regards to the number, the differentiation potential, and immunosuppressive properties. Patient MSCs do not show any aberrations in the production of proinflammatory or growth-promoting cytokines and do not harbor the cytogenetic abnormalities present in hematopoietic cells. Patient MSC cultures display chromosomal stability time course, however, they may develop irrelevant chromosomal alterations with unknown pathophysiologic significance as they may also occur in MSC cultures from normal individuals. Finally, MDS-derived MSCs display impaired proliferative and clonogenic potential probably associated with the chronic inflammatory process present in patients' BM. Overall, our data suggest that BM MSCs from MDS patients do not belong to the abnormal clone and do not display major quantitative and functional abnormalities. The underlying mechanism for the impaired proliferative/clonogenic potential and the pathophysiologic significance of the subtle chromosomal alteration occurred during culture is an interesting field for further investigation.
Footnotes
Acknowledgments
The authors wish to thank Mrs. Helen Koutala, Mrs. Claudia Gemetzi, and Mrs. Athina Damianaki for their valuable technical assistance. This work was supported by a grant from the Hellenic General Secretary of Research and Technology (PENED 2003 03ED072).
Author Disclosure Statement
The authors declare no conflict of interest.