
Abstract
Non-tumorous liver tissue removed during surgery to resect hepatocellular carcinoma (HCC) is potentially a useful source of material from which cells, particularly liver progenitor/stem cells (LPCs), can be isolated to establish cell lines. The purpose of this study was to evaluate the applicability of the “plate-and-wait” method to derive LPCs from resections to remove HCC. Three independent non-tumorous liver samples from HCC resection and 3 samples from liver donors were used for LPC isolation. Staining for LPC markers, OV6, CK19, and EpCAM, in the above liver samples demonstrated staining in only 2 of the non-tumorous samples. We isolated 2 human liver epithelial cell lines (HLECs) from these 2 samples. These HLECs were positive for general stem cell markers CD133, EpCAM, and Oct4. They expressed the liver progenitor cell markers OV6, CK14, and M2PK but not CK19. They also expressed the hepatocellular markers albumin, CK8, CK18, HNF4-α, and the drug-metabolizing gene CYP3A4. These cells accumulated glycogen, indocyanine green, and synthesized urea. They produced colonies in soft agar that showed anchorage-independent growth and their tumorigenic status was confirmed when they produced tumors following transfer to athymic nude mice. In contrast, the third non-tumorous tissue and 3 normal liver samples did not produce cell lines. This study establishes a correlation between the presence of LPCs in the source liver tissue and the ability to derive cell lines from these tissues. The phenotypic similarities between the LPCs and the HLECs suggest that a precursor-product relationship may exist between the 2 cell types.
Introduction
T
Several attempts have been made to isolate LPCs from diseased adult human liver [1 –6]. To date, only one liver progenitor cell line has been established from a cirrhotic liver cancer patient following chronic HCV infection [4]. This cell line progressively exhibited polarized and functional hepatocytes and bile duct-like cell features under defined culture conditions. Other studies report the establishment of cell cultures from human liver; however, it is not known whether cell lines were subsequently derived. Selden et al. [5] isolated epithelial cell colonies from explanted human liver from a patient with subacute liver failure. These cells exhibited hepatocyte, biliary epithelial, and stem cell markers and secreted albumin and α-1-antitrypsin. Crosby et al. [1] isolated human progenitor cells that differentiated only into cells with the phenotype of biliary epithelial or endothelial cells, as evidenced by expression of CK19 and CD31, but were negative for albumin. In contrast, Herrera et al. [3] isolated a liver stem cell population that expressed albumin and α-fetoprotein; however, these cells were negative for CK19. In vitro, these cells could be differentiated into mature hepatocytes. Recently, Duret et al. [2] isolated an epithelial cell population that did not express the classic set of stem cell/progenitor markers, but they could differentiate into hepatocyte-like cells. Weiss et al. [6] purified a cell population from adult liver with histological signs of regeneration as evidenced by Thy-1-positive cells. These were able to differentiate into hepatocytes in vitro and in vivo. In the current study, we evaluated the suitability of liver samples obtained from donor liver for orthotopic transplantation as well as from patients undergoing resection for hepatocellular carcinoma (HCC) as sources of LPCs. Using the “plate-and-wait” method described by Strick-Marchand et al. [7], which we have successfully applied to mouse liver [8 –11], we established 2 cell lines from 3 non-tumorous liver tissue obtained from HCC patients. The cell lines expressed markers of stem cells as well as LPCs and some markers indicative of hepatocytes, but not cholangiocytes. However, these cell lines are tumorigenic; nevertheless, they are highly functional and may be useful for specific therapeutic applications.
Materials and Methods
Liver samples
The use of human liver samples and animal for scientific research has been approved by the Human and Animal Ethics Committees of The University of Western Australia, Sir Charles Gairdner Hospital and Fremantle Hospital, Western Australia. Care of animals was in accordance with institutional guidelines. Liver tissue samples were taken from 3 patients undergoing liver surgery for resection of HCC. The samples were (i) non-tumorous tissue approximately 4–5 cm from the HCC (NTT1, NTT2, and NTT3); (ii) tissue from an alternate lobe to that which contained the HCC (ALT2 and ALT3); and (iii) tumor tissue. Three liver tissue samples were obtained from donor livers prior to orthotopic transplantation and were termed normal tissue. Liver tissue was cut into blocks of ∼0.5 cm3 and some used for cell isolation. The remainder was frozen for either RNA extraction or subsequent immunohistochemical staining.
Immunohistochemistry
Immunohistochemistry was performed on serial frozen sections (10 μm) using monoclonal antibodies against cytokeratin (CK) 19 (Serotec, Raleigh, NC), OV6 (R&D, Minneapolis, MN), and epithelial cell adhesion molecule (EpCAM, Abcam, Cambridge, UK). These antibodies stain LPCs in human liver tissue [12,13]. The frozen sections were air-dried and fixed in methanol/acetone or paraformaldehyde. After blocking for non-specific binding and intrinsic peroxidase activity, the sections were incubated with a primary monoclonal antibody overnight at 4°C. After washes, the sections were incubated with the secondary antibody (peroxidase-labeled; Bio-Rad, Hercules, CA) for 60 min. The staining reaction was developed with DAB substrate (DAKO, Glostrup, Denmark). Controls omitted either the first or the second antibody.
Cell isolation
The non-parenchymal cell population was isolated using the “plate-and-wait” method described by Strick-Marchand et al. [7]. In brief, 0.5-cm3 cubes of liver were chopped into fine pieces using a scalpel and treated with collagenase H (Invitrogen, Carlsbad, CA) at a concentration of 0.6 mg/mL for 20 min at 37°C. The collagenase H was discarded and the contents were dispersed in an Elvehjem Potter homogenizer in Williams' E medium (Sigma-Aldrich, St. Louis, MO) supplemented with 10% fetal bovine serum (FBS), 20 ng/mL epidermal growth factor, 30 ng/mL insulin-like growth factor II, 10 μg/mL insulin, streptomycin, penicillin, and fungizone. This medium is referred to hereafter as growth medium. The cells were pelleted by centrifugation (1,000g for 5 min) and 5 × 10⁶ cells were inoculated into 60-mm Petri dishes coated with collagen I and cultured in a humidified atmosphere with 5% CO2 at 37°C. The growth medium was replaced on every second day. By repeated differential trypsinization and subculture, fibroblasts were gradually eliminated. Epithelial cell lines were established from dislodged colonies, and cultured in a fresh flask. Cells were dissociated with trypsin-EDTA and passaged every 3 days. Tissue samples from 2 HCC patients (NTT1 and NTT2) but not a third sample (NTT3) produced cells lines that were termed HLEC1 and HLEC2, respectively. They were maintained in medium supplemented with 5% FBS and unless stated otherwise cells between passages 8 and 16 were used. Their growth characteristics were determined using the Cellscreen System [14].
Karyotyping of the HLEC cultures
The cells were exposed to Colcemid solution (Invitrogen, Carlsbad, CA) for 12 h, lysed in 75 mM potassium chloride for 15 min, followed by fixation in methanol and glacial acetic acid (3:1 v/v) for 20 min at 4°C. Metaphases were prepared on glass slides and stained with Giemsa according to standard procedures. Karyotyping the HLEC cultures was achieved by the application of first principles of cytogenetic identification due to the massive alterations observed in these cell lines. Referral to the International System for Human Cytogenetic Nomenclature (ISCN) 2005 [15] could not be utilized as virtually no chromosomes were clearly identified as normal human. Chromosomes were arranged according to like structure and size, then assembled from largest to smallest, with the sex chromosomes placed at the bottom right of the karyotype.
Immunofluorescence analysis
Cultured cells were fixed with methanol/acetone (1:1 v/v) or 2% paraformaldehyde, and blocked with 5% goat serum in phosphate-buffered saline (PBS) for 30 min. Samples were incubated with primary antibodies overnight at 4°C in a humidified chamber. After washes with PBS, samples were incubated with the secondary antibodies goat Alexa Fluor® 594 or goat Alexa Fluor® 488 (Invitrogen, Carlsbad, CA) in darkness for 1 h at room temperature. After washes, cells were mounted with ProLong® Gold antifade reagent with DAPI (Invitrogen). Huh7 cells and a fibroblast cell line were used as positive and negative controls, respectively. Negative controls that omitted the primary or secondary antibodies were also incorporated in all experiments.
RNA analysis
Total RNA was extracted using Trizol (Invitrogen, Carlsbad, CA) and reverse transcription (RT) was performed with 2 μg of total RNA with random hexamers and Thermoscript RT-PCR Systems (Invitrogen) according to the manufacturer's protocols. PCR conditions were 95°C for 5 min; 95°C for 30 s, annealing temperature for 30 s, and 72°C for 30 s, for 30 to 35 cycles; 72°C for 10 min. DNA fragments were resolved on 2% agarose gels. Forward and reverse primers used for specific amplification of CYP3A4 and CK19 were: tgggatgttcattcccaaa, tgtccttgttcttcttgctgaa, and gccactactacacgaccatcc, caaacttggttcggaagtcat, respectively.
Periodic acid Schiff staining for glycogen
HLECs were fixed with 4% paraformaldehyde for 15 min at room temperature and stained according to the manufacturer's instructions (Sigma-Aldrich, St. Louis, MO). HepG2 cells and a human fibroblast cell line served as positive and negative controls, respectively.
Cellular uptake and removal of indocyanine green
Indocyanine green (ICG) is an organic anion that is specifically taken up and eliminated by cultured hepatocytes [16]. To assess its uptake, 1 mg/mL of ICG (Sigma-Aldrich, St. Louis, MO) in growth medium was added to cell cultures. Following incubation at 37°C for 15 min, cells were rinsed 3 times with PBS and uptake of ICG was determined according to a previously described method [16]. To assess elimination, fresh medium was added and cultures re-examined 6 h later. HepG2 cells and a human fibroblast cell line served as positive and negative controls, respectively.
Urea production
Urea concentrations were determined by colorimetric assay (Roche Diagnostics, Indianapolis, IN). The quantity of urea produced was determined by harvesting medium supplied 24 h earlier to confluent cultures in 12-well plates. Cell numbers were determined by MTT assay. The hepatoma cell line HepG2 that has been reported to produce urea [17] was used as a positive control, and a human fibroblast cell line was used as a negative control. Fresh growth medium was used as a blank.
In vitro differentiation
In vitro differentiation was initiated by 2 methods. One is to culture in differentiation medium that induces LPC differentiation toward hepatocytes [8]. The second is to culture in Matrigel that promotes LPC differentiation toward cholangiocytes [7].
Growing epithelial cell colonies were allowed to reach confluence in growth medium and then exposed to differentiation medium. Medium was changed every 3 days. RNA was extracted 7 and 14 days after exposure to differentiation medium. Expression of CPY3A4 of HLEC1 and HLEC2 was assessed by RT-PCR and compared with cells cultured in growth medium.
One milliliter of Matrigel (BD Biosciences, San Jose, CA) was suspended in 50 mL growth medium and frozen at −20°C overnight and then thawed at 4°C overnight to obtain a homogeneous 2% Matrigel medium. Cloned epithelial cells (5 × 10⁵) were suspended in 3 mL of 2% Matrigel medium and plated onto 60-mm dishes. Expression of CK19 in HLEC1 and HLEC2 was assessed in RNA extracted after 7 and 14 days culture and compared with cells before being cultured in Matrigel.
Soft agar and nude mouse tumorigenicity assays
Approximately 1 × 10⁴ and 1 × 10⁵ HLECs (p12–14) in 1.5 mL of 0.4% agar were plated over the solidified 0.8% agar layer. Cells were incubated in a humidified atmosphere with 5% CO2 at 37°C and growth medium was added weekly to prevent drying. Anchorage-independent growth was assessed daily. For nude mouse assays, cells were grown to confluence in 35-mm diameter dishes (approximately 2 × 10⁶ cells), washed with balanced salt solution, and harvested using a cell scraper. Cells were centrifuged (1,000g) and pellets were injected subcutaneously into BALB/c nude (nu/nu) mice (n = 2) that were 5 weeks old. Animals were examined daily for the formation of tumor until the experiment was terminated after 5 weeks. Tumors obtained were fixed in Carnoy's solution (60% ethanol, 30% chloroform, 10% acetic acid) for histology or snap-frozen for immunofluorescent staining as described above. Both assays were performed using tumorigenic PIL2 cells [10] as positive controls.
Results
Liver progenitor cells are present in human liver samples
Typical ductular reactions were observed in the specimens NTT1 and NTT2. All the neoductular structures in the portal triads of NTT1 and NTT2 contained cells that co-stained for CK19/OV6 (Fig. 1A and 1B). Many cells co-stained for CK19/EpCAM, or CK19/OV6 and therefore deemed to be LPCs. They were found scattered throughout the NTT1 and NTT2 samples (Fig. 1C–1F). In contrast, only a few cells positive for both CK19 and OV6 were observed in the portal tract regions of NTT3. There was no evidence of positive staining for both CK19 and OV6 in the surrounding parenchyma (Fig. 1G and 1H). A similar staining pattern was observed in ALT2 and ALT3 (Fig. 1I–1L). In normal liver derived from organ donors, the bile ducts contained cells that co-stained for CK19/OV6, and CK19/EpCAM. No double-stained cells for these LPC markers were present in the parenchyma (Fig. 1M and 1N).
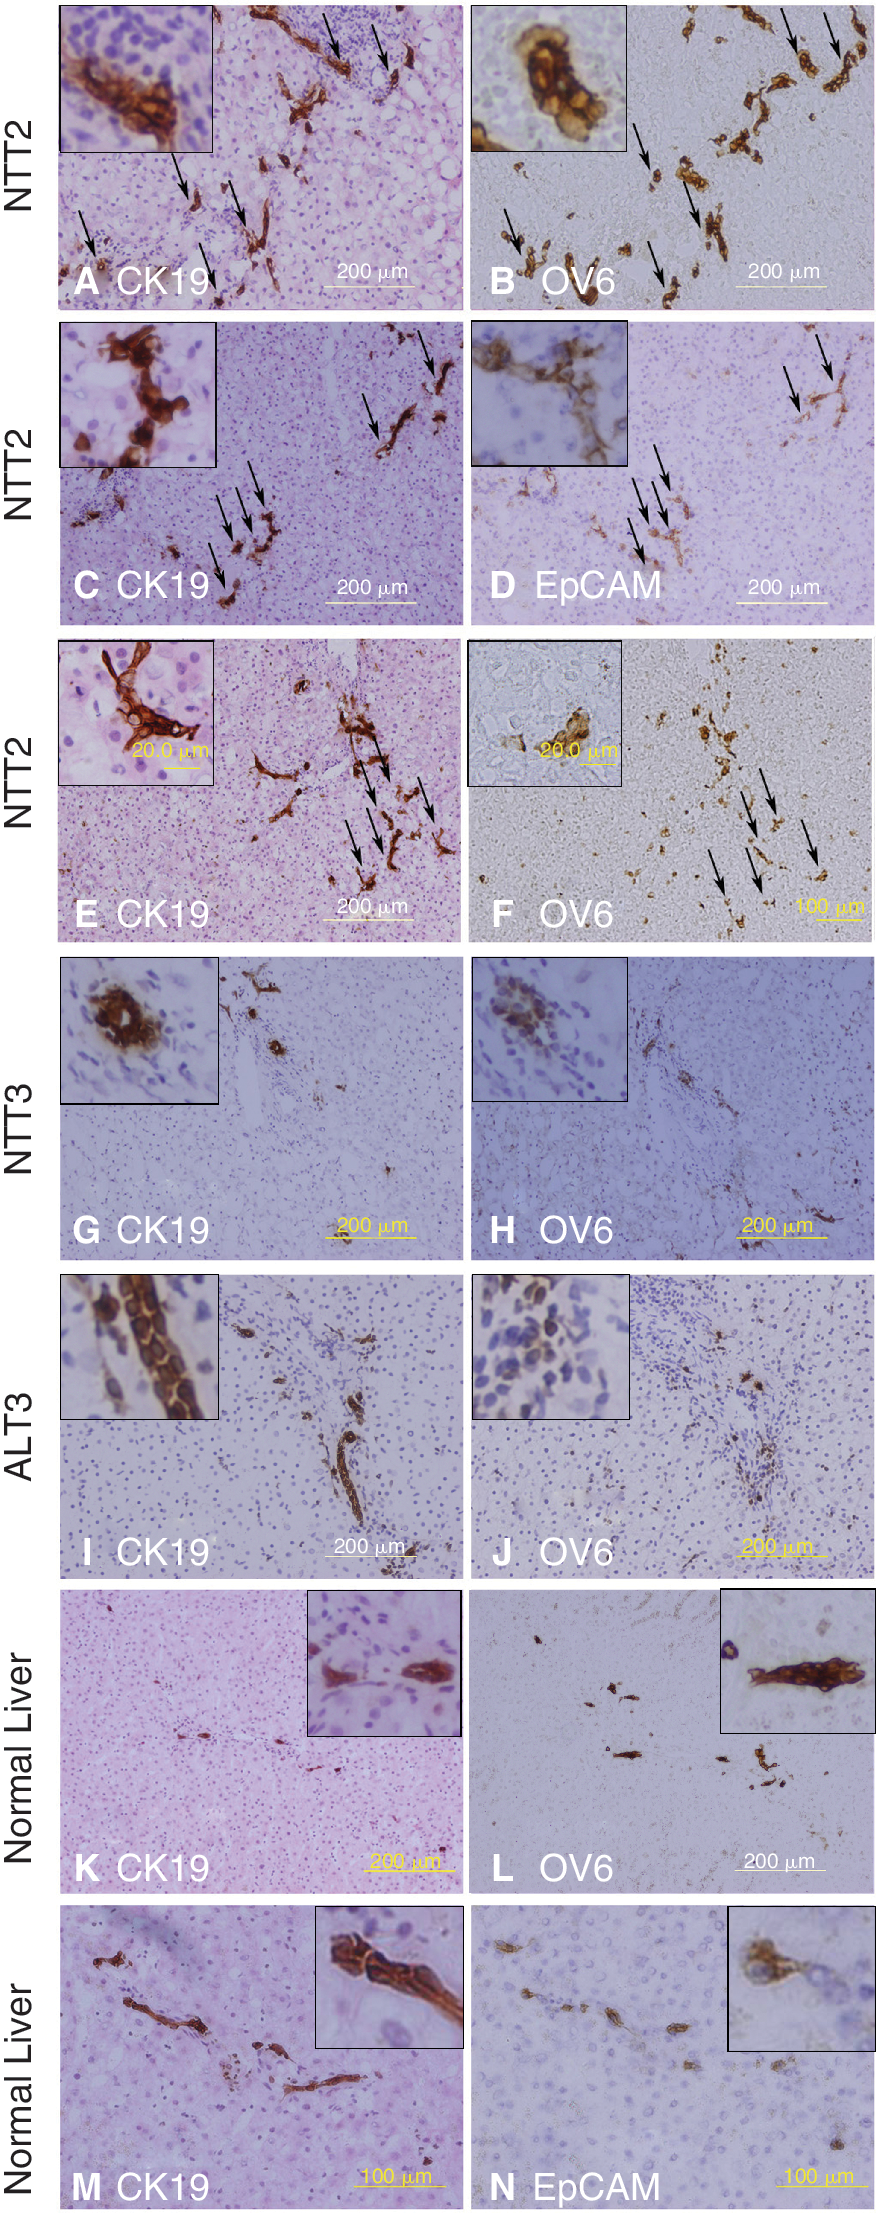
Immunohistochemical staining of human liver sections. Typical ductular reactions were present in NTT2. The neoductular structures contained cells that co-stained for CK19/OV6 (arrows) (CK19 (
Primary isolation and expansion of epithelial cells
Four different sources of liver tissue samples were used to isolate LPCs. From a total of 3 non-tumorous liver tissue samples (NTT1-3) only 2 cell lines (HLEC1 from NTT1 and HLEC2 from NTT2) were isolated. Only one sample of liver tissue of suitable size was available from the alternative lobe (ALT3) for LPC isolation but failed to produce a cell line. Primary cultures derived from the 3 donor livers did not contain adherent epithelial colonies after 72–96 h. All cells in the primary culture from these 3 donor livers senesced after 3 months in culture. Similarly cultures established from the 3 samples of HCC tissue failed to generate epithelial cell lines.
In primary cultures derived from the liver samples NTT1 and NTT2, initial adherent clones appeared 72–96 h after establishment. After 2 or 3 weeks, these colonies expanded and formed a confluent monolayer of cells. The morphology of the primary cultures was heterogeneous (Fig. 2A). By repeated subculture and selection for epithelial colonies, fibroblasts were eventually eliminated. HLECs appeared palmate at low density (Fig. 2B), and assumed a cobblestone arrangement of cells with a high nuclear-to-cytoplasm ratio at high density (Fig. 2C). HLECs exhibited an average doubling time of 25.6 h for HLEC1 and 26.4 h for HLEC2 (Fig. 2D).
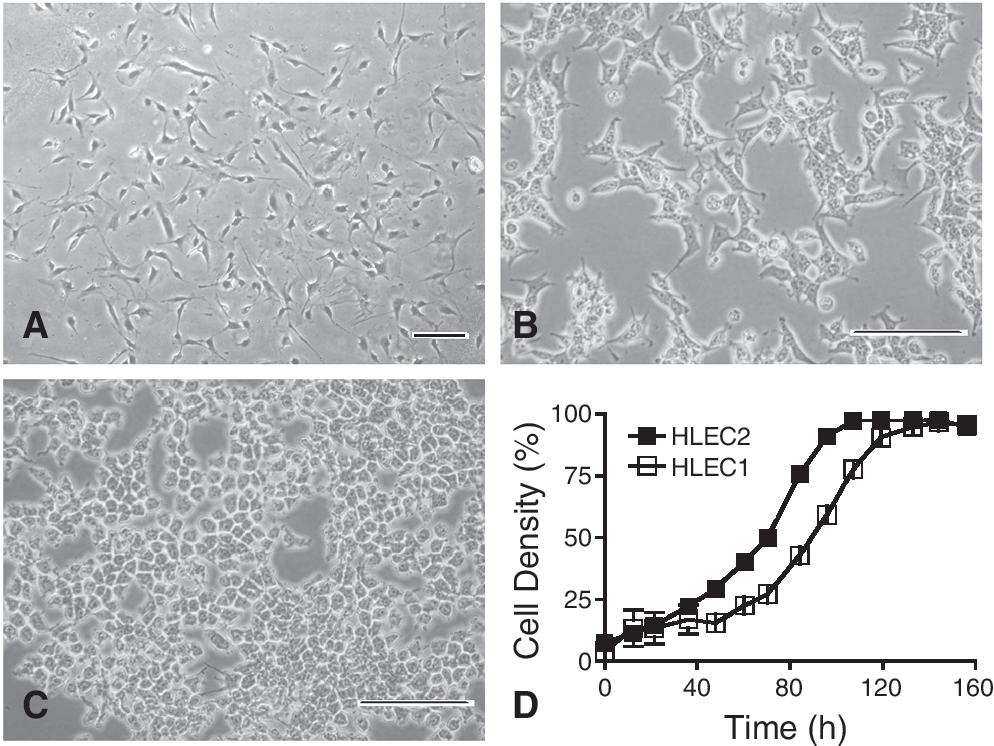
Morphological characterization and growth properties of human liver epithelial cell lines (HLECs). Primary cultures from NTT1 and NTT2 tissue are heterogeneous (
HLECs were passaged >30 times over 6 months. Cytogenetic analyses showed that their karyotypes rapidly altered from metaphase to metaphase as they were passaged. The karyotype differences between early and late passage cultures suggest that the cells possessed chromosome instability (Fig. 3). A representative cell from each passage has been karyotyped to demonstrate evolution of the cell line through in vitro culture. HLEC1 and HLEC2 were similar to one another, while not being identical. The changes that occurred in both samples included additions and losses of whole chromosomes and derivative chromosomes. Some structural alterations were also identified (C3 in Fig. 3B; C5 in Fig. 3D). Table 1 summarizes the karyotypic changes observed in HLEC1 and HLEC2 when early and late passages are compared. The homogeneously staining region observed in the left-hand side chromosome labeled C5 in Figure 3A, 3B, and 3D is considered by cytogeneticists to represent tumorogenicity in oncology tissue culture and karyotyping.

Representative karyotypes of HLECS. HLEC1 p11 (
Abbreviation: Chr, chromosome.
Phenotype of HLECs
HLEC1 and HLEC2 displayed the same pattern and expression of markers tested and therefore, only the staining pattern of HLEC2 is shown (Fig. 4). HLECs expressed the general stem cell markers CD133 (Fig. 4A), EpCAM (Fig. 4B), and Oct4 (Fig. 4C). HLECs expressed highly the LPC markers OV6 (Fig. 4D), CK14 (Fig. 4E), and pyruvate kinase M2 (M2PK) (Fig. 4F). They did not stain positively for the LPC/cholangiocyte marker CK19 (data not shown). The HLECs also expressed hepatocyte markers CK8 (Fig. 4G), CK18 (Fig. 4H), albumin (Fig. 4I), and hepatocyte nuclear factor 4-α (HNF4-α) (Fig. 4J). Human fibroblasts, used as a negative control, did not stain for any of these markers (data not shown). Huh7 cells were used as a positive control for OV6, CK19, CK18, Oct4, M2PK, and HNF4-α and were positive for all of these markers (data not shown).
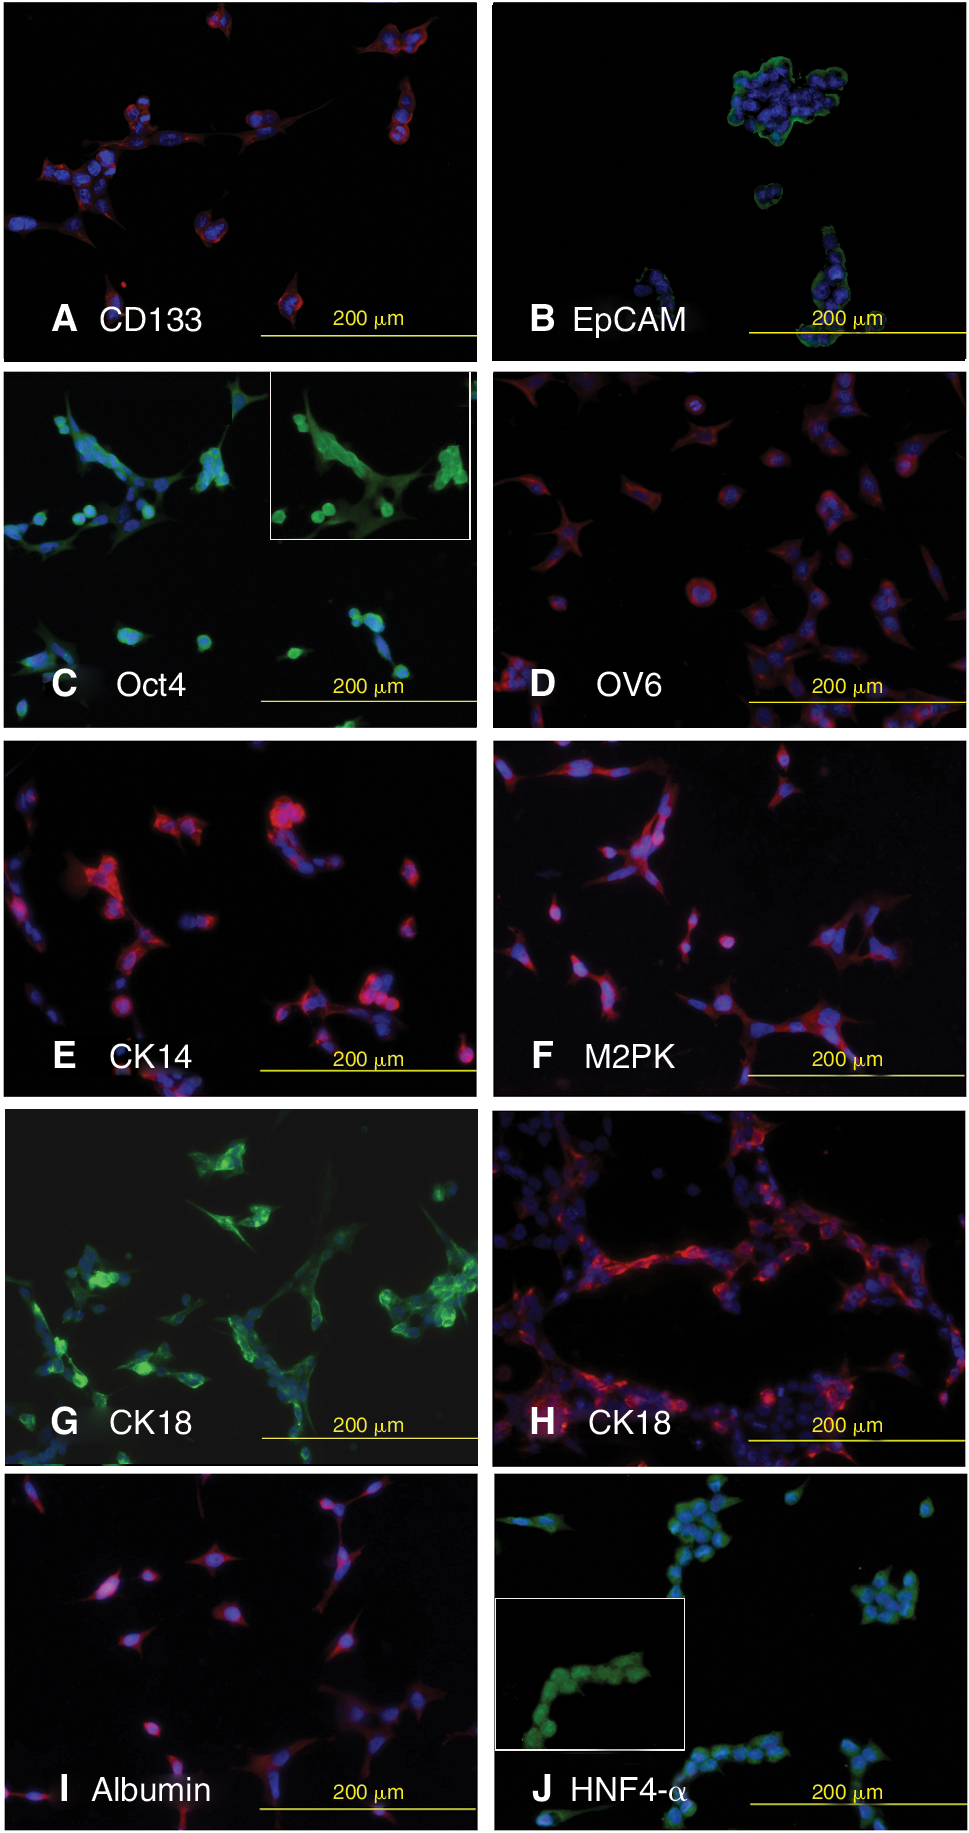
Immunofluorescent labeling shows HLEC2 express the general stem cell markers CD133 (
HLECs possess hepatocyte functions
Both HLECs expressed CYP3A4 (Fig. 5A). HLEC1 and HLEC2 secreted 207 fmol and 279 fmol of urea/cell/day, respectively, compared to 541 fmol of urea/cell/day by HepG2 cells (Fig. 5B). The quantity of urea in the medium harvested from the fibroblast cultures was below the threshold sensitivity of the assay.

HLECs exhibit features of hepatocytes. RT-PCR demonstrates CYP3A4 gene expression in HLEC1 and HLEC2 (
HLEC2 stained positively with periodic acid Schiff (PAS) (Fig. 5C). HLEC2 demonstrated uptake of ICG (Fig. 5D) and eliminated the internalized ICG after 6 h (Fig. 5E). These properties were also displayed by HLEC1 (data not shown). HepG2 cells showed similar properties to HLEC1 and HLEC2, but not the human fibroblast cell line (data not shown).
In vitro differentiation conditions do not increase expression of CYP3A4 nor induce expression of CK19
Exposure to differentiation medium for 7 and 14 days did not increase expression of the hepatocytic marker CPY3A4. In Matrigel, HLEC1 and HLEC2 both formed a web-like structure throughout the dish (data not shown). Two to three days later, these became organized and developed into doughnut-like structures similar to bile duct units that have been described by Strick-Marchand et al. [7]. CK19 was not detected in HLEC1 and HLEC2 by RT-PCR when these cell lines were maintained in growth medium. CK19 expression remained negative after 7 and 14 days of establishment. These findings were supported by immunofluorescence analysis (data not shown).
HLECs are tumorigenic
Both HLEC1 (data not shown) and HLEC2 (Fig. 6A) proliferated rapidly and formed large anchorage-independent colonies in soft agar after 2 weeks, similar to FRL-19 cells that served as positive controls. Subcutaneous injection of either HLEC1 or HLEC2 cells into athymic nude mice led to tumor formation within 3 weeks (Fig. 6B), similar to the tumorigenic PIL2 cell line. There was no apparent difference in the rate of growth of HLEC1 and HLEC2. The maximum tumor growth allowable by our animal ethics protocol of 1 cm in diameter was obtained on day 26 for mice injected with either HLEC1 or HLEC2. Tumors arising from HLECs were similar to the original cells injected into the mice with regard to morphology and phenotype, being small with scant cytoplasm (Fig. 6C) and exhibiting positive staining for CD133 (Fig. 6D) and EpCAM (Fig. 6E).
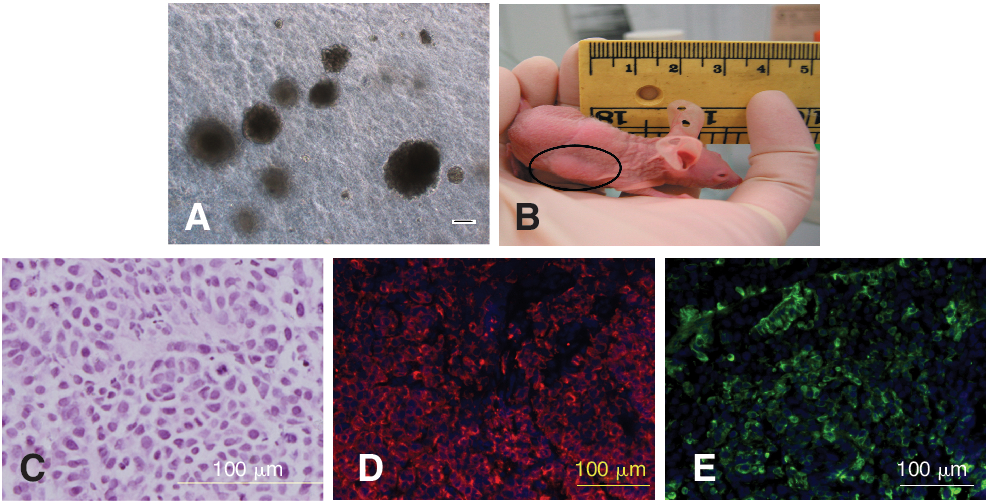
HLECs are tumorigenic. HLECs form anchorage-independent colonies in soft agar (
Discussion
Liver tissue adjacent to HCC is a ready source of material from which liver cells can be isolated and maintained in culture. In the current study, we show that the “plate-and-wait” procedure described by Strick-Marchand et al. [7] which in our hands reproducibly generates LPC lines from mice [8 –11], and readily produces epithelial cell lines from primary cultures established from non-tumorous human liver tissue that harbors LPCs. However, a cell line could not be established from a third non-tumorous liver tissue that did not show LPCs. One liver tissue sample taken from an alternate lobe to that which contained the HCC as well as 3 independent samples taken from donor livers prior to orthotopic liver transplantation, all of which did not display LPCs, also failed to generate epithelial cell lines. Thus, there is a correlation between the presence of LPCs and the ability to generate epithelial cell lines from HCC resection specimens.
Both HLEC lines that were established displayed some characteristics of stem cells as they expressed CD133, Oct4, and EpCAM and the LPC markers OV6, M2PK, and CK14. When maintained in growth medium, both cell lines express albumin, HNF4-α, and CPY3A4, and possess the ability to synthesize urea, store glycogen, and take up and release ICG. However, expression of CK19 was not detected. Following culture under differentiation conditions, there is no increase in expression of hepatocytic marker CPY3A4, nor is there induced expression of CK19. Therefore, HLECs display a hepatocytic phenotype with functionality to match. We conclude that HLECs must have progressed some way along the hepatocyte lineage, and in this regard, they more closely resemble hepatoblasts with which they share the common feature of expressing EpCAM [18]. We are unable to say whether they attained this state in vivo, or in vitro.
This study shows that the “plate-and-wait” method readily produced HLEC lines from non-tumorous liver tissue that contained LPCs, as evidenced by immunohistochemical staining with a variety of established LPC markers. The HLECs were also positive for CD133 that numerous studies suggest is a marker of liver cancer stem cells [19 –21]. In contrast, cell lines were not produced from the liver tissue adjacent to HCC in which immunohistochemical staining suggests there were no LPCs. Normal liver donor tissue prior to orthotopic liver transplantation were also not able to generate LPC cell lines and accordingly these did not harbor LPCs. Unexpectedly, we were unable to establish cell lines from the respective HCCs, whereas surrounding non-tumorous tissue produced HLEC1 and HLEC2. This suggests that LPCs capable of producing cell lines were not present in the HCC or they could not be selected for by the “plate-and-wait” method. Two tissue samples from an alternate lobe to that containing HCC did not exhibit LPCs in the parenchyma. Although one sample was too small to attempt establishment of a primary culture, the second was sufficiently large to do this, and failed to generate a cell line. We conclude that tissue adjacent to some HCCs harbors LPCs that are potentially tumorigenic, which can be used to generate HLECs using the “plate-and-wait” method. They may be cancer stem cells of the liver and may have migrated from the primary tumor, or they might have preceded the tumor. We are currently unable to distinguish between these possibilities. Such HLECs display extensive chromosomal alterations with increasing passage. While their tumorigenicity restricts their use in some therapeutic applications, their rapid proliferation and functional capacity in regard to drug metabolism and urea synthesis suggests that these robust and rapidly growing cells may nevertheless be useful in some therapeutic applications, such as bioreactors and other external liver assist devices for treating liver disease patients.
Footnotes
Acknowledgments
This study was supported by National Health and Medical Research Council of Australia and The Cancer Council of Western Australia. John K. Olynyk is the recipient of a Practitioner Fellowship from the National Health and Medical Research Council of Australia. Aibin Zhang is a recipient of Training Fellowship from the National Health and Medical Research Council of Australia.
Author Disclosure Statement
No competing financial interests exist.