
Abstract
Human dental pulp derived from exfoliated deciduous teeth has been described as a promising alternative source of multipotent stem cells. While these cells share certain similarities with mesenchymal stem-like cells (MSC) isolated from other tissues, basically they are still poorly characterized. In this study, for the first time, a proteomic map of abundantly expressed proteins in stromal cells derived from the dental pulp of human exfoliated deciduous teeth (SHED) was established. We also analyzed proteomic signatures of 2 clonal strains derived from SHEDs by single-cell cloning. The SHEDs were established from enzyme-disaggregated deciduous dental pulp from 6-year-old children. They had typical fibroblastoid morphology and high colony-forming efficiency index (16.4%). Cloning was performed at the second passage using limiting dilution in a 96-well plate (0.3 cell/well). Differentiation assessment revealed strong osteogenic but no adipogenic potential of the SHEDs in either clonal strain. The cells expressed characteristic antigens of MSC-like cells, including CD73, CD90, CD105, CD146, and did not express hematopoietic markers CD14, CD34, and CD45, as assessed with FACS analysis. For proteomic studies, cytosolic and nuclear proteins were analyzed with 2-dimensional gel electrophoresis (2-DE) and identified using matrix-assisted laser desorption/ionization (MALDI)-time of flight (TOF)-mass spectrometry (MS). All proteins were identified with high level of confidence (the lowest sequence coverage was 27%). Identification of highly expressed proteins in SHEDs revealed proteomic profiles very similar to that of MSC-like cells derived from other tissues. We also found a high degree of similarity between proteomic signatures of primary SHEDs and clonal cell strains. Thus, our data confirm a close resemblance between SHEDs and MSC-like cells from other tissues and may serve as starting point for creating-comprehensive proteomic maps.
Introduction
M
The problem of MSC identity is further complicated by the fact that specific sets of surface antigens for MSCs are unknown. It has been demonstrated for example that MSC derived from bone marrow expressed the same antigen markers (earlier described as “specific for mesenchymal stem cells”) as fibroblasts derived from skin [6]. Thus, currently accepted positive surface markers characterize stromal cell cultures rather than MSC cells. Several attempts have been made to identify traits characteristic to clonogenic (CFU-F) MSCs. A recent study demonstrated that only CFU-Fs and their clonal progeny isolated from human bone marrow, but not all stromal cells, expressed CD146 antigen. These cells were capable to regenerate bone, stroma and establish hematopoietic microenvironment, when transplanted in vivo. Importantly, clonogenic CD146 cells demonstrated ability to self-renew [7]. Thus, CD146 antigen is specifically expressed by human bone marrow-derived MSCs, although some authors prefer the term “skeletal stem cells.” Another recent study showed that perivascular cells irrespective of their tissue of origin have characteristic properties of MSC-like cells. These cells were positive for markers of pericytes (CD146, NG2) and most importantly natively expressed CD73, CD90, and CD105 antigens which are known as “typical” for in vitro-cultivated MSCs [8]. Interestingly, cells with osteogenic, chondrogenic, and (or) adipogenic differentiation potential were present in most primary fibroblast-like populations [9]. Different cell lines demonstrated typical MSC immunophenotype, but distinct differentiation potentials, suggesting that most populations described earlier as fibroblast-like, contain mesenchymal progenitor cells (MPC) and/or possibly MSCs. Thus, it is important to discriminate fibroblasts from fibroblast-like MSCs in stromal cell cultures.
Since MSCs cultures comprise functionally different heterogeneous subpopulations, one obvious way to study them is cloning. Properties of individual cell strains generated from single cells or individual colonies then could be analyzed and compared using for instance complex genomic and (or) proteomic studies to establish more accurate MSC phenotypes. Proteomic technology allows systematic large-scale qualitative and quantitative mapping of the whole proteome, which ideally represents the entire complement of proteins in a given organism at a given time [10]. Such studies could not only be useful for the identification of specific markers, but also reveal typical proteomic patterns of MSCs during proliferation, differentiation, senescence, or other experimental conditions. Several experimental strategies have been employed for proteomic MSC studies, focusing on comparisons of the protein expression profiles of undifferentiated and fully differentiated MSCs and also on MSCs derived from different sources [11]. In the present study, we compared proteomic signatures of primary MSC-like cell line and strains derived from the individual clones. As experimental model, we used stromal cells derived from the dental pulp of human exfoliated deciduous teeth (SHEDs). We chose this model for several reasons: first, it has been demonstrated that naturally exfoliated human teeth contain populations of multipotent cells capable to differentiate into odontoblasts, adipocytes, and neural cells [12]; second, these cells are able to induce bone and dentin formation in vivo and survive in neural tissue. They share certain similarities, like typical fibroblastoid morphology, immunophenotype, and to some extent differentiation potential, with MSC-like cells derived from bone marrow, adipose tissue, or other sources [13]; third, our initial observation suggested that SHEDs demonstrate higher in vitro proliferation rates than stromal MSC-like cells derived from other sources, for example adipose tissue. This was important from a practical standpoint, in the proteomic studies.
Here, we compared proteomic signatures of primary SHEDs and 2 clonal cell strains. Detailed computer-assisted image analysis revealed remarkable similarities between proteomic signatures of 2 clonal cell strains and the parental SHED line. Using proteomic analysis, we identified the most abundant proteins and for the first time established proteomic profile of SHEDs. Our data indicate that SHEDs display proteomic expression patterns that are typical for MSC-like cells derived from other tissues.
Materials and Methods
Isolation, culture, and cloning of stromal cells from the dental pulp of human exfoliated deciduous teeth
Cells were obtained from human exfoliated deciduous teeth of 6-year-old children, whose parents had signed informed consent. Material was collected under approval of Lithuanian Bioethics committee. Teeth were collected during a dental session after mouth rinse with 0.12% chlorhexidine solution for 30 s. Only teeth with vital pulp were collected and stored in Liebovitz (L-15) medium (HyClone, Logan, UT) supplemented with 2.0 mM
For colony-forming efficiency (CFE) assessment, the first passage cells were plated at the density 100, 200, 500, and 1,000 cells per 9.5 cm2 and colony forming inspected microscopically after 7 days of culture. A CFE index was calculated by dividing the number of colonies formed and the number of cells plated and multiplying with factor 100.
Clones were obtained by limiting dilution of second passage cells. One hundred microliters of cell suspension (final concentration 0.3 cell/per well) was placed in each well of a 96-multiwell plate in low-glucose DMEM supplemented with 10% FBS and antibiotics. Cultures were examined daily for the appearance of colonies. Wells containing one stromal colony were marked and after cells reached confluence, they were trypsinized and expanded in a 6-well plate.
Growth kinetics of primary cell line and clones were measured by plating third passage cells at densities of 2,500, 7,500, and 25,000 cells/1.9 cm2 in replicate wells and counting the increase in cell number with time (after 24, 48, 72, and 96 h) using a hemocytometer. The population doubling time was then calculated from the growth curves.
Osteogenic differentiation
Cells were seeded at a density 5 × 10³/cm2 in low-glucose DMEM supplemented with 10% FCS, 100 U/mL penicillin, 100 μg/mL streptomycin, 2 mM
Osteogenic differentiation was assessed by staining for the identification of hydroxyapatite crystals (von Kossa). The cells were fixed for 20 min with 4% paraformaldehyde solution in room temperature, washed with distilled water, and stained with 1% silver nitrate (Sigma, St. Louis, MO) for 30 min, followed by 5% sodium thiosulfate for 5 min. Control cultures without the differentiation stimuli were stained in the same manner.
Adipogenic differentiation
Cells were seeded at a density 5 × 10³/cm2 in low-glucose DMEM supplemented with 10% FCS, 100 U/mL penicillin, 100 μg/mL streptomycin, 2 mM
Intracellular accumulation of lipids was visualized using Oil Red O reagent (Sigma). In brief, cells were fixed for 20 min with 4% paraformaldehyde solution in room temperature and stained with 2% Oil Red O for 15 min at room temperature. Control cultures without differentiation stimuli were stained in the same manner.
FACS analysis
For the FACS analysis cells were trypsinized with 0.25% trypsin/1 mM EDTA solution, washed twice with ice-cold PBS and incubated on ice for 30 min with the following antibodies CD34-FITC, CD45-FITC, CD105-APC (Invitrogen, Carlsbad, CA), CD14-PE (Santa Cruz Biotechnology, Santa Cruz, CA), CD73-PE, CD146-PE (BD Pharmingen, San Diego, CA), CD90-FITC (Millipore, Temecula, CA). The cells were then washed twice with PBS, resuspended, and used for FACS analysis. FACS analysis was performed using FACSAria flow cytometer (BD Biosciences, San Jose, CA) and 10,000 events for each staining were analyzed using BD FACSDiva software.
Gel electrophoresis and silver staining
Proteins from cytoplasmic and nuclear fractions were isolated using Nuclear Isolation Kit (Sigma) according to the manufacturer's recommendations. Isolated nuclei were suspended in Nuclei EZ storage buffer, and frozen at −76°C.
The cytosolic and nuclear proteins were resolved by 2-dimensional (2-DE) gel electrophoresis (IEF/SDS). In some experiments, 2 parallel gels were used if needed. An Immobiline DryStrip Kit, pH range 3–10, and Exel Gel SDS, gradient 8%–18% was used for 2-DE electrophoresis. We used 11-cm long Immobiline DryStrip, size 110 × 3 × 0.5 mm (after rehydration). In order to characterize specific proteins in a complex of total cytoplasmic or nuclear protein mixture the pH range 3–10 was chosen. Isolated cytoplasmic and nuclear proteins were suspended in IEF sample buffer containing 9 M urea, 2 M thiourea, 4% CHAPS, 0.5% IPG buffer (pH 3–10), 50 mM DTT. IEF was performed up to 72 kVh. Before 2-DE electrophoresis, proteins were reduced and alkylated to eliminate disulfide bridges. For this, we have used dithiothreitol (DTT) as reductant and iodoacetamide as alkylating reagent. The second-dimension separation was performed on the Multiphor II flatbed system. 2-DE electrophoresis was carried out according the manufacturer's instructions (Immobiline DryStrip Kit for 2-DE Electrophoresis with Immobiline DryStrip and ExelGel SDS; Amersham Pharmacia, Uppsala, Sweden). For analysis of total cytosolic and nuclear proteins, 2-DE gels were stained using the Silver Staining Kit (UAB Fermentas, Vilnius, Lithuania).
In-gel tryptic digestion and MALDI-TOF MS
Areas of the gel that were deemed to be of interest were cut out and subjected to overnight in-gel tryptic digestion [14]. In brief, the gel slices were dehydrated with 50% acetonitrile and then dried completely using a centrifugal evaporator (DNA Mini, Eppendorf). The protein spot was rehydrated in 20 μL of 25 mM ammonium bicarbonate (pH 8.3) containing 20 μg/mL modified trypsin (Promega, Madison, WI). Once this solution was fully absorbed by the gel, trypsin-free buffer was added just enough to cover the slice, and the samples were incubated overnight at 37°C. The tryptic peptides were subsequently extracted from the gel slices as follows. Any extraneous solution remaining after the digestion was removed and placed in a fresh tube. The gel slices were first subjected to an aqueous extraction and then to organic extraction with 5% trifluoroacetic acid in 50% acetonitrile, shaking occasionally. The digestion and extract solutions were then combined and evaporated to dryness. For matrix-assisted laser desorption/ionization (MALDI)-time of flight (TOF) analysis, the peptides were redissolved in 3 μL of 30% acetonitrile and 0.01% trifluoracetic acid and were then prepared with a matrix (α-cyano-4-hydroxycinnamic acid) on the target plate. The analysis was performed on a Voyager MALDI-TOF MS (matrix-assisted laser desorption/ionization time-of-flight mass spectrometer; Perseptive Biosystems Inc., Framingham, MA). Positive ionization, an acceleration voltage of 20 kV, grid voltage 75%, guide wire 0.02, and the extraction delay time 200 ns were used to collect spectra in the mass range of 700–4,000 Da. Reflector mass spectra were acquired and calibrated either externally or internally, using trypsin autolysis peptides (m/z 842.5200, 1045.5642, 2211.1046). Data processing of the spectra was performed with Data Explorer™ Version 4.0 (Applied Biosystems, Foster City, CA). Mass spectrometry (MS) data were searched against a human protein database (a subset of proteins from the NCBI nonredundant protein database) using the software search algorithms MASCOT (Matrix Science Ltd, London, UK). Restrictions were passed on mass tolerance (±50 ppm), maximum missed cleavages by trypsin (up to 1), and cysteine modification by carbamidomethylation.
Computer-assisted image analysis
Gel image acquisition
The gels were digitized using ImageScanner™ III scanner together with LabScan 6.0 software application. Scanner settings were set to 16-bit pixel depth and 300 dpi resolution. Images were exported as TIFF™ graphic files. In advance, calibration of scanner was performed using the provided step tablet with known optical density values.
Gel image computational analysis
In this research, the prototype of a new software tool for 2-DE gel image analysis was used. The prototype is implemented in Matlab environment and has built-in original image processing algorithms based on new, advanced, and powerful image processing methods.
The software prototype consists of:
Image preparatory tools—image cropper, spot labeler, master gel selector, molecular mass markers' calibrator, pI calibrator; Image preprocessing related tools—image smoother, background eliminator, individual image warper, restorer of oversaturated spots; Segmentation tools—2-DE image splitter, segmented area rater, segmentation editor; Alignment tools—initial register, spot pairing and final image alignment tool, manual editor of alignment vectors; Quantitative analysis tools—spot quantifier, changes evaluator, inference engine; Visualization tools—3D viewer, 3D mixer.
Image preprocessing
The purpose of preprocessing was to remove randomly occurring white and black pixels (impulse noise), to remove background variations, to reconstruct oversaturated protein spots, and to straighten large image distortions in paths of same molecular mass and same pI proteins.
where Sxy is moving square window of size K and centered at (x, y) position.
where I open morphological opening is explicitly expressed by the use of morphological operations: erosion I min = I!H followed by dilation I max = I min ÅH.
Protein spot detection and segmentation
Applied protein spot detection and segmentation algorithm is based on Watershed transformation combined with symmetrical feature detection. At first rotational feature strength map S of pre-processed 2-DE image I is computed using Johansson method. Then, as computed rotational feature strength map is complex, only real part of it, that is, S R = Re{S} is taken and Watershed transform on inverted S R image is applied: S ((w) = WST(−S R). Watershed transform divides image into w regions each having one maximum.
Rotational symmetry gives the same value for dark and bright spots. Thus, second derivative is computed on image I in order to reject areas with bright spots. Protein spots being dark appear as pits in 3D image representation, thus the second derivative is positive in the area of spot core. This criterion is frequently used in spot segmentation algorithms [15,16]. For the rest image regions with w labels following features are extracted:
where
Based on these features, image regions with labels w were classified into 3 classes: c1—“one spot in a region”, c2—“partial spot”, c3—“empty region.” Classification was done by Feedforward Multilayer Neural Network of 3 layers with 3–5–2–2 neurons and tangent sigmoid transfer functions.
Image areas classified as having partial spot were highlighted calling the attention of the user to revise these areas and to correct (split, merge, or remove) segmentation results interactively. Spot boundaries were defined for each gel separately and they were used to delineate the area of the spot for volume calculations.
Gel image alignment
In order to compare protein spots from different 2-DE gel images, protein spots needs to be matched [17]. We designed and used registration algorithm that initially finds few landmarks that have high certainty, performs rigid deformation of image according to them, then finds all spot correspondences between images, and finally computes Thin-Plate Spline Transformation for overlaid visualization of images.
Initial registration algorithm is based on combination of cross-correlation calculated exploiting Fourier transform, and mutual information. Finally in order to find all spot correspondences between images, similar strategy was used just limiting the search area to around the spot and using only normalized cross-correlation. After automatic spot pairing, manual editing of alignment vectors was initiated to check and correct mismatches and add new matches between images if needed.
After pairing the protein spots in gel images, a ratio of spots normalized quantities among the image groups could be calculated to estimate changes of spot abundance between gel groups.
Results
Characterization of stromal cells derived from the dental pulp of human exfoliated deciduous teeth (SHEDs)
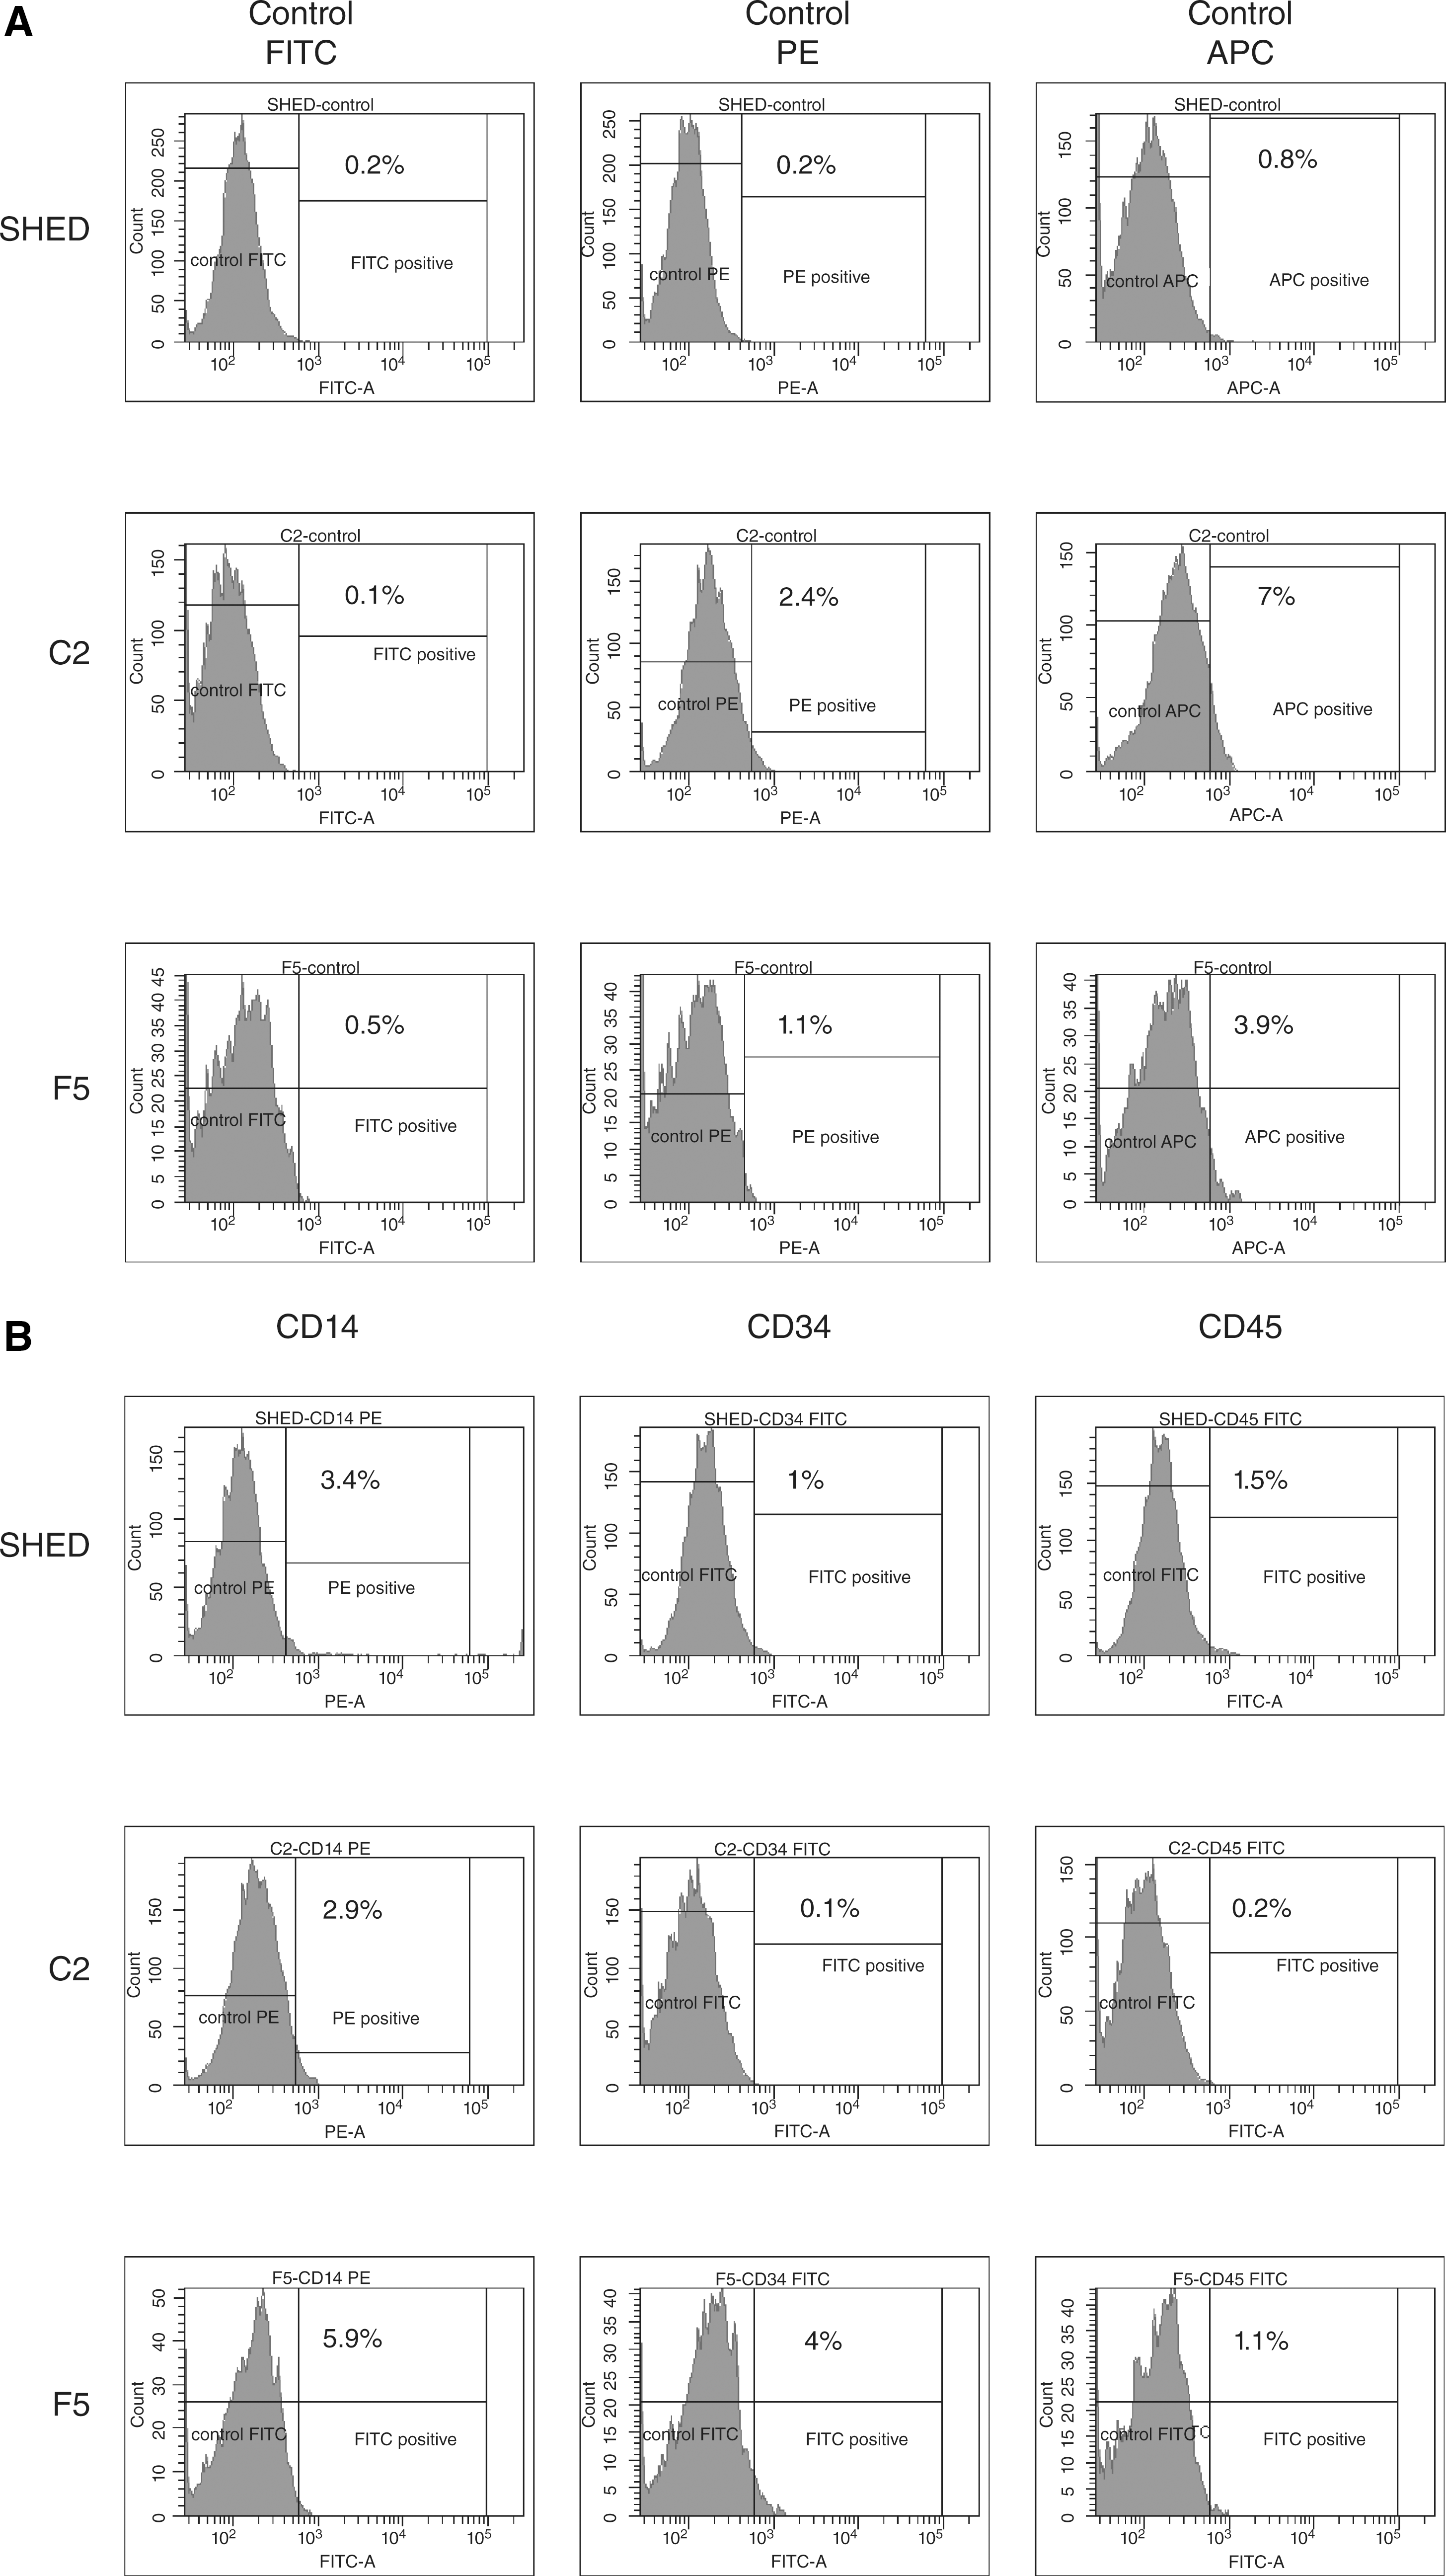
The primary culture consisted of small spindle-shaped fibroblastoid cells (Fig. 1A and 1B), which subsequently formed large dense colonies. The SHEDs retained ability to form colonies only until third passage. However, the CFE assay that was performed at the first passage revealed extremely high colony-forming index (16.4%). Typically, SHEDs doubled on average rate of about 24 h. The SHED cells cultured under osteogenic conditions started to proliferate faster and formed multilayers within the first week. After 2 weeks, staining with silver nitrate (von Kossa) revealed characteristic patterns of mineralized matrix (Fig. 1E). In contrast, no signs of differentiation were observed after 4 weeks of culture in adipogenic induction medium. Flow cytometry revealed that these cells expressed characteristic antigens of MSC-like cells, including CD73, CD90, CD105, CD146, and did not express hematopoietic markers CD14, CD34, and CD45 (Fig. 2A and 2B).
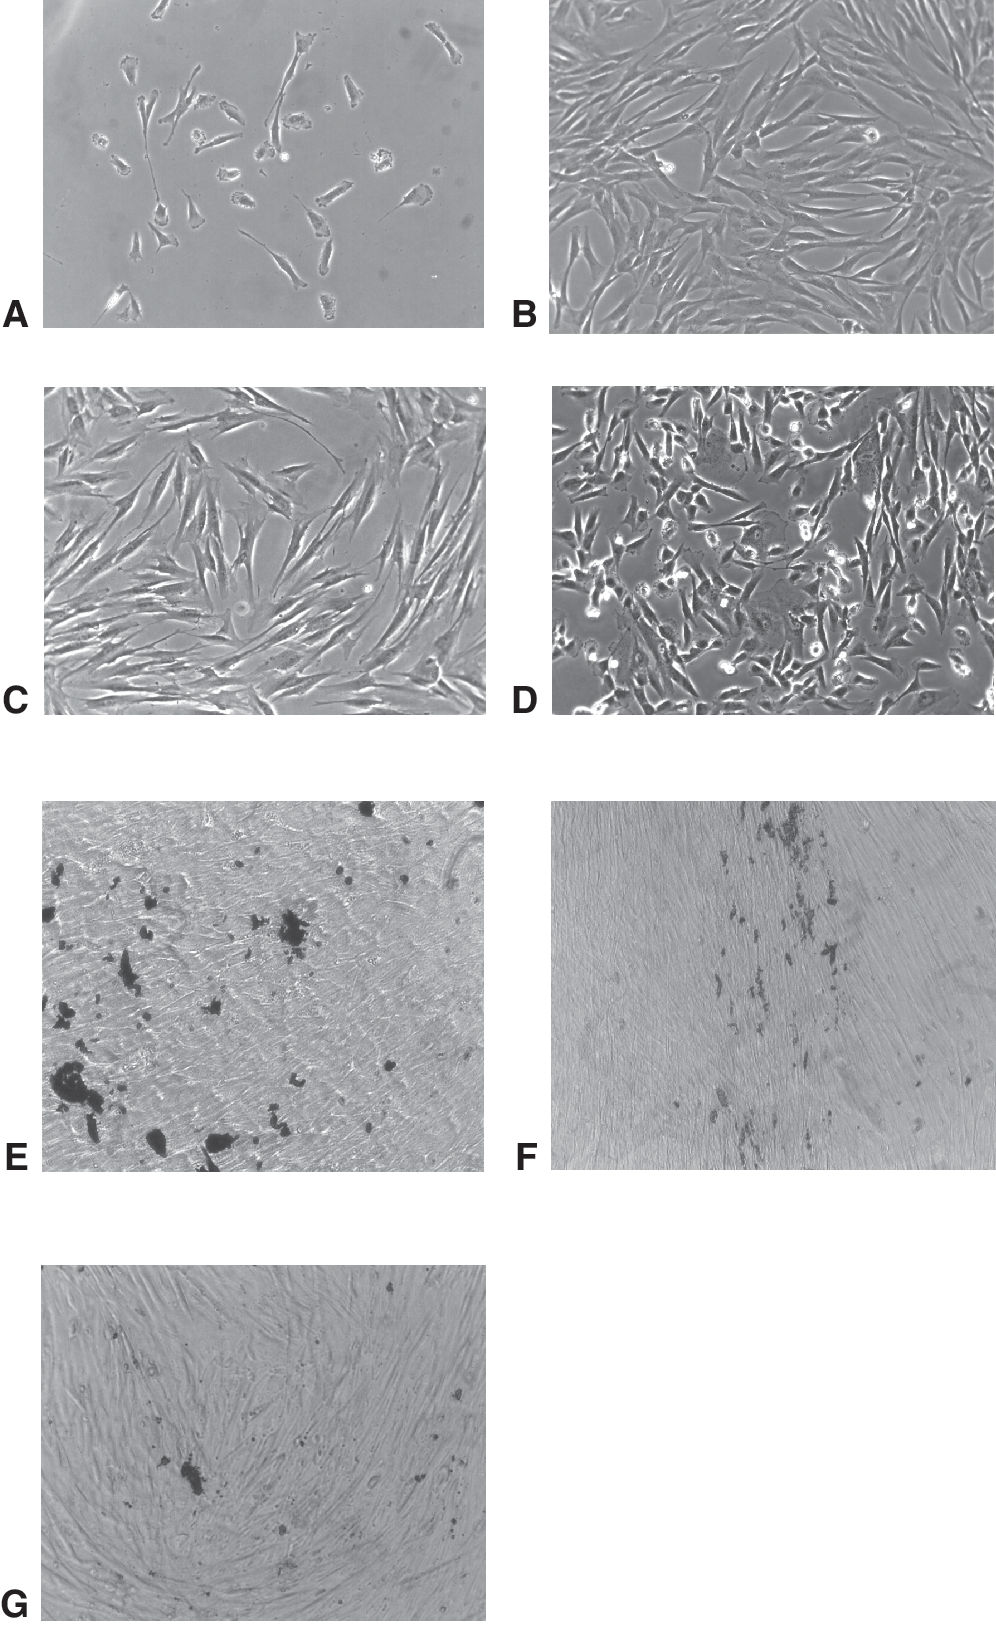
Morphology and osteogenic differentiation of stromal cells isolated from the dental pulp of human exfoliated deciduous teeth (SHEDs) and clonal strains C2 and F5. (
(

Derivation and characterization of 2 clonal strains from the primary SHED line
For the establishment of clonal cell strains, we used limiting dilution method. We identified 16 wells containing single stromal cell colonies, and 2 of them (clones C2 and F5) were expanded for further analysis. These cells were propagated for 5–12 passages to generate sufficient number of cells for experiments. Both clones displayed typical fibroblastoid morphology, though with some differences, especially at the early passages (Fig. 1C and 1D). We also observed 2 morphologically distinct groups of cells within the population of F5 clone: small spindle-shaped and large-flattened cells (Fig. 1D). This apparent heterogeneity was evident until the fifth passage. Both clones displayed similar growth rates with population doubling time of about 24 h. In vitro differentiation assays revealed that both clones have strong osteogenic potential, but did not differentiate toward adipocytes. FACS analysis showed that C2 and F5 clones had a similar immunophenotype as the parental cell line. Interestingly, C2 and F5 demonstrated weaker expression of CD146 antigen than parental cell line (Fig. 2A and 2B).
Identification of cytoplasmic and nuclear proteins
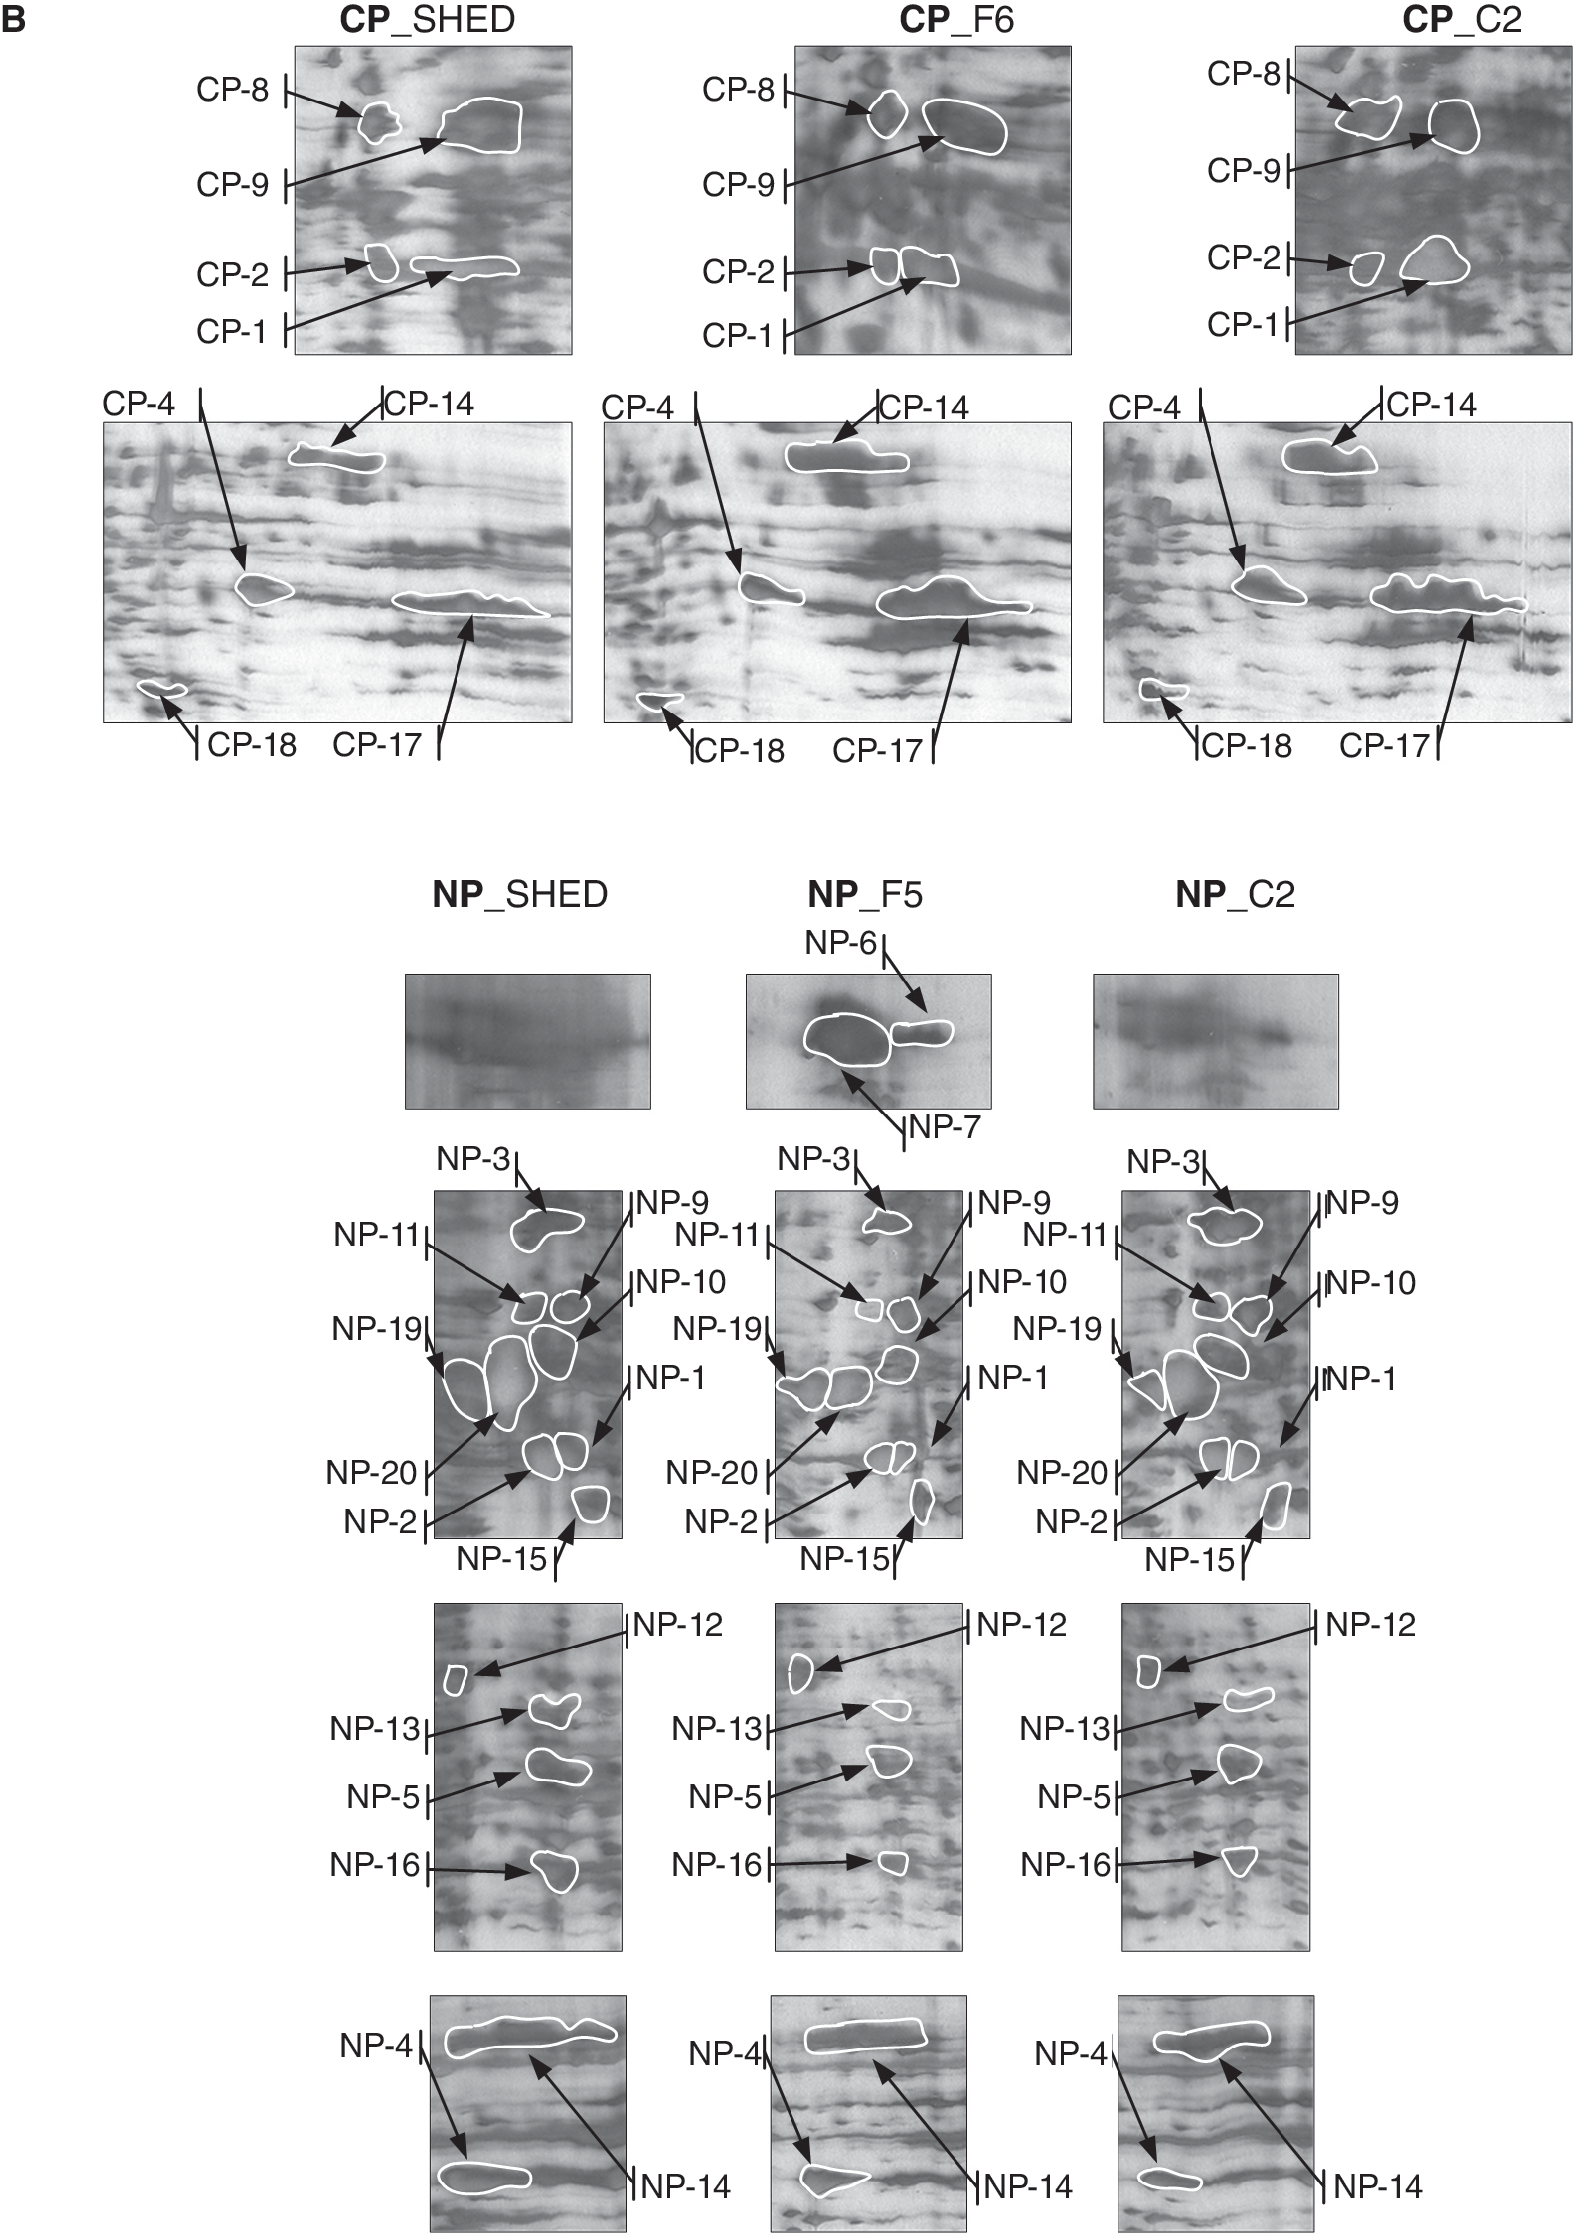
Cytosolic and nuclear proteins from SHEDs and clones C2 and F5 were extracted and fractionated as described in Materials and Methods section. 2-DE gels were then visualized by silver staining. The protein spot patterns visualized on 2-DE gels were very reproducible, and approximately 150–300 protein spots were identified on each gel (Fig. 3A). Some differentially expressed spots were excised and subjected to in-gel tryptic digestion and identification by mass spectrometry analysis (MALDI-TOF-MS) and human protein database searching. The positions of all proteins identified on 2-DE gels were in the expected range of their theoretical isoelectric points and molecular sizes. The identified proteins are presented in Table 1. Figure 3B represents gel regions with protein spots identified both in SHEDs and in its daughter clones (C2 and F5). All identified proteins were analyzed and compared by using computer-assisted methods as described below.
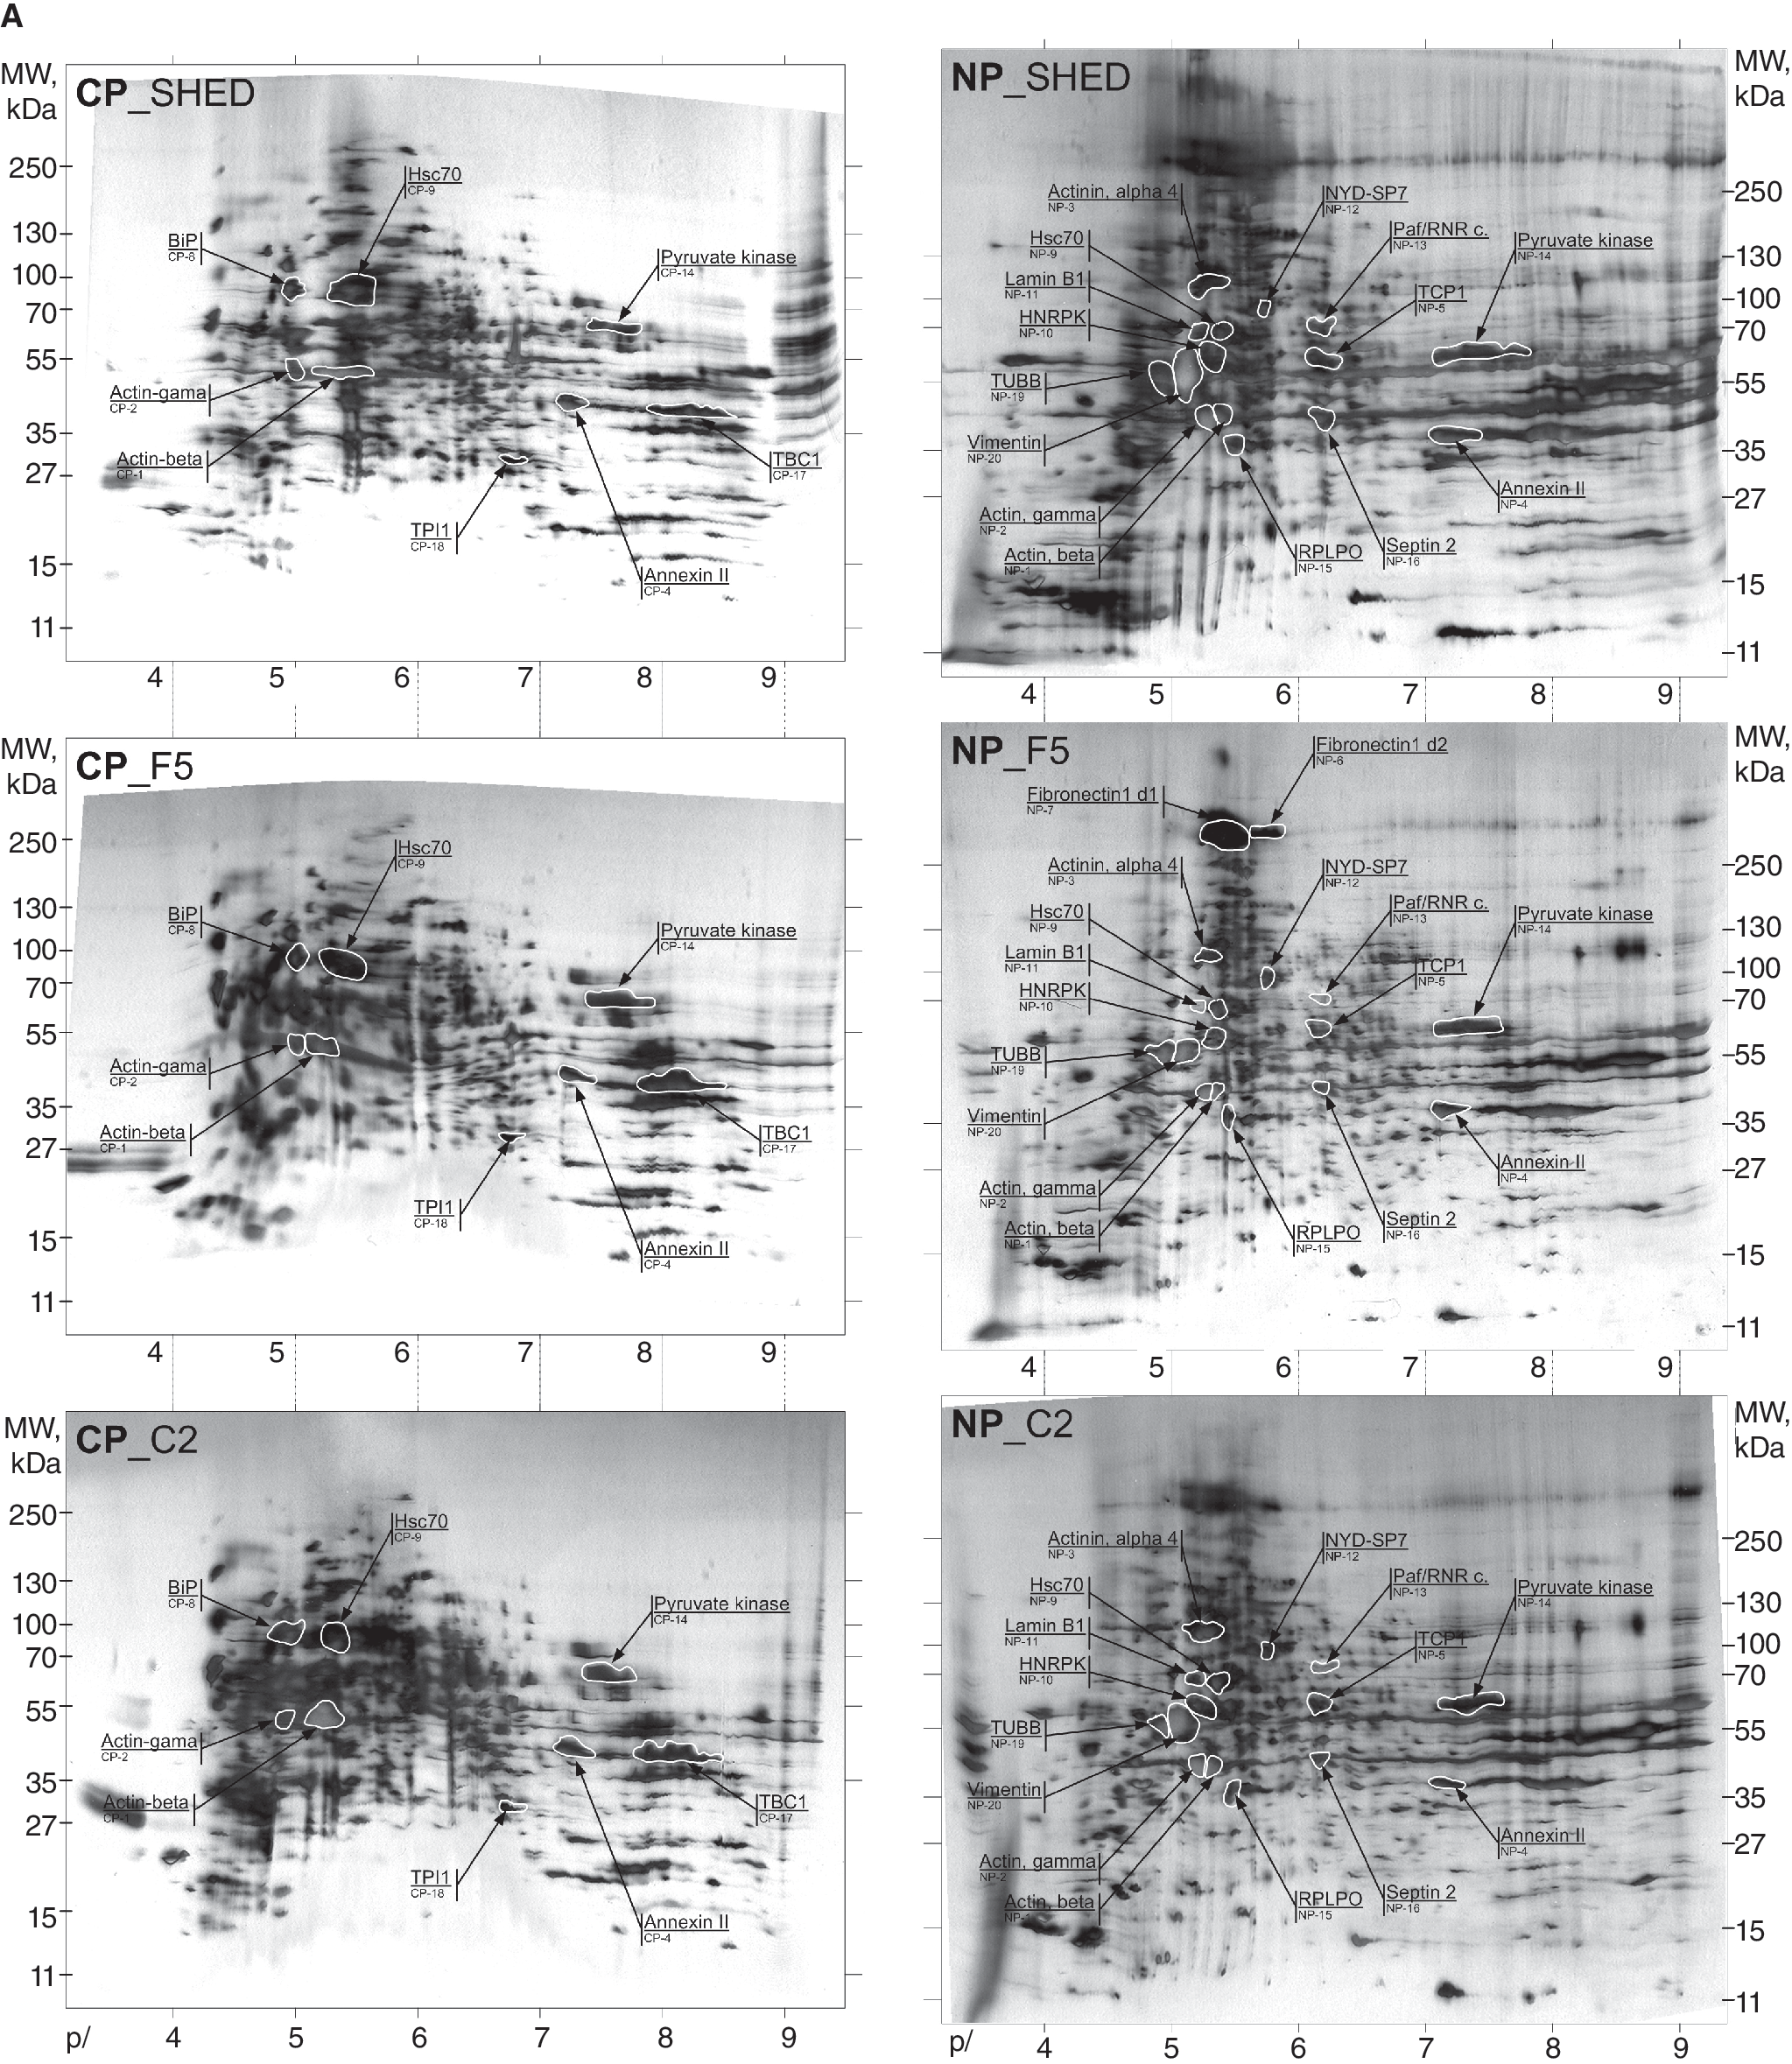
2-DE and computer-assisted image analysis of SHEDs and clones C2 and F5. (
Expression levels of all identified proteins in cytoplasmic and nuclear fractions of stromal cells derived from the dental pulp of human exfoliated deciduous teeth (SHEDs) and C2 and F5 clones were analyzed and compared (fold change) using computer-assisted analysis as described in Materials and Methods section.
Computer-assisted image analysis
Two experimental groups of images were analyzed: proteins from the cytoplasmic and nuclear fractions of primary SHED line (CP_SHED, NP_SHED), clone F5 (CP_F5, NP_F5), and clone C2 (CP_C2, NP_C2). Three intergroup comparisons on 2 groups (6 at all) between gels were performed. In current research gels, CP_C2 and NP_F5 were selected as master gels.
Analyzed gels were first filtered by a median filter (Eq. 1) of window size K = 3. Reduction of image artefacts increased the correctness of protein spot processing. Next, correction of horizontal distortions of individual gels was accomplished to straighten protein migration paths. Software automatically detected horizontal patterns in gels and suggested possible locations for the proteins of the same molecular weight. Suggested positions were revised and few of them modified manually. Then a transformation function was constructed based on computed mappings. Usually technical variations are lowered by running replicate experiments and selecting best looking gels, but there is no guarantee that satisfactory reference gel will be produced. Our approach was to construct a reference gel. Master gels were also pre-processed to straighten protein migration paths. After spatial corrections, images were inverted making bright spots in dark background to make intensity values increase when going toward spot center. The next step was reconstruction of oversaturated spots used to correct spot intensity distortions that may occur while silver staining highly loaded protein areas. Then oversaturated spot areas become brighter than surrounding areas instead of being the darkest places of a spot. In this case, quantifications based on sum of pixel values of spot area are inappropriate because spot quantity is underestimated. For spot reconstruction, we used locally adaptive protein spot reconstruction 3G algorithm that applies mathematical spot model constructed of 3 independently varying Gaussian profiles:
where δ(y) = 1 for y ≥ y 0 and δ(y) = 0 for y < y 0; p = B, I, σ x , σ y1, σ y2, x 0, y 0 —model parameters: B—background for modeled area; I—intensity scale; σ x —spread of the model in the direction of pI; σ y1, σ y2—spread of the model in the direction of MM to the opposite directions from spot center; (x 0, y 0)—center coordinates of the modeled spot. The proposed reconstruction algorithm was experimentally tested on real and synthetic oversaturated protein spots (image data) and showed satisfactory results. Reconstruction procedure is automatic when oversaturated protein spots are well separated from each other, otherwise user intervention is needed. The user has to indicate areas of spot and saturation, the rest is done by the algorithm.
After reconstruction process, image background was removed by morphological operations (Eq. 2) and intensity was scaled to full range [0,55].
After automatic gel segmentation with watershed transformation, manual region editing (splitting or merging) was used. Image areas that were highlighted as “containing partial spot” were analyzed thoroughly. 3D tool was helpful for complex region analysis.
Gel image alignment was performed as described previously. After alignment, isoelectric points and molecular weights of the marked protein spots were computed.
Isoelectric points of investigated proteins were calculated by linearly interpolating between known pI values that were transferred from standard gel of pI 3–10. Standard procedure for determination of molecular weight of polypeptides was used. Molecular weights of proteins were determined by comparison of their mobilities with those of several marker proteins (standards) of known molecular weight.
After determination of spot area, spot quantity calculation was performed. Spot quantity V is defined as the total intensity of a spot in a gel image and corresponds to the amount of protein in the actual spot on the gel. The total intensity of an object is the sum of the intensities of all the pixels that make up the object:
The quantity of each protein spot in a gel V is divided by the total quantity of all the protein spots in that gel V
Σ in order to obtain the final normalized quantity
The protein spot normalized quantity ratio was used to identify whether a spot in the first image was larger than the corresponding spot in the second image or vice versa. The quantitative ratios representing different expression levels of identified proteins are listed in Table 1.
Discussion
Numerous cloning experiments revealed that primary cell culture does not represent a collection of identical cells, rather it is comprised of cells with different functional properties [3]. According to this, subpopulations of cells with varying growing rate, differentiation potential, and different levels of senescence may coexist in the same culture [18]. The existence of such subpopulations may represent some sort of internal hierarchy, where primitive cells with less restricted differentiation potential and their more abundant differentiated and sensecent progeny comprise functionally heterogeneous populations. It has been demonstrated that during the in vitro culture the heterogeneity and differentiation potential of such populations tends to decrease. These changes may reflect some sort of selection that occurs during the in vitro culture. It is possible that subpopulations with higher proliferation potential become dominant during the time [3]. Another possible explanation, which does not contradict previous model, is that different type of cells, rather than different subpopulations may contribute to heterogeneity of primary cultures. This possibility cannot be excluded because currently accepted sets of positive surface markers characterize the whole stromal cell cultures of MSC-like cells and do not reflect their heterogenic nature [1,19]. Therefore, only clonal cell cultures derived from single cells or individual colonies could be useful in this regard. Systemic analysis of such clones may reveal mechanisms regulating heterogeneity of in vitro MSC-like cell cultures.
Cloning allows selection of density-insensitive cells [3]. Importantly, some of these cells give rise to the clonal cultures, which may demonstrate stem cell properties when transplanted in vivo. It is also possible that other subpopulations of stem cells do not survive cloning selection. Nevertheless, cloning is the only way to study “pure” progeny derived from a single cell. However, most likely, during the culture these clonal populations may also become heterogeneous due to the unequal differentiation and (or) senescence of clonal progenitors. Despite the fact that during the cloning all culture-initiating cells are exposed to the identical conditions, very frequently clonal cell strains demonstrate remarkably different properties (morphology, growing rate, differentiation potential). This indicates that culture-initiating cells are different. It is not known, however, whether these differences reflect the fact that CFU-Fs are from different subpopulations with distinct differentiation potentials, or they represent another type of cell. In the present study, we used a proteomic approach that allowed us to compare protein expression signatures between a primary cell culture and her daughter clones. As a result, we for the first time established a map of abundantly expressed proteins in stromal cells derived from the dental pulp of human exfoliated deciduous teeth (SHEDs). Our goal was to create a reliable list of proteins that are typically expressed in SHEDs and their daughter clones and then to compare this list with known proteomic profiles of MSC-like cells derived from other sources. Therefore, for the identification, we chose highly expressed proteins. Importantly, remarkably high depth of coverage was achieved a lowest sequence coverage of 27%. Thus, all proteins were identified with high level of confidence (Table 1).The largest group comprised proteins that belong to the cellular cytoskeleton. The protein vimentin was identified with high confidence in primary stromal cell culture and both clones. Vimentin is the major intermediate filament protein of mesenchymal cells and is abundantly expressed in tissues of mesodermal origin [20]. Importantly, MSC-like cells derived from different tissues (bone marrow, umbilical cord blood, adipose tissue) express high levels of vimentin [11,21 –23]. Vimentin has been shown to act as organizer of proteins involved in cell attachment, migration, and signaling. The phosphorylation and dephosphorylation of vimentin influences its assembly into filaments. Although, vimentin is a component of cytoskeleton and is localized primarily in cytoplasm, we found substantial amounts of this protein in nuclear fractions. This could be explained by a tight association of vimentin with nuclei and mitochondria. Interestingly, vimentin interacts with satellite DNA, telomere DNA, retrotransposons, and nuclear matrix attachment region-binding proteins [24,25].
The protein α-actinin 4 is a F-actin cross-linking protein, which is important for actin bundling and its interaction with various intracellular structures [26]. Besides its classical role as actin-binding protein, α-actinin 4 has also specific nuclear functions. For example, together with BAT1 it directly interacts with a cytochrome c promoter during skeletal muscle differentiation [27]. Moreover, it potentiates myocyte enhancer factor-2 transcription activity by antagonizing histone deacetylase 7 [28]. These findings indicate that it acts as a scaffold for various transcription factors and may play an important role during cellular differentiation.
We also identified fibronectin 1 protein, which was uniquely expressed in the F5 clone. It plays a fundamental role in the organization and composition of the extracellular matrix and cell-matrix adhesion sites [29]. Interestingly, when differential gene expression in MSCs derived from bone marrow, umbilical cord blood, and adipose tissue was determined in relation to HS68 fibroblasts, significant up-regulation of fibronectin 1 was detected, suggesting an importance for MSCs [30]; up-regulation of fibronectin expression may be a prerequisite for the differentiation of MSC-like cells. Fibronectin was specifically expressed by migrating neurons during early development of the cerebral cortex [31] and it is important for the migration of neural crest cells [32]. The septin 2 protein (also known as NEDD5) belongs to highly conserved family of filamentous GTPases. This protein is involved in cytokinesis and is required for normal progress trough mitosis [33], but it may also regulate other important cellular functions, including cell membrane dynamics, vesicle fusion, and phagosome maturation in primary human neutrophils [34]. It has also been identified in MSCs derived from human umbilical cord blood [21].
Annexin A2 was identified with high level of confidence in the primary stromal cell culture and both clones. It is calcium-regulated membrane-binding protein and participates in a number of cellular functions [35]; it binds F-actin and mediates calcium-dependent filament bundling [36], and helps cross-linking of plasma membrane phospholipids with the cytoskeleton and is involved in endocytosis, exocytosis, and lipid raft formation [37]. Several proteomic studies have confirmed its presence in preparations of MSCs [21,22]. Incidentally, the expression of annexin A2 protein was upregulated during serial subculturing of MSCs derived from bone marrow [23].
TBC1 D7 is an important regulator of Rab GTPase family proteins, which control distinct steps in membrane traffic pathways, like vesicle formation and movement and membrane fusion [38]. It has been specifically linked to the activation of Rab17 GTPase and primary cilium formation [39].
Another group of proteins identified in this study belong to a family of molecular chaperones. We thus confirmed expression of HSPA5, HSPA8, and chaperonin containing TCP1 subunit 3 (CCT3) proteins, which have also been identified in a proteomic studies of MSCs derived from bone marrow and umbilical cord blood [21,22].
HSPA5 is located in the endoplasmic reticulum, where it is assumed to facilitate the transport of newly synthesized proteins into the lumen and their subsequent folding [40]. HSPA8 is found in both cytosol and nucleus and is constitutively expressed in most tissues. This protein is important for folding of nascent polypeptides, protein translocation across membranes, prevention of protein aggregation, and disassembly of clathrin-coated vesicles [41]. CCT3 is member of the chaperonin-containing TCP1 complex, which consists of 2 identical stacked rings, each containing 8 different proteins. Interestingly, the expression of CCT3 gradually decreased during serial subculture of MSCs derived from the bone marrow, suggesting that it plays a role in proliferation and multipotentiality of MSCs [23].
In summary, the present identification of highly expressed proteins in SHEDs revealed proteomic profile that is very similar to that of MSC-like cells derived from other tissues. This similarity demonstrates that SHEDs may be closely related, if not identical, to MSC-like cells. Still, SHEDs did not fully match criteria accepted for the characterization of MSC-like cells. We were, for example, not able to induce in vitro adipogenic differentiation of the SHEDs and clonal cell strains. This may be due to the pre-commitment of SHEDs toward the osteogenic lineage. Interestingly, we also found that expression of CD146 antigen in both clones was considerably weaker than in the parental cell line (27.1% in C2 and 37.8% in F5 to 66.3% in primary SHEDs), while at the same time all cells expressed similar levels (>96%) of CD90, CD73, and CD105 (Fig. 2A and 2B). Several reports have demonstrated that CD146 is expressed by adventitial reticular cells in bone marrow and by perivascular cells in other tissues that are now believed to be in vivo counterparts of MSC-like cells [7,8]. Importantly, it is also marker of clonogenic cells [7]. In this study, we did not select CD146-positive subpopulation before cloning, and therefore we do not know whether C2 and F5 clones were initiated by CD146-positive or -negative cells. Nevertheless, in both cases, the existence of CD146-positive subpopulation in single cell-derived clones indicates occurrence of internal heterogeneity within a culture. We speculate that proportion of CD146-positive cells may reflect level of culture senescence. We will address this issue in our future studies.
Proteomic profile of large cell population should ideally represent all proteins expressed in that population, but in reality the proteomic maps established from the large cell preparations comprise most abundant proteins. Since only a small proportion of primary SHEDs initiate clonal cultures, their proteomic profiles were most likely masked by the proteome of a dominant subpopulation within a culture. Clonal strains are derived from single cells and therefore represent “pure” progenitors without contamination with different type of cells. We found, however, a high similarity between proteomic signatures of the primary SHEDs and clonal cell strains, indicating the presence of identical subpopulations. We therefore conclude that clonal strains tested were initiated by cells that support primary parental SHED culture. We also observed that single colony-initiating cell can give rise to a progeny, which recapitulates proteomic signature of whole parental culture. In our opinion, this may be due to the heterogenization of the clonal population, which could have occurred due to unequal senescence and (or) differentiation of cells during the culture. Accordingly, our analysis revealed the proteomic profile of subpopulation, which became dominant during the culture of the clonal cell strain. Moreover, the heterogenization within a culture seemed very similar between parental population and her daughter clones, while it would be informative to perform secondary cloning experiments in order to compare changes of proteomic profiles between progenitors of primary and secondary clones.
In conclusion, our study for the first time presents a map of highly expressed proteins in SHEDs. We found that SHEDs display similar proteomic profile to that of MSC-like cells derived from other tissues indicating common origin of these cells.
Footnotes
Acknowledgments
This research was partially supported by the grants from Lithuanian State Science and Studies Foundation (No. B-25/2009) and Swedish Research Council, the Visby program of the Swedish Institute (Visby program No. 1398/2007 and No. 879/2009).
Author Disclosure Statement
No competing financial interests exist.