
Abstract
Transcription factor FoxA1 plays a critical role during embryonic development and is activated during retinoic acid (RA)-induced neural differentiation of pluripotent P19 embryonal carcinoma cells at the early stage, which is marked by decreased expression of Nanog and increased expression of neural stem cell marker Nestin. To further understand how FoxA1 mediates neural differentiation, we have overexpressed FoxA1 through an adenovirus vector in P19 cells and identified that early neurogenesis-related sonic hedgehog (Shh) gene is activated directly by FoxA1. Knockdown of FoxA1 expression during P19 cell neural differentiation results in prevention of Shh and Nestin induction. FoxA1 binds to Shh promoter at −486 to −462 bp region and activates the promoter in cotransfection assays. Furthermore, overexpression of FoxA1 alone in P19 cells stimulates expression of Nestin and results in decreased protein levels of Nanog. During RA-induced P19 cell differentiation, elevated levels of FoxA1 increase the population of neurons, evidenced by stimulated expression of neuron-specific Neurofilament-1 and Tubulin βIII. Together, our results suggest a critical involvement of FoxA1 in stimulating neural differentiation of pluripotent stem cells at early stages.
Introduction
T
Mouse embryonal carcinoma (EC) cell lines are derived from teratocarcinomas and have been well characterized as pluripotent cell lines that can be maintained as undifferentiated cells and induced under controlled conditions to differentiate in vitro to any cell type of all 3 germ layers [12], providing an attractive cell model system for studying differentiation of pluripotent stem cells [13]. The P19 EC cell line was derived from a teratocarcinoma in C3H/He mice, produced by grafting an embryo at 7 days of gestation to testes of an adult male mouse [14]. The cells contain a normal karyotype, predicting the cells do not possess any gross genetic abnormalities. When injected into mouse blastocysts, P19 cells differentiate into a broad range of cell types in the resulting chimeras [15]. Like embryonic stem (ES) cells, P19 cells express pluripotent marker genes such as Oct4, Nanog, and Sox2 and possess high activity of alkaline phosphatase. Teratomas formed by P19 cells in a nude mouse contain all 3 embryonic germ layers. P19 cells can differentiate in vitro into derivatives of all 3 germ layers depending on chemical treatment and growth conditions. For example, P19 cell aggregates (embryoid bodies) differentiate to cardiac and skeletal muscle when treated with dimethylsulfoxide [16,17], or neuronal and glial cells with retinoic acid (RA) treatment [16,18], similar to pluripotent ES cells.
The model of RA-induced P19 cell neural differentiation has been widely used for molecular analysis of neural induction and differentiation [19 –24]. As an important molecule for controlling cell growth and differentiation in both embryo and adult, RA functions by binding to ligand-inducible transcription factors (nuclear receptor proteins RARs and RXRs) that activate or repress the transcription of downstream target genes [25]. The temporal patterns of gene expression during RA-induced P19 cell neural differentiation display 3 phases: the initial primary response phase (0–24 h following RA treatment), the neural differentiation phase (1–3 days following RA treatment), and the terminal differentiation phase (5–6 days following RA treatment). The expression of primary response genes is increased rapidly upon RA treatment without new protein synthesis, evidenced by in the presence of cycloheximide. Many of the primary RA response genes are transcription factors, which regulate the expression of a much larger number of other genes that display altered expression and participate in decision of neural differentiation and terminal differentiation at later time points (1–6 days) following RA treatment. FoxA1 is induced within 6 h and peaks at 1 day during RA-induced P19 cell neuronal differentiation [26], and is one of the primary targets of RA action through a RA responsive element (RARE) in its promoter [27]. Our previous data demonstrated that adenovirus-mediated increase of FoxA1 in F9 EC cells, which differentiate to visceral endoderm lineage by RA, stimulates expression of its downstream target genes that are associated with visceral endoderm differentiation [28], providing us an efficient way to study the functions of FoxA1 during pluripotent stem cell differentiation.
In this study, we have investigated the possible role of FoxA1 in neural differentiation of pluripotent P19 EC cells. We have shown that in response to RA treatment, P19 cells lose their pluripotency evidenced by decreased expression of pluripotent stem cell marker Nanog [29,30], and first become neural stem-like cells, which express neural stem cell marker Nestin [31], and finally differentiate to neuronal cells. We have used the adenovirus-based FoxA1 expression vector to induce FoxA1 levels in P19 cells. The increased levels of FoxA1 stimulate the expression of Shh and Nestin, and result in decreased expression of Nanog, suggesting that FoxA1 promotes pluripotent P19 cells to become neural stem-like cells. On the other hand, knockdown of FoxA1 expression during P19 cell neural differentiation results in prevention of Shh and Nestin induction. We have further demonstrated that elevated levels of FoxA1 enhance the overall neural differentiation, evidenced by increased populations of neurons at the late time point of RA-induced P19 cell neural differentiation.
Materials and Methods
Cell culture and RA-induced neural differentiation
The P19 EC cell line and mouse fibroblast BALB/3T3 cell line were purchased from ATCC. Adenovirus purification 293A cell line was purchased from Invitrogen (Carlsbad, CA). P19 cells were maintained in Dulbecco's modified Eagle's medium (DMEM) containing 7.5% calf serum (Gibco, Grand Island, NY), 2.5% fetal bovine serum (Gibco), and 0.5% penicillin streptomycin (Gibco) at 37°C in 5% CO2. BALB/3T3 and 293A cells were maintained in DMEM containing 10% fetal bovine serum. For neural differentiation, P19 cell aggregates were formed by placing 3 × 10⁶ P19 cells in a 100-mm bacteriological dish (Petri dish; Falcon, Franklin Lakes, NJ) with addition of 5 × 10⁻⁷ M all-trans-RA (Sigma, St. Louis, MO) for 4 days. Subsequently, the aggregates were replated on tissue culture dishes (Corning Inc., Corning, NY) for further differentiation.
Adenovirus purification and infection, and siRNA treatment
The constructions of FoxA1 expression adenovirus AdFoxA1 and control virus AdLacZ or AdGFP were described previously [28]. For large-scale adenovirus purification, 20 tissue culture plates (150 × 25 mm) of 293A cells (1–2 × 10⁷ cells/plate) were infected with adenovirus at a multiplicity of infection (m.o.i.) of 1–5 plaque-forming units (pfu)/cell. After an additional 3-day culture, the cells were harvested, resuspended in DMEM (20 mL/109 cells), and lysed by freeze-thawing (−80°C 10 min/37°C 10 min) 3 times. After 10 min centrifugation at 2,000 rpm, the supernatant of the sample was layered on a cesium chloride gradient (1.4 g/mL and 1.2 g/mL in 50 mM Tris–HCl, pH 7.8, 10 mM MgCl2) and centrifuged at 22.5K rpm for 3 h at 4°C. The viral band was removed and mixed with an equal volume of buffer (50 mM Tris–HCl, pH 7.8, 10 mM MgCl2). The sample was layered on the CsCl gradient again and centrifuged at 22.5K rpm overnight at 4°C. The viral band was removed and mixed with 4 volumes of freezing solution (0.1% BSA, 50% Glycerol, 10 mM Tris, 100 mM NaCl) and viral stocks were stored at −80°C for long-term storage. For viral infections, cultures were grown to 60%–70% confluence and washed with non-serum DMEM once, and then exposed to DMEM containing adenovirus (20 m.o.i.) for 1 h at 37°C. This medium was replaced with serum-containing DMEM and cells were cultured for additional different time courses.
For siRNA treatment, mFoxA1 (HNF-3α) siRNA (sc-37931), mShh siRNA (sc-37205), and control siRNA (sc-37007) were purchased from Santa Cruz Biotechnology, Inc. (Santa Cruz, CA). The siRNA transfection was performed according to the manufacturer's instructions.
Isolation of RNA, RNase protection assays, and reverse transcription polymerase chain reaction
mRNA or total RNA isolated from cell cultures were routinely used for RNase protection assays (RPA) or reverse transcription polymerase chain reaction (RT-PCR), respectively. mRNA was isolated by using the Fast Track mRNA isolation kit (Invitrogen, Carlsbad, CA) and total RNA was prepared by using RNAprep Pure Cell/Bacteria Kits (Tiangen Biotech, China), following the manufacturer's instructions.
For RPA, antisense RNA probes were generated by transcribing specific cDNA fragments cloned in Bluescript KSII vector using T7 RNA polymerase as described previously [32]. The following cDNAs were transcribed: rat FoxA1 (cDNA 1,388 bp–1,581 bp), mouse Shh (cDNA 604 bp–855 bp), mouse Neurofilament-1 (NF-1 cDNA 783 bp–1,083 bp), mouse glyceraldehyde-3-phosphate dehydrogenase (GAPDH; Ambion, Foster City, CA). Hybridization reactions were carried out using the RPA II kit distributed by Ambion (Foster City, CA). For each reaction, 5 μg of oligo(dT)-selected mRNA was hybridized in hybridization buffer (80% deionized formamide, 100 mM sodium citrate, pH 6.4, 300 mM sodium acetate, pH 6.4, 1 mM EDTA) with 1 × 10⁵ cpm of antisense RNA probe for 18 h at 45°C, following the recommendations of the kit producer. After RNase treatment, the resistant RNAs were analyzed on 5% polyacrylamide/8 M urea gels. Autoradiography of gels was performed with Kodak XAR film and Fisher Biotech L-Plus screens at −80°C for 1–4 days.
For RT-PCR, the cDNAs were synthesized using RevertAid™ First Strand cDNA Synthesis Kits (Fermentas, Vilnius, Lithuania) with total RNA as templates. PCR amplification was performed with Taq DNA polymerase (Promega, Madison, WI) with following sense (S) and antisense (AS) primers, annealing temperature (T a) and number of PCR cycles (N): mNestin-S, 5′-TCG ATG ACC TGG AGG GAC AAC-3′ and mNestin-AS, 5′-AAA TGC CTT GGG TCC TCT AGC C-3′ (T a: 62.6°C, N: 27); mShh-S, 5′-CAA TCT GCA ACG GAA GCG AG-3′ and mShh-AS, 5′-GTG CGC TTT CCC ATC AGT TCC-3′ (T a: 64°C, N: 35); mTubulin βIII-S, 5′-GAT GAT GAC GAG GAA TCG GAA G-3′ and mTubulin βIII-AS, 5′-AGA GGT GGC TAA AAT GGG GAG G-3′ (T a: 58.2°C, N: 28); mGFAP-S, 5′-CAA GAG ACA GAG GAG TGG TAT CGG-3′ and mGFAP-AS, 5′-AGG AAT GGT GAT GCG GTT TTC-3′ (T a: 59.6°C, N: 35); mFoxA1-S, 5′-AGA CAT TCA AGC GCA GCT ACC-3′ and mFoxA1-AS, 5′-GGG TCC TTG CGA CTT TCT G-3′ (T a: 57.5°C, N: 30); rFoxA1-S, 5′-TAC GCT CCG TCC AAT CTG GG-3′ and rFoxA1-AS, 5′-TGA GTG GCG AAT GGA GTT CTG-3′ (T a: 63.6°C, N: 30); and mCyclophilin-S 5′-GGC AAA TGC TGG ACC AAA CAC-3′ and mCyclophilin-AS 5′-TTC CTG GAC CCA AAA CGC TC-3′ (T a: 57.5°C, N: 22).
Western blotting, immunostaining, and flow cytometry
To measure protein levels, cell lysates were resolved by denaturing gel electrophoresis before electrotransfer to Protran nitrocellulose membrane. The membrane was subjected to western blot analysis with antibodies against proteins of interest as described previously [33]. The signals from the primary antibody were amplified by HRP-conjugated anti-mouse or anti-rabbit IgG (Bio-Rad, Hercules, CA), and detected with Enhanced Chemiluminescence Plus (ECL-plus; Amersham Pharmacia Biotech, Piscataway, NJ). The following antibodies and dilutions were used for western blotting: rabbit anti-FoxA1 (1:2,000; abcam ab23738), rabbit anti-Nanog (1:2,500; Chemicon AB9220), rabbit anti-Nestin (1:2500; Chemicon AB5922), mouse anti-Tubulin βIII (1:1,000; Chemicon MAB1637), mouse anti-GFAP (1:500; Beyotime AG259), rabbit anti-Shh (1:200; Santa Cruz SC-9024), and mouse anti-β-Actin (1:20,000; Sigma AC-15).
For immunostaining, cells at the certain time point were seeded on an 8-well chamber slide (Nalge Nunc International, Naperville, IL). After 24 h, cells were subjected to immunostaining. In brief, cells were fixed with 10% formalin (Sigma, St. Louis, MO), permeabilized with 0.2% Triton X-100, and blocked with PBS containing 1% bovine serum albumin. The mouse anti-Tubulin βIII (1:100; Chemicon MAB1637) was incubated with the cells for overnight at 4°C and then incubated with secondary chicken anti-mouse IgG-Texas Red (1:100; Santa Cruz). Cells were counterstained with 4′,6′-diamidino-2-phenylindole (DAPI) and images were captured using a TE2000 microscope (Nikon, Tokyo, Japan).
For flow cytometry, cells at the certain time point were dissociated with 0.025% trypsin and 107 cells were incubated with 10 μL of antibody against protein of interest in 100 μL buffer (0.5% BSA, 2 mM EDTA, 1× PBS) for 10 min at 4°C. The cells were washed by adding 2 mL buffer and centrifuged 10 min (300g) and resuspended in 500 μL buffer. Samples were analyzed for flow cytometry on FACSCalibur (BD Biosciences, Mountain View, CA) with Prominin-1-PE antibody (Miltenyi Biotec 130-092-334).
Chromatin immunoprecipitation assays, electrophoretic mobility shift assays, and cotransfection assays
Chromatin immunoprecipitation (ChIP) assays were performed following published methods with additional modifications [34]. In brief, sample cells were cross-linked in situ by addition of 37% formaldehyde (Fisher Scientific, Hampton, NH) to a final concentration of 1% (w/v) and incubated at 25°C for 15 min with gentle swirling. The cross-linking reaction was stopped by the addition of 2.5 M glycine to a final concentration of 0.125 M followed by an additional 5 min of gentle swirling. Cells were washed once with 4°C sterile PBS and collected by 2,000 rpm centrifugation for 10 min. The cell pellet was then resuspended in a 2× pellet volume of SDS lysis buffer (1% SDS, 10 mM EDTA, 50 mM Tris, pH 8.1) and placed on ice for 10 min. The resulting extract was sonicated on ice using a Scientz-IID Sonicator (Scientz, China) fitted with a 3-mm stepped micro-tip for total 8 min (3-s sonication plus 8-s pulse) at a power setting of 30%. At this stage, the processing of all experimental samples and total input was carried out according to the Upstate Cell ChIP Assay Protocol (catalog # 17-295). For immunoprecipitation, 2 μg of rabbit anti-FoxA1 (abcam ab23738) or rabbit control IgG anti-cdc25B (Santa Cruz SC-326) was added to 400 μL precleared and clarified samples, which were incubated at 4°C with rotation for 12–16 h and washed according to Upstate ChIP Assay Protocol. Cross-links were reversed on all samples, including 20% input, by addition of 100 μL TE (1 mM EDTA, 10 mM Tris–HCl, pH 7.4) containing 10 μg of RNaseA, Proteinase K (10 μg), and NaCl (4 μL of 5 M solution). Samples were digested for 16 h at 65°C. DNA was extracted from the digested samples using PCR purification columns following manufacturer's instructions (Tiangen Biotech, China) to final volume 50 μL. Then 2.5 μL of the ChIP DNA sample or 5% total input was used in PCR with the following primers: mShh promoter −496 bp forward: 5′-GGG GAT GGG GTG TAA ATA AGG C-3′ and mShh promoter −307 bp backward: 5′-TTT GTG CTC AGG GCT GCT TC-3′ (T a: 62°C, N: 35).
Nuclear proteins were extracted from cells described previously [35]. Binding of FoxA1 to DNA oligonucleotides was initiated by mixing the following components: 1 ng [γ-32P]ATP-labeled DNA oligonucleotides fragment, binding buffer [20 mM Tris–HCl (pH 7.5), 5% glycerol, 40 mM KCl, 1 mM MgCl2, 0.5 mM DTT, 1 mM EDTA], 3 μg poly(dI-dC), and 10 μg of nuclear extracts. One microliter of rabbit anti-FoxA1 antiserum or 100-fold of unlabeled probe was added in a total reaction mixture of 30 μL. After 30 min incubation at room temperature, the samples were loaded onto 5% polyacrylamide gel. Electrophoresis was performed for 2 h at 150 V. The gel was subjected to autoradiography with Kodak XAR film and Fisher Biotech L-Plus screens. The following DNA oligonucleotide was used: mouse Shh promoter −486 to −462 bp, 5′-TGT AAA TAA GGC AAA CAG GAG GGA G-3′.
The mouse −600 to +28 bp Shh promoter region was PCR amplified from mouse genomic DNA with the following primers: mShh −600 XhoI: 5′-TCT CTC GAG TGG CCA CCT GTG ATT ATC and mShh +28 XhoI: 5′-TCT CTC GAG TAA ATG GTA GCA AGG CTG, and cloned into the corresponding XhoI site of the pGL3 basic Luciferase vector (Promega, Madison, WI). P19 cells were transfected with 200 ng of either CMV-FoxA1 cDNA or CMV empty expression vectors, 1,600 ng of the Luciferase reporter constructs containing −600 bp mouse Shh promoter, and 20 ng of pRL-CMV loading control Luciferase reporter plasmid (Promega) by Fugene6 transfection reagent (Roche, Nutley, NJ). Protein extracts were prepared from transfected P19 cells at 24 h following DNA transfection and the Dual-Luciferase Assay System (Promega) was used to measure Luciferase enzyme activity following the manufacturer's instructions.
Statistical analysis
We used Microsoft Excel Program to calculate SD and statistically significant differences between samples with Student's t-test. The asterisks in each graph indicate statistically significant changes with P values calculated by Student's t-test: *P < 0.05, **P ≤ 0.01 and ***P ≤ 0.001. P values <0.05 were considered statistically significant.
Results and Discussion
P19 EC cells were known to differentiate to neural cells by RA treatment when aggregated to form embryoid bodies [16,18] and typical neural cell morphology appeared at 9 days after RA treatment (Fig. 1A and 1B). We confirmed that RA-induced P19 cell neural differentiation displayed at least 3 phases: the first phase in which P19 cells lost their pluripotency, marked by immediate disappear of the expression of the pluripotency marker Nanog at RA induction (Fig. 1C); the second phase in which certain percentage of P19 cells committed to the neural differentiation and neural stem-like cells appeared, evidenced by elevated expression of neural stem cell marker Nestin that peaked at day 3 after RA treatment (Fig. 2A) and increased cell populations positive with neural stem cell surface marker Prominin-1 (homolog of human CD133) (Supplementary Fig. 1; Supplementary materials are available online at

Retinoic acid (RA)-induced neural differentiation of pluripotent P19 cells correlates with decreased expression of Nanog and increased expression of Tubulin βIII and GFAP. (
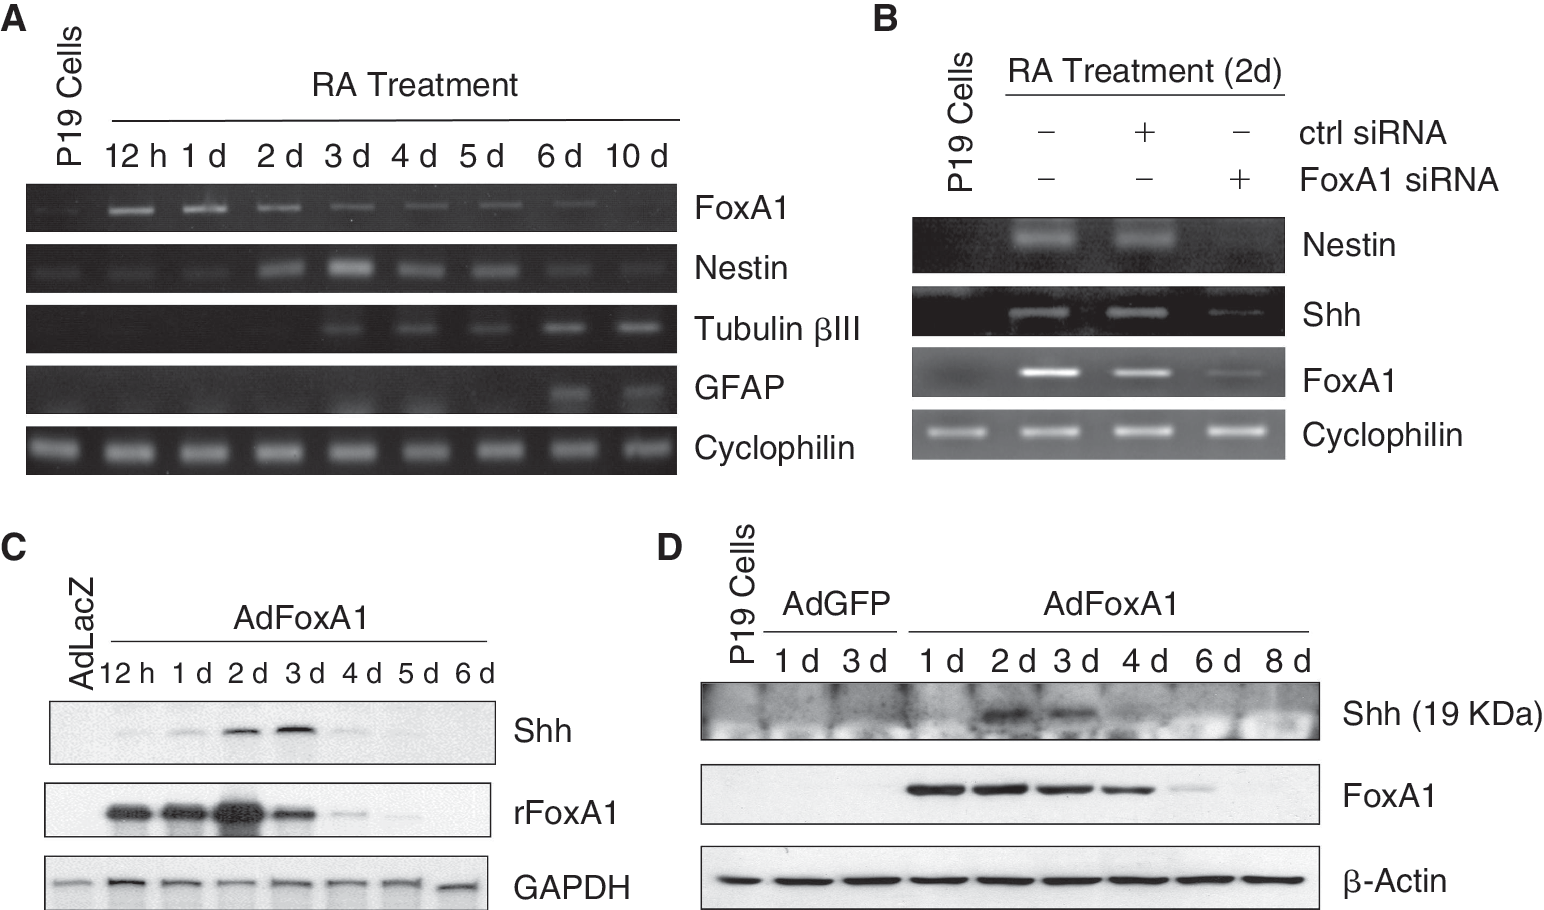
FoxA1 is induced at early time points during neural differentiation of P19 cells and stimulates Shh expression. (
FoxA1 is induced at early time points during neural differentiation of P19 cells and stimulates Shh expression
We first confirmed the published data that FoxA1 was induced during RA-induced P19 cell neuronal differentiation [26]. Consistent with the previous work, we found that FoxA1 expression was undetectable in P19 pluripotent cells and its expression reached the peak between day 0.5 and day 1 following RA treatment and decreased continuously to undetectable level at day 6 (Fig. 2A), suggesting the induction of FoxA1 was one of the early events during differentiation of the pluripotent cells and might participate in the commitment of P19 cells to neural differentiation. The induction of FoxA1 expression was followed by the elevation of Nestin expression, which was detectable at day 2 and peaked at day 3 post RA treatment (Fig. 2A), implicating that FoxA1 was involved in the progression of P19 cell differentiation from pluripotent status to neural stem-like cell status. This idea was further confirmed by FoxA1 knockdown experiments, in which the transfection of FoxA1-specific siRNA in P19 cells resulted in prevention of Nestin induction at day 2 during P19 cell neural differentiation (Fig. 2B). Furthermore, knockdown of FoxA1 also resulted in prevention of sonic hedgehog (Shh) induction during P19 cell neural differentiation (Fig. 2B). Shh belongs to the Hedgehog Family of secreted glycoproteins and is the only Hedgehog member reported to be expressed in the mammal central nervous system [36]. There are extensive published data demonstrating that Shh signaling is required for the differentiation, patterning, survival, and proliferation of neural cells at different stages during embryogenesis (reviewed in ref. 37). In adult central nervous system, Shh signaling was found recently to be required for the formation of adult neural stem cells in the hippocampal dentate gyrus [38]. In a cell culture model of neurogenesis with differentiated ES cells, Shh was detected to be expressed exclusively by the neural stem cells themselves and acted as a mitogen and survival factor during early ES cell neurogenesis [39]. Consistent with its roles in neurogenesis, Shh was stimulated during RA-induced P19 cell neural differentiation, and knockdown of Shh resulted in prevention of Nestin induction with no effect on FoxA1 induction (Supplementary Fig. 2), implicating that Shh signals were necessary for neural stem-like cell formation and FoxA1 was one of the upstream events of Shh during P19 cell neural differentiation.
In order to determine the role of FoxA1 in neural differentiation of P19 cells, we used the adenovirus vector AdFoxA1 constructed with rat FoxA1 cDNA to mediate the induction of FoxA1 in the cells without RA treatment. Control adenovirus AdLacZ infections detected by β-gal enzyme staining with the X-gal substrate determined that almost 100% of the cells were infected with the viral dosage at 20 pfu/cell (Supplementary Fig. 3). AdFoxA1 infection of P19 cells at a multiplicity of 20 pfu/cell resulted in the elevation of functional exogenous FoxA1 expression (Supplementary Fig. 4). We found that elevated expression of FoxA1 alone in P19 cells through AdFoxA1 infection was able to activate Shh transcription without RA treatment (Fig. 2C), suggesting that Shh was one of the important target genes of FoxA1 during neural differentiation. The induction of Shh by FoxA1 also happened in P19 cell aggregates (embryonic bodies) (Supplementary Fig. 5). When BALB/3T3 fibroblasts were infected with AdFoxA1, the FoxA1 overexpression was not able to induce Shh mRNA (Supplementary Fig. 5), implicating that the Shh stimulation by FoxA1 was pluripotent stem cell type-specific. The Shh protein was found to undergo autocleavage to generate secreted 19 kDa peptide to accomplish its functions [40,41]. We found that the levels of Shh 19 kDa peptide were induced at day 2 and day 3 post AdFoxA1 infection in P19 cells, measured by western blotting with Shh-specific antibody (Fig. 2D).
FoxA1 binds to and stimulates Shh promoter
To test whether FoxA1 bound to Shh promoter and directly stimulated Shh transcription, we scanned −3 kb promoter region of mouse Shh gene with the FoxA DNA-binding consensus sequence, and found a tandem FoxA putative binding site between −486 and −462 bp (5′-TGT AAA TAA GGC AAA CAG GAG GGA G-3′) of the Shh promoter. We first used ChIP assays to test whether FoxA1 bound to endogenous Shh promoter at physiological or FoxA1 overexpressed conditions. The chromatin of P19 cells, RA-induced (2d) P19 cells, or AdFoxA1-infected (2d) P19 cells was cross-linked, sonicated to DNA fragments of 500 to 1,000 nucleotides in length, and then immunoprecipitated (IP) with either rabbit FoxA1 antibody or rabbit Cdc25B antibody (control). The amount of promoter DNA associated with the IP chromatin was quantitated by RT-PCR with primers specific to Shh promoter region −496 bp to −307 bp. Compared to P19 cell samples that showed no FoxA1-specific binding, both RA treatment and AdFoxA1 infection in P19 cells resulted in increased binding activity of FoxA1 on this Shh promoter region (Fig. 3A). These results confirmed that FoxA1 bound directly to endogenous Shh promoter regions.
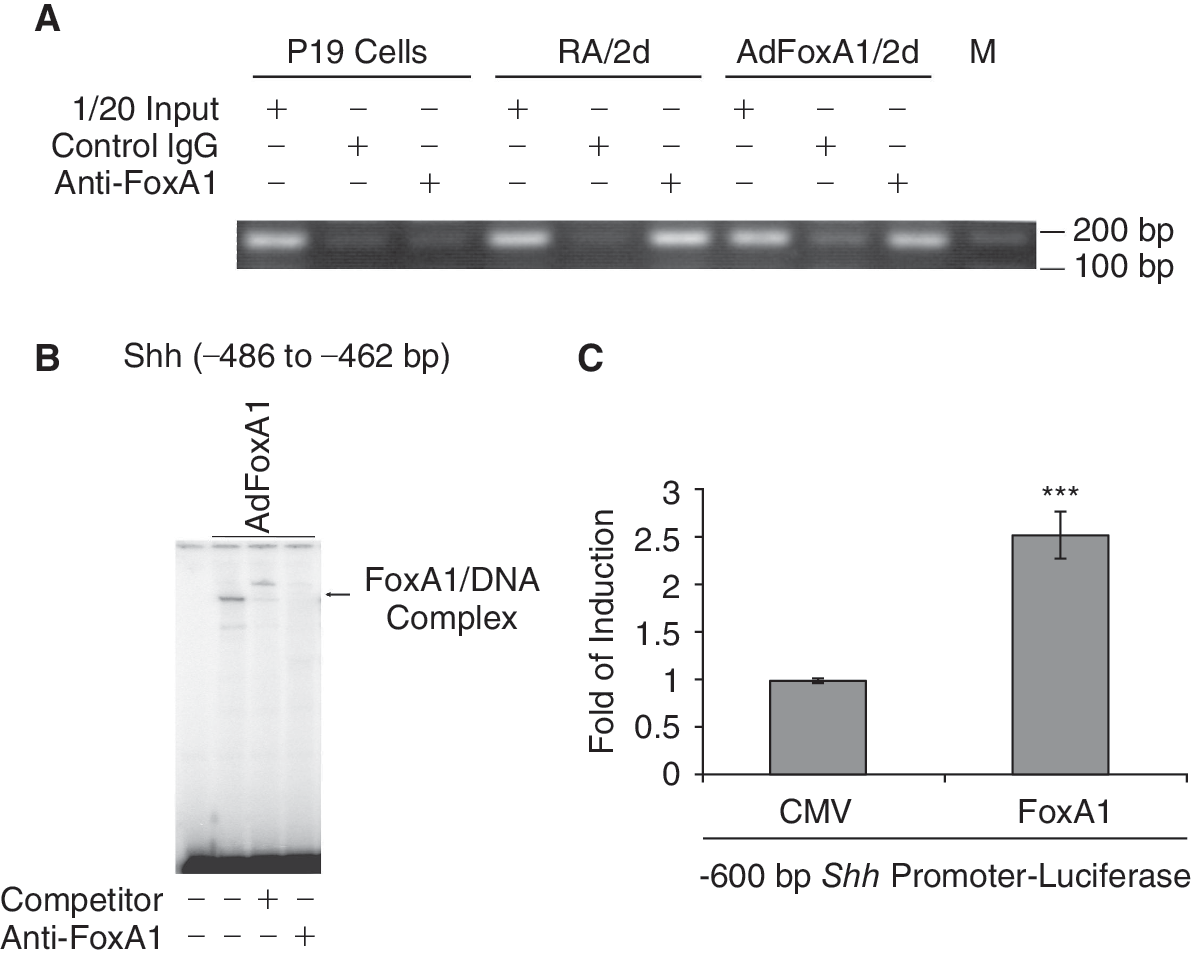
FoxA1 binds to and stimulates Shh promoter. (
We synthesized a DNA oligo from the mouse Shh promoter sequence position −486 to −462 bp. Gel shift assays were performed with the 32P-labeled DNA oligo probe and nuclear extracts prepared from AdFoxA1-infected P19 cells at 24-h post-infection. We found that FoxA1 and the DNA oligo of the Shh promoter −482 to −462 bp region formed a FoxA1/DNA complex and the addition of FoxA1-specific antibody or the unlabeled DNA oligo competitor disrupted the formation of the complex (Fig. 3B), suggesting that FoxA1 bound to Shh promoter specifically. To test whether FoxA1 activated Shh promoter, a −600 bp mouse Shh promoter-Luciferase reporter plasmid was constructed and transfected into P19 cells with the CMV-FoxA1 expression vector or a CMV empty expression vector. Protein lysates were prepared at 24 h following transfection, and used to measure dual Luciferase enzyme activity. Cotransfection of FoxA1 expression vector caused an increase in Shh promoter activity (Fig. 3C). Together, these results demonstrated that the Shh gene is a direct transcriptional target of FoxA1.
Elevation of FoxA1 expression alone promotes pluripotent P19 cells to become neural stem-like cells and results in the appearance of neural cells
To test whether elevation of FoxA1 expression alone in P19 cells stimulated neural differentiation, we first measured mRNA levels of Nestin in AdFoxA1-infected P19 cells. We prepared total RNA samples from AdFoxA1 or control AdGFP virus infected P19 cells and performed RT-PCR, which showed that mRNA levels of neural stem cell marker Nestin were increased after AdFoxA1 infection (Fig. 4A), implicating that overexpression of FoxA1 alone promoted pluripotent P19 cells to become neural stem-like cells. We also observed that the protein levels of Nestin were increased at day 3 post AdFoxA1 infection in P19 cells (Fig. 4B, Nestin panel). Next, we measured the protein levels of Nanog post AdFoxA1 infection to test whether increased levels of FoxA1 affected the pluripotency of P19 cells. We found that Nanog protein levels were decreased at day 1 and day 3 after FoxA1 overexpression (Supplementary Fig. 6, Nanog panel), suggesting that elevated expression of FoxA1 in P19 cells resulted in the loss of pluripotency partially. To test whether increased levels of FoxA1 alone in P19 cells reached final neural differentiation, we first measured the expression of Tubulin βIII and observed induction of this neuronal marker at day 3 post AdFoxA1 infection (Fig. 4C). Interestingly, the induction of Tubulin βIII also started at day 3 during RA-induced P19 differentiation (Fig. 2A, Tubulin βIII panel). Then, we checked the expression of neural cell marker NF-1 [42], whose expression was elevated at late time points during RA-induced neural differentiation of P19 cells (Supplementary Fig. 7). P19 cells were infected with AdFoxA1 or control adenovirus and mRNAs were prepared at various intervals following infection. The mRNA levels of NF-1, FoxA1, and GAPDH were measured by RNase protection assays with antisense mouse NF-1(68 kDa), rat FoxA1, or mouse GAPDH RNA probe. AdFoxA1 infection led to increased expression of FoxA1, which peaked at day 2 post viral infection in P19 cells, and at day 5 the expression of FoxA1 was decreased dramatically (Fig. 4C, rFoxA1 panel). The induction of NF-1 occurred at day 5 (3.6-fold compared to AdLacZ-infected sample) post viral infection (Fig. 4C, NF-1 panel), confirming that FoxA1 alone could induce P19 cell final neural differentiation.

Elevation of FoxA1 expression alone in P19 cells stimulates expression of Nestin, Tubulin βIII, and NF-1. Increased levels of FoxA1 alone in P19 cells stimulated Nestin mRNA (
Elevated levels of FoxA1 increase the population of neuronal cells during RA-induced P19 cell differentiation
During RA-mediated P19 cell differentiation, only certain percentage of P19 cells were induced to neural stem cells and finally differentiated to mature neural cells (see above). Because FoxA1 was found in this study to stimulate the expression of Shh and Nestin, and promote pluripotent P19 cells to become neural stem-like cells, we tested whether overexpression of FoxA1 at the beginning of RA-induced P19 cell differentiation would enhance the direction of neural differentiation. P19 cells were infected with AdFoxA1 or AdGFP at a multiplicity of 20 pfu/cell. One day post-infection, the infected cells were treated with RA according to neural differentiation protocol. Immunostaining of Tubulin βIII was performed at day 6 after RA treatment. We found that AdFoxA1-infected samples showed increased levels of Tubulin βIII immunostaining signal compared to the control samples (Fig. 5A–D). Western blotting with protein lysates isolated from P19 cells and samples mentioned above demonstrated that AdFoxA1 infection at the beginning of RA-induced P19 cell differentiation stimulated higher Tubulin βIII expression (2.3-fold) than control virus infection (Fig. 5E), suggesting that elevated levels of FoxA1 increased the population of finally differentiated mature neurons.
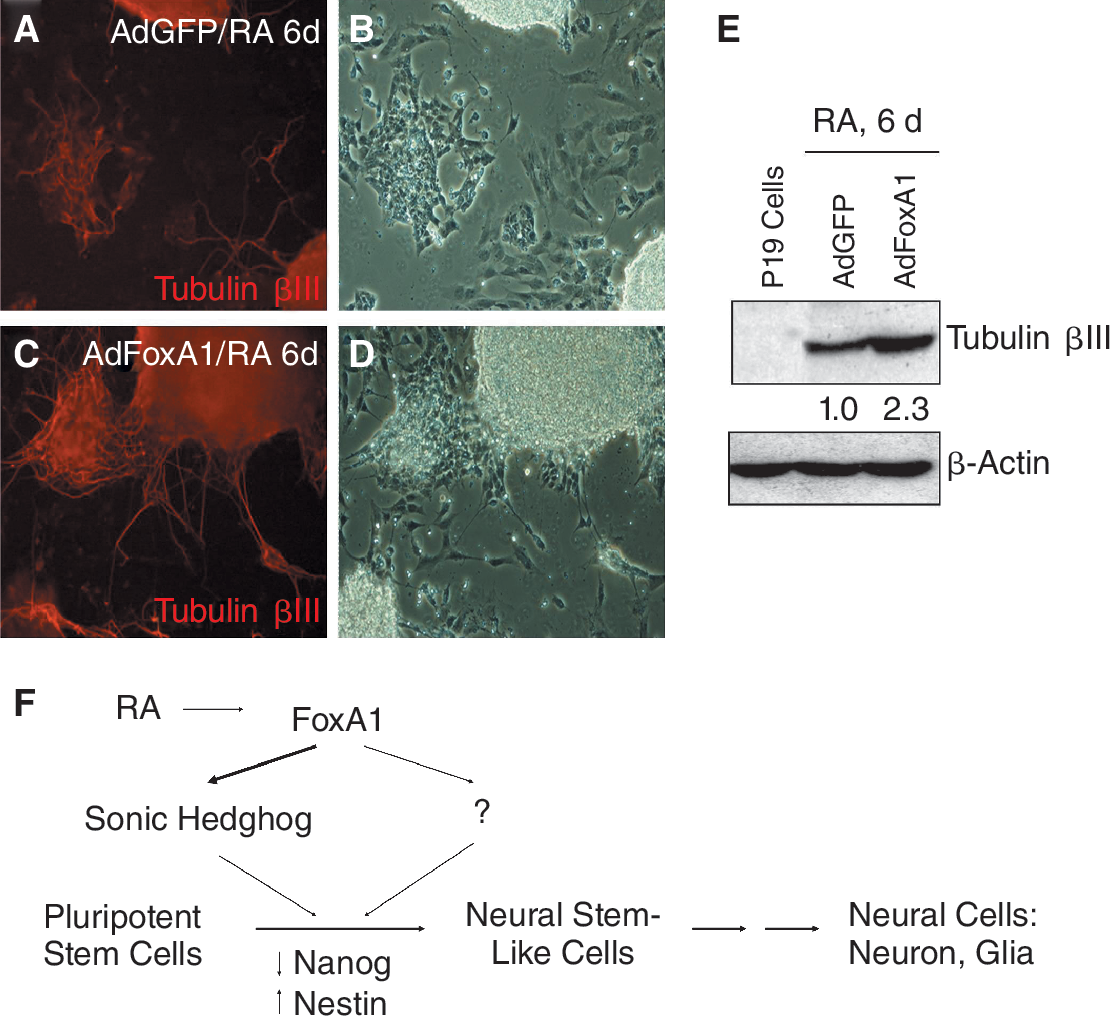
Elevated levels of FoxA1 increase the population of neural cells during retinoic acid (RA)-induced P19 cell differentiation. (
With the finding of this study, we determined the functions of FoxA1 in RA-induced neural differentiation of pluripotent stem cells (Fig. 5F). In response to RA treatment, pluripotent stem cells lose their pluripotency (decrease of Nanog) and first become neural stem-like cells, which express neural stem cell marker Nestin, and finally differentiate to neural cells (neuron, glia, etc.). Among the early genes induced by RA treatment in P19 cells, FoxA1 is activated by RA directly at the early stage of neural differentiation [26]. In this study, we have showed that increased levels of FoxA1 in pluripotent stem cells stimulate the expression of Shh and Nestin, suggesting that FoxA1 promotes pluripotent stem cells to become neural stem-like cells. Consequently, elevated levels of FoxA1 enhance the overall neural differentiation, evidenced by increased populations of neuronal cells at the late time point of differentiation. FoxA1 may also control the expression of other proteins that participate in RA-induced neural differentiation of pluripotent stem cells (not shown in this study). This is the first study established the biological roles of FoxA1 in stimulating neural differentiation of pluripotent stem cells.
Footnotes
Acknowledgments
This work was supported by Natural Science Foundation of China [grant numbers 30771096, 30871244 to Y.T.]; Hunan Natural Science Foundation of China [grant number 07JJ1006 to Y.T.]; the Ministry of Education of China [grant number NCET-06-0698 to Y.T.]; and the Ministry of Science and Technology of China [grant number SKLCBSC-2007-05 to Y.T.].
Author Disclosure Statement
No competing financial interests exist.
References
Supplementary Material
Please find the following supplemental material available below.
For Open Access articles published under a Creative Commons License, all supplemental material carries the same license as the article it is associated with.
For non-Open Access articles published, all supplemental material carries a non-exclusive license, and permission requests for re-use of supplemental material or any part of supplemental material shall be sent directly to the copyright owner as specified in the copyright notice associated with the article.