
Abstract
Multipotent stem/progenitor cells from bone marrow stroma (mesenchymal stromal cells or MSCs) were previously shown to enhance proliferation and differentiation of neural stem cells (NSCs) in vivo, but the molecular basis of the effect was not defined. Here coculturing human MSCs (hMSCs) with rat NSCs (rNSCs) was found to stimulate astrocyte and oligodendrocyte differentiation of the rNSCs. To survey the signaling pathways involved, RNA from the cocultures was analyzed by species-specific microarrays. In the hMSCs, there was an upregulation of transcripts for several secreted factors linked to differentiation: bone morphogenetic protein 1 (BMP1), hepatocyte growth factor (HGF), and transforming growth factor isoforms (TGFβ1 and TGFβ3). In both the hMSCs and the rNSCs, there was an upregulation of transcripts for Notch signaling. The role of TGFβ1 was verified by the demonstration that hMSCs in coculture increased secretion of TGFβ1, the rNSCs expressed the receptor, and an inhibitor of TGFβ signaling blocked differentiation. The role of Notch signaling was verified by the demonstration that in the cocultures hMSCs expressed a Notch ligand at sites of cell contact with rNSCs, and the rNSCs expressed the receptor, Notch 1. Increased Notch signaling in both cell types was then demonstrated by assays of transcript expression and by a reporter construct for downstream targets of Notch signaling. The results demonstrated that glial differentiation of the rNSCs in the cocultures was driven by increased secretion of soluble factors such as TGFβ1 by the hMSCs and probably through increased cell contact signaling between the hMSCs and rNSCs through the Notch pathway.
Introduction
N
The nonhematopoietic population of adult stem/progenitor cells from bone marrow referred to as mesenchymal stem cells or multipotent mesenchymal stromal cells (MSCs) were shown to produce therapeutic effects in numerous animal models of neurodegenerative diseases, including cerebral ischemia, Parkinson's disease, multiple sclerosis, spinal cord injury, and traumatic brain injury [5 –10]. Given their ability to home to multiple tissues, including the CNS, MSCs may be a viable means to stimulate the endogenous NSC population to assume a neuroprotective or neuroregenerative role. Indeed MSCs produce a large number of growth-stimulating factors, including neurotrophins in vitro and in vivo [11,12]. An intriguing recent observation was that following implantation into the hippocampi of immunodeficient mice, human MSCs (hMSCs) stimulated the proliferation and dorsal migration of endogenous BrdU-labeled NSCs [12 –14]. Despite limited survival of the MSCs, BrdU-labeled NSCs persisted for up to 30 days and expressed markers for differentiated neurons, astrocytes, and oligodendrocytes. Subpopulations of BrdU-labeled NSCs also expressed potentially beneficial trophic factors, including ciliary neurotrophic factor, neurotrophin-4/5, nerve growth factor, and vascular endothelial growth factor.
Here we examined cocultures of hMSCs and rat NSCs (rNSCs) for potential mechanisms underlying the effects on NSCs seen in vivo. Our data suggest that hMSCs stimulated glial differentiation of rNSCs in part through increased secretion of soluble factors such as transforming growth factor β (TGFβ) and possibly in part by cell–cell contact-mediated effects, including increased Notch signaling in both the hMSCs and the rNSCs.
Materials and Methods
Preparation and culture of hMSCs
hMSCs from normal healthy donors were obtained from the Tulane Center for the Preparation and Distribution of Adult Stem Cells (
Preparation and culture of rNSCs
Cryopreserved adult rat hippocampal neural stem cells (NSCs) were obtained from Chemicon/Millipore. For cell expansion, frozen vials of approximately 1 × 10⁶ rNSCs were rapidly thawed and diluted dropwise with 9 mL optimal rNSC growth medium: 9 parts NeuroCult® NS-A Basal Medium (Stemcell Technologies) to 1 part NeuroCult Proliferation Supplements (Stemcell Technologies) with 0.0002% Heparin (Stemcell Technologies); 20 ng/mL recombinant human epidermal growth factor (EGF; Stemcell Technologies); and 10 ng/mL recombinant human basic fibroblast growth factor (FGF-b; Stemcell Technologies). Cells were pelleted, resuspended at 60,000 cells/mL in 20 mL optimal rNSC growth medium, and grown in a T-175 culture flask (Nunc) at 37°C with 5% humidified CO2. Half of the medium was replaced with fresh medium every other day in culture. The nonadherent cells gradually generated neurospheres and were passaged after 4–7 days by gentle pipetting of the neurospheres and medium to dissociate the spheres. Cells and medium were transferred to a collection tube, centrifuged, resuspended in optimal rNSC growth medium at 60,000 cells/mL, and returned to a flask. For the coculture experiments, the cultures were recovered after 2–4 days. To confirm the differentiation potential of the rNSCs, cells were plated at 5,000 cells/cm2 on glass coverslips precoated with Poly-D-lysine/laminin (BD Biosciences) and incubated in rNSC differentiation medium: 9 parts NeuroCult NS-A Differentiation Medium (Stemcell Technologies) to 1 part NeuroCult Differentiation Supplements (Stemcell Technologies). Cells were fixed for immunostaining after 4–7 days in culture.
Coculture experiments
Passage-2 hMSCs suspended in complete hMSC medium (20 mL) were plated at 900–2,000 cells/cm2 on 148-cm2 culture dishes or glass chamber slides (Sigma-Aldrich) coated with 10 μg/mL poly-L-ornithine (Sigma-Aldrich)/5 μg/mL laminin (Sigma-Aldrich) or on glass coverslips precoated with Poly-
Immunocytochemistry
After 4 days of incubation, cells on coverslips or in chamber slides were fixed with 4% paraformaldehyde in PBS for 15 min and then washed twice with PBS. Cells were permeabilized with 0.4% Triton X-100 (Sigma-Aldrich) and nonspecific binding was blocked by a 1 h incubation at room temperature in PBS containing 5% normal serum from the species in which the secondary antibody was raised and 0.4% Triton X-100. Slides were subsequently incubated over night at 4°C with the following primary antibodies diluted in blocking buffer: Mouse antinestin (clone 401; BD Bioscience, cat# 556309; 1:1,000) and rabbit anti-Sox2 (Thermo Scientific, cat# PA1-16968; 1:250) were used to stain neural stem/progenitors; rabbit anti-Ki67 (Novocastra, cat# NSL-Ki67p; 1:8,000) to stain proliferating cells; rabbit anti-glial fibrillary acidic protein (GFAP; Chemicon, cat# AB5804; 1:1,000 or Sigma-Aldrich, cat# G9269; 1:1,000) or mouse anti-GFAP (clone GA-5; Cell Signaling, cat# 3670; 1:500) to stain astrocytes; mouse anti-oligodendrocytes (RIP, clone NSC-1; Chemicon, cat# MAB1580; 1:20,000) and mouse anti-2′,3′-cyclic nucleotide 3′-phosphodiesterase (2′,3′-cyclic nucleotide 3′-phospho-diesterase [CNPase], clone 11-5B; Sigma-Aldrich, cat# C5922; 1:100) to stain oligodendrocytes; mouse anti-β-III tubulin (TUJ1; Covance, Cat# MMS-435P; 1:1,000) or rabbit anti-β-III tubulin (Abcam, cat# AB18207; 1:2,000) to stain neurons; rabbit anti-Jagged 1 (Abcam, cat#Ab7771; 1:200) and goat anti-Notch 1 (R&D Systems, cat# AF1057; 1:100) to stain Notch signaling proteins. After PBS washes, coverslips were incubated with flourescent dye-conjugated secondary antibodies for 1 h at room temperature. Secondary antibodies used were Alexa-conjugated goat anti-mouse, goat anti-rabbit, donkey anti-goat, or donkey anti-rabbit antibodies (Invitrogen; 1:1,000). After final washes in PBS, coverslips were mounted onto glass slides (Superfrost Plus Microscope Slides; Fisher Scientific) with a mounting medium containing DAPI to label nuclei (Vectashield, Vector Laboratories). Cells were observed with a spinning disk confocal microscope (Olympus BX51-DSU) equipped with a CCD camera (Hamamatsu C9100 EM-CCD; MBF Bioscience) and fluorescent images were acquired using Slidebook 4.2 software (Intelligent Imaging Innovations). Cells were counted in a minimum of 3 frames at either 100 × or 200 × magnification to survey at least 200 total cells per condition. A minimum of at least 3 independent cultures were analyzed for each marker counted.
Western blotting
After 4 days in culture, cells were harvested with trypsin/EDTA, resuspended in PBS, and sorted into GFP+ or GFP− populations (Vantage SE cell sorter; Becton-Dickinson). Cells were lysed using NP40 cell lysis buffer (BioSourse/Invitrogen) with protease inhibitors (Roche) and phosphatase inhibitors (eBioscience, San Diego, CA) for 30 min at 4°C with frequent vortexing. The samples were centrifuged at 18,000 g for 10 min and the supernatants were realiquoted and assayed for total protein content (DC protein kit; Bio-Rad). One microgram of total protein per lane was electrophoresed on a 4%–12% BisTris NuPage Gel (Invitrogen). Proteins were electrophoretically transfered to a polyvinylidene fluoride (PVDF) membrane (Invitrogen) and then blocked with 5% milk (Bio-Rad) in Tris buffered saline containing 0.1% tween-20 (TBST). Membranes were probed overnight in 2.5% milk in TBST with primary antibodies against GFAP (clone GA-5; Sigma-Aldrich, cat# G3893; 1:500), β-III tubulin (Abcam; cat# AB18207 1:1000), TGFβ receptor I (Santa Cruz, Cat# SC9048; 1:200), TGFβ receptor II (Cell Signaling, Cat# 3713; 1:1,000), or β-actin (clone AC-15; Sigma-Aldrich, cat# A1978; 1:40,000). Membranes were washed and incubated for 1 h at room temperature with horseradish peroxidase-conjugated goat anti-mouse or goat anti-rabbit IgG secondary antibodies (Pierce; 1:1,000) diluted in 1% milk TBST solution. Membranes were then washed and exposed to a chemiluminescent substrate (SuperSignal West Femto Substrate; Pierce). Blots were observed by exposure to X-ray film (Biomax XAR, Fisher). For semiquantitative analysis, the volume (mean intensity × mm2) of each band was measured using Quantity One software (Bio-Rad). Percent expression was calculated using the following equation: (volume of GFAP/volume of β-actin) × 100. Three independent cultures were analyzed per condition.
Microarrays
Seven micrograms of total RNA extracted from cultures of hMSCs alone, rNSCs alone, or cocultures was used for assays on human (HG-U133 Plus 2.0) or rat (RG-230 2.0) arrays (Affymetrix) according to manufacturer's instructions. The scanned signal intensities were transferred to the dChip program for analysis [18,19].
Rat and human microarray data were filtered to identify genes that were either up- or downregulated due to coculture. To correct for cross-hybridization of rat mRNA to the human microarray or human mRNA to the rat microarray, genes were considered upregulated if they were (1) scored P (present) in the coculture data and were at least 2-fold higher (with 90% confidence) than in data from cultures of either cell type alone and (2) scored P in the alone culture of interest data and were at least 2-fold higher than in the opposite alone culture data (Fig. 2). This filtering resulted in 72 rat and 95 human genes (69 rat and 72 human nonredundant genes). Genes were considered downregulated if they were (1) scored P in the alone culture of interest data and were at least 2-fold lower in the coculture data, and were not (2) scored P in the opposite alone culture data and were not at least 2-fold higher than in the alone culture of interest data. This filtering resulted in 75 rat and 7135 human genes (75 rat and 5635 human nonredundant genes).
Enzyme-linked immunosorbent assays
Medium from 4-day cultures was collected and treated with protease inhibitors (Roche). Human TGFβ1 and hepatocyte growth factor (HGF) were assayed using commercial ELISA kits (TGFβ1 cat# DB100B and HGF cat# DHG00 Quantikine, R&D Systems) with samples standardized by volume. All samples were assayed in triplicate.
Real-time reverse transcription-polymerase chain reaction
After 4 days of incubation, cells were sorted by FACS as previously described. Cells were lysed and total RNA was isolated according to manufacturer's instructions (Rneasy Mini Kit, Qiagen). All RNA samples were DNase-treated. Primer sequences for hairy and enhancer of split (HES1, NM_024360.3), hairy and enhancer of split related with YRPW motif 1 (HEY1, XM_342216.3), and β-actin (NM_031144.2) were designed and synthesized commercially (Superarray Bioscience). Assays with primers for β-actin mRNA were used to normalize samples. First-strand cDNA synthesis and real-time reverse transcription-polymerase chain reaction (RT-PCR) were performed (RT2 First Strand Synthesis Kit, RT2 qPCR Primer Assays, Superarray Bioscience). One microgram total RNA was used per sample, and amplification was performed using an automated instrument (Model 7900; Applied Biosystems). For all RT-PCR assays RNA was isolated from 2 independent experiments. Samples were assayed in triplicate.
Luciferase reporter assay
Notch signaling was monitored using a reporter construct for the recombination signal binding protein for immunoglobulin kappa J region (RBP-Jk) protein (Cignal RBP-Jk) Reporter Kit; Superarray Bioscience). rNSCs were transfected with a 40:1 mixture of an inducible reporter construct encoding the firefly luciferase gene under control of the RBP-Jk transcriptional response element (sequence: CGTGGGAA) and a constitutive reporter construct encoding the renilla luciferase gene under control of a minimal (m) cytomegalovirus (CMV) promoter. Approximately 5 × 10⁵ rNSCs in a 24-well plate were transfected with 1000 ng of the nucleic acid mixture for 24 h using a transfection reagent (SureFECT; Cignal RBP-Jk Reporter Kit, Superarray Bioscience). At the same time, hMSCs were plated into 96-well cell culture plates at 1,000 cells/cm2 in hMSC medium for coculture experiments. Following 1 day to allow for cell adherence, the hMSC cultures were washed with PBS and overlaid with 2,000 transfected rNSCs/cm2 in complete rNSC medium. After 24 h, cells were lysed and assayed for luciferase activity using an automated instrument (FLUOstar OPTIMA; BMG Labtech) and commerical reagents (Dual-luciferase Reporter Assay System; Promega). Renilla luciferase activity was used to normalize RBP-Jk-responsive firefly luciferase activity. For all reporter assays, samples were assayed in triplicate.
Statistical analysis
Statistical significance was evaluated between 2 groups using Student's t-test. RT-PCR and luciferace reporter assay data were compared by 1-way ANOVA with post hoc parwise comparisons using Tukey's test. All error bars represent standard deviations. P values <0.05 were considered statistically significant.
Results
hMSCs drive the glial differentiation of rat NSCs
In initial experiments, the phenotype of rNSCs cultured in optimal growth medium as a monolayer was established by immunocytochemistry (ICC) (Supplementary Fig. S1, available online at
To investigate cellular signaling, rNSCs were cocultured with GFP+ hMSCs in the optimal rNSC growth medium. After 4 days of coculture, sub-populations of the rNSCs differentiated into astrocytes, oligodendrocytes, and neurons as indicated by a marked increase in GFP− cells expressing GFAP, RIP, and β-III tubulin (Fig. 1A). Astrocytes and a few neurons were widely dispersed in cultures, and positive antibody staining was typically peri-nuclear. Positively stained oligodendrocytes were observed more frequently than the other cell types and were typically seen as clusters of cells in culture. The undifferentiated GFP− rNSC typically had characteristic small nuclei and soma, whereas the GFP+ hMSCs typically demonstrated large, fibroblast-like morphology. The GFAP+ astrocytes demonstrated thin, multipolar processes extending from the central cell body, the RIP+ oligodendrocytes large cell bodies with numerous shorter processes, and the β-III tubulin+ neurons a single far-reaching extension.
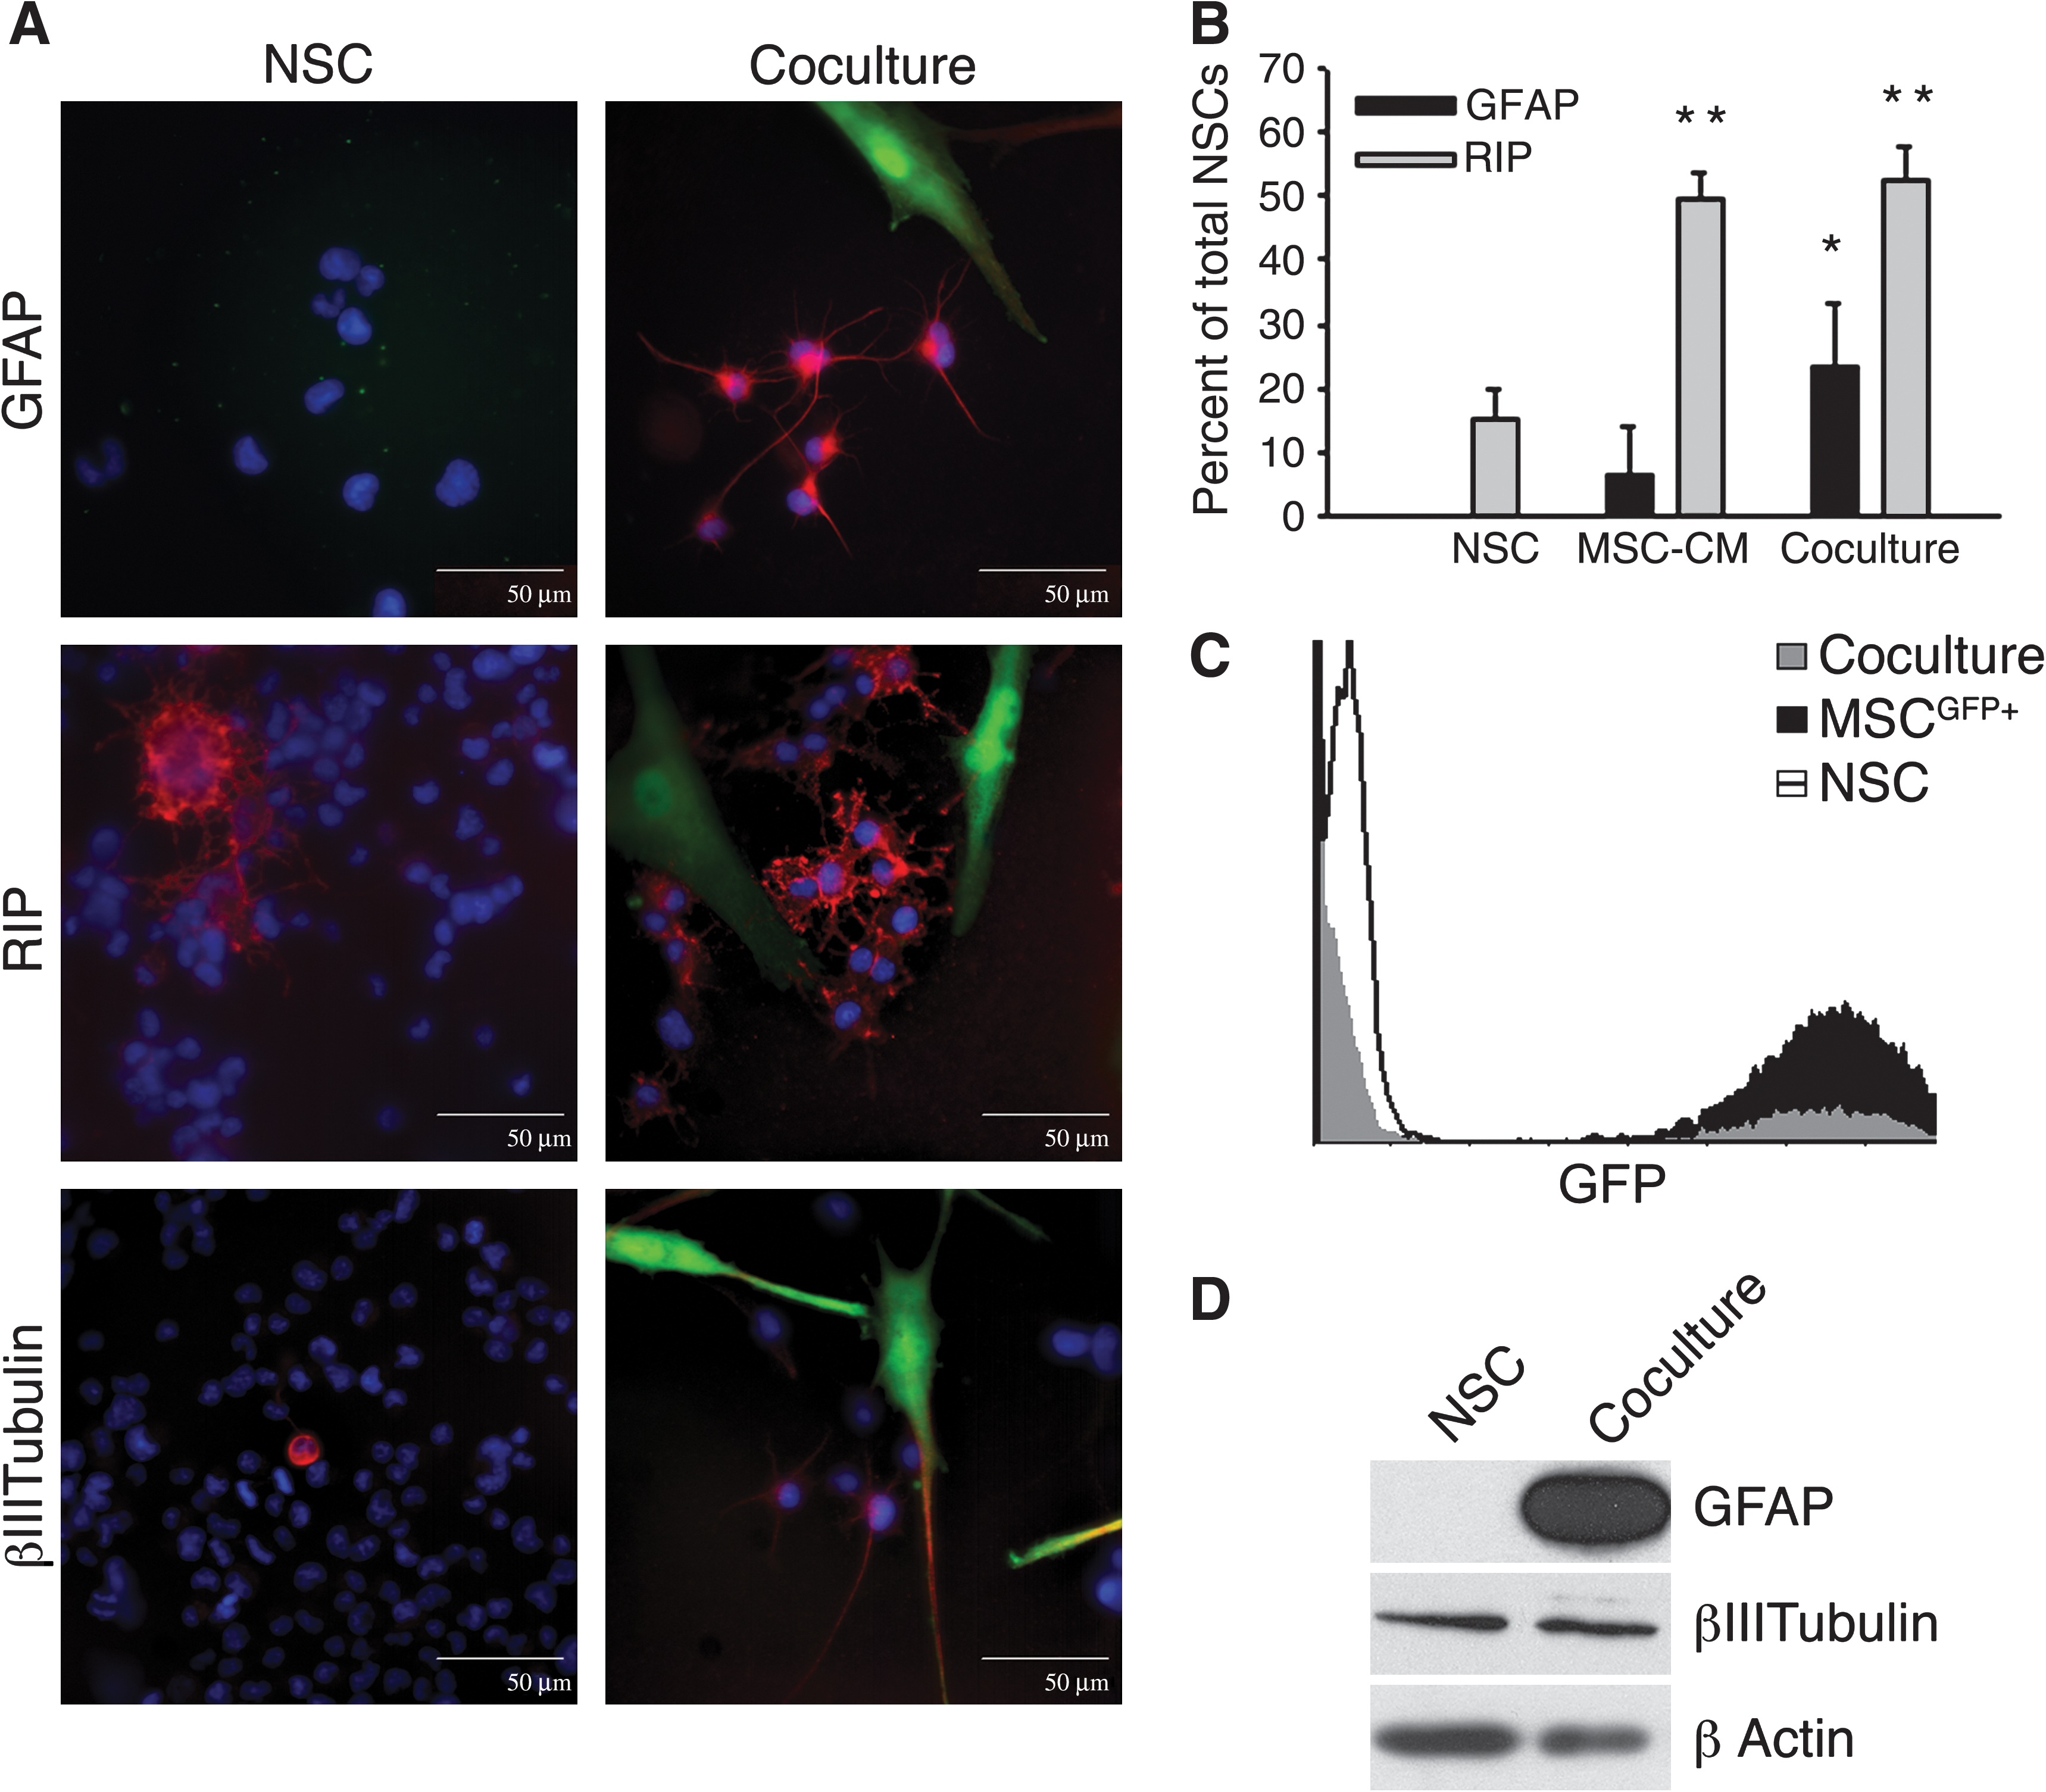
hMSCs enhanced glial differentiation of rNSCs. rNSCs were cultured alone (NSC), with hMSC-conditioned medium (MSC-CM), or in cocultures with GFP+ hMSCs (coculture).
To obtain quantitative data, systematic random sampling was performed on cultures. rNSCs incubated alone were 15.0% ± 4.8% (mean ± SD) positive for RIP and none were positive for GFAP (Fig. 1B). After coculture with GFP+ hMSCs, rNSCs were 52.4% ± 5.2% positive for RIP and 23.6% ± 9.9% positive for GFAP. By immunolabeling about 70% of the rNSCs expressed differentiation markers. The results were confirmed in a separate coculture experiment utilizing nontransfected hMSCs harvested from a different bone marrow donor (not shown). Conditioned medium from hMSCs had a different effect: rNSCs incubated with conditioned medium from hMSCs were 49.2% ± 4.8% positive for RIP, but only 4.8% ± 5.5% were positive for GFAP labeling. Therefore, the conditioned medium drove rNSC differentiation toward oligodendrocytes but not toward astrocytes. GFP+ hMSCs did not express GFAP or RIP under any of the conditions.
We confirmed the differentiation of the rNSCs by Western blot analysis following cell sorting for discrete GFP+ and GFP− populations after 4 days in coculture (Fig. 1C). The results confirmed marked increases in expression of GFAP in GFP− cells isolated from the cocultures (Fig. 1D). No significant change in expression of β-III tubulin was detected.
Our results indicated that hMSCs promoted differentiation of rNSCs specifically along a glial lineage and did not affect neuronal differentiation.
Effects of hMSCs on the rNSC transcriptome
To survey for signaling pathways involved in rNSC differentiation, RNA extracted from rNSCs incubated alone or from cocultures was assayed with rat microarrays. To correct for human mRNAs that cross-hybridized to the rat microarray, RNA from hMSCs alone was assayed on a rat microarray and used as a control in filtering the data (Fig. 2A).

Assays with species-specific microarrays. Total RNA was isolated from individual cultures of hMSCs and rNSCs as well as cocultures. All samples were hybridized to both rat and human microarray chips.
After filtering, comparison of the signal intensities on the rat microarrays of rNSCs alone and cocultures indicated that 69 nonredundant genes were upregulated in the rNSCs at least 2-fold by coculture with the hMSCs (Supplementary Table S1, available online at
Using a 90% confidence interval, change in transcript expression was not found to be significant due to high variance between individual perfect match and mismatch probes. Signal absent in NSCs alone.
Signal absent in NSCs alone.
NSC, neural stem cell.
Further comparison of the filtered data indicated that 75 nonredundant genes were downregulated in the rNSCs at least 2-fold by coculture with the hMSCs (Supplementary Table S2, available online at
Effects of rNSCs on the hMSC transcriptome
To survey changes in the hMSC transcriptome in response to coculture with rNSCs, RNA extracted from hMSCs incubated alone or from cocultures was assayed with human microarrays. To correct for rat mRNAs that cross-hybridized with the human microarray, RNA from rNSCs alone was assayed on a human microarray and used as a control in filtering the data (Fig. 2B).
After filtering, the data indicated that 72 nonredundant genes were upregulated in the hMSCs at least 2-fold by coculture with the rNSCs (Supplementary Table S3, available online at
Further analysis of the filtered data indicated that 5635 genes were downregulated in the hMSCs at least 2-fold by coculture with the rNSCs. This finding may be explained by a high NSC to MSC ratio in the coculture condition diluting the hMSC signal. Therefore, we were unable to make any conclusions regarding rNSC inhibition of the hMSC transcriptome.
Soluble factors secreted by hMSCs in cocultures
The microarray data allowed us to search for candidate genes that might explain the increased glial differentiation in the cocultures. Among the upregulated genes for secreted factors in the hMSCs were TGFB1 and TGFB3 (Table 1). Therefore, the medium from the cocultures was assayed with an ELISA specific for hTGFβ. As expected, coculture of the hMSCs with the rNSCs increased the secretion of hTGFβ (Fig. 3, left panel). A role for TGFβ was further supported by Western blot analysis demonstrating that rNSCs alone as well as those FACS isolated from cocultures expressed the appropriate receptors, TGFβR1 and TGFβR2 (Fig. 3, right panel). The gene for HGF was also upregulated in the hMSCs, and ELISA demonstrated increased secretion of HGF in the cocultures (Supplementary Fig. S2, available online at
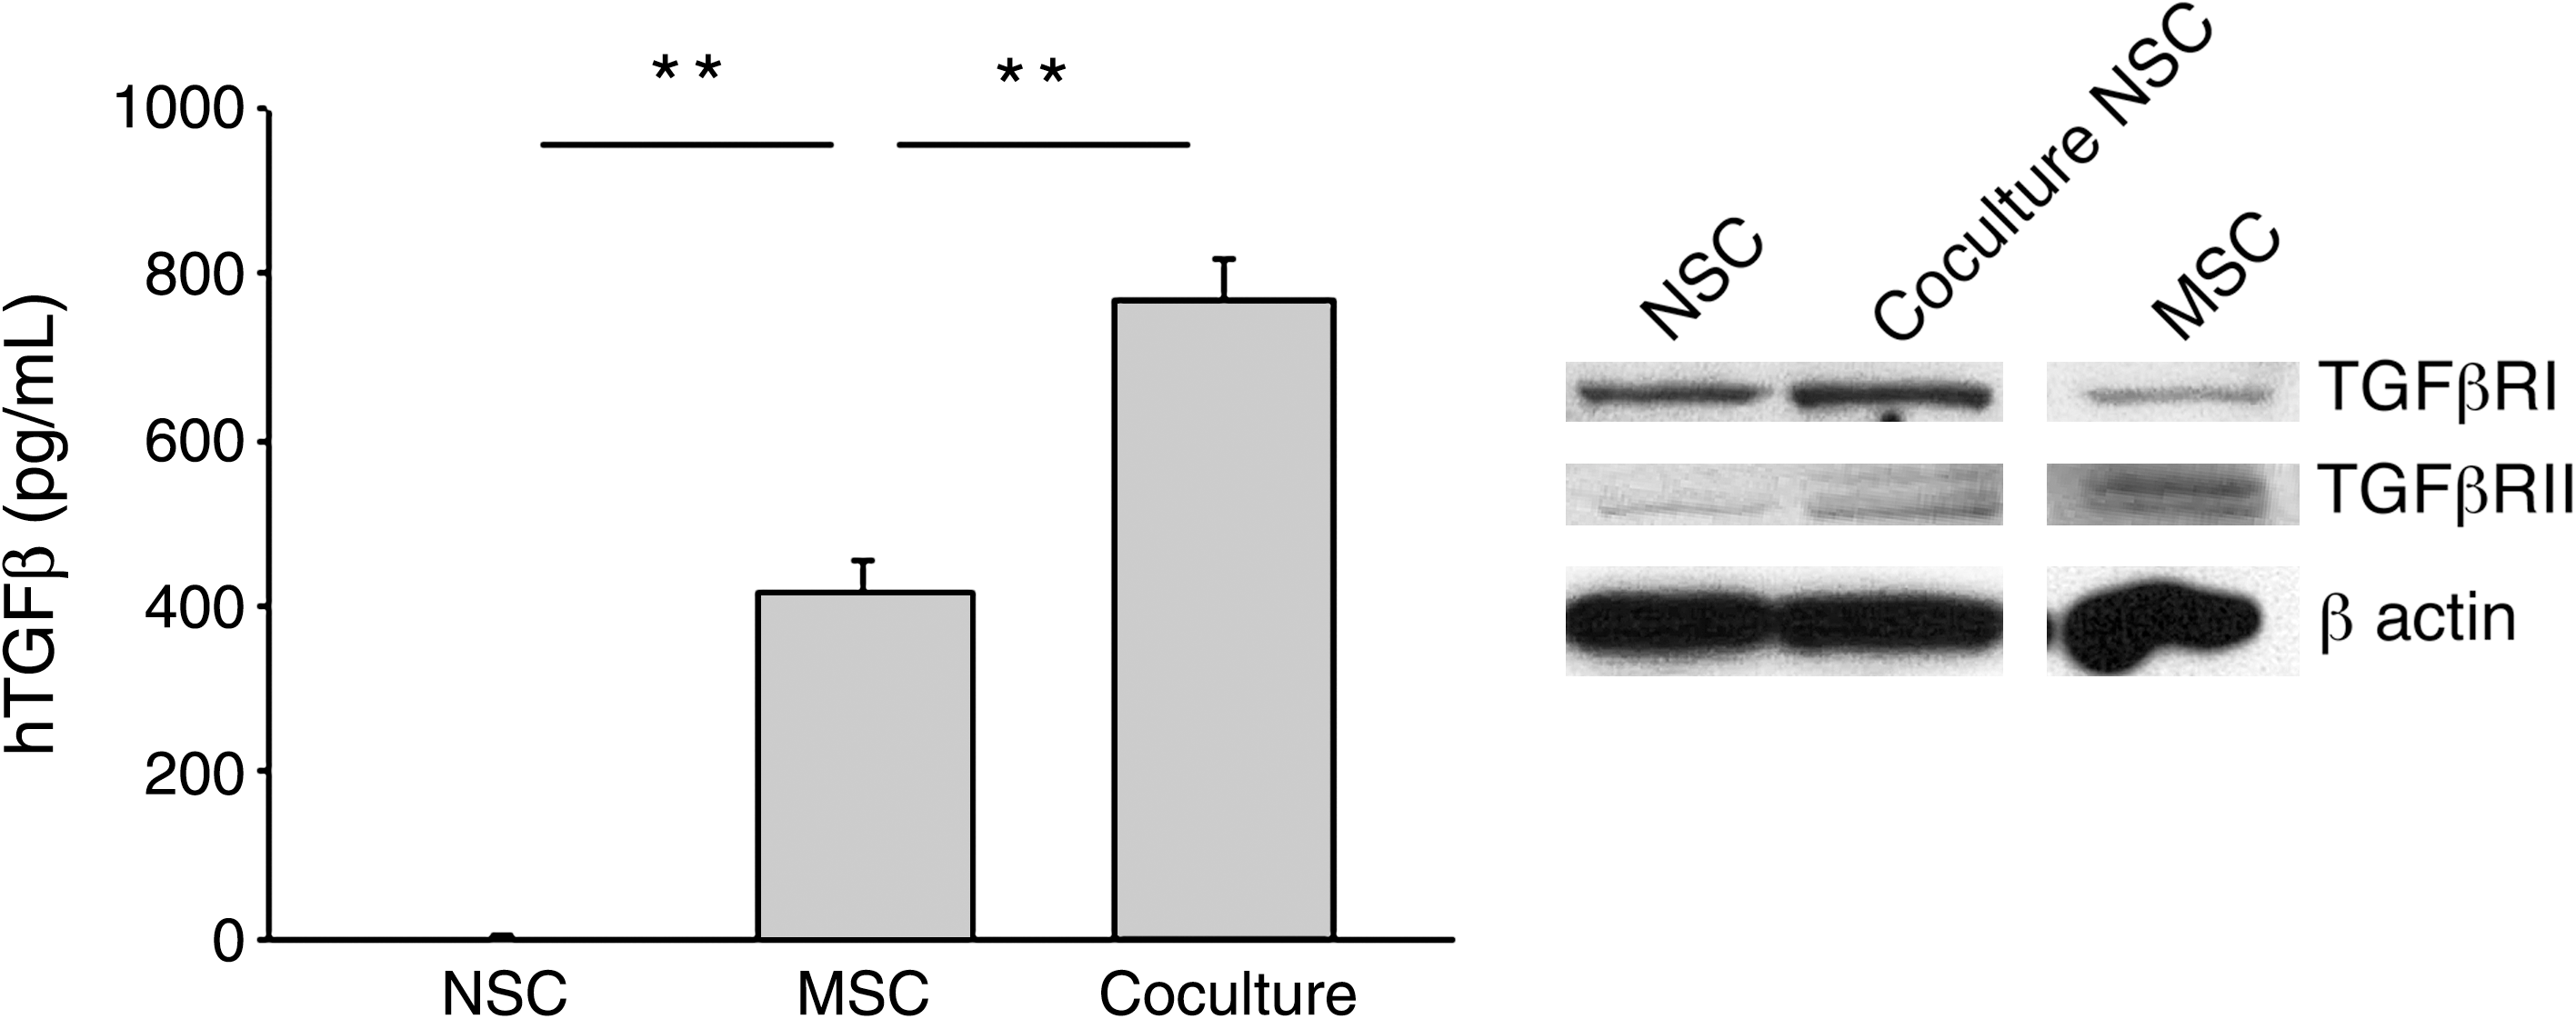
hMSCs increased secretion of TGFβ in cocultures. (Left panel) Human-specific ELISA of medium from cultures (t-test: **P < 0.01 vs. MSC). (Right panel) Western blot analysis of rNSCs cultured alone (NSC) or with hMSCs (coculture NSC) and hMSCs cultured alone (MSC) confirmed that hMSCs and rNSCs express both TGFβ receptors I and II. β-actin expression was used as a loading control. TGFβ, transforming growth factor β.
The TGFβ secreted by hMSCs in cocultures promotes the differentiation the rNSCs
To confirm that secretion of TGFβ by hMSCs promoted glial differentiation, cocultures were incubated in the presence of SB431542, a selective inhibitor of TGFβ signaling. The inhibitor decreased the number of GFAP+ astrocytes, and clusters of RIP+ oligodendrocytes (Fig. 4A). A few β-III tubulin+ neurons were detected, but a majority of rNSCs did not stain positive for phenotypic markers of differentiated cells. GFP+ hMSCs assumed a more-elongated spindle-shaped morphology. rNSCs cocultured with hMSCs were 52.3% ± 4.2% positive for RIP and 17% ± 7.6% positive for GFAP. The TGFβ inhibitor decreased glial differentiation of the rNSC in cocultures, 16% ± 4.4% were positive for RIP and 3.3% ± 1.5% were positive for GFAP (Fig. 4B).
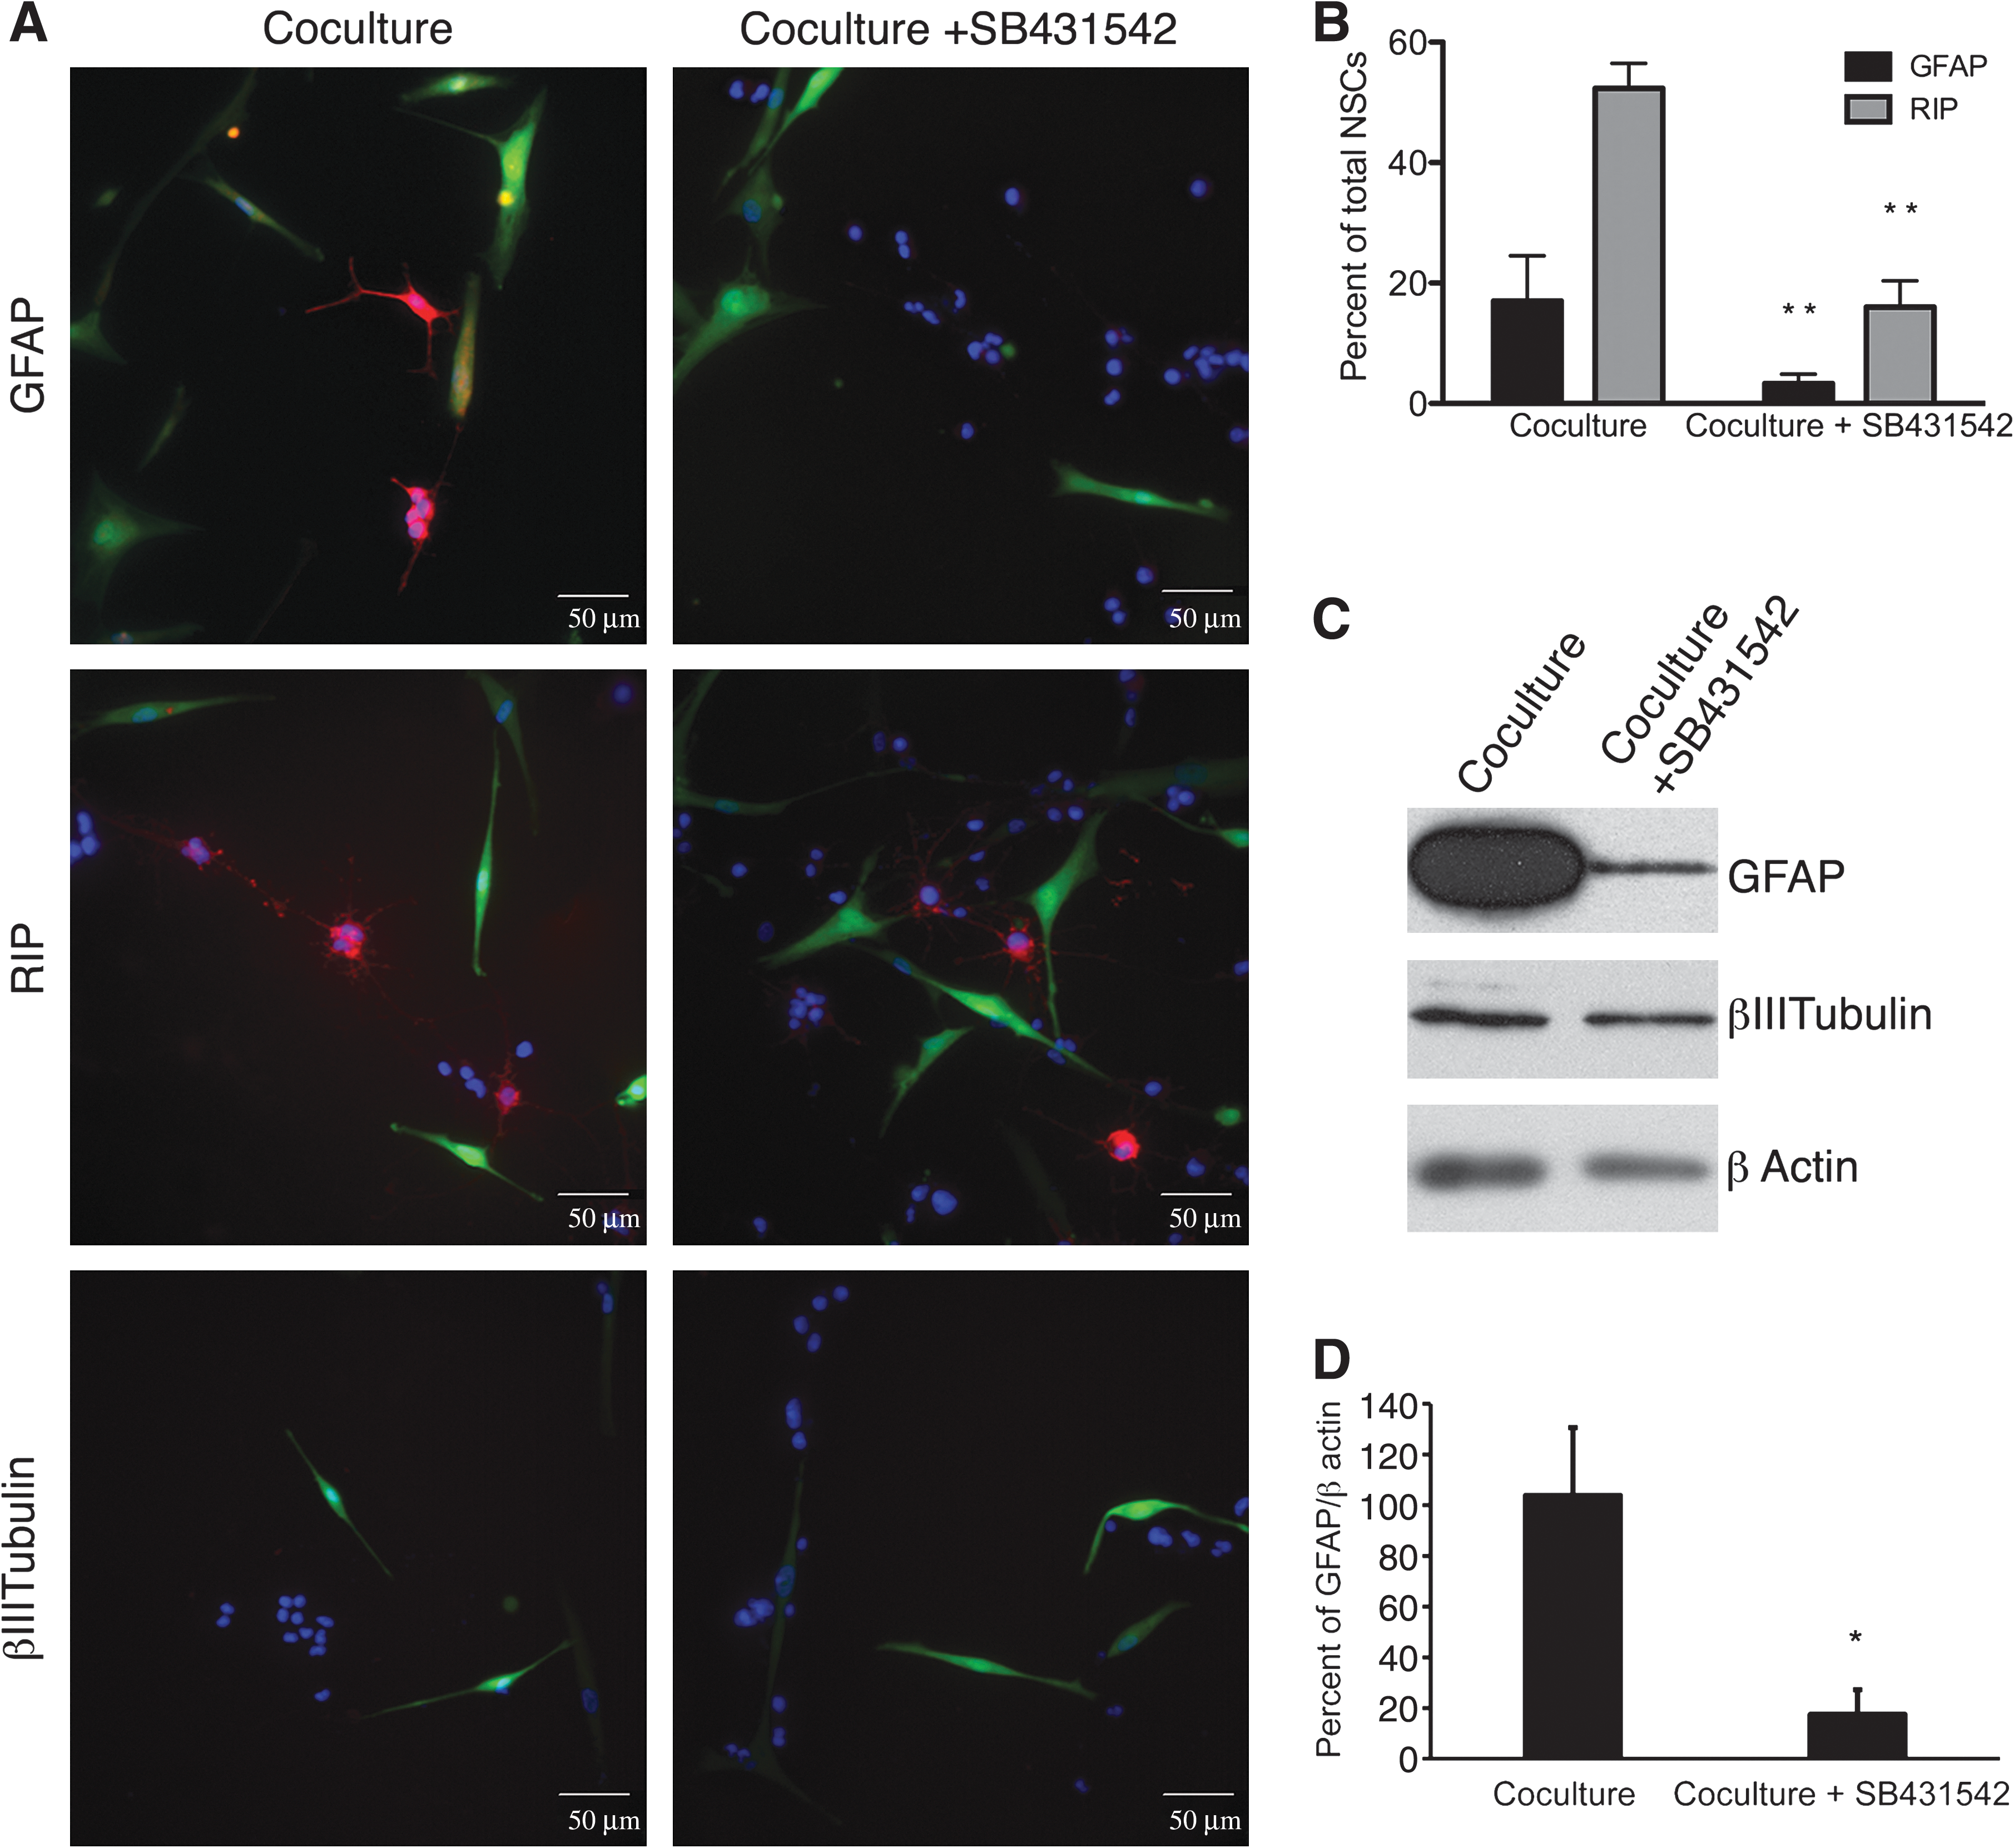
An inhibitor of TGFβ signaling (SB431542) decreased differentiation of the rNSCs in cocultures.
The effects of the inhibitor were confirmed by Western blot assays demonstrating decreased expression of GFAP in rNSCs isolated from cocultures (Fig. 4B). Recombinant human TGFβ added to rNSCs cultured alone did not increase the expression of GFAP as detected by Western blots (not shown). There was no change in rNSC expression of β-III tubulin between conditions.
Our results indicated that coculture with rNSCs activates hMSCs to secrete increased amounts of TGFβ and that TGFβ signaling is essential for hMSC-stimulated glial differentiation of rNSCs. However, we found that hTGFβ alone was not sufficient to stimulate glial differentiation of the rNSCs and that additional hMSC-derived factors might be playing a role.
Increased Notch signaling in both the hMSCs and rNSCs
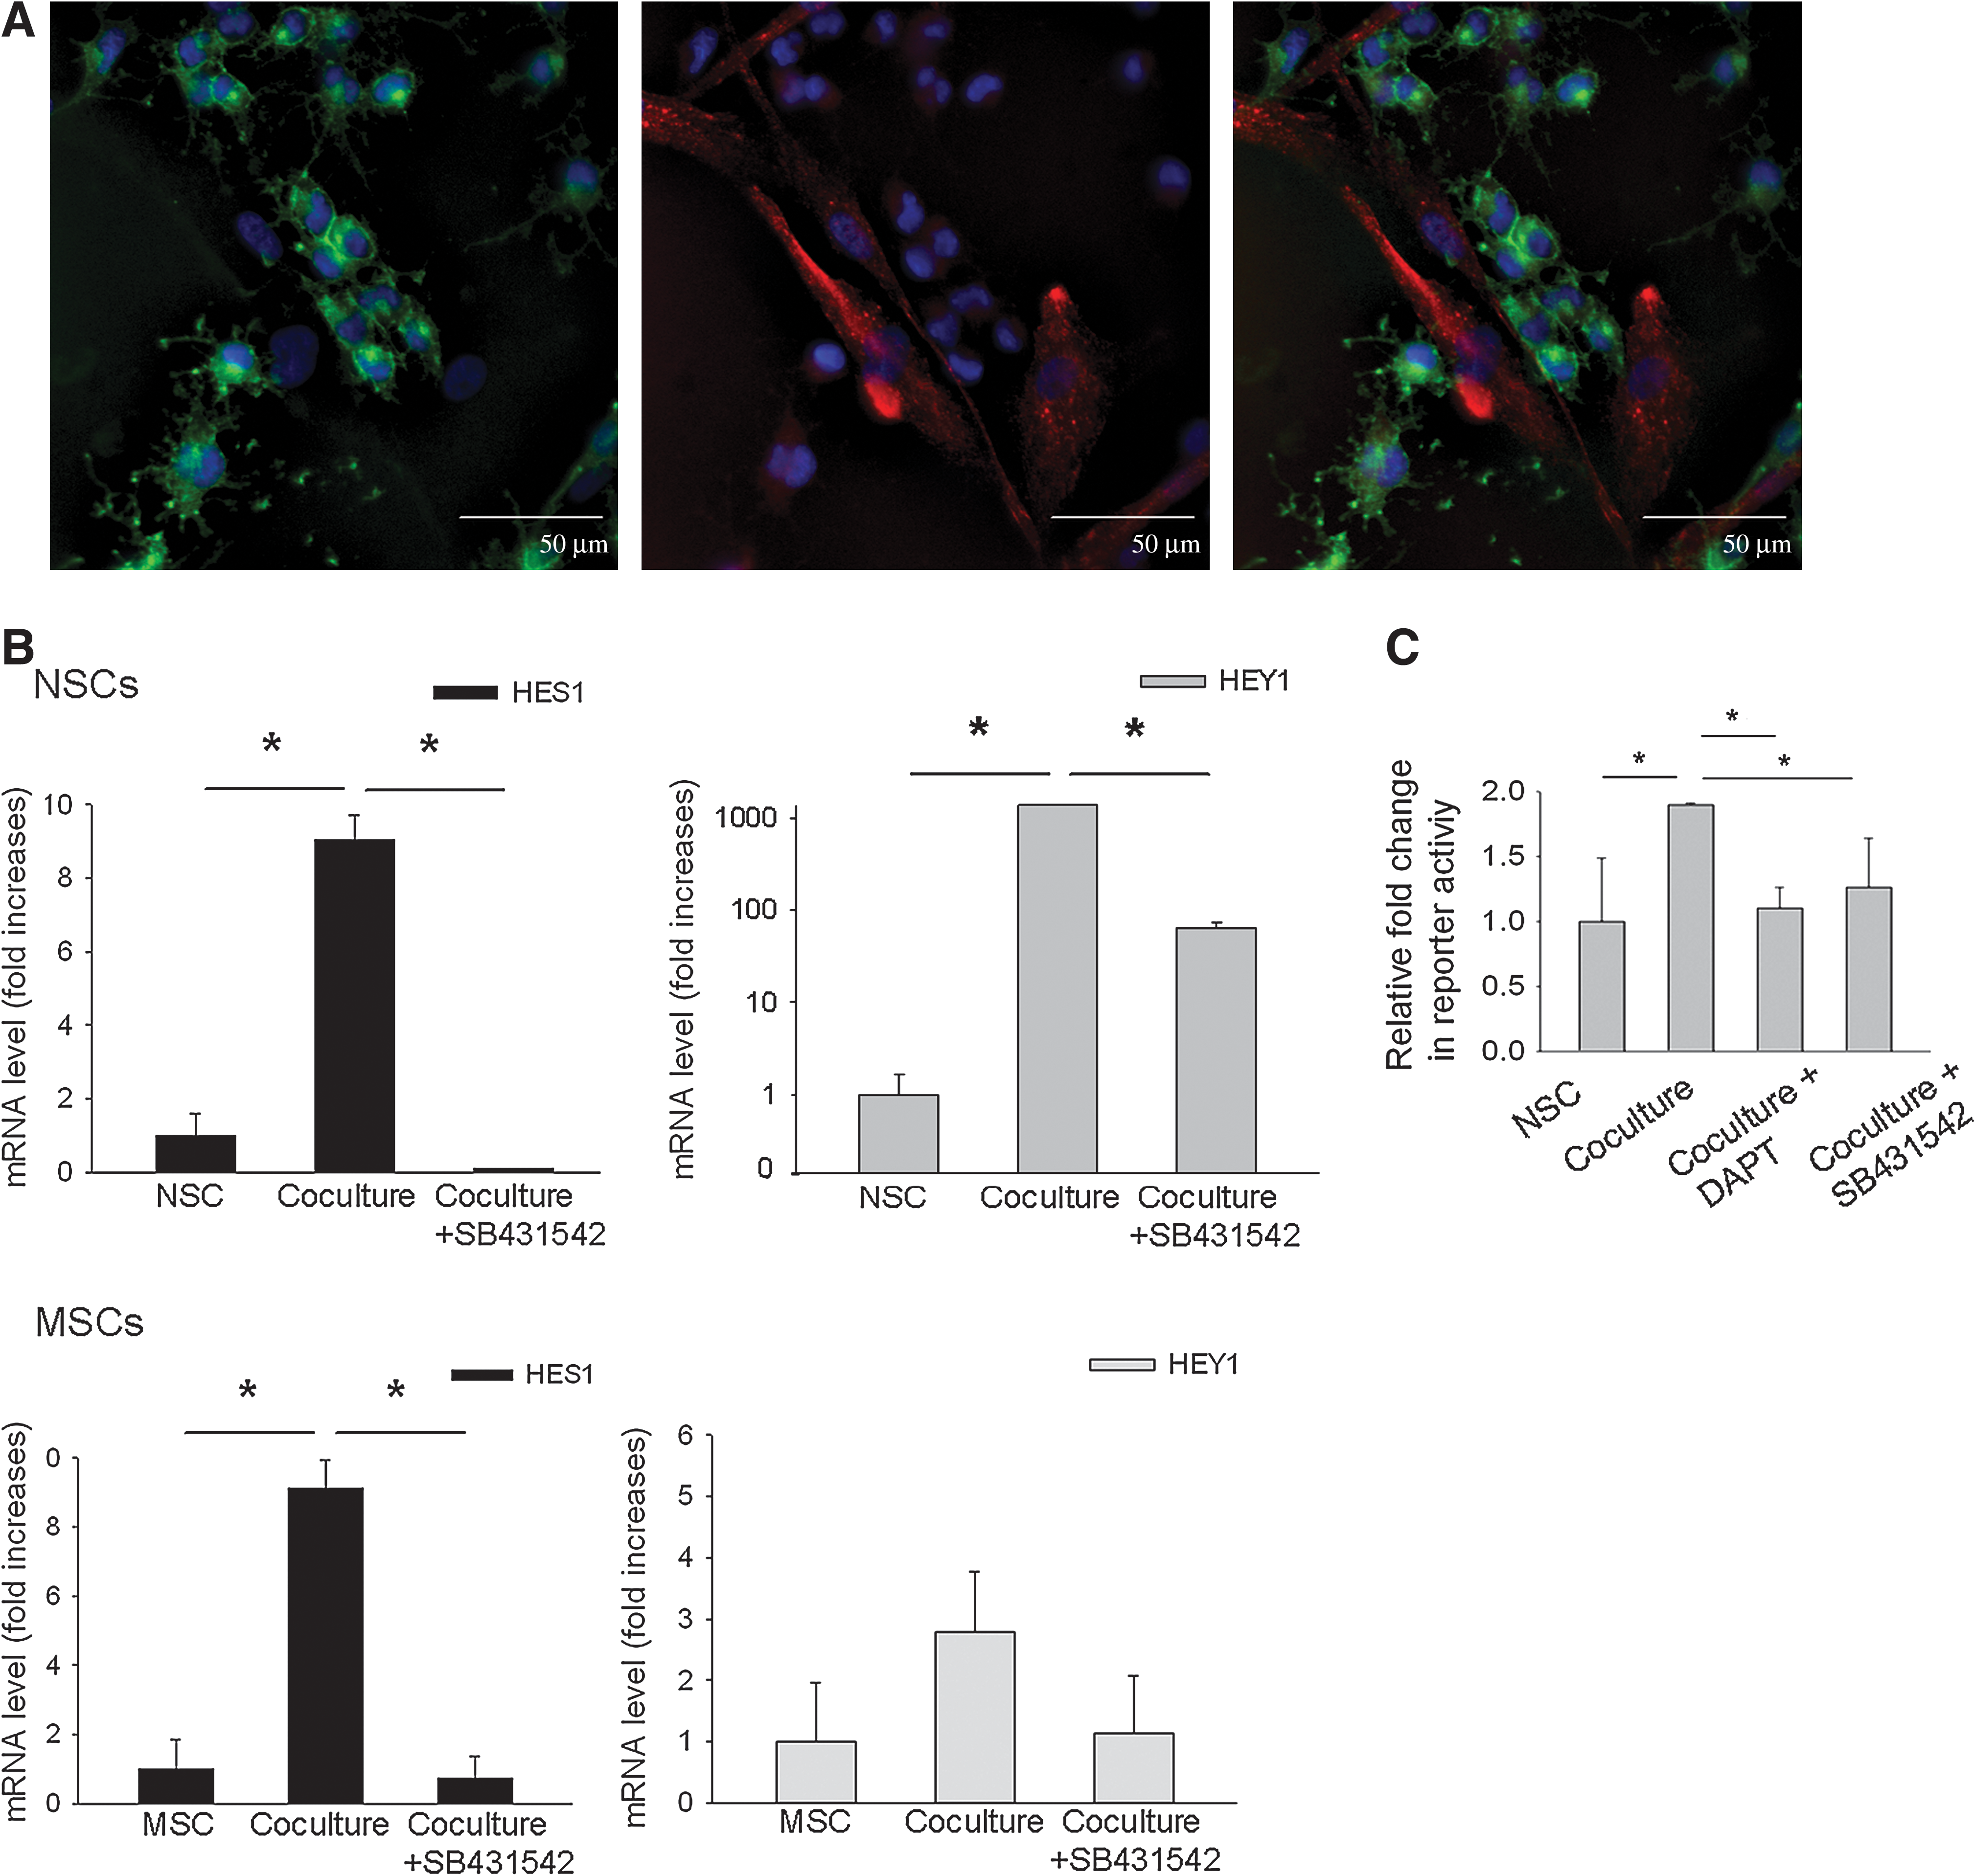
The microarray data also suggested that coculturing the cells increased Notch signaling in both the rNSCs and in the hMSCs (Table 1). The rNSCs in coculture robustly expressed the receptor Notch 1 (Fig. 5A). hMSCs at sites of contact with rNSCs also expressed the Notch ligand Jagged 1. The results therefore suggest direct cell–cell signaling increased activation of the Notch pathway in both cell types. The Notch signaling pathway has been extensively studied in the developing nervous system, and shown to drive glial differentiation of NSCs by enhancing expression of the transcriptional regulator Hes1 [20,21]. RT-PCR assays of rNSCs isolated from the cocultures (Fig. 5B) demonstrated that expression of the downstream Notch signaling targets Hes1 and Hey1 in rNSCs was increased (P < 0.01). In the hMSCs (Fig. 5B), there was increased expression of HES1 but not the coregulatory factor HEY1 (P < 0.01). Expression of HES1 in the hMSCs was confirmed by Western blot analysis; however, there was no detectable change in protein level between hMSCs cultured alone and those from coculture (not shown).
Notch signaling was increased in the cocultures and decreased by an inhibitor of TGFβ signaling.
Because of reported synergy between the Notch and TGFβ pathways [22], we repeated the experiments in the presence of the inhibitor of the TGFβ pathway. As expected, incubation with the inhibitor decreased expression of both Hes1 and Hey1 in the rNSCs (Fig. 5B). It also decreased expression of HES1 in the hMSCs.
Notch signaling in the rNSCs assayed with reporter genes
To further confirm the Notch signaling, we transfected the rNSCs with 2 reporter constructs: 1 to assay for the Notch pathway and 1 to control for the efficiency of the transfections. The reporter construct for the pathway contained the luciferase gene under the control of an RBP-Jk response element. Upon activation, the intracellular domain of the Notch receptor (NICD) is cleaved and translocates to the nucleus. The NICD binds to RBP-Jk and thereby converts it from a repressor of transcription to an activator. Coculture with hMSCs significantly increased intracellular Notch signaling in the rNSCs (Fig. 5C). The Notch signaling was reduced by addition of DAPT, a gamma secretase inhibitor that inhibits the cleavage of NICD from the Notch extacellular domain. Also Notch signaling was reduced by addition of the TGFβ inhibitor.
The results indicated that glial differentiation in the cocultures was driven by activation of the TGFβ signaling pathway, possibly through synergistic activity with the Notch signaling pathway (Fig. 6).

Schematic of cell signaling between rNSCs and hMSCs in coculture. Data obtained from multiple assays indicate activation of the classical Notch signaling pathway in both the hMSCs and rNSCs. Notch signaling is thought to be unidirectional; therefore, the data suggest that Notch signaling is directed from hMSCs to rNSCs in some sub-populations of the cocultures and from rNSCs to hMSCs in other sub-populations.
Discussion
Therapeutic benefits from administration of MSCs have been reported in a series of models of diseases of the CNS, but the mode of action of the cells has not been defined [8,23,24]. Since the cells differentiated into neural-like cells under some conditions, it was initially assumed that the therapeutic benefits were produced primarily by engraftment and differentiation of the MSCs to neural cells [25,26]. Subsequent observations suggested that therapeutic benefits were frequently obtained with only transitory engraftment and little evidence of differentiation of the cells [8,27 –29]. Therefore, the cells apparently exerted their effects indirectly by secretion of soluble factors or cell-to-cell contact that modulated inflammatory and immune reactions [30,31], or by suppressing apoptosis [32,33].
Coculture experiments were used here to explore the recent observations [12,13] that hMSCs infused into the hippocampus-stimulated proliferation, migration, and differentiation of endogenous NSCs. To study the effects of hMSCs on a proliferative population of NSCs we chose to coculture the cells in growth medium as apposed to differentiation induction medium. The presence of hMSCs in the cocultures markedly stimulated differentiation of rNSCs to astrocytes and oligodendrocytes in the optimal NSC growth medium that did not in itself induce differentiation. The use of species-specific microarrays to assay RNA extracted from the cocultures made it possible to survey changes in the transcriptomes of both cell types. To validate the microarray findings a variety of techniques were used to assay both the rNSCs and hMSCs (see summary in Fig. 6).
The role of TGFβ1 was verified by the demonstration that hMSCs in coculture increased secretion of TGFβ1, the rNSCs expressed the receptors, and an inhibitor of the pathway decreased differentiation (Fig. 6). A role for HGF was in part verified by the observation that hMSCs in coculture increased secretion of HGF (Supplemental Fig. S1). The role of Notch signaling was verified by the demonstration that in the cocultures hMSCs expressed a Notch ligand at sites of cell contact with rNSCs, and the rNSCs expressed the Notch receptor. Increased Notch signaling in both cell types was then demonstrated by assays of transcripts for a downstream target for Notch (Hes1) in both cells and a reporter construct for downstream targets of Notch signaling in rNSCs.
The observation that Notch signaling was increased in both the rNSCs and the hMSCs was surprising since Notch is generally recognized as a unidirectional signaling system [34 –37]. Therefore, the results suggest that the Notch signaling was directed in opposite directions in different sub-populations of the cocultures (Fig. 6).
A role for TGFβ1 in glial differentiation is consistent with its being a member of a superfamily of growth factors known to produce a diverse range of biological effects in the developing CNS, including NSC expansion and fate determination [38 –40]. Its role is also consistent with the observation that conditioned medium from hMSCs increased oligodendrogenesis by rNSCs incubated in medium containing 10% FBS [41,42]. hMSCs also increase both oligodendrogenesis and neuronogenesis by mouse neurospheres incubated in serum-free medium [43]. In the optimal NSC growth medium used here, conditioned medium from hMSCs increased differentiation to oligodendrocytes but not astrocytes. The different fates of the rNSCs are probably due to differences in the hMSC and rNSC preparations, and differences in the culture conditions.
The role of Notch signaling in glial differentiation is consistent with its extensive role in controlling cell fate in many different systems [34,37] and its role in the development of the CNS [44]. Notch signaling provides a mechanism to limit specific cell fates to single cells within a cluster of cells, but it can also restrict cells to an uncommitted fate [34 –37]. The Notch signaling pathway has extensive interconnectedness with other signaling pathways [37]. For example, TGFβ can directly induce Hes1 or it can activate the Smad2/3 complex which interacts with NICD to recruit RBP-Jk and thereby induce Hes1 [22]. The results here suggest the possibility that Notch and TGFβ signaling were acting synergically in the rNSCs. This is supported by the observation that an inhibitor of TGFβ signaling inhibited both glial differentiation and increased expression of down stream targets of Notch signaling (HES1 and HEY1) in the rNSCs. It is likely that HGF and other factors that hMSCs were activated to secrete in the cocultures had roles in enhancing differentiation.
As we previously showed that hMSCs survive for short periods of time in the CNS [12,31], stimulation of the endogenous cycling cell population rather than cell replacement may be a more viable means to approach long-term cell therapy for treatment of neurologic insults. Glial cells are gaining appreciation for their ability to support the local environment structurally and functionally. Although long associated with the formation of a detrimental glial scar following neural injury, astrocytes are now being recognized as providing beneficial activities such as restricting inflammation and protecting neurons and oligodendrocytes [45,46]. Growth factor support supplied by astrocytes has been shown to increase neuronal survival, maturation, and function [47,48]. Stimulation of oligodendrocyte survival and function has long been a primary aim for effective treatment of demyelinating diseases and insults. The hMSC-stimulated increase in oligodendrocyte numbers and their maturation has been suggested to underlie remyelination and functional recovery following a demyelinating insult [49]. In addition, oligodendrocytes are now known to produce a number of trophic factors that can support neuronal survival and function [50,51]. Because MSCs are readily accessible and expanded in vitro, they may serve as an effective means to stimulate glial differentiation of the endogenous NSC population and thus enhance endogenous repair mechanisms following neurologic insult.
Footnotes
Acknowledgments
The work was supported in part by an NIH grant (P40 RR 17447), the Louisiana Gene Therapy Research Foundation, and a fellowship from the Louisiana Board of Regents Support Fund.
Author Disclosure Statement
No competing financial interests exist.
References
Supplementary Material
Please find the following supplemental material available below.
For Open Access articles published under a Creative Commons License, all supplemental material carries the same license as the article it is associated with.
For non-Open Access articles published, all supplemental material carries a non-exclusive license, and permission requests for re-use of supplemental material or any part of supplemental material shall be sent directly to the copyright owner as specified in the copyright notice associated with the article.