
Abstract
It has been well documented that bone marrow stromal cells (BMSCs) of multiple myeloma patients play a pivotal role in supporting the growth of mature myeloma cells. With evolving concepts concerning the presence of myeloma stem (initiating) cells, we aimed this investigation to specifically address the supportive role of BMSCs for myeloma stem cell growth in vitro and in vivo. BMSC lines were derived from myeloma or control patients (myeloma or control BMSCs). Myeloma stem cells of the RPMI 8226 myeloma cell line were recognized through the identification of “side populations” (SP) with Hoechst dye staining. SP cells formed more colonies when grown on myeloma BMSC than on control BMSC. Additionally, higher percentages of SP cells were observed when grown on myeloma BMSCs than on control BMSCs. In the mouse model, SP cells inoculated with myeloma BMSCs grew faster than those inoculated with control BMSCs. Of note, SP cells demonstrated an increased expression of CD184 (CXCR4) compared with non-SP cells. The expression of CD184 in SP cells was further increased when they were cultured with myeloma BMSCs. CD184(+) SP cells formed more colonies than CD184(−) SP cells. Treatment with AMD 3100, an inhibitor of CD184, reduced colony formation by CD184(+) SP cells when co-cultured with myeloma BMSCs. This was associated with the decreased activation of ERK, a downstream target of activated CD184, in myeloma cells. These findings indicate that the myeloma BMSCs create a microenvironment supportive of myeloma stem cells via, at least partially, the CXCR4 signaling pathway.
Introduction
W
It is well established that normal stem cells reside in specific stem cell niches. This niche sustains stem cell quiescence and maintains stem cell population self-renewal properties and homeostasis [6,7]. Bone marrow stromal cells (BMSCs, also known as bone marrow mesenchymal stem cells) are the major component the hematopoietic stem cells (HSC) niche, which was first isolated from bone marrow stroma and have the capacity of multilineage differentiation into chondrocytes, myocytes, adipocytes, and osteocytes [8,9]. Other than physical support, BMSCs also regulate HSCs through paracrine signaling, such as Wingless-related proteins (WNTs), Notch modulators, FGFs, and Hedgehog (HH) [10 –15].
The interaction between BMSCs and myeloma stem cells has not been well studied, although it is well documented that BMSCs plays essential roles in supporting the growth of mature myeloma cells (reviewed in ref. [5,16 –19]). Additionally, a recent study indicates that BMSCs from the bone marrow of myeloma patients have different expression profiles and function differently compared with BMSCs derived from control cases [20]. Our overall hypothesis is that BMSCs from myeloma patients (myeloma BMSCs) constitute a unique element of cancer stem cell niches that support the myeloma stem cells proliferation and confer drug resistance. These niches thus play a key role in tumorigenesis and disease relapse. To substantiate this hypothesis, we have demonstrated that myeloma BMSCs support the growth of myeloma stem cells better than BMSCs from controls via, at least partially, the CD184/SDF1 pathway. Additionally, myeloma BMSCs change the phenotypes of myeloma stem cells and increase the percentages of myeloma stem cells. These findings suggest that development of novel methods to restore the normal functional status of the BMSC niches in myeloma patients is essential for the long-term cure of multiple myeloma.
Materials and Methods
Isolation and expansion of mesenchymal stem cells
We established 3 lines of BMSCs, each from myeloma patients and age-matched controls using remnant bone marrow samples from routine diagnostic work-up with the methodology outlined below. The age-matched controls were obtained from patients without cytopenias (>55 years old) who received marrow evaluation for staging of lymphomas and were determined to be negative for lymphoma involvement. We specifically selected these controls to be age-matched for the myeloma population to control for the possibility of aging-related functional changes of the BMSCs. Usage of these samples has been approved by the Institutional Review Board of The Methodist Hospital Research Institute (TMHRI).
Bone marrow mononuclear cells of myeloma or age-matched controls were obtained by Ficoll density gradient (1.077 g/mL; Sigma, St. Louis, MO). Cells were plated in 25-cm2 tissue culture flasks at a concentration of 106 cells/mL in Mesencult basal medium supplemented with MSC stimulatory supplements (both from StemCell Technologies, Vancouver, BC). After 24-h incubation at 37°C in a 5% CO2 humidified atmosphere, nonadherent cells were removed, and the adherent fraction was cultured in fresh medium. For further expansion passages of 40%–60% confluent cells, BMSCs were detached by treatment with trypsin/EDTA solution (StemCell Technologies, Vancouver, BC) and replated in 75-cm2 tissue culture flasks. The cells at fourth expansion passages were cryopreserved for future experiment. Of note, the myeloma cells (described below) and the myeloma BMSCs were derived from different patients to avoid that autologous interactions might play a role in myeloma stem cell growth.
Myeloma cell line and GFP/luciferase vector transduction
RPMI 8226 cell line was purchased from ATCC, and cultured in RPMI 1640 (Invitrogen, Grand Island, NY) supplemented with 10% fetal bovine serum (FBS; Atlanta Biologicals, Lawrenceville, GA), 2 mM
Hoechst staining
Dye efflux of Hoechest 33342 has been recognized as a stem cell feature [21,22] and was used to identify the myeloma stem cell SP [4]. Although the phenotype of cancer stem cells varies according to tumor types, one common feature of cancer stem cells is the presence of SP cells with high drug efflux capacity from the high expression level of the ABC transporter genes. Hoechst staining was performed according to the protocol outlined by the lab of Goodell’ lab at the Baylor College of Medicine (Houston, TX,
Co-culture of BMSC with myeloma cell and colony assay
Normal and myeloma BMSCs at passage 5 were sub-cultured at 40%–60% confluence in a 96-well plate overnight. Ten SP or non-SP cells of RPMI 8226 cell line were then sorted directly into 96-well plate and overlaid with 1% methycellulose gel (Cat. H4100; StemCell Technologies, Vancouver, BC) with 3% FBS. Selection of this low serum concentration media was intended to challenge the colony formation ability of these isolated SP cells (putative myeloma stem cells). The number of colonies in each well was counted after 1 week under microscopic examination. A colony was defined as a cluster containing at least 30 cells. In some experiments, to test the colony-forming ability at serial plating, the cells after colony counting were collected, washed, and replated into a new plate with myeloma or control BMSC. Colony fold change for each replating was calculated as the number of colonies of the current plating divided by the number of colonies from the previous plating.
Phenotype analysis and flow cytometry
All reagents and antibodies used were obtained from Becton Dickinson (Franklin Lakes, NY). In brief, cells were harvested by centrifugation and washed once with PBS. Cell concentration was adjusted to 1 × 10⁶/mL, antibodies were added, and the cells were incubated at room temperature for 30 min. After incubation, cells were washed once with staining buffer, resuspended in 500 μL staining buffer, and stored at 4°C prior to flow cytometric analysis. A FASC LSRII flow cytometer was used for analysis. FACS Diva software was used to acquire and analyze the data.
Animal model
Eight-week-old NOD/SCID Il2rg−/− mice were obtained from The Jackson Laboratory (Bar Harbor, ME). Five thousand SP cells (from RPMI 8226/GFP/luciferase cells) together with 1 × 10⁴ myeloma or control BMSCs in 10 μL PBS were inoculated into the mice through tibial implantation as previously described [23,24]. After inoculation, the mice were imaged weekly. Ten minutes prior to imaging, 150 mg/kg of Luciferin (Caliper Lifesciences, Hopkinton, MA) was injected through the peritoneal cavity as indicated in the figure legends and images were acquired by IVIS imaging system 200 series (Xenogen, Alameda, CA). A semiquantitative region of interest (ROI) analysis was then performed by the dedicated software, Living Image v3.1.
Data analysis
A Student's t-test or ANOVA (analysis of variance) was used to discern differences when appropriate. For ANOVA, a Tukey's post-hoc test was used when warranted and significance was defined as P < 0.05.
Results
Myeloma BMSCs have a different growth pattern as compared with control BMSCs
Myeloma and normal BMSCs are phenotypically similar; however, the myeloma BMSCs have a higher growth potential. As shown in Figure 1A, both myeloma and control BMSC populations express CD73/CD105/CD123/CD133. However, normal BMSCs demonstrated a longer average passage time than that of myeloma BMSCs (Fig. 1B) and we were able to obtain higher quantities of myeloma BMSCs at 4 weeks of culture (Fig. 1C). Gene expression involving cellular functions of cell growth/proliferation and cell-cell interactions were increased in myeloma BMSCs and further increased in myeloma BMSCs primed by myeloma cells.
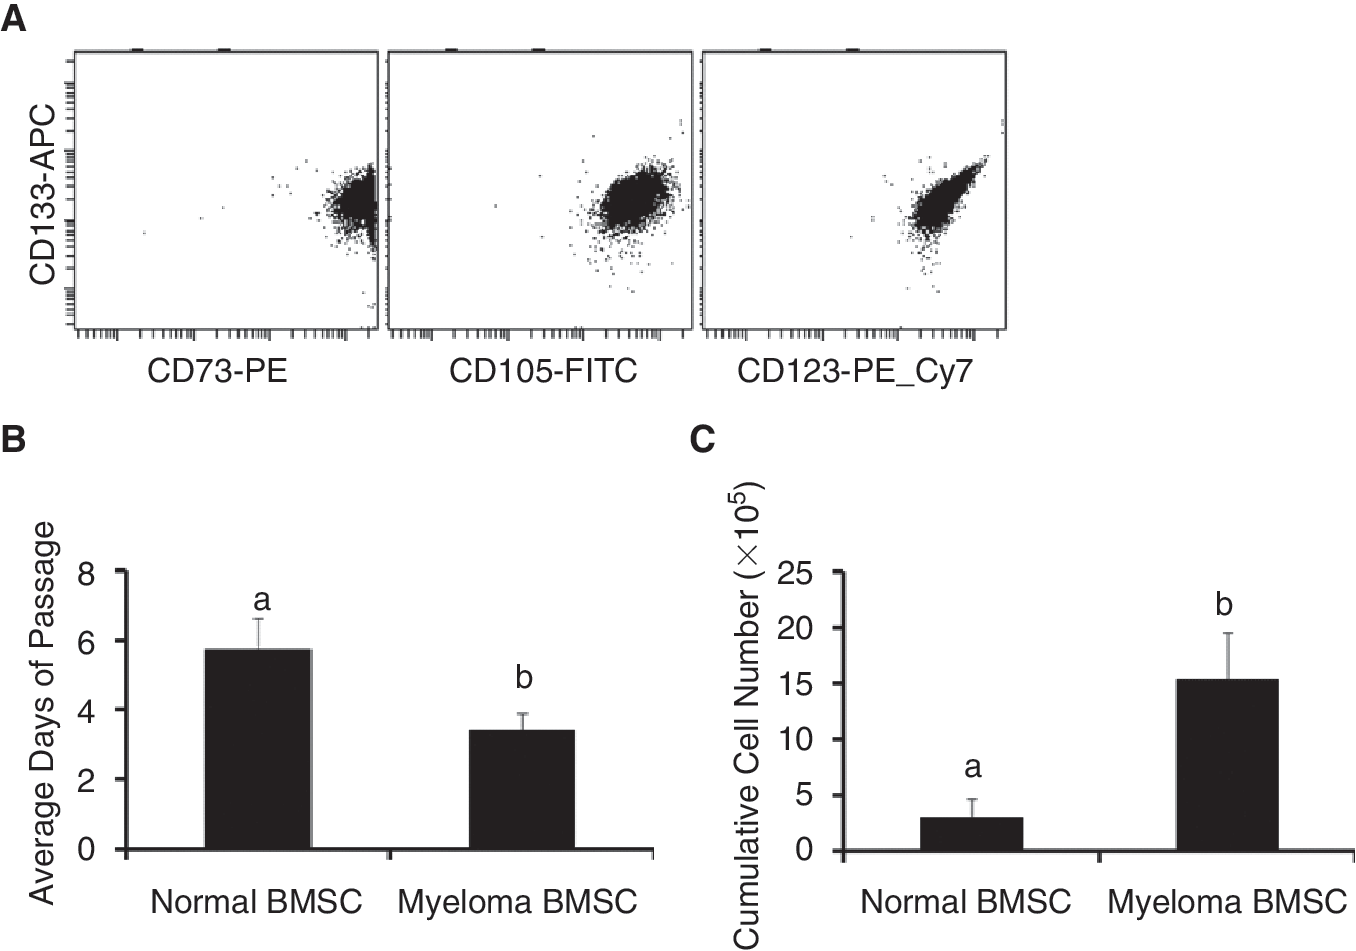
Flow cytometric analysis of bone marrow stromal cells (BMSCs) demonstrated that both myeloma and control BMSC populations express CD73/CD105/CD123/CD133 (
Myeloma stem cells cultured on myeloma BMSCs demonstrated a higher growth potential
As mentioned, the increased expression of the ABC family of membrane transporters in myeloma stem cells allow them to efflux the DNA-binding dye Hoechst 33342 more efficiently. This attribute allows detection of myeloma stem cells by flow cytometric analysis and identification of “SP” (Fig. 2A). We then evaluated the clonogenic capacity of the myeloma stem cells (using SP cells as surrogated markers) by colony formation in methylcellulose. As shown in Figure 2B, single myeloma stem cells (SP cells), plated into a well seeded on myeloma BMSCs, formed a much larger colony than on normal BMSCs. Myeloma stem cells co-cultured on myeloma BMSCs formed colonies more frequently than on control BMSCs (Fig. 2C). Furthermore, the myeloma stem cells showed greater clonogenic expansion during serial replating culture on myeloma BMSCs than on normal BMSCs (Fig. 2D). These results suggest that myeloma BMSCs sustain the self-renewal properties of myeloma stem cells.
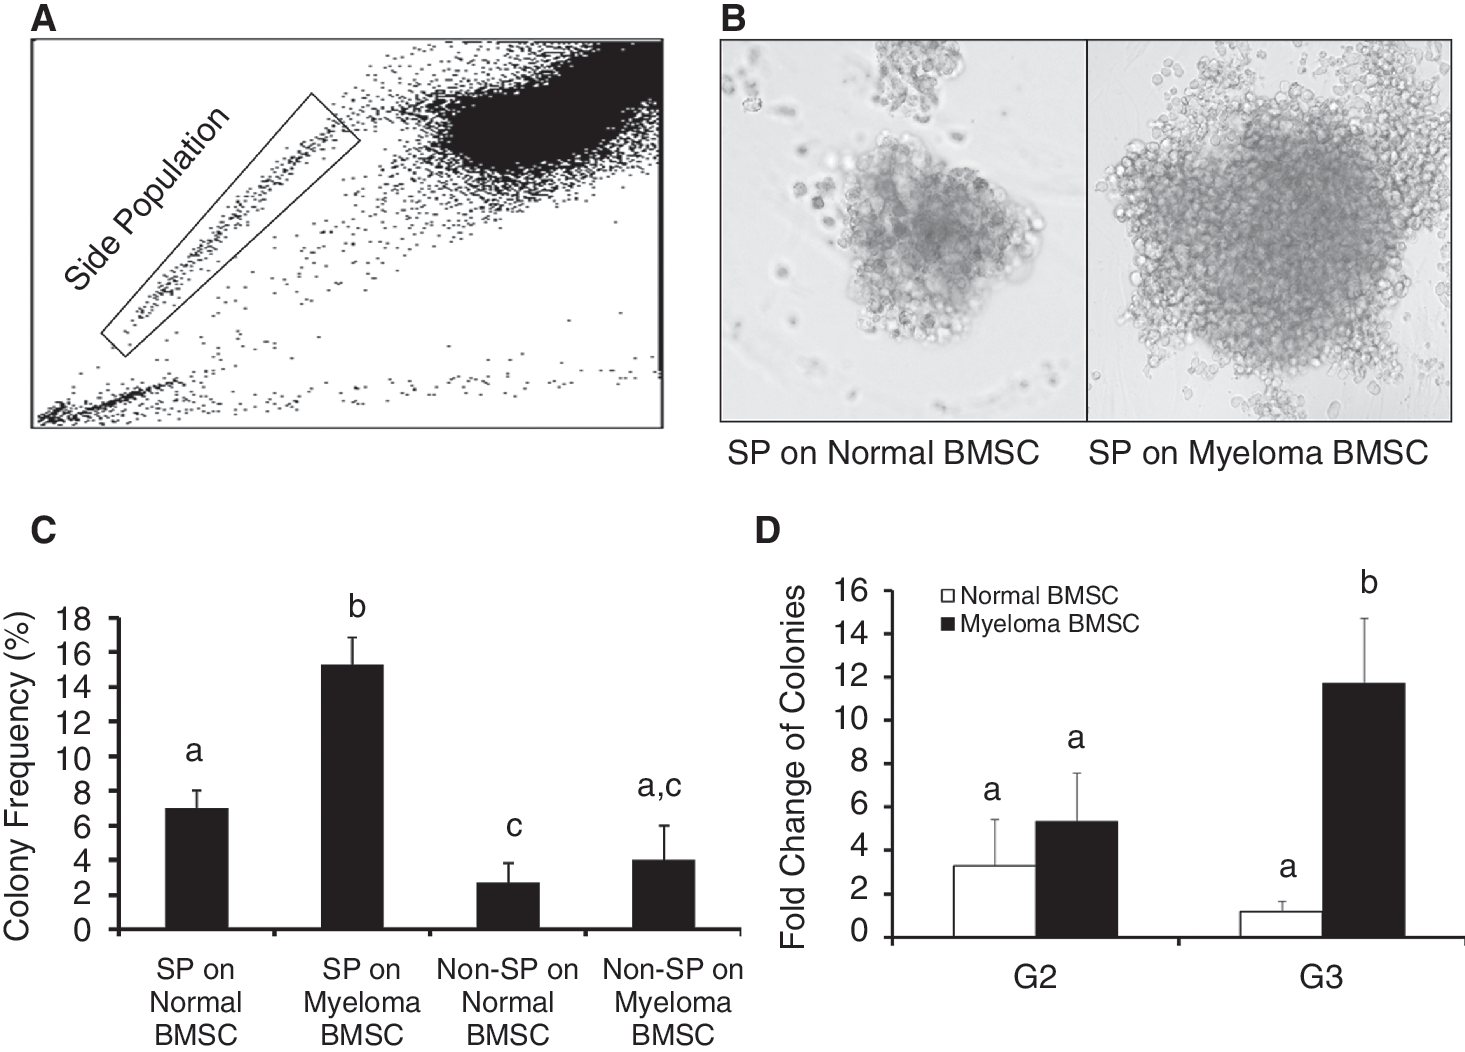
Efflux of the DNA-binding dye Hoechst 33342, through increased expression of the ABC family of membrane transporters of myeloma stem cells, allows the detection of myeloma stem cells as “side population (SP)” by flow cytometry (
Myeloma BMSCs increase the percentages of SP cells
To study if myeloma BMSCs may contribute to the expansion of SP cells, SP cells of RPMI 8226 line were sorted into a 6-well plate without BMSCs, with myeloma BMSCs or control BMSCs and cultured for 1 week. As shown in Figure 3, purified SP cells co-cultured on myeloma BMSCs maintained a higher percentage of SP cells than those cultured on control BMSCs, indicating that myeloma BMSCs support SP cell expansion (self-renewal). These results also suggest that the SP cells can differentiate and regenerate the bulk of non-SP cells.

Purified side population (SP) cells co-cultured on myeloma bone marrow stromal cells (BMSCs) maintained a higher percentage of SP cells than those cultured on control BMSCs. SP cells of RPMI 8226 line were sorted into a 6-well plate without BMSCs, with myeloma BMSCs or control BMSCs and cultured for 1 week and then subject to SP analysis by flow cytometry. Representative flow cytometric dot plots showed more SP cells after co-cultured on myeloma BMSCs than on normal BMSCs (
SP cells have higher expression of CD184 (CXCR4) compared with non-SP cells and the expression of CD184 in SP cells was increased when cultured with myeloma BMSCs
Since adhesion molecules have been shown to play important roles in the homing of cancer stem cells [25 –27], we further evaluated CD44, CD31, CD50, and CD184 expression in SP and non-SP cells by flow cytometry. Of note, the mean fluorescence intensity (MFI) of CD184 representing the average level of CD184 expression was higher in SP cells than that of non-SP cells in RPMI 8226 line (Fig. 4A). There were no significant differences in the expression of CD31, CD44, and CD50 between SP and non-SP cells (data not shown). Additionally, CD184 expression in SP cells was significantly higher when SP cells were co-cultured on myeloma BMSCs than on control BMSCs (Fig. 4B).
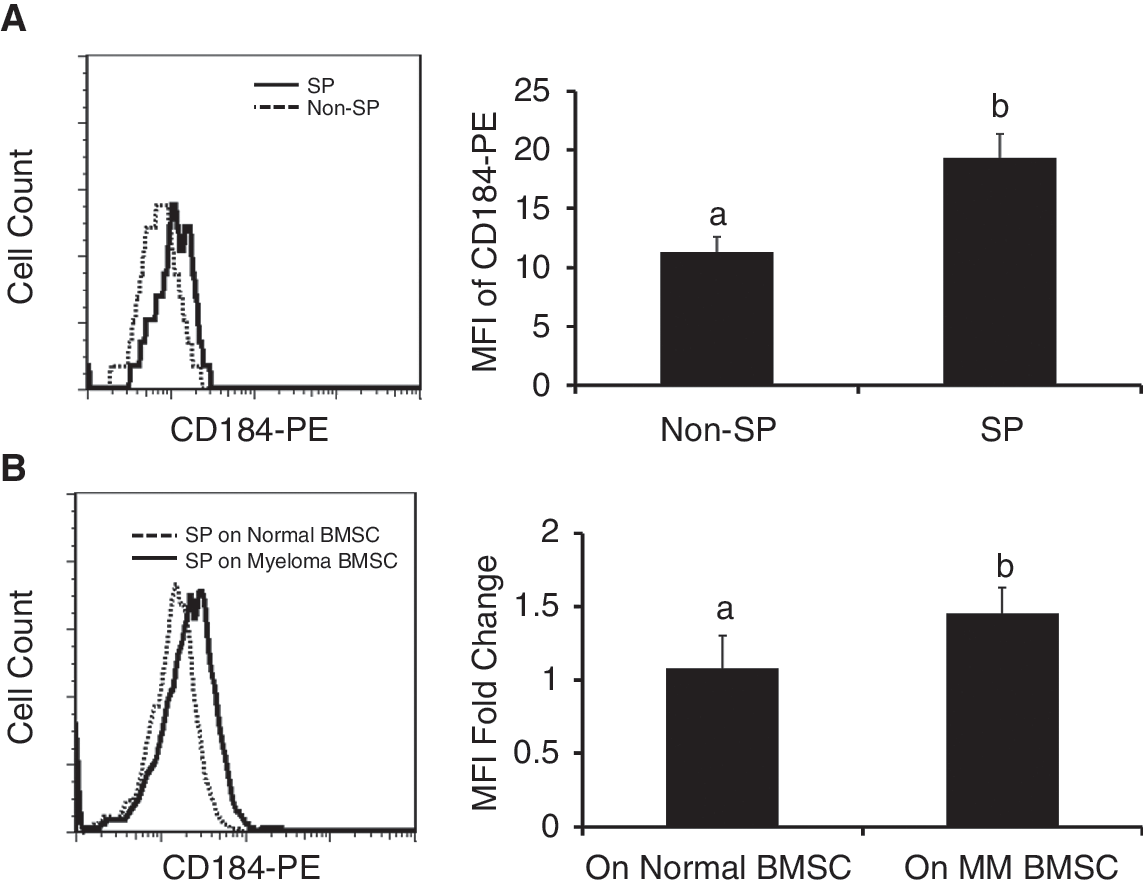
The mean fluorescence intensity (MFI) of CD184 representing the average level of CD184 expression was higher in side population (SP) cells than that of non-SP cells in RPMI 8226 line (P = 0.002, Student's t-test) (
SP cells with bright CD184 expression formed more colonies than SP cells with dim/negative CD184 expression
We then examined the effects of CD184 expression on the colony-forming ability of SP cells, since CD184 has been demonstrated to be a critical regulator in homing of HSCs and myeloma cells to bone marrow [16]. As shown in Figure 5A, CD184(+) SP cells sorted by flow cytometry formed more colonies than CD184(−) SP cells when they were cultured on myeloma BMSCs. Of note, CD184(−) SP cells did not form more colonies than non-SP cells suggesting that the CD184(+) SP cells are the subset of SP cells that have high colony-forming ability. Additionally, CD184(+) SP cells generated more colonies when grown on myeloma BMSCs than on control BMSCs (Fig. 5B). These findings suggest that myeloma BMSCs may support myeloma stem cell through CD184 signaling.
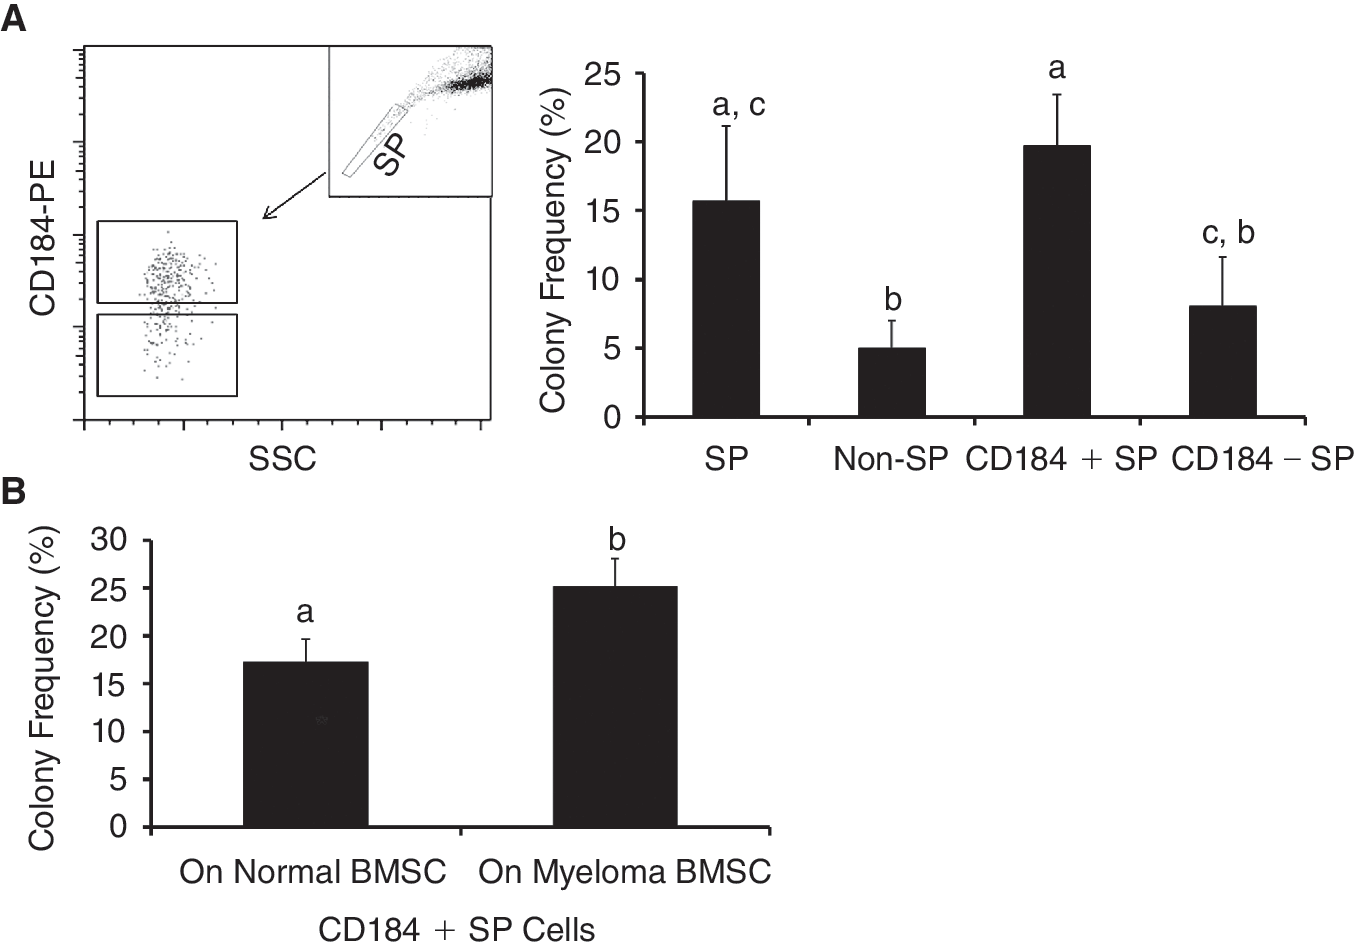
CD184(+) side population (SP) cells obtained from RPMI 8226 cell line demonstrated a higher colony-forming potential. CD184(+) SP cells or CD184(−) SP cells (left panel,
To substantiate the important roles of CD184 on colony-forming ability of SP cells, we used a CD184 inhibitor, AMD 3100, to block this chemokine receptor. We first determined the cytotoxicity of AMD 3100 at various concentrations to RPMI 8226 by MTT assay. It was found that AMD 3100 at 4 μM had no growth inhibition to RPMI 8226 (data not shown) and this concentration was used for the experiments. As is shown in Figure 6A, AMD 3100 inhibits colony formation of SP cells on both control and myeloma BMSCs. Additionally, AMD 3100 inhibited colony formation of CD184(+) SP cells, but has no effect on colony formation of non-SP or CD184(−) SP cells (Fig. 6B). Furthermore, the percentages of SP cells in RPMI 8226 line cultured on myeloma BMSCs decreased upon treatment of AMD 3100 (Fig. 6C). Additionally, as shown in Figure 6D, the activation (phosphorylation) of ERK, a downstream target of activated CD184 signaling pathway, was significantly decreased in RPMI 8226 cells upon the treatment of AMD 3100. These findings support that CD184 pathway is involved in myeloma stem cell functions.
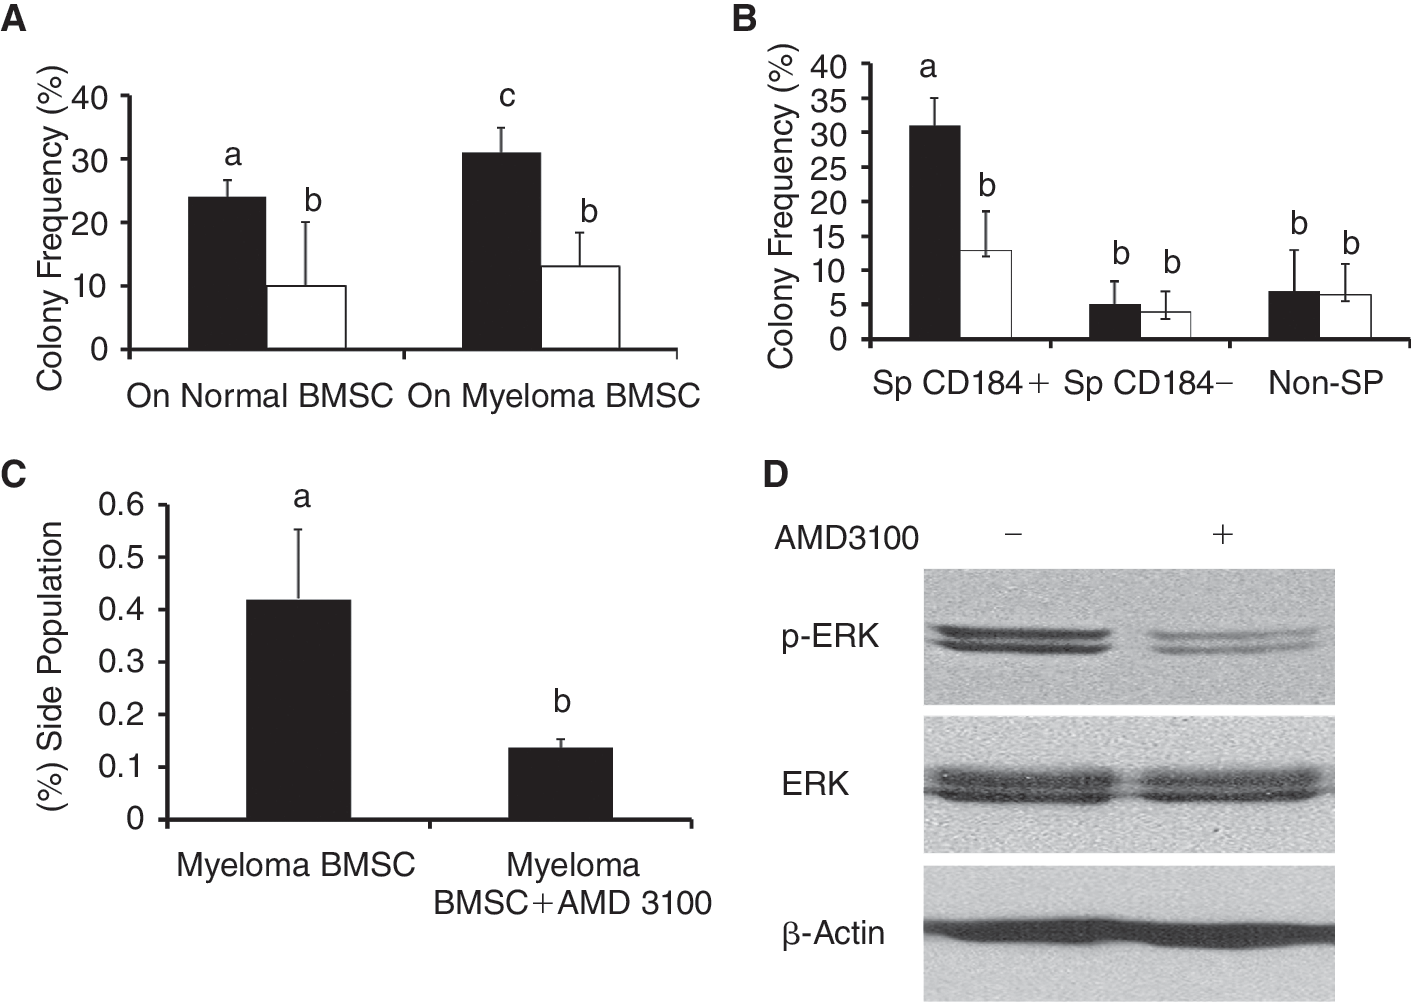
AMD 3100 treatment (open bars) inhibited colony formation by side population (SP) cells on both types of bone marrow stromal cells (BMSCs) as compared with vehicle treatment (solid bars) (
BMSCs promote the tumor-forming ability of SP cells in vivo
As shown in Figure 7A, bioluminescent imaging showed that tumors of SP cells co-injected with myeloma BMSCs grew faster than those co-injected with control BMSCS. Additionally, the marrow cells harvested from the tumor regions showed presence of both human myeloma cells and human BMSCs (Fig. 7B), confirming the engraftment of both types of human cells and the important roles of myeloma BMSCs in supporting the growth and survival of myeloma stem cells.
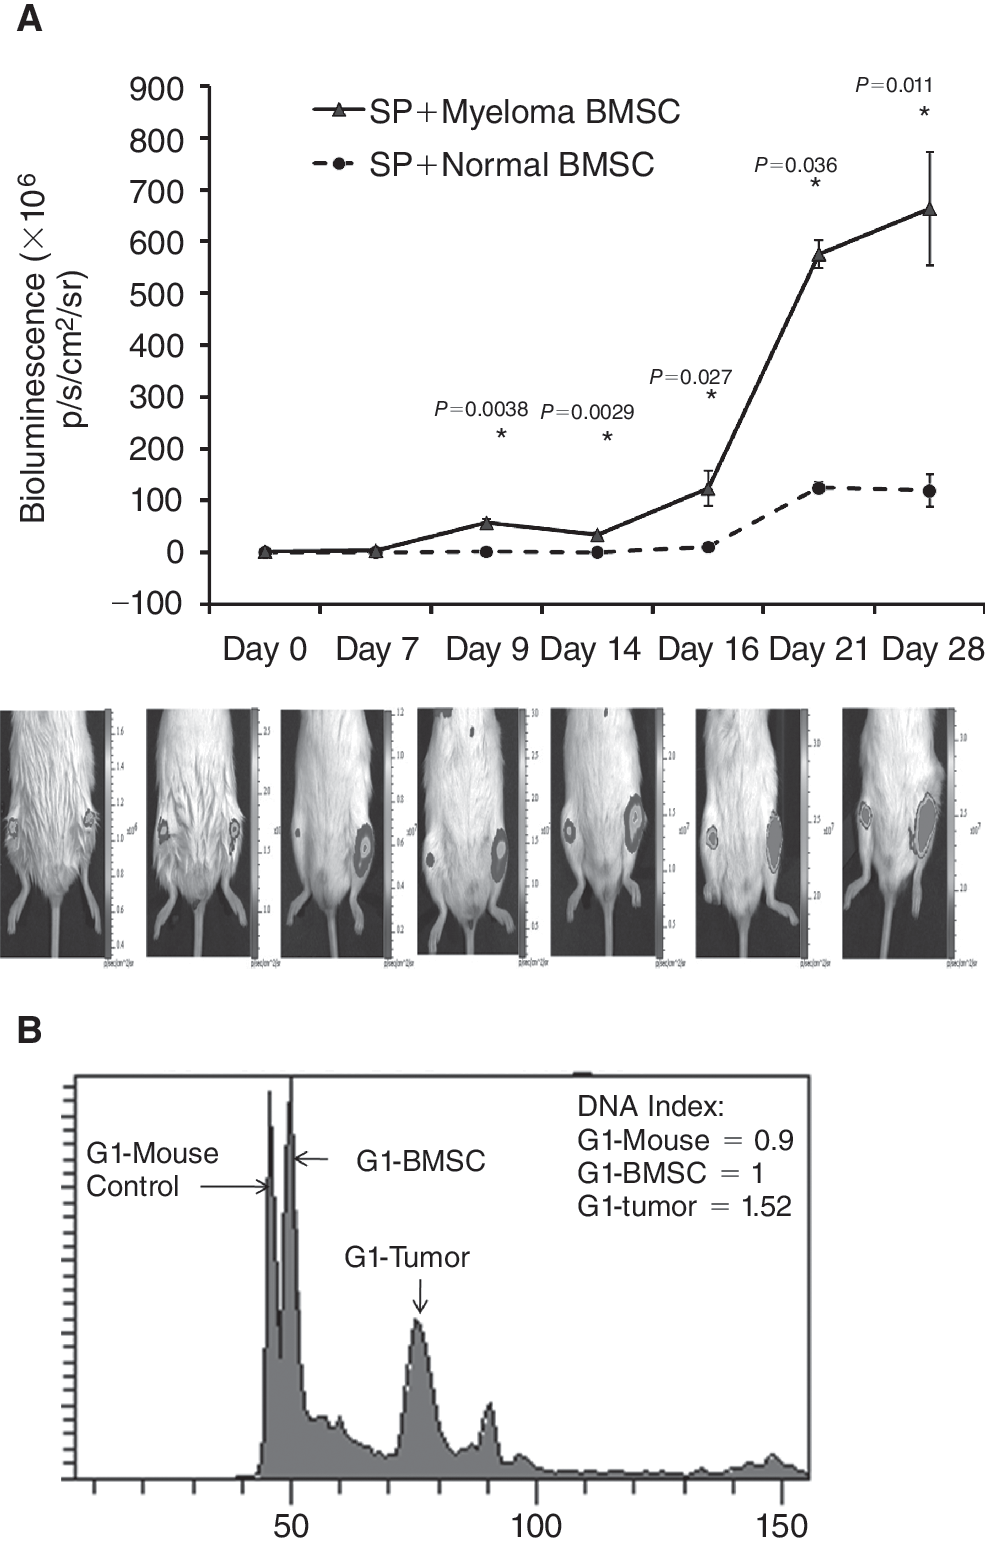
Myeloma stem cells together with myeloma bone marrow stromal cell (BMSC; left hind leg, lower panel,
Discussion
The results of the current study indicate that the niche, or microenvironment, created by myeloma BMSCs plays a key role in supporting myeloma stem cells. Although it has been shown that myeloma stromal cells contribute to mature myeloma cell growth and chemoresistance, little is known about the interplay between BMSCs and myeloma stem cells. Our results showed that the myeloma BMSCs increase the colony-forming ability, serial replating capacity (indicative of self-renewal), and percentages of myeloma stem cells recovered in vitro as compared with control BMSCs.
The enhanced tumorigenicity of myeloma stem cells by myeloma BMSCs is further validated by a novel in vivo model that co-administers the myeloma stem cells (RPMI 8226 SP cells) with either control or myeloma BMSCs. To the best of our knowledge, this model represents the first mouse model that allows studying the interaction between BMSCs and myeloma stem cells. Of note, our results indicate that myeloma BMSCs can be readily engrafted in mice as indicated by DNA index analysis (Fig. 7B). Studies are currently underway in our laboratory to examine if this model can sustain myeloma stem cells obtained from marrow samples of MM patients.
Using the “side population” (SP) as a surrogated marker, we recognize that CD184 (CXCR4), an adhesion molecule and a G-protein-coupled receptor, may play an important role in myeloma stem cells. Adhesion molecules have been shown to be involved in the interplay between BMSCs and myeloma cell. We evaluated several surface adhesion molecules and found that RPMI 8226 SP cells displayed a higher level of CD184 expression than non-SP cells. CD184(+) SP cells yielded increased colony growth when co-cultured with myeloma BMSCs compared with nonselected SP cells. Additionally, the level of CD184 expression on SP cells is increased when co-cultured on myeloma BMSCs as compared with control BMSCs. Usage of the CD184 inhibitor AMD 3100 to block CD184 results in decreased colony formation by CD184(+) SP cells along with decreased ERK activation in myeloma cells. ERK activation has been shown to be an important factor in myeloma cell proliferation [28 –30]. Thus, the CD184/ERK pathway may represent a key pathway for the interaction between myeloma stem cells and myeloma BMSCs. Further studies are needed to evaluate the mechanistic roles of this pathway.
CD184 has been demonstrated as a critical regulator in the myeloma cell homing mechanism to bone marrow [16]. In lung cancer, activation of CD184 induces cancer cell migration and adhesion to stromal cells.31 Propagation of glioma-derived cancer stem cells in a hypoxic environment also led to the expansion of cells expressing CD184 [13]. All these studies suggest the importance of CD184 in both mature and immature cancer cells and the interaction with their microenvironment. Further studies are needed to elucidate the role of CD184 in tumor genesis and progression of myeloma.
Of interest, our data suggest that tumor cells provide a yet poorly understood signaling pathway to modify the BMSCs that support their growth. Although our immunophenotypic studies of BMSCs derived from normal and myeloma bone marrows did not identify any significant differences, normal BMSCs have a slower growth rate than myeloma BMSCs (Fig. 1). Additionally, we did not find any genomic lesion of myeloma BMSCs by SNP 500K (Affymetrix) studies (data not shown) suggesting that the myeloma BMSCs are genomically normal. These findings suggest that myeloma BMSCs have been preprogrammed by the myeloma cells to promote their growth in vitro and are consistent with our previous study showing that myeloma BMSCs possess different gene expression profiles from control BMSCs [24]. In this study, myeloma BMSCs show overexpression of genes related to functions of cell-cell interaction and cellular movement upon the stimulation by myeloma cells. Additionally, we are currently performing extended co-culture of normal BMSCs with CD184(+) SPs derived from myeloma patients to examine if the stimulation of CD184(+) SP may result in a BMSC population that more resembles the BMSCs derived from myeloma patients.
Overall, our data show that myeloma BMSCs potentiate the growth and survival of myeloma stem cells, at least partially, via the CD184/SDF1 pathway. These findings suggest that development of novel methods to interrupt this interaction to eliminate the myeloma stem cells is essential for the long-term cure of myeloma.
Footnotes
Acknowledgments
This research was supported in part by a grant from The Methodist Hospital Research Institute (TMHRI) Scholar Grant 2008 and a grant by CTSA Consortium, TMHRI Houston, Texas, to CC. The authors appreciate the technical supports by James C. Bigger, MT, ASCP.
Author Disclosure Statement
No competing financial interests exist.