
Abstract
Expansion of plastic-adherent bone marrow-derived mesenchymal stem cells (MSCs) results in gradual loss of osteogenic potential after passage 5–6. One explanation is contamination of MSC cultures with mature cells including fibroblasts. Identification and elimination of fibroblasts from MSC cultures could improve MSC yield and differentiation potential and also prevent tumor formation after MSC transplantation. However, no specific markers currently exist that can reliably discriminate between MSCs and fibroblasts. Flow cytometry analysis demonstrated that markers currently used to define MSCs, such as CD105, CD166, CD90, CD44, CD29, CD73, and CD9, are also expressed on human skin or lung fibroblasts. However, the level of expression of CD166 was significantly higher and that of CD9 was significantly lower in MSCs than in fibroblasts. CD146 was expressed only in MSCs. Using small focused microarrays, new markers differentially expressed in MSCs and fibroblasts were identified. Real-time polymerase chain reaction confirmed that expression of CD106, integrin alpha 11, and insulin-like growth factor-2 in MSCs was at least 10-fold higher than in fibroblasts; whereas expression of matrix metalloproteinase 1 and matrix metalloproteinase 3 was almost 100-fold lower. Flow cytometry and immunostaining demonstrated that CD106 protein expression on cell surface could be upregulated in MSCs but not in fibroblasts by the treatment with tumor necrosis factor-alpha. Comparison of surface expression of commonly used and newly identified MSC markers in MSCs cultures of passage 2 and passage 6 demonstrated that CD106 (with and without tumor necrosis factor-alpha treatment), integrin alpha 11, and CD146 were downregulated in MSCs of passage 6, and CD9 was upregulated; whereas all other markers did not change. Newly identified markers that have robust differences of expression in MSCs and fibroblasts on gene and protein level could be used for quality control of MSC cultures after expansion, cryopreservation, gene transfection, and other manipulations.
Introduction
H
In this study, by comparison of MSCs and dermal fibroblasts using small focused microarrays, real-time polymerase chain reaction (PCR), and flow cytometry, we identified several gene and protein markers of MSCs that distinguished them from fibroblast-like, less potent phenotype. In contrast, as shown by flow cytometry, currently used markers of MSCs were expressed on both MSCs and fibroblasts. The usefulness of the new markers for assessment of the quality of expanded MSCs was demonstrated by comparison of their surface expression in early and late passages of MSC cultures. These markers could be used as a fast and efficient tool for quality control of expanded MSCs.
Materials and Methods
Isolation of MSCs
BM aspirates were purchased from Lonza and delivered within 36 h to Israel at 4°C. MSCs were isolated according to the commonly used protocol [12]. Briefly, MNCs were first isolated on lymphocyte separation medium (MP Biomedicals, LLC) according to manufacturer instructions, resuspended in MSC growth medium (Lonza; Cat. No. PT-3001), plated at 10 × 106/100 mm culture dish (Nunc) precoated with 10 μg/mL bovine fibronectin (Biological Industries) for 2 h at 37°C, and washed thrice with phosphate-buffered saline (PBS). In some cases, separation of MNCs was omitted; and unprocessed BM was plated at 3 mL/100 mm dish. The dish was kept in a cell incubator for 36 h, then washed thrice with warm alpha-minimum essential medium eagle (MEM) and remaining adherent cells were grown to confluency (about 2 weeks) while changing medium twice a week, and then passaged for up to 6 passages by plating 5,000 cells/cm2. The average yield of MSCs at confluency was 50–60,000 cells/cm2, suggesting 3–4 cell doublings between passages. All MSC batches used in the experiments were derived from different BM donors. Comparison of early and late passages of MSCs was performed using batches from different donors, each at passage 2 and passage 6, respectively.
Cultures of human fibroblasts
Primary human adult dermal (Cat. No. CC2511) and lung (Cat. No. 2512) fibroblasts were purchased from Lonza together with the fibroblast medium (Cat. No. 3132) and were cultured according to the company's instructions up to passage 5.
Osteogenic differentiation of human MSCs
Cells were detached with 0.25% trypsin-EDTA, resuspended in growth medium, and plated at 3,000 cells/cm2. Next day, GM was replaced by osteogenic medium [alpha-MEM (Sigma), 10% fetal calf serum heat inactivated (Biological Industries), 0.2 mM L-ascorbic acid-2-phosphate (Mg salt n-hydrated) (Fluka Chemicals), 10 mM Glycerol 2-phosphate disodium salt hydrate (Sigma), 10 nM dexamethasone (Sigma); 2 mM GlutaMAX™-I Supplement (Invitrogen), 100 U/mL penicillin; 0.1 mg/mL streptomycin; 0.25 mg/mL amphotericin B] The cells were grown for various periods of time while the medium was changed twice a week.
Measurements of alkaline phosphatase activity
Cells growing in osteogenic medium in 24-well plates for 2 weeks were lysed with 0.5 mL cold lysis buffer [1 mM MgCl2/0.5% Triton × 100 in alkaline buffer solution (Sigma; Cat. No. A9226)] and incubated on ice for 1 h. The lysates were centrifuged at 13,000 rpm, and 100 μL cell lysate was combined with 400 μL phosphatase substrate solution [20 mg/mL of p-nitrophenol phosphate (Sigma; Cat. No. N4645) in 5 mL alkaline buffer solution diluted 1:3 in ddH2O] and incubated at 37°C for 10 min. The reaction was stopped with 500 μL EDTA-NaOH stop solution (20 g NaOH plus 37.22 g Na2EDTA in 500 mL ddH2O). Two hundred microliters of each sample was transferred to a 96-well plate, and absorbance was read at 404 nm using Synergy-BioTek plate reader. The results were expressed as nmol p-nitrophenol/mL/min and normalized to the number of live cells in corresponding wells.
Fast Blue staining for alkaline phosphatase activity
MSCs growing in osteogenic medium for 2 weeks were washed once with PBS, fixed with citrate buffered acetone [2 volumes of diluted 1:50 with ddH2O citrate concentrate solution (Sigma; Cat. No. 85-4C) and 3 volumes of acetone] for 30 s at room temperature (RT), and washed for 45 s with ddH2O. A mixture of 2 mL naphthol AS-MX-phosphate alkaline solution (Sigma; Cat. No. 855) as an alkaline phosphatase (ALP) substrate and 48 mL Fast Blue RR salt (Sigma; Cat. No. FBS25) was added to cell cultures for 30 min at RT, and then the dye was rinsed with ddH2O for 2 min.
Quantitation of calcium deposition
The cells growing in osteogenic medium in 24-well plates for 3 weeks were washed with PBS/no Ca++ and Mg++ and then lysed with 250 μL/well 0.5 N HCl. The lysates were shaken at 4°C overnight to extract calcium and then centrifuged at 13,000 rpm for 2 min. The assay was set up in 96-well plates using Calcium Liquicolor kit from Stanbio Labs (Cat. No. 0150) according to the manufacturer's instructions. The reaction mixture was incubated for 60 min at 37°C, and then absorbance was measured at 550 nm using Synergy-BioTek plate reader. The amount of Ca++ was normalized to the number of live cells in corresponding wells.
Alizarin red S staining for extracellular mineralization
MSCs growing in osteogenic medium for 3 weeks were washed once with PBS and fixed with 4% formaldehyde for 15 min at RT. After washing thrice with PBS, aqueous solution 5 mg/mL alizarin red S (Sigma; Cat. No. A5533) was added to the cells for 1 min; and the cells were washed thrice with ddH2O at 1 mL/well for 5 min each wash while shaking.
Adipogenic differentiation of human MSCs
Adipogenic differentiation was induced using Adipogenic Differentiation BulletKit® (Lonza) according to the manufacturer's instructions. Briefly, cells were resuspended in growth medium, plated at 20,000 cells/cm2, and grown for 7 days until confluency. At 100% confluence, 3 cycles of 3 day induction with adipogenesis induction medium followed by 3 days of culture in adipogenesis maintenance medium were performed. After completion of the 3 cycles, cells were cultured for an additional 7 days in adipogenesis maintenance medium. To document the adipogenic differentiation, cultures were rinsed with PBS, fixed with 10% buffered formalin, and stained with oil red O (Sigma).
Chondrogenic differentiation of MSCs
Chondrogenic capacity of MSCs was examined in an optimized 3D micromass culture system adopted from Johnstone et al. [13].
Quantitation of cell number with calcein-AM
Cells were incubated with 5 μM calcein-AM (Invitrogen) in Dulbecco's modified Eagle medium (DMEM) without phenol red at 37°C for 30 min. Calcein-AM solution was replaced with PBS, and fluorescence of live cells was read on Synergy-BioTek plate reader at excitation/emission of 485/530 nm. For the standard curve, serial dilutions of MSCs or bone progenitor cell suspensions prestained with calcein-AM were plated onto a 24-well plate. The cells were spun down to the bottom of the wells, and calcein-AM fluorescence was measured.
Staining cells with antibodies for flow cytometry analysis
Cells were trypsinized, resuspended in FACS buffer [2% bovine serum albumin (Sigma), 2% human blocking serum (Chemicon) in DMEM without phenol red (Sigma), pH = 7.4], and aliquoted at 100,000/100 μL FACS buffer onto a polypropylene U-shaped 96-well plate. Each cell aliquot was incubated with saturating concentrations of antibodies on ice for 30 min. At the end of the incubation, the plate was centrifuged at 200 g for 3 min and inverted onto a paper towel to drain the supernatant. The cells were washed twice in 200 μL FACS buffer and transferred into a polypropylene FACS test tube containing 0.5 mL FACS buffer. The samples were kept on ice and in the dark until running on FACSAria (BD). The list of antibodies used in the experiments is shown in Table 1.
MSC, mesenchymal stem cell.
RNA isolation
RNA isolation was performed using the RNeasy kit (Qiagen). Cells grown in 25 cm2 flasks were trypsinized, pelleted, counted, and then lysed using the recommended amount of RNeasy lysis buffer (containing β-mercaptoethanol). Chondrocyte pellet cultures were directly lysed. Lysates were homogenized by passing through a 20-gauge needle and were then mixed with a 1:1 volume of 70% ethanol and loaded on Qiagen columns. To rule out presence of genomic DNA, DNAase digestion was performed using RNAase-free DNAase (Qiagen; Cat. No. 79254) according to the manufacturer's protocol (15 min digestion at RT). Absorbance at 260 and 280 nm of RNA samples was measured using UltrospecTM 2100-Pro spectrophotometer (Amersham Biosciences) to estimate RNA yield and purity. RNA was aliquoted and frozen at −80°C. Aliquots of RNA were thawed on ice, and RNA integrity was confirmed by electrophoresis in 2% agarose gel.
Real-time PCR
Real-time PCR was performed using Applied Biosystems 7500 machine. TaqMan-based primers for MSC markers CD106 (ID: Hs 00174239_m1; NM_001078); integrin alpha 11 (ITGA11) (ID: Hs 00201927_m1; NM_001004439.1); insulin-like growth factor 2 (IGF-2) (ID: Hs 00171254_m1; NM_000612.4), matrix metalloproteinase 1 (MMP1) (ID: Hs 00899658_m1; NM_002421.2), matrix metalloproteinase 3 (MMP3) (ID: Hs 00968308_m1; NM_002422.3), and for chondrocyte-specific-genes Aggrecan (ID: Hs00202971; NM_013227.2); collagen 2A1 variant 1 (ID: Hs01064869; NM_033150.2) and collagen 2A1 variant 2 (ID: Hs00156568; NM_001844.4) were purchased from Applied Biosystems. Thirty-eight nanograms RNA were used per each cDNA sample. Delta-Ct was calculated by subtraction Ct value of TATA box binding protein (TBP) gene (NM_003194.3) (endogenous control). The results were analyzed via “Relative Quantification Program” [14,15], where the results were normalized to one of the samples. Real-time PCR products for collagen 2A were run in 2% agarose gel.
Real-time PCR plates
Primers for SYBR green-based real-time PCR quantitation of gene expression of 3 MSC markers CD106, ITGA11, and IGF-2; 2 fibroblast markers MMP1 and MMP3; and for a previously known MSC marker CD105 were designed and arranged on a 96-well plate by SABiosciences and could be available on request. Probes for housekeeping genes, ribosomal protein S18 (RPS18) and TBP, that were consistently expressed in all types of cells were included in the plate for a reference. However, Delta-Ct was calculated by subtraction Ct value of TBP only. The relative expression of mRNA was calculated, using dermal fibroblasts (NHDF) as a reference (see above).
Focused DNA microarrays
Human “Cell Surface Markers” and “Common Cytokines” Oligo GEArrays were purchased from SABioSciences (Cat. No. OHS-021 and OHS-055). RNA isolated from MSCs and fibroblasts was compared by blotting the same amount of RNA onto 2 identical copies of the array membranes, and the arrays were simultaneously processed (in pairs) using the same reagent mixture according to the manufacturer's instructions. The image of the array membrane was produced by BioRad Gel Doc™ XR imaging system (see Fig. 1 for illustration). Optical density (OD) of each spot corresponding to the level of expression of each gene was analyzed by Scion Image software on each array and was normalized to the optical density of the housekeeping gene on the same array, and these values were compared between MSC RNA blots and fibroblast RNA blots by normalizing an MSC value to a corresponding fibroblast value. RNA from at least 4–5 batches of MSCs each from a different donor and 3 commercial lots of fibroblasts was compared in different combinations; comparison was repeated at least thrice to confirm reproducibility of the differences.

Microarray images. RNA was isolated from MSCs and fibroblasts and applied to a surface marker microarray as described in Materials and Methods section. A representative image of the pair of array membranes that was produced by BioRad Gel Doc™ XR imaging system is shown as an illustration.
Results
Three lineage differentiation of MSCs
MSCs were derived from fresh BM as described in Materials and Methods section. The average yield of p0 MSCs (at confluency, approximately at 2 weeks after plating of 10 × 106 MNCs onto a 100 mm dish) was 0.39 ± 0.3 × 10⁶ (mean ± SD; n = 36). All MSC batches were tested for the ability to differentiate into bone progenitors. Incubation of MSCs in osteogenic medium resulted in increase of ALP surface expression and activity and in extracellular Ca++ deposition (Table 2). Osteogenic differentiation was also visualized by staining for ALP with Fast Blue and for mineralized nodules with alizarin red S (Fig. 2A, B). Randomly chosen batches were also tested for the ability to differentiate into adipocytes as shown by oil red staining (Fig. 2C) and chondrocytes as demonstrated by real-time PCR for cartilage-specific proteins, collagen 2A, and aggrecan (Fig. 2D).
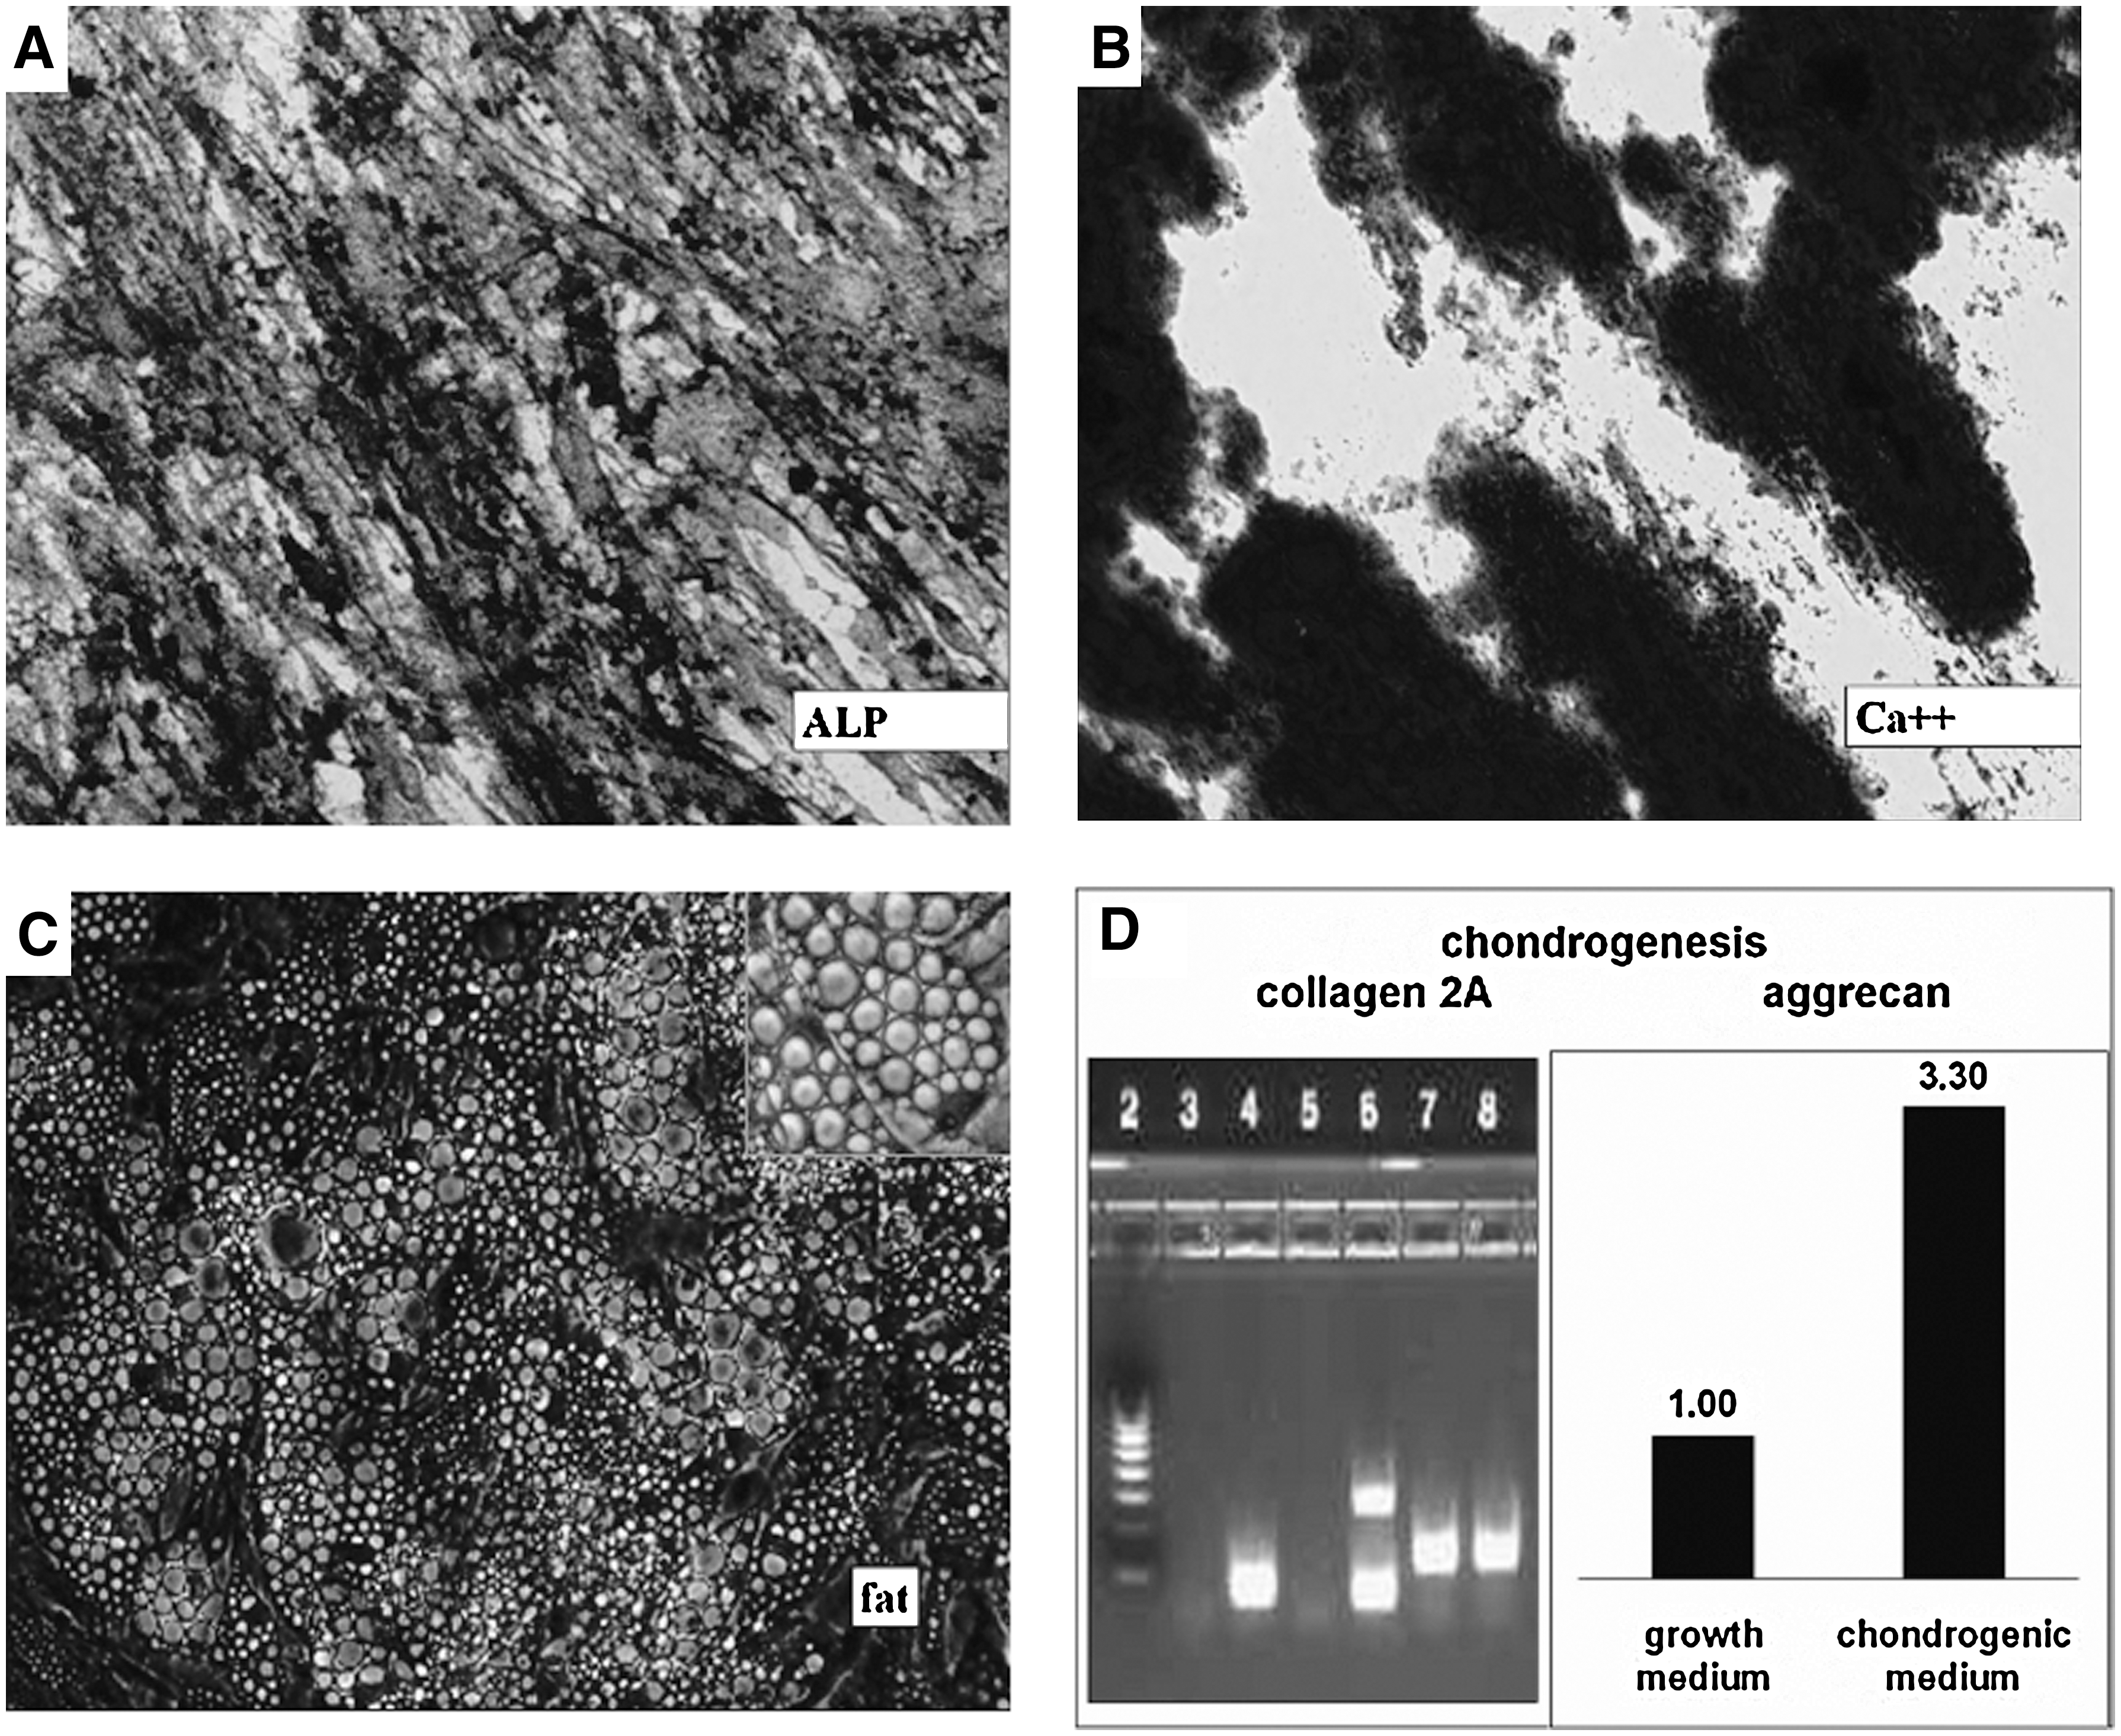
Multilineage differentiation capacity of isolated mesenchymal stem cells (MSCs). MSCs were incubated in corresponding differentiation media to induce osteogenic, adipogenic, and chondrogenic differentiation. Differentiation into osteogenic lineage was demonstrated by enhancement of alkaline phosphatase (ALP) activity
Mean fluorescence fold increase over undifferentiated cells.
ALP activity: nmol p-nitrophenol/min/10,000 cells.
Calcium depositions mg/10,000 cells.
ALP, alkaline phosphatase.
Expression of commonly used MSC markers in MSCs and fibroblasts
Sixteen batches of MSCs from different donors and 7 commercial lots of primary human fibroblasts (5 lots of dermal fibroblasts and 2 lots of lung fibroblasts) were stained with antibodies against common MSC markers, CD105, CD29, CD73, CD44, CD90, CD166, and CD9 and also for hematopoietic cell marker CD45. None of the batches expressed CD45 (data not shown), and all the batches of both MSCs and fibroblasts were positive for all the other markers tested (see representative histograms in Fig. 3A). Comparison of levels of marker expression on MSCs and fibroblasts showed no statistical differences in the percentage of positive cells and mean fluorescence for markers CD105, CD29, CD73, CD44, and CD90 (data not shown). However, expression of CD166 was significantly higher on MSCs than on fibroblasts both in terms of percentage of CD166-positive cells and of mean fluorescence. CD9 expression had the opposite pattern. It was significantly higher in fibroblasts than in MSCs (Fig. 3B, C)>. All MSC batches were subjected to osteogenic differentiation; and increase in ALP expression, ALP activity, and amount of Ca++ deposited into extracellular space was measured. The average results are presented in Table 2 (gray). Three MSC lines with “fibroblast-like” pattern of expression of CD166 and/or CD9, which had the same morphologically as other MSCs, were shown to perform poorly in the tests of osteogenic differentiation with results significantly below average levels (Table 2).
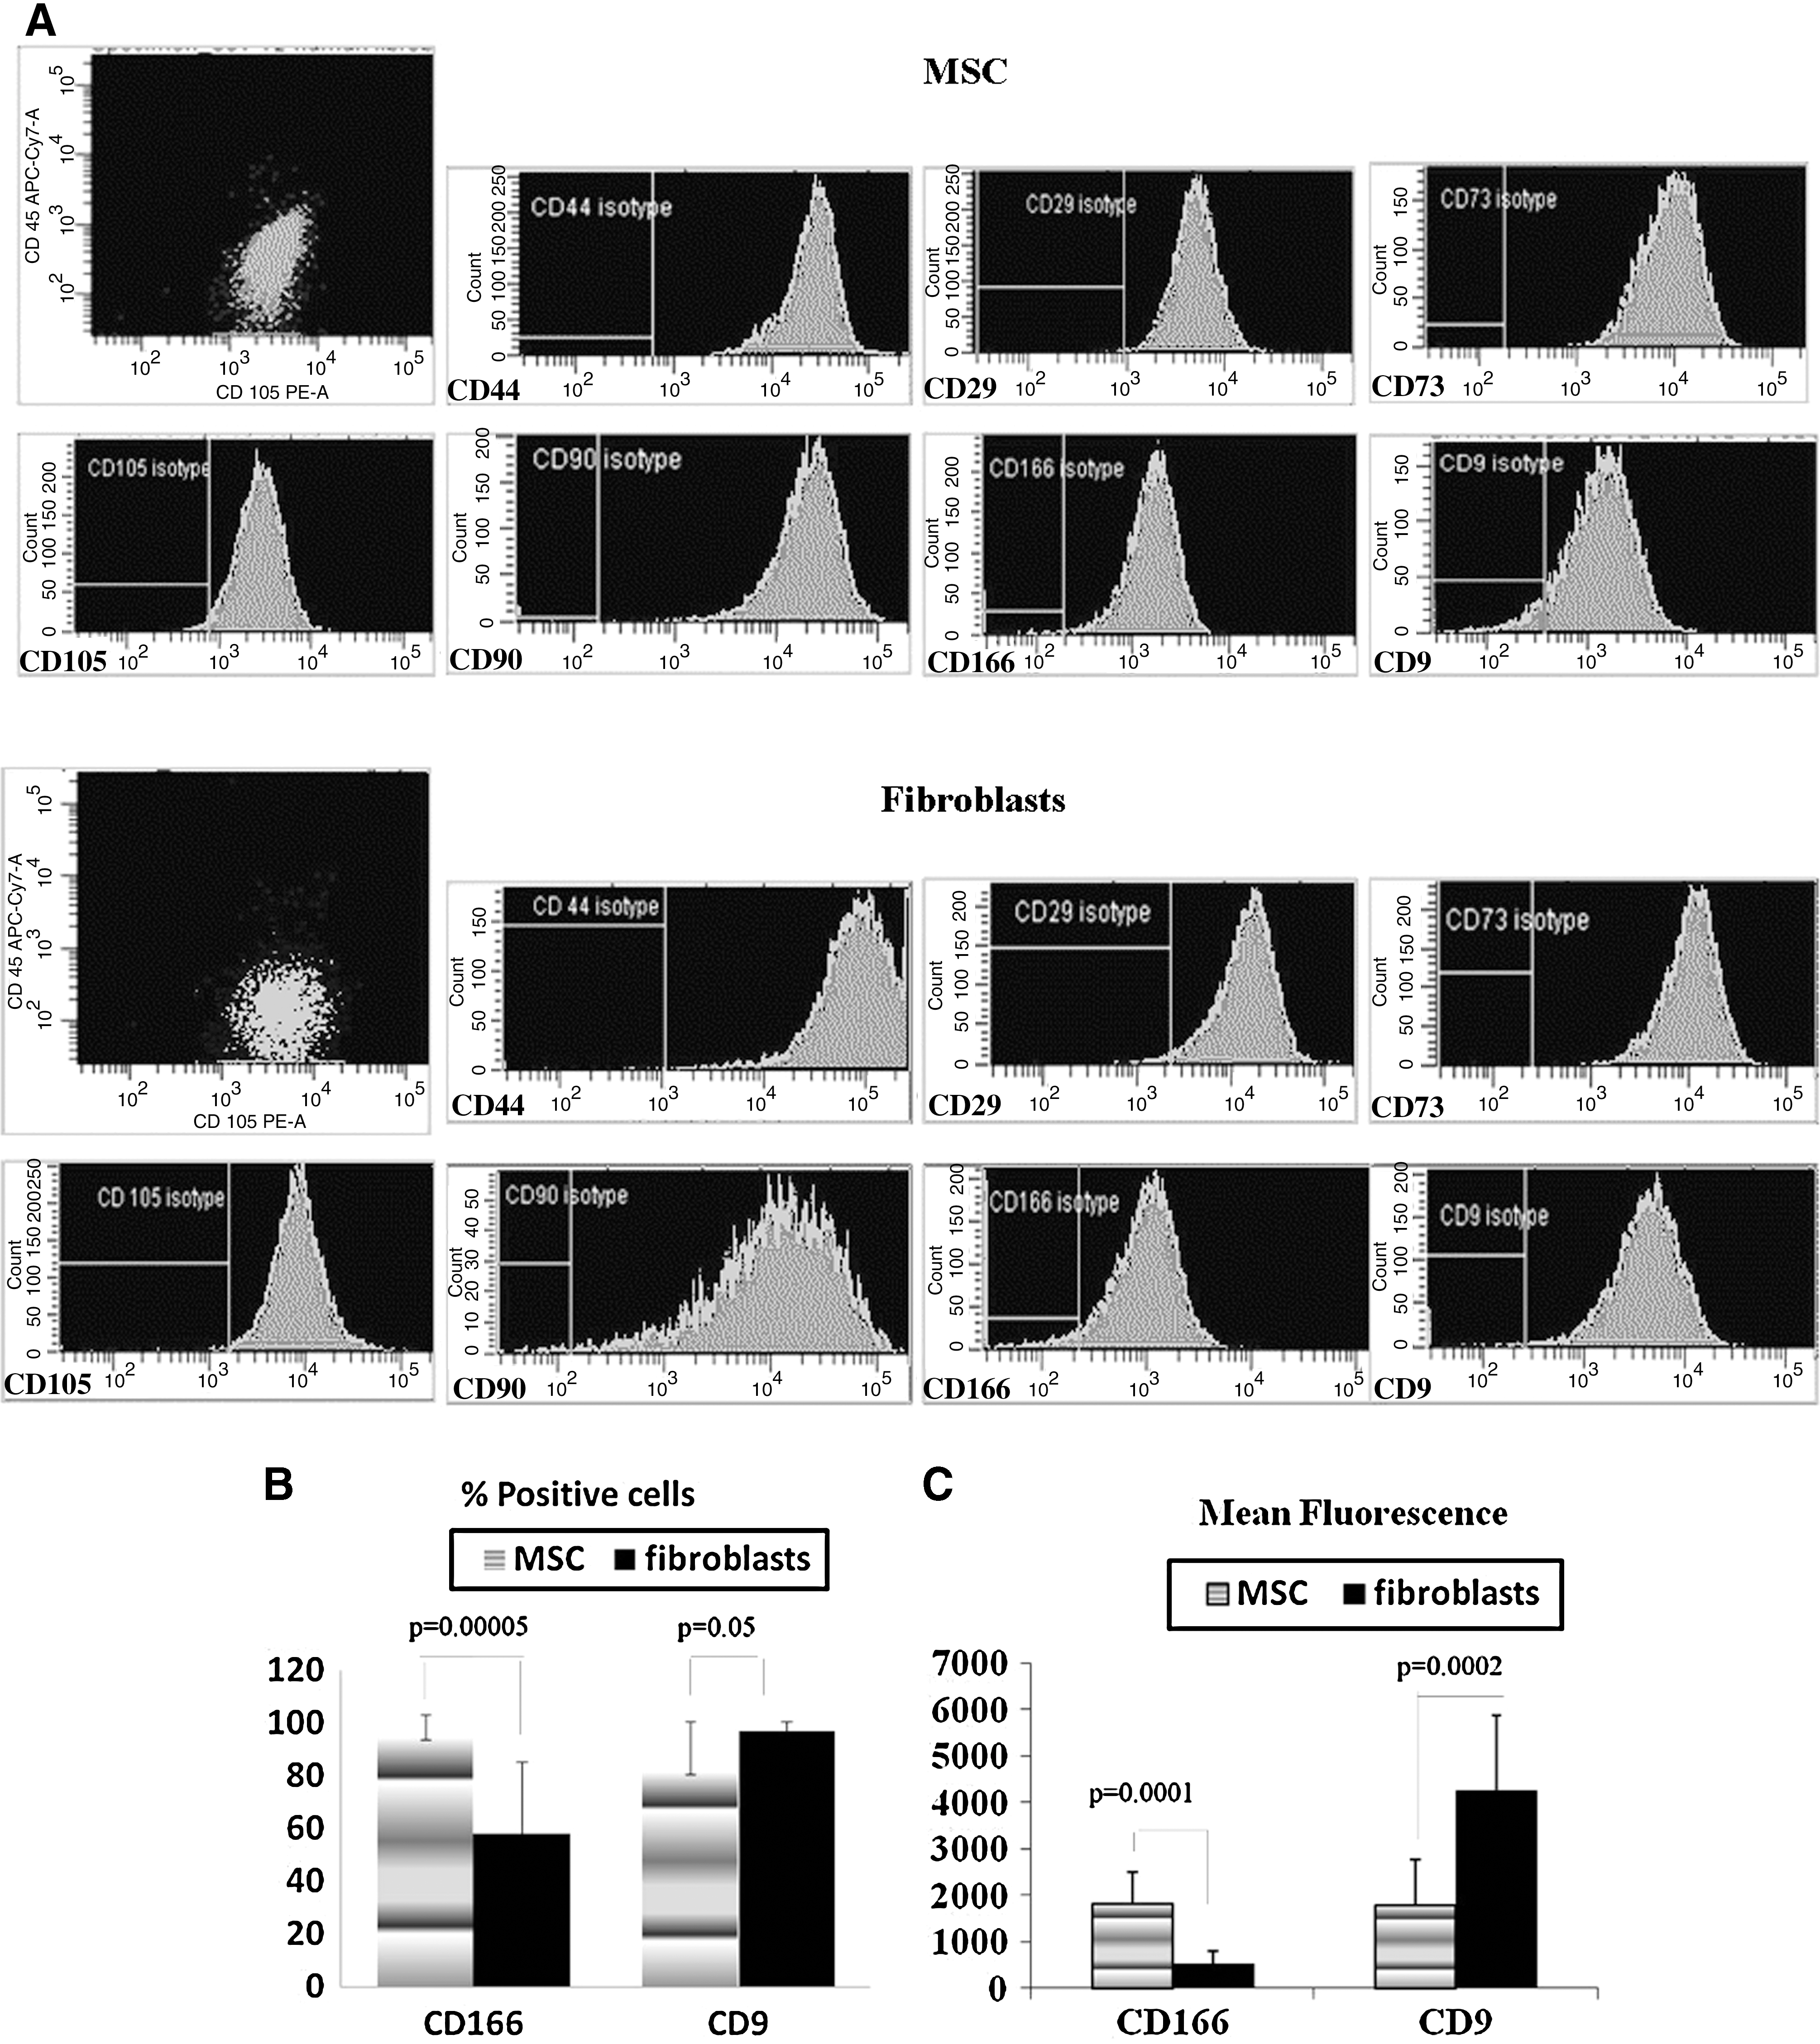
Flow cytometry analysis of common MSC markers in MSCs and fibroblasts. MSCs and fibroblasts were trypsinized and stained with antibodies against CD105, CD29, CD73, CD44, CD90, CD166, and CD9. Stained cells were analyzed on FACSAria flow cytometer at identical settings.
Screening for new markers
RNA isolated from MSCs and fibroblasts was compared in 2 focused microarrays from SABiosciences: “Cell Surface Markers” and “Extracellular Matrix and Adhesion Molecules.” These arrays were chosen, because most of the genes on these arrays encoded cell surface molecules and, thus, could have a potential for flow cytometry analysis. The genes demonstrating 4–5-fold differences in expression between MSCs and fibroblasts were accepted for further analysis and validation by real-time PCR, which is a more quantitative and better reproducible method. The array experiment was repeated 4–6 times with different MSC and fibroblast pairs from different batches (donors) to confirm that the differences in gene expression were reproducible. Table 3 demonstrates consistency of the screening test for the chosen genes. The amount of mRNA for each gene was on average more than 5-fold higher in MSCs compared with fibroblasts, and SD was around 30%–40% of the mean. Three genes have been identified that were consistently higher expressed in MSCs than in fibroblasts: CD106, ITGA11, and IGF-2. Two other genes, MMP1 and MMP3, were highly expressed in fibroblasts and much less in MSCs (Table 3). These findings have been verified with real-time PCR, using TaqMan fluorescence-based primers for the genes. Quantitative PCR showed >50–100-fold difference in expression of CD106 (Fig. 4A), more than 20-fold difference in expression of ITGA11 (Fig. 4B) and 10–20-fold differences in expression of IGF-2 (Fig. 4C). Expression of MMP1 and MMP3 was more than 100–1,000 fold higher in fibroblasts than in MSCs (Fig. 4D, E).
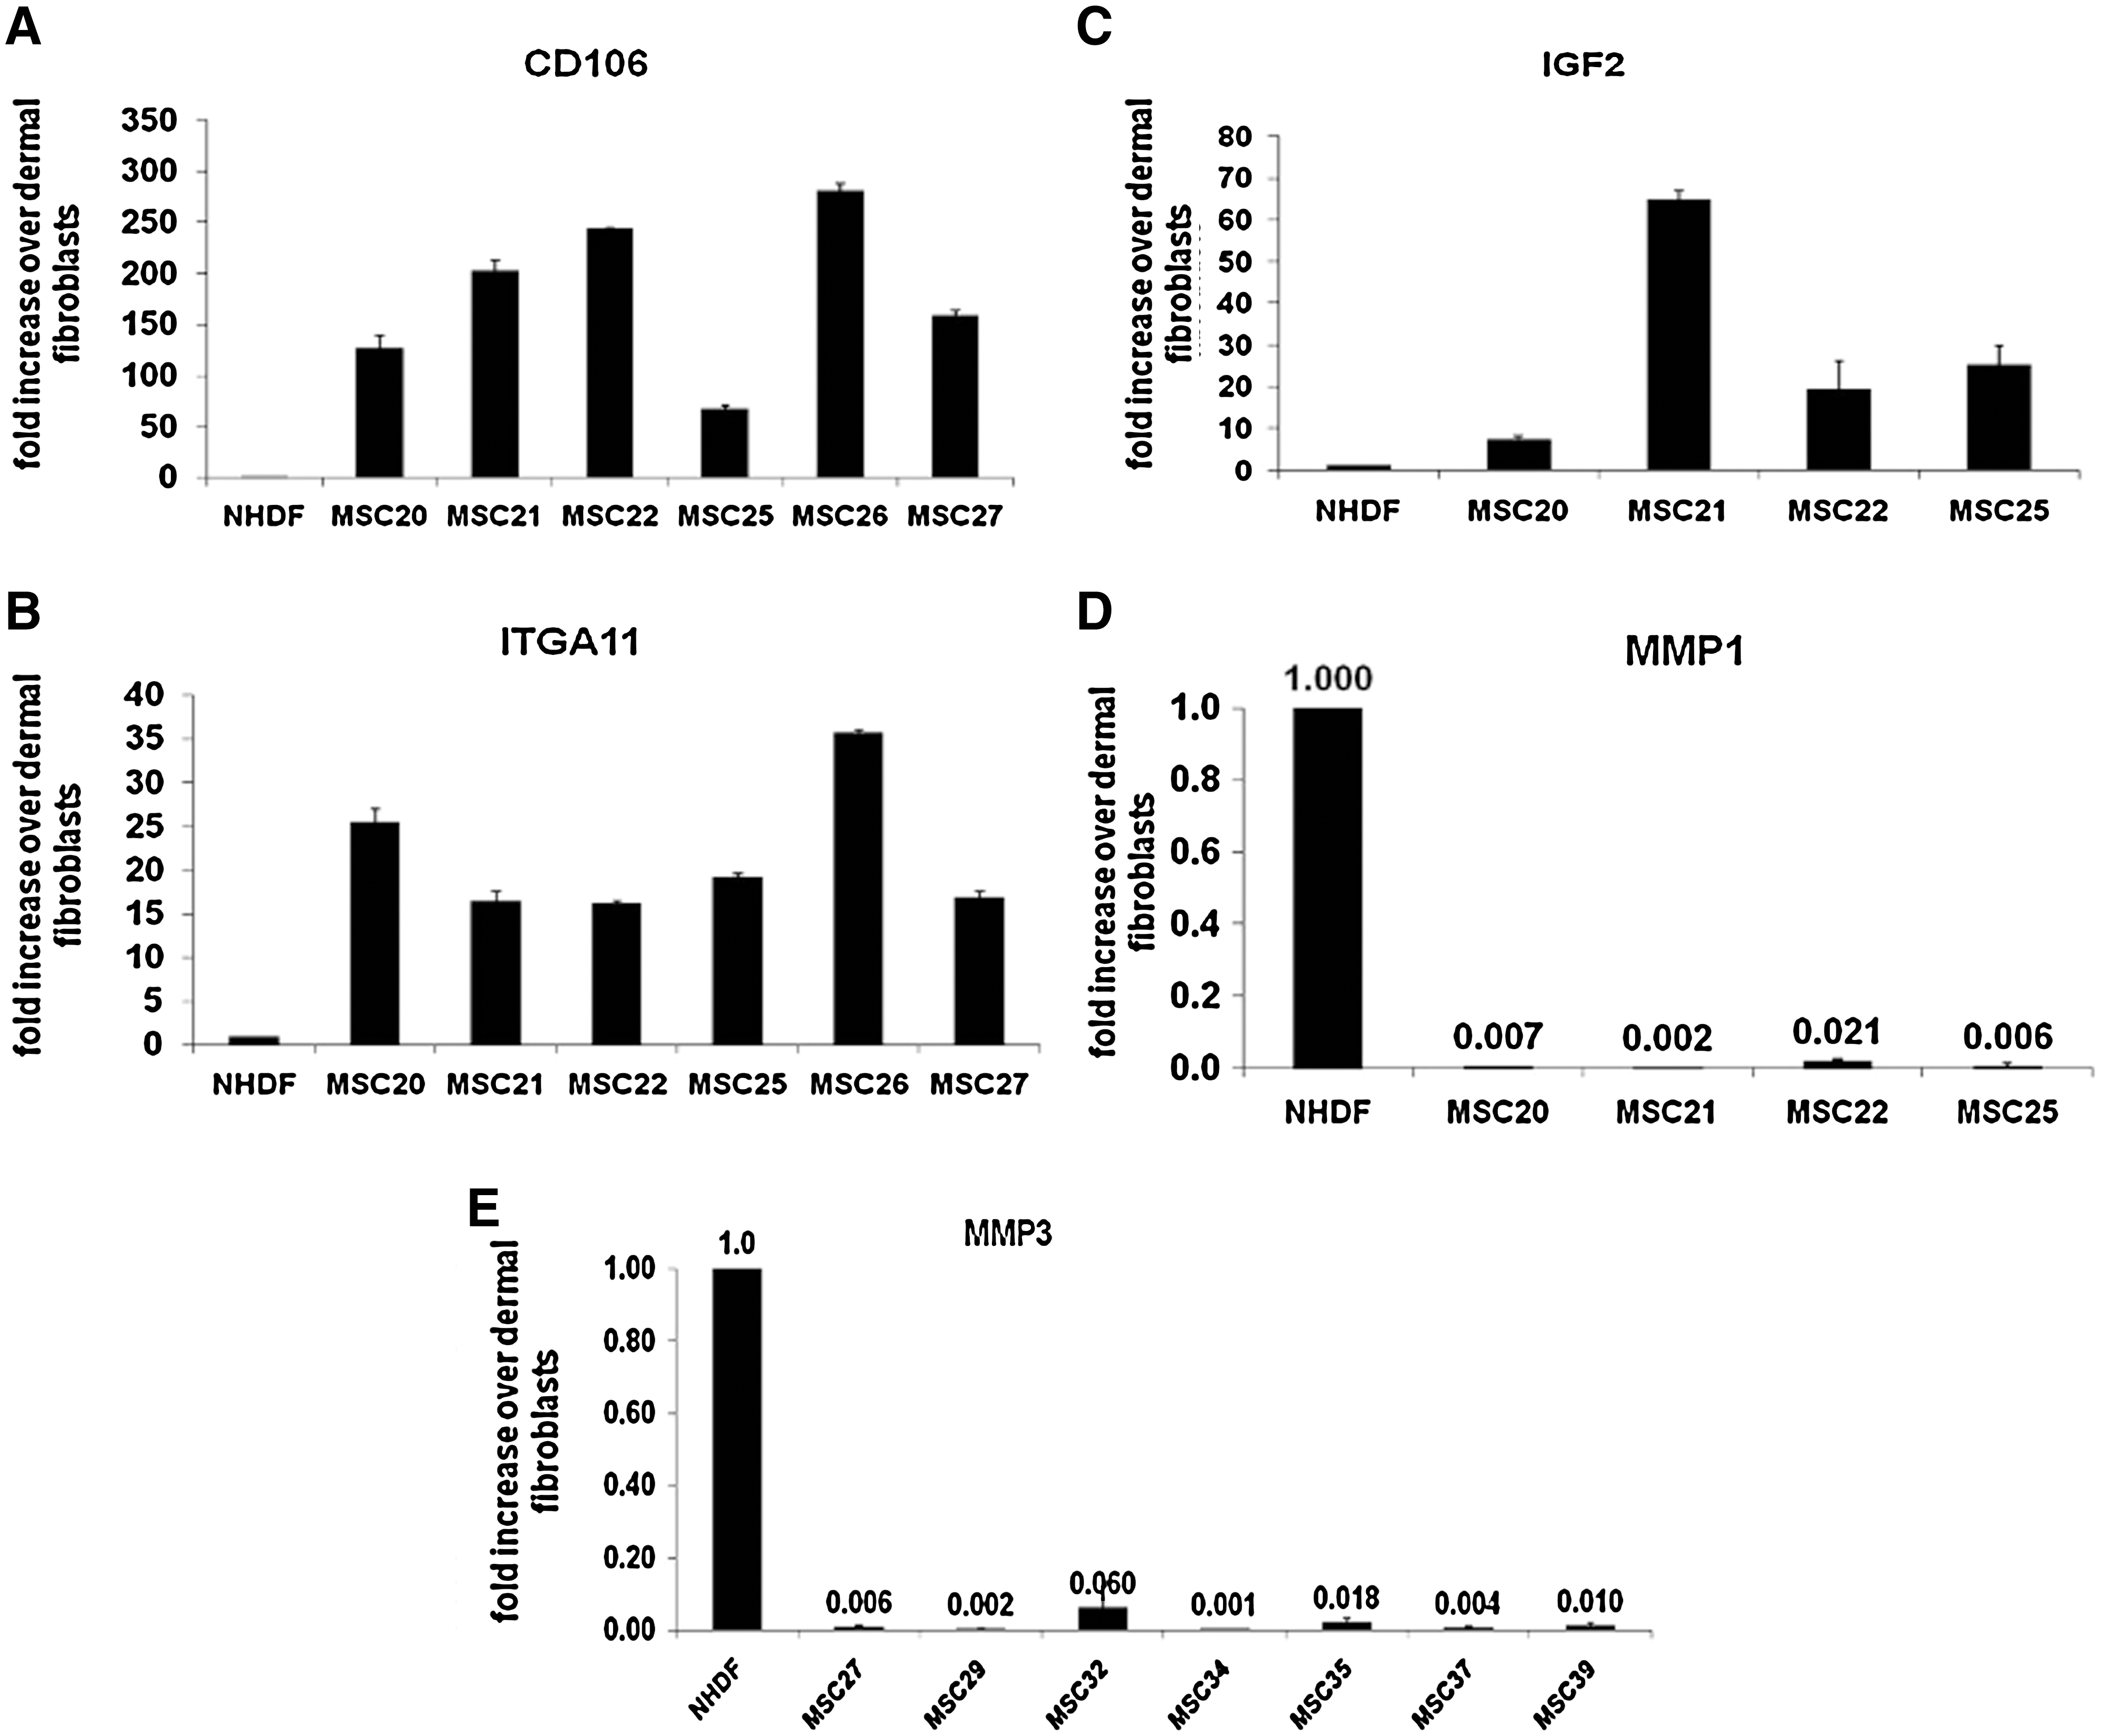
Validation of the results of microarrays with real-time PCR. Real-time PCR was performed with Taqman-based primers as described in Materials and Methods section. Expression of CD106
Results of focused microarrays are shown.
FB, fibroblasts; MMP, matrix metalloproteinase; VCAM-1, vascular cell adhesion module 1.
To confirm the results of separate real-time PCR experiments, PCRs using SYBR green-based primers for 3 MSC markers CD106, ITGA11, and IGF-2; 2 fibroblast markers MMP1 and MMP3; and for a commonly used MSC marker CD105 were arranged on the same 96-well plate as described in Materials and Methods section. RNA isolated from 5 batches of MSCs each derived from a distinct individual donor and from 5 commercial batches of dermal fibroblasts (different derivation lots) was tested on this plate, and the results were normalized to control RNA from one of the fibroblast lines. As shown in Table 4, all tested MSC batches demonstrated “MSC”-like pattern of gene expression: high CD106, ITGA11, and IGF-2 and low MMP1 and MMP3; whereas all tested fibroblasts batches showed the opposite pattern (low CD106, ITGA11, and IGF-2 and high MMP1 and MMP3). In contrast, the amount of mRNA for CD105 was equal in MSCs and fibroblasts.
Real-time polymerase chain reaction plate validation.
RNA was isolated from early passages of MSC and from commercial dermal fibroblasts and run on the quantitative polymerase chain reaction plate at least twice for each batch. All the results are expressed as fold increase over expression in one of the fibroblast lines. Note very low MMP1 and MMP3 in MSC and no differences in CD105 expression.
The results with fibroblast RNA were also normalized to one of the fibroblast lines and, thus, reflect variability among fibroblast lines.
Protein expression of MSC markers in MSC cultures of early and late passages
To demonstrate the relevance of identified markers distinguishing between MSCs and fibroblasts to the quality of MSC cultures, we performed flow cytometry analysis of these and also of commonly accepted markers of MSCs (CD105, CD44, CD90, CD166, and CD9) in MSCs of passage 2 and passage 6. Commonly used markers were equally expressed in MSCs of early and late passages, except CD9. As was demonstrated in Table 2 and Fig. 3B and C, the level of CD9 expression was significantly higher in fibroblasts. Similarly, expression of this marker increased almost 2-fold with passaging (Table 5).
Statistically significant differences.
N/A, non-applicable.
Surface expression of markers identified with microarrays and real-time PCR, ITGA11, and CD106 was downregulated in late passages of MSCs (Table 5). It was shown that only 16.7% ± 9.5% (mean ± SD, n = 4) of dermal fibroblasts expressed ITGA11 on their surface compared with MSCs of early (51.4% ± 14.4%) and late (28.6% ± 12.2%) passages. CD106 protein was not expressed in fibroblasts (see Fig. 6). Only 4.83% ± 4.0% of dermal fibroblasts were CD146 positive compared with 91.7% ± 4.0% and 79.8% ± 14.4% of MSCs of p2 and p6, respectively. IGF-2 surface expression was not tested assuming that this cytokine is released from cells. However, surface expression of IGF-2 receptor was analyzed, and it was shown that 92.5% ± 7.7% of dermal fibroblasts expressed IGF-2 receptor; whereas receptor expression on MSCs varied (45.8% ± 30.0% positive cells, n = 7).
Despite high mRNA content for CD106 (vascular cell adhesion molecule 1 [VCAM-1]) in MSCs, its protein expression varied in different batches. Treatment of MSCs with tumor necrosis factor (TNF)-alpha caused upregulation of CD106 expression on cell membrane: Percentage of CD106-positive cells significantly increased from 59.1% ± 20% to 91.8% ± 6.3% (Mean ± SD, n = 4, P = 0.01) (see representative histograms in Fig. 5). Flow cytometry results were confirmed by immunostaining (Fig. 6). No CD106 response to TNF-alpha occurred in fibroblasts (Fig. 6C and D). As shown in Table 5, comparison of early and late passages of MSCs demonstrated that percentage of CD106-positive cells both before and after TNF-alpha treatment was significantly higher in p2 MSCs compared with p6 MSCs.
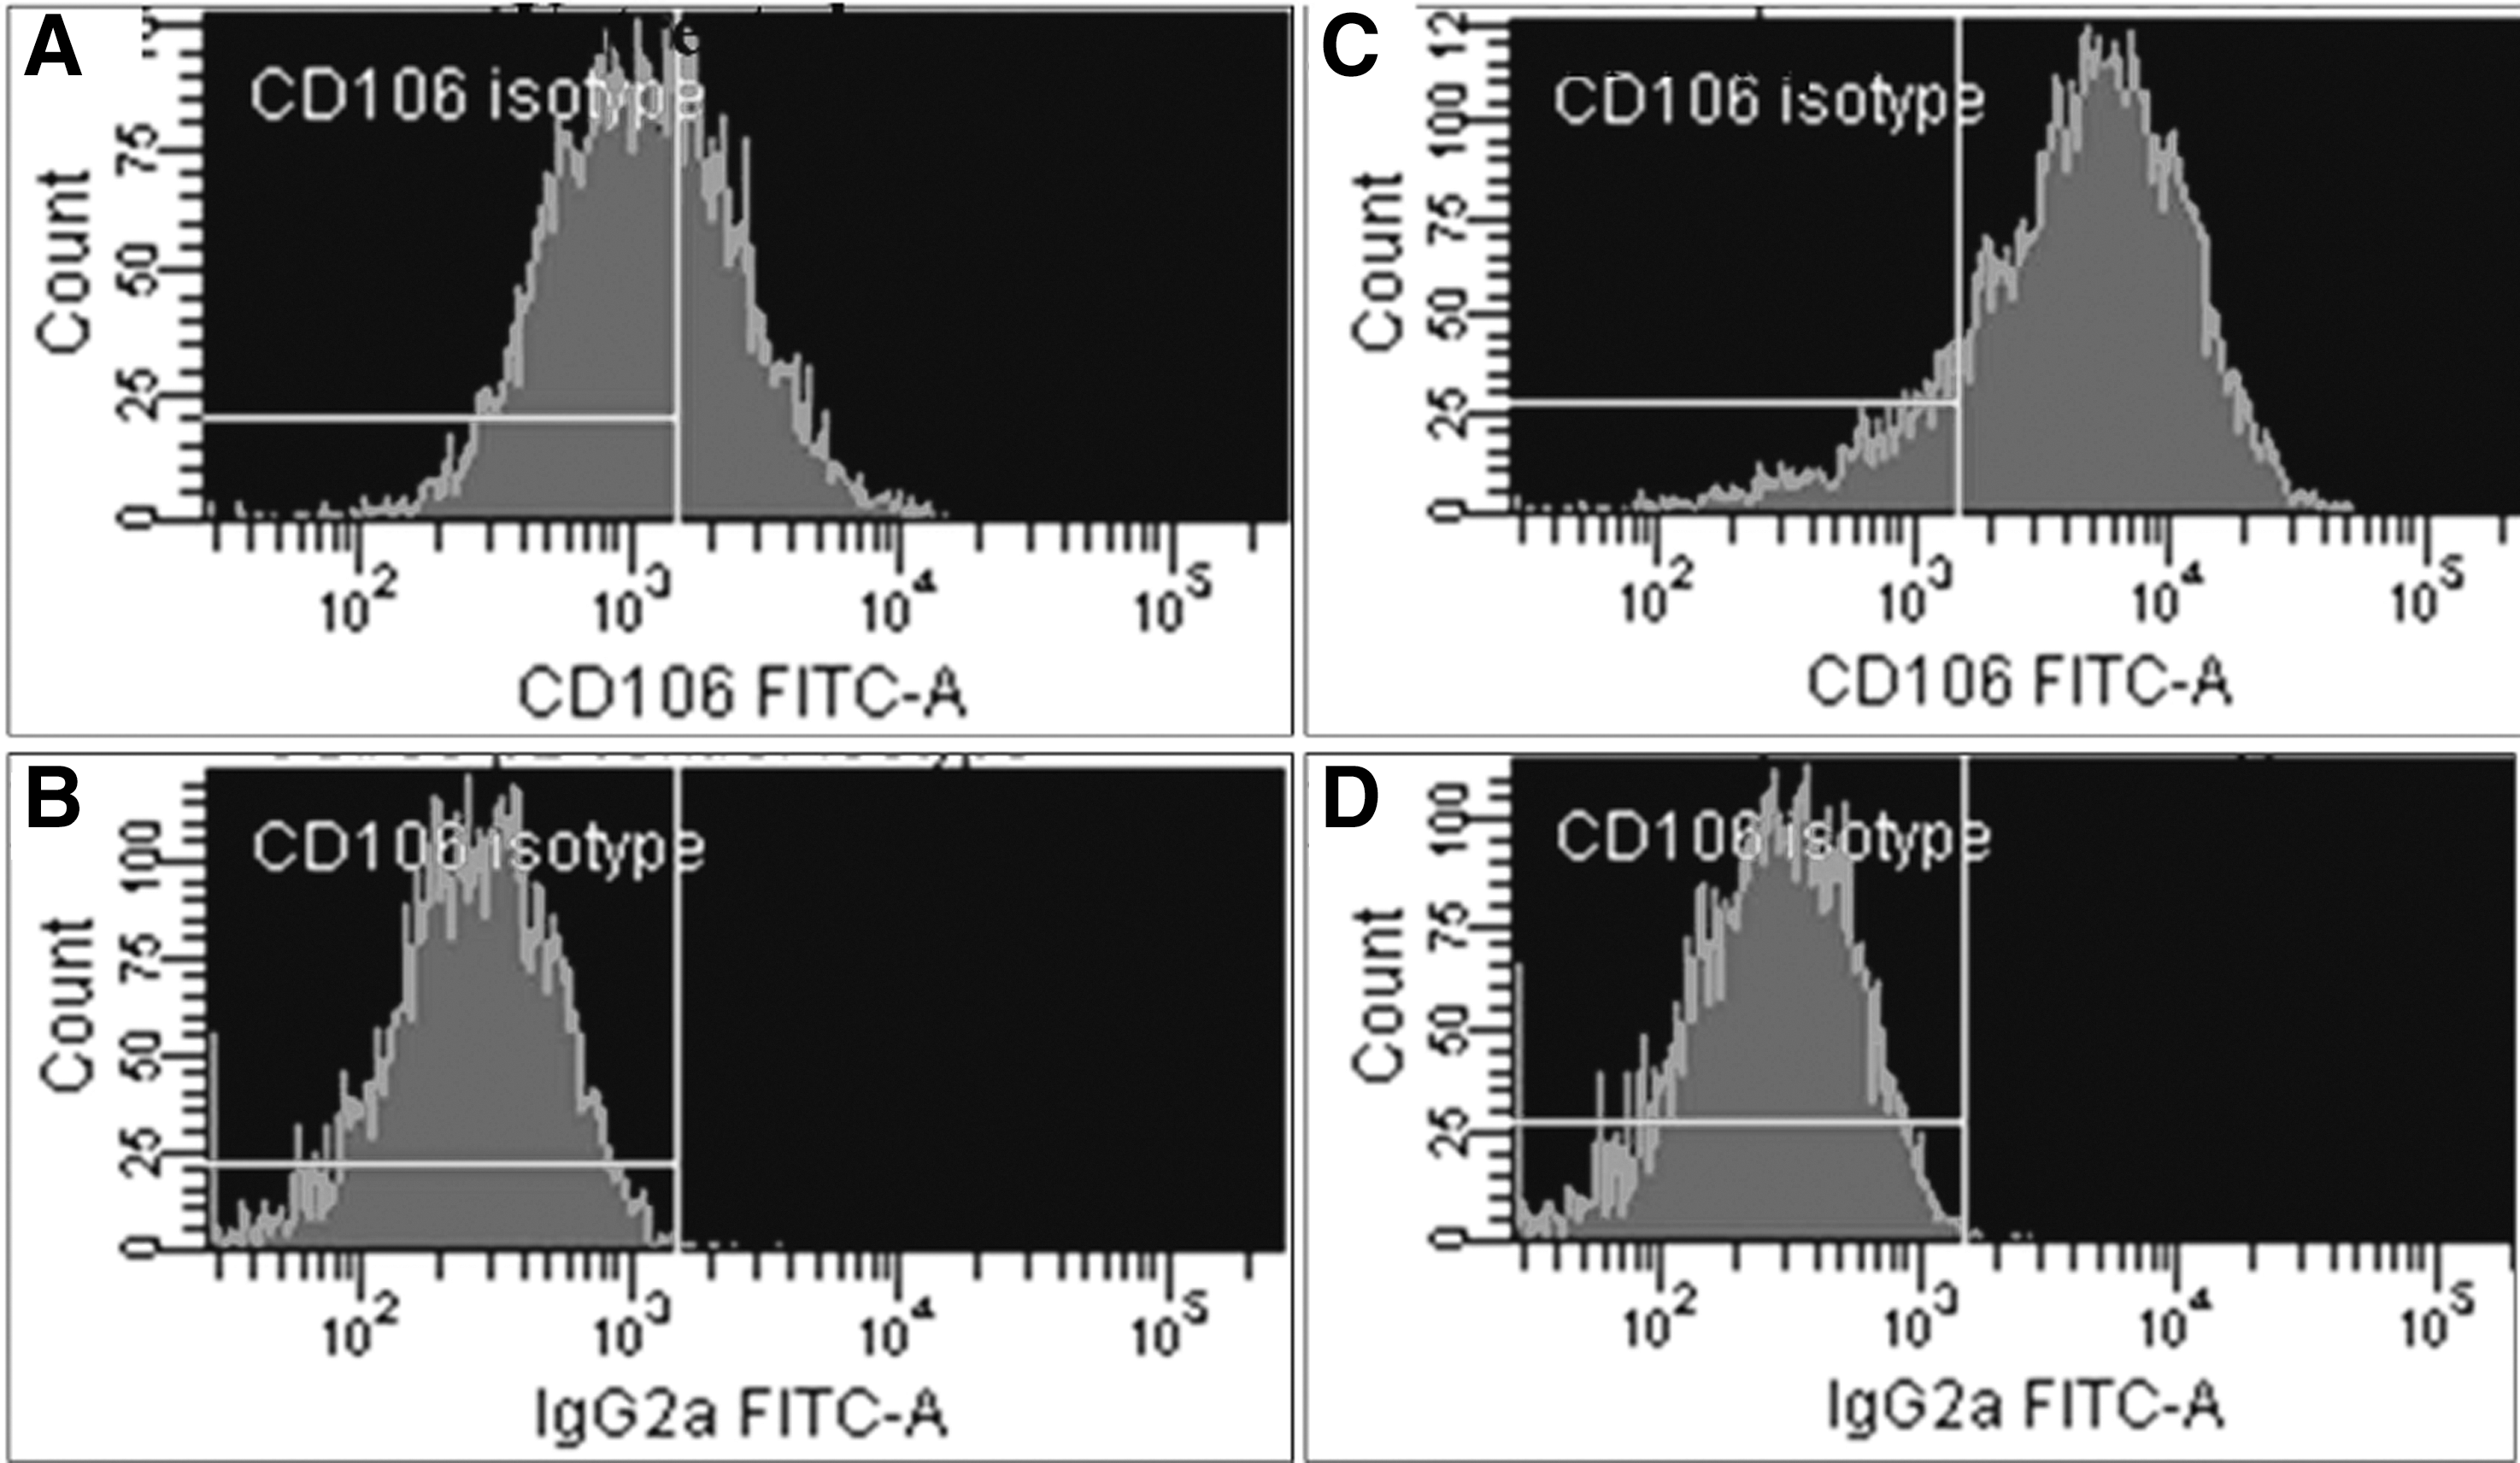
Flow cytometry analysis of CD106 expression in MSCs. MSCs untreated

Effect of TNF-alpha on CD106 protein expression in MSCs and fibroblasts. MSCs
ITGA11 was found constitutively expressed on cultured MSCs. ITGA11 was not upregulated by TNF-alpha. Based on previous reports demonstrating ITGA11 upregulation by interferons in human T98G glioblastoma and 2C4 fibrosarcoma cell lines [16], we have tested the effect of beta-interferon on MSCs and found that percentage ITGA11-positive cells (39.1% ± 13.1%) and mean fluorescence (2,953 ± 1,476) of stained cells did not change after stimulation with INF-beta (38.1% ± 11.0% and 2,425 ± 1,303, respectively (mean ± SD, n = 7). Flow cytometry analysis of ITGA11 in early and late passages of MSCs demonstrated that percentage of positive cells was 2-fold lower in passage 6 cultures (Table 5).
Recently, CD146 has been recognized as another marker of MSCs [17]. We have compared CD146 surface expression in various batches of MSCs and of dermal fibroblasts and found that 91.9% ± 4.0% of MSCs (mean ± SD, n = 9) and only 4.8% ± 4.0% (n = 4) of fibroblasts were CD146 positive with mean fluorescence 3,433 ± 1,029 and 770 ± 395, respectively. When early and late passages of MSCs were compared, slight but statistically significant decrease of CD146 expression was found in p6 MSCs compared with p2 MSCs (Table 5).
No differences between p2 and p6 MSCs in expression of HLA-ABC and HLA-DR were found (Table 5).
Discussion
According to a recent definition given by Mesenchymal and Tissue Stem Cell Committee of the International Society for Cellular Therapy, BM-derived MSCs should be plastic adherent when maintained in standard culture conditions; should express surface markers CD105, CD73, and CD90; lack expression of hematopoietic markers CD45, CD34, CD14, or CD11b, CD79alpha or CD19; and also should not express HLA-DR histocompatibility antigens. Further, MSCs should be multipotent with ability to differentiate at least into osteoblasts, adipocytes, and chondroblasts [18,19]. However, in recent years, it has been recognized that stromal and even dermal fibroblasts, which are also plastic adherent, express most of MSC markers [20,21]. Dermal fibroblasts were even shown to undergo multilineage differentiation [22 –27], although differentiation potential of bulk fibroblast cultures was lower than that of selected single cell clones, suggesting that only a subpopulation of dermal fibroblasts was multipotent [24]. Even unique ability of MSCs for immunosuppression was also demonstrated in dermal fibroblasts [28,29]. Thus, contamination of MSC cultures with fibroblasts could be easily overlooked when current methods of MSC characterization are applied. However, actually contaminating fibroblasts could create a potential obstacle for long-term expansion of MSC cultures due to their senescence and/or tumor transformation [6], resulting in decreased or completely lost differentiation potential [11].
The aim of the study was to identify new gene and surface protein markers that would have robust differences in the level of expression between MSCs and fibroblasts with the purpose of using these markers for assessment of purity of MSCs expanded in vitro. With this in mind, expression of these markers in MSC cultures of early (p2) and late (p6) passages was compared.
First, we analyzed known, commonly used MSC markers. All flow cytometry tests were performed on FACSAria at the same settings using saturating amounts of antibodies in an attempt to find quantitative differences in percentage of positive cells and mean fluorescence between MSCs and fibroblasts. Markers were analyzed in 2 test tubes, one containing CD105-APC, CD44-APC-Cy-7, CD90-PE, CD166-FITC, and CD9-PerCp antibodies and the other containing CD73-PE, CD29-APC, and CD105-FITC (the latter was added for reference). Sixteen batches of MSCs derived from BM aspirates, each from a different donor, and 7 commercial lots of primary human fibroblasts (5 lots of dermal fibroblasts and 2 lots of lung fibroblasts) were analyzed. We have found that all analyzed MSCs and all fibroblast batches were positive for these markers. However, when quantitative analysis of flow cytometry data was performed, statistical differences in the level of expression of CD166 and CD9 (but not of other tested markers) between MSCs and fibroblasts were found. Percentage of positive cells and the levels of expression (mean fluorescence intensity of the cells stained with the same specific antibodies in saturating concentrations at the same FACS settings) revealed that MSCs expressed significantly higher levels of CD166 and lower levels of CD9 than fibroblasts (Fig. 3B). Every MSC batch that was analyzed by flow cytometry was also tested in osteogenic differentiation assay where ALP surface expression, ALP activity, and Ca++ deposition were measured. Three MSC batches were identified that performed poorly in these tests, showing results much below the average for the whole group of 16 batches. Surprisingly, these 3 batches had the “fibroblast-like” pattern of expression of CD166 and CD9 compared with average levels in this group. These observations suggest that the level of expression of CD166 and CD9 could be indicative of the contamination of MSCs with less osteogenic fibroblast-like cells. In support for this assumption, flow cytometry comparison of early and late passages of MSCs showed a 2-fold increase in the level of CD9 expression in MSCs of passage 6 (see Table 5). Thus, analysis of CD166 and CD9 expression could be useful for prediction of efficacy of MSCs expanded ex vivo aimed at bone repair cell therapy.
Activated leukocyte cell adhesion molecule (ALCAM/CD166) is a member of the immunoglobulin superfamily with 5 extracellular immunoglobulin-like domains. ALCAM mediates both heterophilic (ALCAM-CD6) and homophilic (ALCAM-ALCAM) cell–cell interactions. ALCAM is usually restricted to subsets of cells involved in dynamic growth and/or migration [30], which fits well high expression of CD166 on MSCs.
CD9 belongs to the family of tetraspanins that have the ability to associate with one another and with other surface proteins, thereby participating in activation, adhesion, and cell motility as well as in cell–cell interactions and sperm–egg fusion [31]. CD9 has nearly ubiquitous tissue distribution with apparent expression on normal human fibroblasts. Over 99% of fibroblasts could be absorbed by anti-CD9 antibody conjugated to magnetic beads [32]. Expression of CD9 on BM stromal cells and its hematopoiesis-supportive function were first demonstrated by Oritani et al. [33]. Later, in the stromal–hematopoietic coculture system, it was shown that CD9 on stromal cells associates with the integrin 1 beta and a 100 kDa protein and that association between CD9 and the 100 kDa protein was augmented by treatment of stromal cells with anti-CD9 MoAb (KMC8.8) simultaneously inhibiting differentiation of hematopoietic cells [34].
In search for new markers, we have used small microarrays covering surface molecules, adhesion, and cytokine receptors. Three gene markers, CD106, ITGA11, and IGF-2, were highly expressed in MSCs; and 2 other genes, MMP1 and MMP2, had hundred times higher expression in fibroblasts (Table 3). This pattern of expression was confirmed by real-time PCR using Taqman-based primers (Fig. 4).
MMP1 and MMP3 belong to the MMP family of at least 26 human members; however, MMP1 (collagenase-1) and MMP3 (stromelysin-1) are closely related according to amino acid sequence [35]. Both are located in a 135-kb region of chromosome 11 [36], both were initially identified in fibroblasts [37] and it seems that they synergize in matrix degradation, where MMP1 specifically degrades type I collagen; whereas MMP3 cleaves proteoglycan, fibronectin, laminin, and type IV collagen but not interstitial type I collagen [38]. Saus et al. have found that MMP1 and MMP3 expression appeared to be coordinately modulated in synovial fibroblast cultures [39]. Thus, it is of no surprise that these 2 metalloproteinases are identified as fibroblast markers, but their comparatively low expression in MSCs is a new finding. Expression of MMPs is readily induced by phorbol esters, growth factors, and inflammatory cytokines [40]; and we cannot exclude that the found differences in expression could reflect different culture conditions (medium, serum, etc.).
The alpha 11 integrin subunit (ITGA11) was first identified as a major integrin in cultured skeletal muscle cells [41,42]. However, it was later shown in mesenchymal tissues [43,44]. When ITGA11 dimerizes with beta 1 subunit, it forms a collagen receptor that interacts with fibrous collagen through GFOGER sequence, thus controlling cell migration [45]. We demonstrate here for the first time that ITGA11 is expressed in MSCs and could be used as a marker that distinguishes between MSCs and fibroblasts. ITGA11 is also known as a biomarker of lung adenocarcinomas [46]. Its localization was recently attributed to tumor stromal cells, and it was implicated in tumor progression through upregulation of IGF-2 on binding to tumor cells [47]. Interestingly, while searching for new markers of MSCs we identified through a microarray analysis both ITGA11 and IGF-2 as robust gene markers. IGF-2 stimulates proliferation and differentiation of muscle [48] and bone [49] progenitors. Several reports suggest the role of IGF-2 in angiogenesis through the HIF-1-VEGF pathway [50]. High levels of IGF-2 mRNA in MSCs could shed light on mechanisms of tissue repair by MSCs.
CD106/VCAM-1 is a membrane protein of the immunoglobulin super family. It is well established that TNF-alpha, a proinflammatory cytokine, upregulates expression of adhesion receptors including VCAM-1 on endothelial cells, thus facilitating leukocyte adhesion and transmigration at the sites of injury. Recently, low levels of constitutive CD106 expression were demonstrated on BM stromal cells, and it was shown that TNF-alpha and IL-1 drastically upregulated CD106 surface expression, thus stimulating interaction of stromal cells with hematopoietic cells bearing VLA-4 receptor for CD106. It was suggested that such interaction stimulated hematopoiesis in inflammatory states or after BM transplantation [51]. Expression of CD106 gene was also demonstrated in human MSCs and was shown to decrease after differentiation [52]. Upregulation by TNF-alpha and other proinflammatory cytokines of CD106 (and another adhesion molecule inter-cellular adhesion molecule 1 [ICAM-1]) on MSCs is one of the mechanisms by which MSCs accelerate wound healing. It was shown that MSCs express TNF-receptor 1 and 2, and stimulation of MSCs with TNF-alpha causes nuclear translocation of a p65 subunit of NF-kappaB, a key transcription factor in TNF-alpha signaling, while potentiating migration of MSCs through the human extracellular matrix [53]. TNF-alpha increased MSC migration in a transwell system [54]. When MSCs were intracavitarily injected in rat hearts, activation of MSCs with TNF-alpha before injection significantly enhanced cardiac homing of MSCs, which could be blocked with anti-VCAM-1 monoclonal antibodies [55]. In a coculture system, dermal fibroblasts migrate toward MSCs, upregulate integrin alpha 7 expression, and downregulate expression of ICAM-1, VCAM-1, and MMP11 [56]. VCAM-1 (and ICAM-1) expression on MSCs was shown to mediate MSC-induced immunosuppression via direct adhesion of activated T cells. Immunosuppression and expression of VCAM and ICAM-1 were enhanced by combination of IFN-gamma with TNF-alpha or IL-1, whereas genetic deletion or blocking of these adhesion molecules inhibited MSC-induced immunosuppression in vitro and in vivo [57].
We detected variable levels of CD106 protein on the surface of unstimulated MSCs. Similarly Miyazaki et al. showed that only 2.6% of cells in MSC cultures were positive for CD106, and changing culture conditions resulted in complete loss of CD106 [58]. It is likely that only specific subpopulations of MSCs, for example, STRO-1-positive cells [59,60] or specific clones [61], express CD106, although other reports demonstrate significant expression of CD106 in MSC cultures [62,63]. When analyzed at the single-cell level using multicolor immunofluorescence, CD106 was predominantly found in the cytoplasm of human MSCs, suggesting that further stimuli are needed for its translocation to the membrane [64]. Such stimuli could be present in fetal calf serum or in commercial MSC media, thus explaining variability of CD106 data. Here, we report by using flow cytometry (Fig. 5) and immunochemistry (Fig. 6) that activation of MSCs with TNF-alpha causes upregulation of the surface CD106. In MSC cultures that had high initial expression of CD106, the effect of TNF-alpha was small even in terms of mean fluorescence. This again suggests that upregulation of CD106 is based on translocation of the molecule from cytoplasm to the cell surface rather than on new mRNA synthesis. Similar “unresponsiveness” to TNF-alpha was observed in those studies where unstimulated CD106 expression was high [63].
The found differences in surface expression of ITGA11 and CD106 between MSCs and fibroblasts suggested that if MSCs become gradually overgrown by contaminating fibroblasts, percentage of ITGA11 and CD106-positive cells at later passages should decrease. To test this hypothesis, we compared surface expression of ITGA11 and CD106 as well as commonly used markers of MSCs such as CD105, CD44, CD90, CD166, CD9, HLA-ABC, and HLA-DR in MSC cultures of passage 2 and 6. We also included in these experiments a recently described marker CD146 [17,65]. The results of these experiments confirmed our hypothesis: Indeed, ITGA11 and CD106 expression was downregulated at p6. The difference in the CD106 expression did not disappear even after activation of MSCs with TNF-alpha (see Table 5), suggesting that in MSC cultures of passage 6 there was a subpopulation of cells that lacked mechanisms for CD106 upregulation either on gene level or most probably due to the absence of intracellular pool of CD106 (see above). In support of our findings, Honczarenko et al. have shown that in MSCs with high levels of CD106 at early passages, CD106 disappears by passage 12 [62].
Another marker that slightly but significantly changed expression with passaging was CD146. Comparison of CD146 expression in MSCs and fibroblasts showed that although most of MSCs expressed this molecule, only about 5% of fibroblasts did. Our finding is in agreement with that of Covas et al., who showed that 73% of BM-derived MSCs and only 2% of skin fibroblasts expressed CD146 [66]. MSCs in this report were from passage 3–5, whereas in our MSC cultures of passage 2 > 90% were positive for CD146 but their number dropped to 70%–80% by passage 6.
Finally, comparison of marker expression in MSC cultures of early and late passages showed a 2-fold increase of CD9 by passage 6. This finding supports the results of our comparison of common MSC markers in MSCs and fibroblasts, which showed high levels of CD9 in fibroblasts (Fig. 3B, C and Table 2).
Expression of the commonly used markers of MSC CD105, CD44, CD90, and CD166 as well as of major histocompatibility complex class I antigen remained high over passaging. Major histocompatibility complex class II antigens were practically not expressed on passage 2 MSCs, and their expression did not increase with passaging confirming previous observations that MSCs require INF gamma stimulation to function as antigen-presenting cells [67]. In contrast to our findings, expression of stromal markers such as CD29, CD44, CD90, and CD166 did change with passaging in MSCs derived from adipose tissue [68]. However, most of the changes occurred during transition from quite heterogeneous stromal–vascular fraction of adipose tissue, where stromal cells consist of a small subpopulation of all nucleated cells, to passage 2 more homogeneous MSC cultures. This was confirmed by more than 10-fold increase of frequency of CFU for MSC lineages with passaging. Our studies were performed on p2 and p6 MSCs when MSC culture was more or less homogeneous, although CD9 was expressed only on 40% of p2 MSCs. Comparison of adipose MSCs at later passages showed high and stable expression of all stromal markers, which is consistent with our data. It is interesting that expression of CD105 and CD166 on passage 2–4 adipose MSCs was about 60%–70% compared with practically 100% in our studies. CD146 was expressed on only 10% of adipose-derived MSCs, and its expression gradually decreased with passaging; whereas in our experiments with BM-derived MSCs, CD146 expression was high although it decreased with passaging. It is not clear whether these differences are intrinsic or just reflect different culture conditions. In another study comparing BM and adipose tissue-derived MSCs, expression of all tested markers was similar in both cell types except CD106, which was significantly lower in adipose MSCs [69].
In conclusion, we have identified several markers on gene and protein level that have robust differences of expression in MSCs and fibroblasts and that could be used for quality control of MSC cultures after expansion, cryopreservation, gene transfection, and other manipulations.
Footnotes
Acknowledgments
This work was supported by The Chief Scientist Office of the Israeli Ministry of Industry, Trade, and Labor and by The Israeli Consortium “Bereshith” for Cell Therapy. The authors thank Prof. Avner Yayon, Prochon Biotech, Ness Ziona, Israel, for the assistance in chondrocyte differentiation.
Author Disclosure Statement
No competing financial interests exist.