
Abstract
Oct4 is a key transcription factor to maintain self-renewal and undifferentiated state of embryonic stem cells. Site 2A located between −2,546 and −2,530 bp and site 2B between −2,500 and −2,486 bp of human Oct4 gene were shown to be sufficient for inducing Oct4 gene expression in embryonic stem cells. Site 2B contains octamer element capable of binding to factor Oct4 and sox element capable of binding to factor Sox2. So far, little is known about the molecular mechanisms for the control of growth and differentiation of adult stem cells including bone marrow–derived mesenchymal stem cells (BM-MSCs), and it is important to understand how Oct4 expression is regulated in BM-MSCs. This study showed that Oct4 and Sox2 genes were expressed in undifferentiated BM-MSCs and BM-MSCs on day 7 but not on days 14 and 21 following osteogenic induction. Site 2A of Oct4 gene, not site 2B, activated the expression of reporter genes luciferase and enhanced green fluorescent protein in undifferentiated BM-MSCs but not in BM-MSCs following osteogenic differentiation. These data demonstrate that site 2A is sufficient for inducing the expression of Oct4 gene in BM-MSCs, and site 2B is not required. Electrophoretic mobility shift assay showed the 2 shifted bands with site 2B probe and the addition of Oct4 and Sox2 antibodies did not supershift these 2 bands. As probes containing mutated octamer and sox elements of site 2B still gave the same 2 shifted bands, it was concluded that they did not result from the binding to site 2B probe by factors Oct4 and Sox2. These bands may be due to the binding of 2 unknown transcription factors.
Introduction
M
The key transcription factors Oct4 and Sox2 have been extensively studied in embryonic stem (ES) cells. Oct4 is a critical transcription factor for regulating self-renewal and differentiation of ES cells. It is a member of POU family and is expressed in totipotent and pluripotent cells [8]. POU domain-containing transcription factors recognize the consensus binding motif ATGCAAAT, which was originally found as an element controlling the immunoglobulin heavy chain enhancer. POU factors have 2 separate helix-turn-helix DNA-binding subdomains, the POU homeodomain (POU-H) and the POU-specific domain (POU-S), which are connected by a flexible linker, variable in length [9]. Flexibility of the linker region between the 2 subdomains enables POU-S and POU-H to contact the DNA-binding site independently of each other [10]. POU-S and POU-H bind to the 2 halves of the consensus sequences, ATGC and AAAT, respectively [11]. Sox proteins belong to the HMG box family. They are involved in the regulation of some developmental processes, such as germ layer formation, organ development, and cell type specification. Sox2 factor has a single HMG box, which binds to the consensus sequence (A/T)(A/T)CAA(A/T)G [12,13]. Oct4 and Sox2 are 2 transcription factors known to be essential for normal pluripotent cell development and maintenance and form a complex on the DNA regulatory site containing octamer element capable of binding to factor Oct4 and sox element capable of binding to factor Sox2 [14,15]. They can activate the transcription of many genes, including Oct4, Sox2, Nanog, fibroblast growth factor 4 (Fgf4), Utf1, and Fbx15, in ES cells but negatively regulate Cdx-2 and Hand-1 [16 –18]. The expression of Oct4 gene is also regulated by factors Oct4 and Sox2 in ES cells [19]. Site 2A located between −2,546 and −2,530 bp and site 2B between −2,500 and −2,486 bp of human Oct4 gene were shown to be sufficient for inducing Oct4 gene expression in ES cells. Site 2B contains octamer element and sox element.
Expression level of Oct4 and Sox2 genes is crucial in the determination of ES cell fate. Increase in Oct4 expression causes ES cell differentiation into primitive endoderm and mesoderm. Repression of Oct4 expression induces loss of ES cell pluripotency and dedifferentiation to trophectoderm [20]. Overexpression of Sox2 gene decreases FGF-4 promoter activity in embryonic carcinoma cells, and Sox2 levels are regulated carefully to avoid interference with the transcription of critical genes [21]. However, functions of factors Oct4 and Sox2 in MSCs and the molecular mechanisms that control Oct4 gene expression in MSCs are largely unknown. This study examined how the expression of Oct4 is regulated in MSCs.
Materials and Methods
Isolation and culture of MSCs
Human BM samples were collected from donors with their consent at the First Affiliated Hospital of Shantou University Medical College. Bone marrow–derived MSCs (BM-MSCs) were isolated as previously described [22]. The samples were layered over a lymphoprep gradient and centrifuged at 2,000 rpm for 15 min. The mononuclear cells were washed twice with Hank's solution and cultured in a 6-well plate at a density of 1 × 10⁶ cells/cm2 in a growth medium containing Dulbecco's modified Eagle's medium–low glucose (Invitrogen) supplemented with 10% (v/v) fetal bovine serum, 2 mM
Flow cytometry analysis
Flow cytometry analysis was performed to examine the expression of the MSC markers as previously described [23]. Cells were cultured in the growth medium for 4 days at a density of 1 × 10⁴ cells/cm2 and harvested by trypsin. Cells were incubated at 4°C for 30 min with the following anti-human antibodies, which were conjugated with fluorescein isothiocyanate (FITC) or phycoerythrin (PE): CD105-PE (eBioscience), CD73-PE, CD90-PE, CD44-FITC, CD45-PE, CD34-PE, CD14-FITC, CD19-PE, and HLA-DR-FITC (BD Pharmingen). PE-conjugated IgG or FITC-conjugated IgG (BD Pharmingen) was used as an isotype control. After washing with phosphate-buffered saline, 1 × 10⁶ cells were analyzed using a FACScan flow cytometer (Epics XL; Beckman Coulter).
Osteogenic differentiation
Osteogenic differentiation was performed as previously described [24]. The osteogenic differentiation was examined by staining for alkaline phosphatase (AP) with leukocyte alkaline phosphatase kit (Sigma), following the manufacturer's instructions, after cells were cultured in the differentiation medium for 14 days. The mineralization of osteogenic differentiation was analyzed by von Kossa staining, according to the protocol previously described [24], after cells were incubated in the differentiation medium for 21 days.
Chondrogenic differentiation
Chondrogenic differentiation was performed according to a previous method [3]. Cells were transferred into a 15-mL polypropylene tube and centrifuged at 1,000 rpm for 5 min to form a cell pellet. Cells were cultured for 21 days in the chondrogenic differentiation medium. For histochemical analysis, cells were fixed overnight in 4% paraformaldehyde, dehydrated through a series of ethanols, infiltrated with isoamyl acetate, and embedded in paraffin. Then, 7-μm sections were cut and stained with alcian blue.
Adipogenic differentiation
Cells were induced into adipogenic differentiation as previously described [3]. The generation of neutral lipid vacuoles was visualized by oil red O staining (Sigma).
RNA extraction and reverse transcriptase–polymerase chain reaction
Total cellular RNA was isolated using RNeasy mini kit (Qiagen, GmbH) as previously described [25]. RNA was incubated with DNase I (Invitrogen) to eliminate any genomic DNA contamination. First-strand cDNA was synthesized from total RNA using SuperScript III First-Strand Synthesis System (Invitrogen). Polymerase chain reaction (PCR) was performed with 20 ng of cDNA in 50 μL reaction volume containing gene-specific primers and Ex-Taq DNA polymerase (TaKaRa). PCR condition included 30 cycles of 94°C for 60 s, 59°C for 60 s, and 72°C for 90 s. The expression level of GAPDH was used as the housekeeping gene control. The following PCR primers were used [26].
GAPDH sense: 5′-CATGACCACAGTCCATGCCATCACT-3′;
GAPDH antisense: 5′-TGAGGTCCACCACCCTGTTGCTGTA-3′;
Oct4 sense: 5′-AGGAGATATGCA A AGCAGAA-3′;
Oct4 antisense: 5′-AGAGTGGTGACGGAGACAG-3′;
Sox2 sense: 5′-AGTACAACTCCATGACCAGC-3′;
Sox2 antisense: 5′-TTACTCTCCTCTTTTGCACC-3′.
Western blot analysis
Western blot analysis was performed as previously described [27]. Total cellular protein was extracted using the cell lysis buffer. Proteins were separated by 10% sodium dodecyl sulfate–polyacrylamide gel and transferred onto membranes. The membranes were blocked in the blocking solution and incubated for 1 h at room temperature with mouse monoclonal antibodies against Oct4 (1:100; Santa Cruz Biotechnology) and Sox2 (1:100; Chemicon). Mouse monoclonal antibody against α-tubulin was used as a housekeeping gene control (Santa Cruz Biotechnology). After washing, the membranes were incubated for 60 min with horseradish peroxidase–linked goat anti-mouse IgG (1:1,000; Vector). The membranes were rinsed for 10 s in the substrate buffer, incubated with BeyoECL Plus Reagents, and detected using an Imager (Image Station 2000R; Kodak).
Construction of reporter plasmids
DNA fragments from the 5′ upstream region of human Oct4 gene were amplified with human genomic DNA, including site 2A (from −2,643 to −2,525 bp), site 2B (from −2,522 to −2,423 bp) or sites 2A + 2B (from −2,572 to −2,471 bp). The DNA fragments were ligated to the MluI and BglII sites of the pGL3-SV40 promoter vector containing luciferase gene (Promega). For reporter assay of enhanced green fluorescent protein (EGFP), EGFP gene was used to replace luciferase gene in the pGL3-SV40 promoter vector.
Luciferase reporter assay
One day before transfection, 1 × 10⁵ BM-MSCs were seeded in a 24-well plate. Two micrograms of recombinant plasmids containing luciferase reporter gene together with 0.04 μg of pRL-TK plasmid (Promega) was cotransfected into cells using Lipofectoamine 2000 (Invitrogen). After 48 h of cell culture, luciferase activity was measured with the dual-luciferase assay system according to the manufacturer's instruction (Promega). All experiments were repeated 3 times.
Electrophoretic mobility shift assay
Oligonucleotides were 3′ end-labeled with biotin (Biotin 3′ End DNA Labeling Kit; Pierce). The labeled oligonucleotides were annealed to their complementary strains by incubating at 95°C for 5 min, followed by gradually decreasing temperature until room temperature. Nuclear extracts were prepared from cells using the nuclear and cytoplasmic extraction reagents (Pierce). The gel shift assays were performed with LightShift Chemiluminescent EMSA kit according to the manufacturer's protocol (Pierce). Each of 20 μL binding reaction mixture contained 20 fmol of biotin-labeled oligonucleotides, 1 μL nuclear extracts (10 μg), and 50 ng poly(dI · dC) as nonspecific competitors. Some binding reaction mixtures also contained 4 pmol unlabeled oligonucleotides as specific competitors, or 1 μL Oct4 or Sox2 antibodies (2 μg) (Santa Cruz Biotechnology). Binding reaction mixtures were incubated at room temperature for 20 min. For supershift assay, the reaction mixtures were incubated at 4°C for 30 min before biotin-labeled probes were added. Reactions were separated on a 6% native polyacrylamide gel in 0.5 × TBE by applying 100 V for 8 × 10 × 0.1 cm gel. Electrophoretic transfer of binding reactions to nylon membrane (Whatman) was performed at 380 mA (∼100 V) for 30 min. Chemiluminescent signal was detected using an Imager (Image Station 2000R; Kodak).
Results
Characterization of BM-MSCs
BM-MSCs were examined for the MSC marker expression by flow cytometry in 6 independent experiments. Cells were positive for the MSC markers CD105, CD73, CD90, and CD44 and negative for CD45, CD34, CD14, CD19, and HLA-DR (negative controls) (Fig. 1). No significant difference in the ages of the donors was observed for the marker expression (data not shown).

Analysis of the MSC marker expression by flow cytometry. Bone marrow–derived mesenchymal stem cells (BM-MSCs) were incubated with phycoerythrin (PE) or fluorescein isothiocyanate (FITC)–conjugated antibodies against the indicated markers: CD105-PE, CD73-PE, CD90-PE, CD44-FITC, CD45-PE, CD34-PE, CD14-FITC, CD19-PE, and HLA-DR-FITC. The open areas represent antibody isotype controls and the shaded areas show the expression of the indicated markers.
BM-MSCs were induced into osteoblasts, chondrocytes, and adipocytes to examine their multilineage differentiation potential. Cells were cultured in the osteogenic differentiation medium and induced to differentiate into osteoblasts. As a late marker of osteogenic differentiation, the deposition of a silver-stained mineralized matrix was detected in cells after 21 days of osteogenic induction by von Kossa staining (Fig. 2b). AP is particularly concentrated in bone and is usually used as an early marker for osteogenic differentiation. AP staining was shown in cells after 14 days of osteogenic induction (Fig. 2d). Both von Kossa and AP staining were negative in cells cultured in the growth medium as negative controls (Fig. 2a, c).
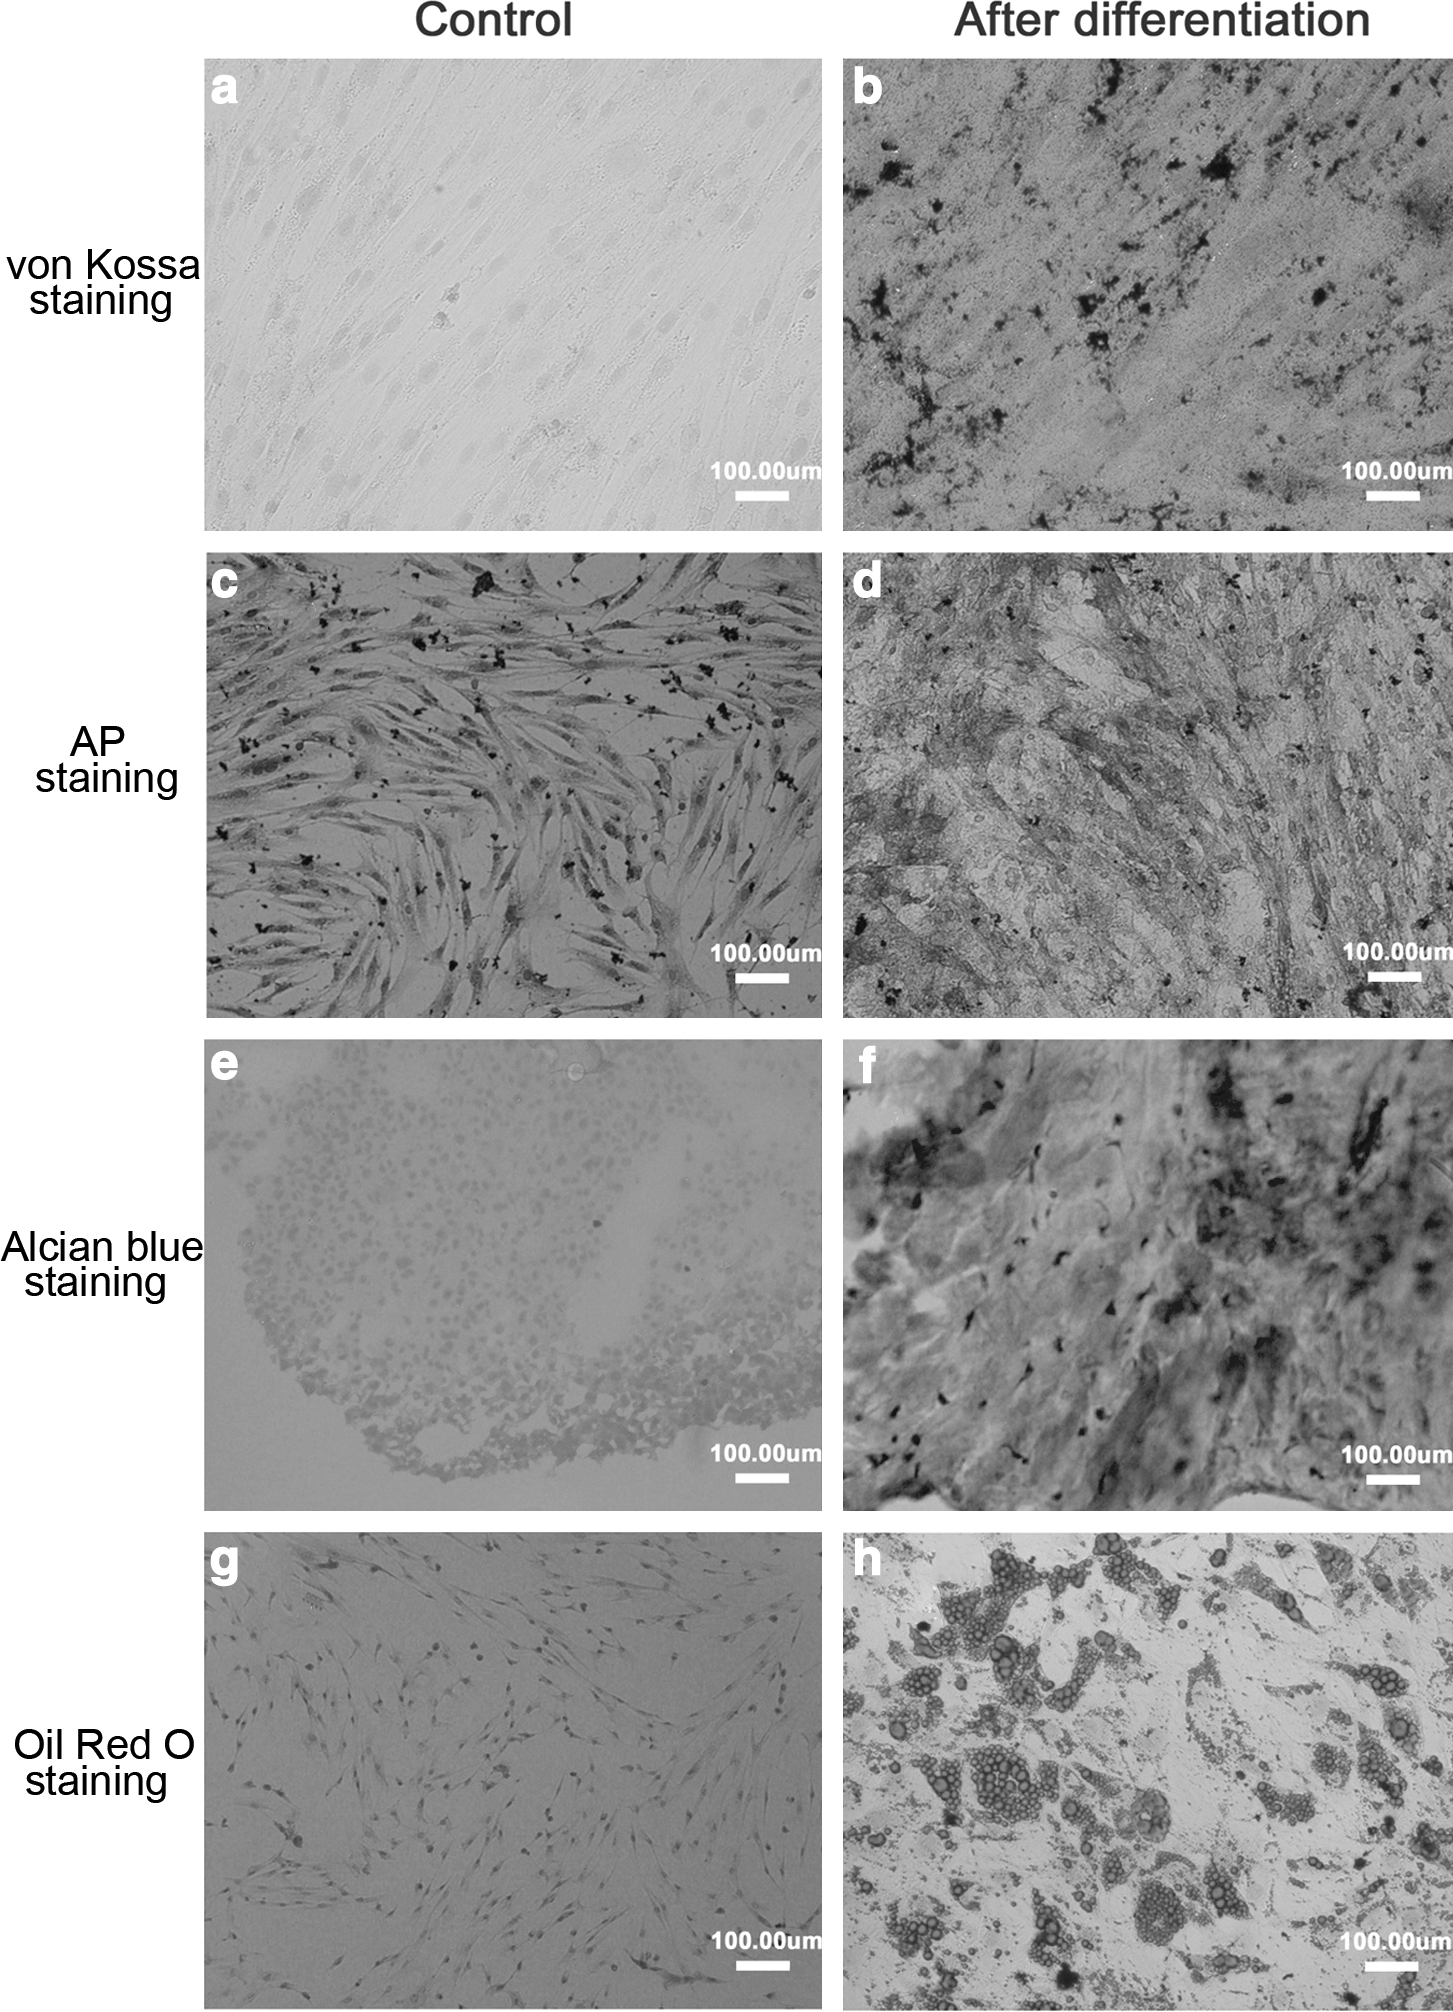
Osteogenic, chondrogenic, and adipogenic differentiation of BM-MSCs. Cells were investigated for their osteogenic, chondrogenic, and adipogenic differentiation to show their multilineage differentiation potential. Osteogenic differentiation was examined by von Kossa staining after cells were cultured for 21 days in the osteogenic differentiation medium
After culturing in the chondrogenic differentiation medium for 21 days, BM-MSCs showed positive for alcian blue staining (Fig. 2f), demonstrating that BM-MSCs were able to differentiate into chondrocytes. BM-MSCs showed positive for oil red O staining after 21 days of cell culture in the adipogenic differentiation medium (Fig. 2h), demonstrating that the cells could differentiate into adipocytes. The cells were negative for alcian blue and oil red O staining after they were cultured in the growth medium as negative controls (Fig. 2e, g).
Analysis of Oct4 and Sox2 gene expression
The expression of Oct4 and Sox2 genes was examined by RT-PCR analysis and detected in undifferentiated BM-MSCs (Fig. 3). A similar level of Oct4 and Sox2 transcription was also observed in cells following 6 days of osteogenic induction but not 21 days. The expression of Oct4 and Sox2 proteins was also evaluated by western blot analysis to confirm the RT-PCR results. Oct4 and Sox2 proteins were detected in the undifferentiated BM-MSCs and in BM-MSCs on day 7 but not days 14 and 21 following osteogenic differentiation (Fig. 4). These results were consistent with those of RT-PCR analysis. These results suggest that there were undifferentiated cells on day 7 following osteogenic differentiation.
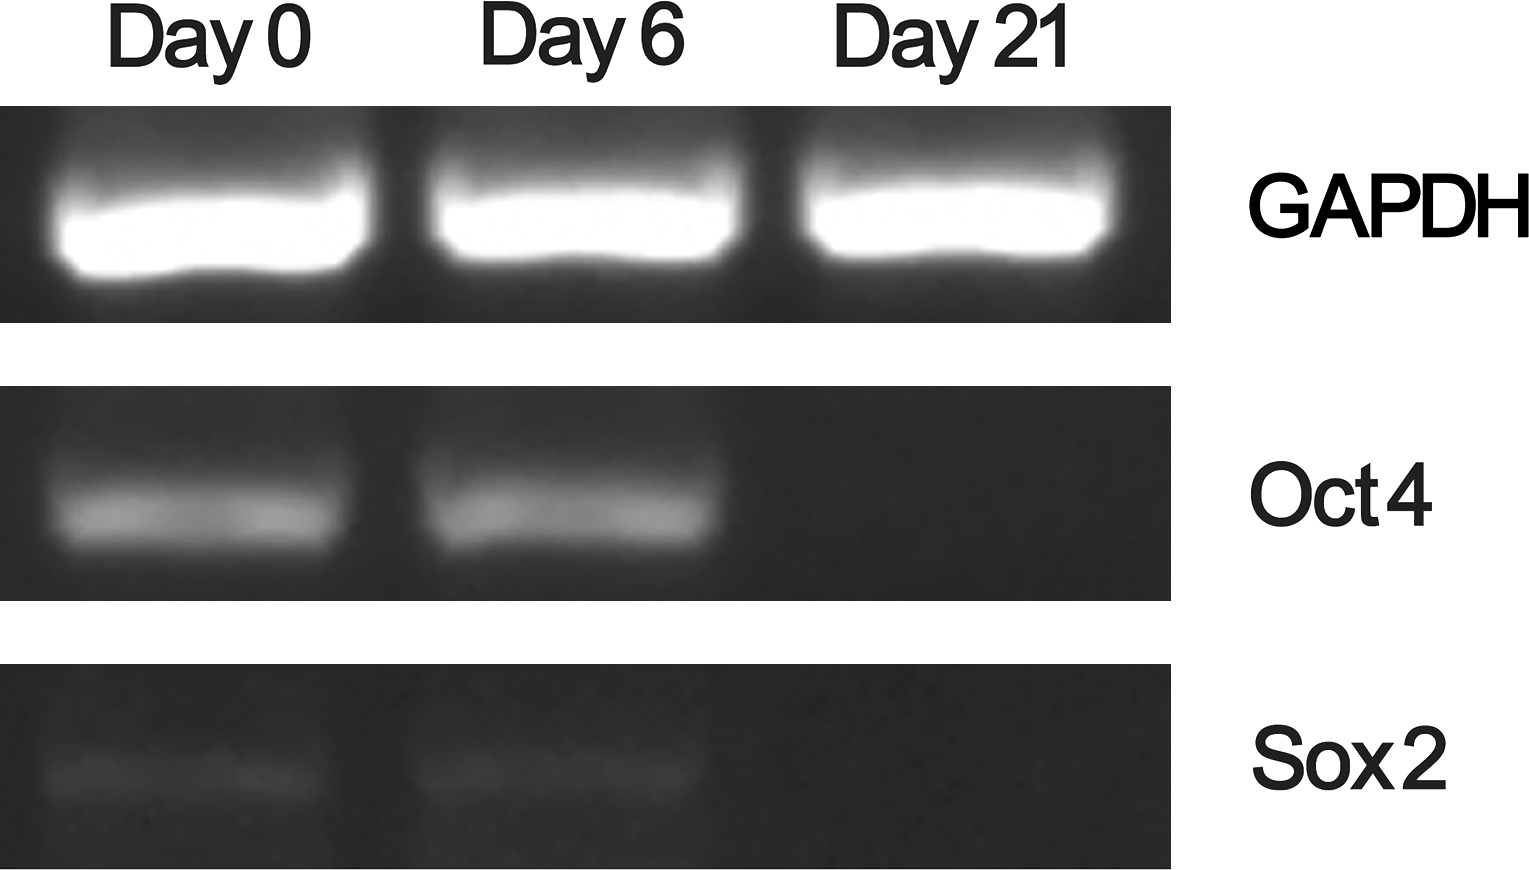
Analysis of the expression of key transcription factors Oct4 and Sox2 by RT–polymerase chain reaction. Total RNA was isolated from undifferentiated BM-MSCs (day 0), or BM-MSCs on day 6 or 21 following osteogenic induction. The expression of GAPDH gene was included as a housekeeping gene control. RT, reverse transcriptase.

Detection of Oct4 and Sox2 protein expression by western blot analysis. Total cellular protein was extracted from BM-MSCs on days 0, 7, 14, and 21 following osteogenic induction. After electrophoresis and electrotransfer to membranes, the membranes were incubated with the mouse antibodies against Oct4 and Sox2 and then with horseradish peroxidase–linked goat anti-mouse IgG. Tubulin was used as a housekeeping gene control.
Analysis of site 2A and 2B enhancer activity by luciferase reporter assay
To analyze whether sites 2A and 2B are important for the expression of Oct4 gene in BM-MSCs, DNA fragments containing site 2A or 2B, or both, were examined for activating the expression of reporter gene luciferase (Fig. 5). The plasmids containing site 2A or sites 2A + 2B significantly increased the relative luciferase activity in undifferentiated BM-MSCs, whereas the activity significantly decreased upon osteogenic differentiation (Fig. 6). Plasmid containing site 2B did not show increased luciferase activity, when compared with the negative control plasmid containing SV40 promoter only (Fig. 6). These results showed that site 2A, not site 2B, played an important role in regulating the expression of Oct4 gene in BM-MSCs.
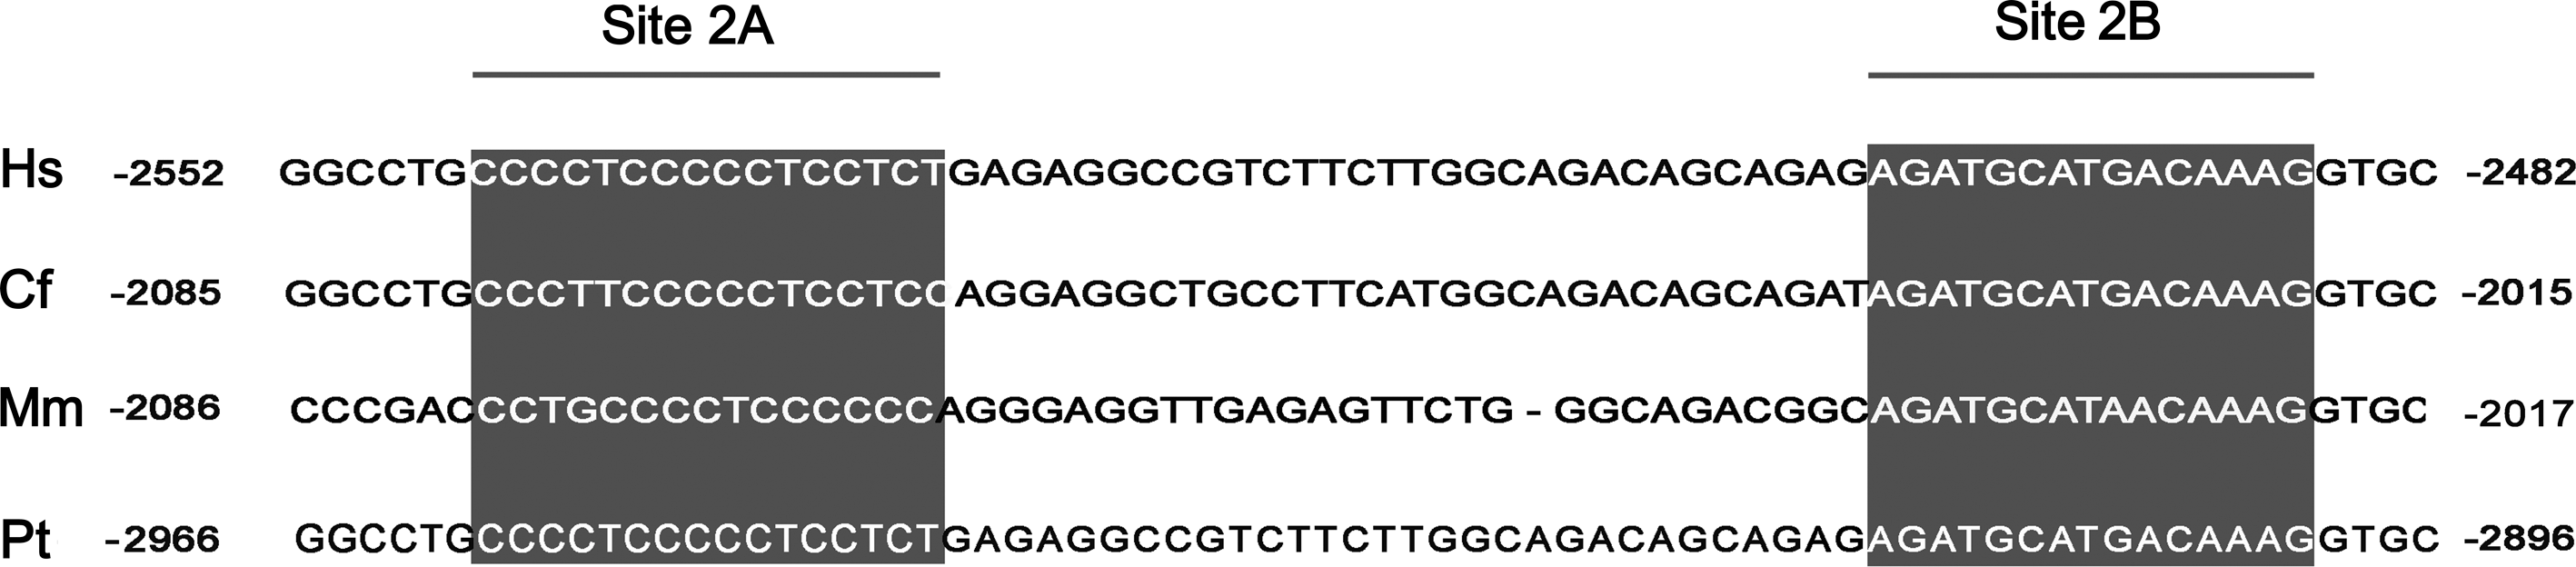
Alignment of the conserved motifs site 2A and 2B within 5′ upstream region of Oct4 gene. The genomic sequences were taken from Homo sapiens (Hs), Canus familiaris (Cf), Mus musculus (Mm), and Pan troglodytes (Pt). Site 2B contains octamer and sox elements that are known to bind to factors Oct4 and Sox2, respectively. The nucleotide numbering is relative to the transcription start site.
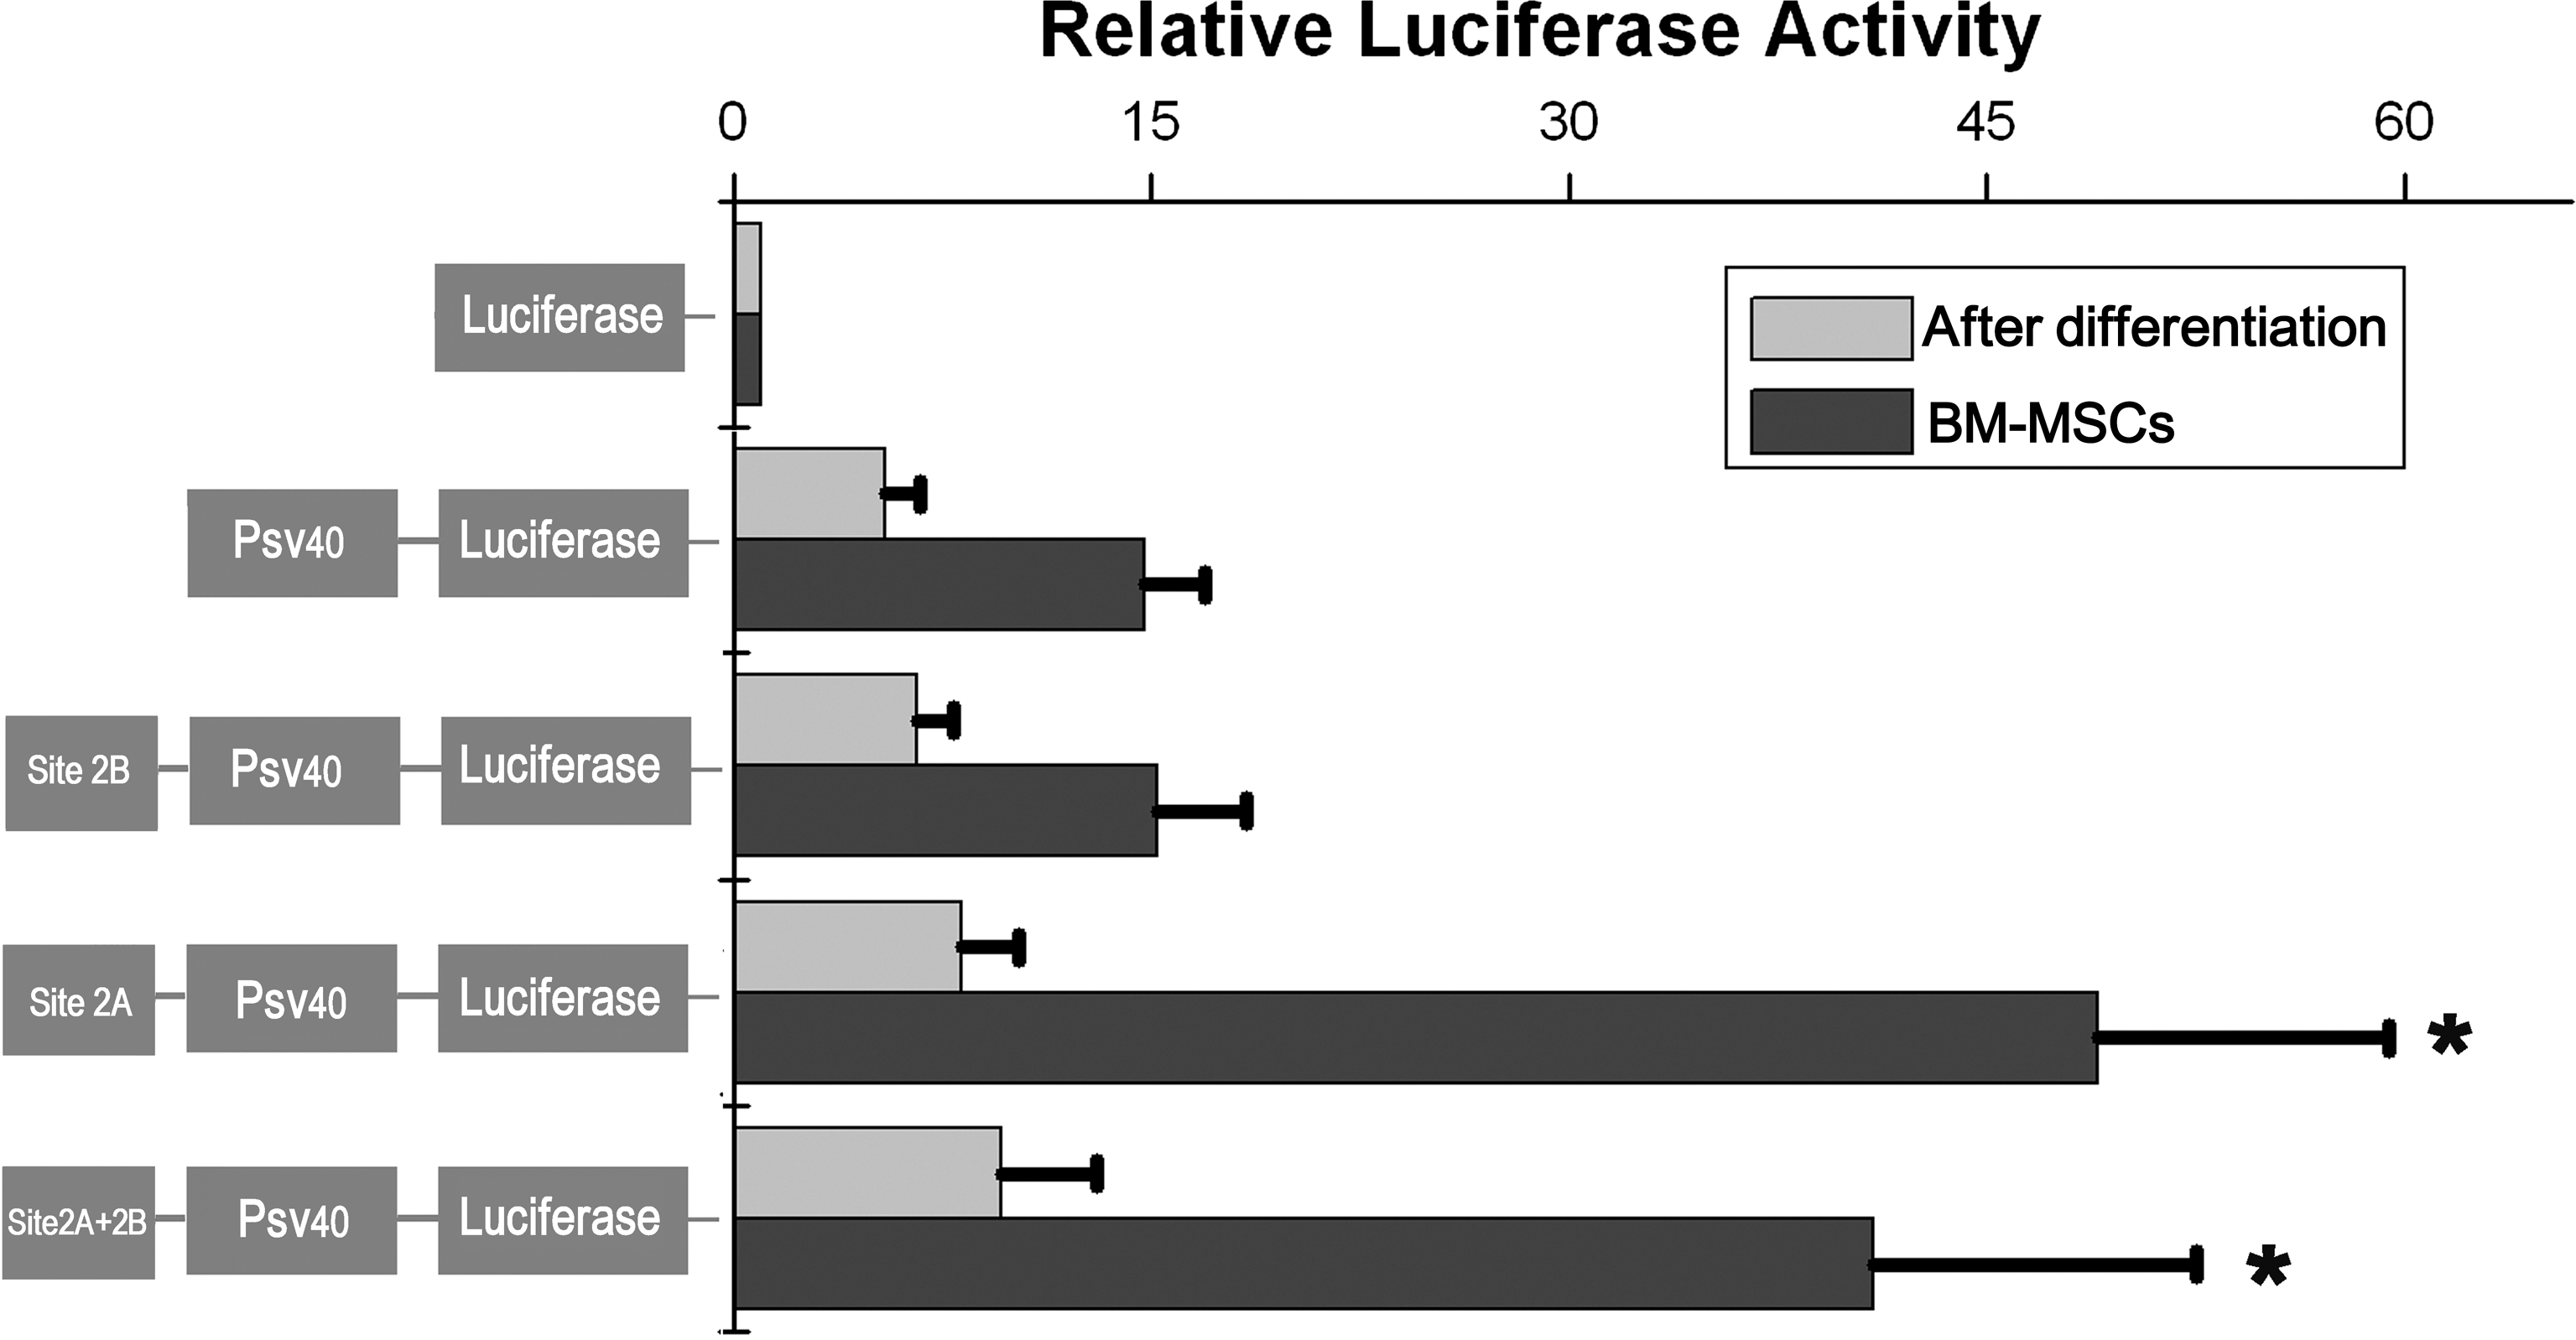
Luciferase reporter assay of various plasmid constructs. The plasmids were transfected into undifferentiated BM-MSCs and BM-MSCs following osteogenic differentiation. Luciferase activities are shown relative to pGL3-basic without SV40 promoter. The bars represent the means ± standard errors of 3 independent experiments. *P < 0.01 relative to pGL3-SV40 promoter.
Analysis of site 2A and 2B enhancer activity by EGFP reporter plasmids
DNA fragments containing site 2A or 2B, or both, were also examined for activating the expression of reporter gene EGFP. The plasmids containing site 2A or sites 2A + 2B activated EGFP expression in undifferentiated BM-MSCs (Fig. 7i, m). Plasmid containing site 2B did not activate EGFP expression (Fig. 7e). EGFP expression was not detected in cells following osteogenic induction (Fig. 7c, g, k, o). Consistent with the results of luciferase reporter assay, these data again showed that site 2A, not 2B, can activate Oct4 gene expression in BM-MSCs.
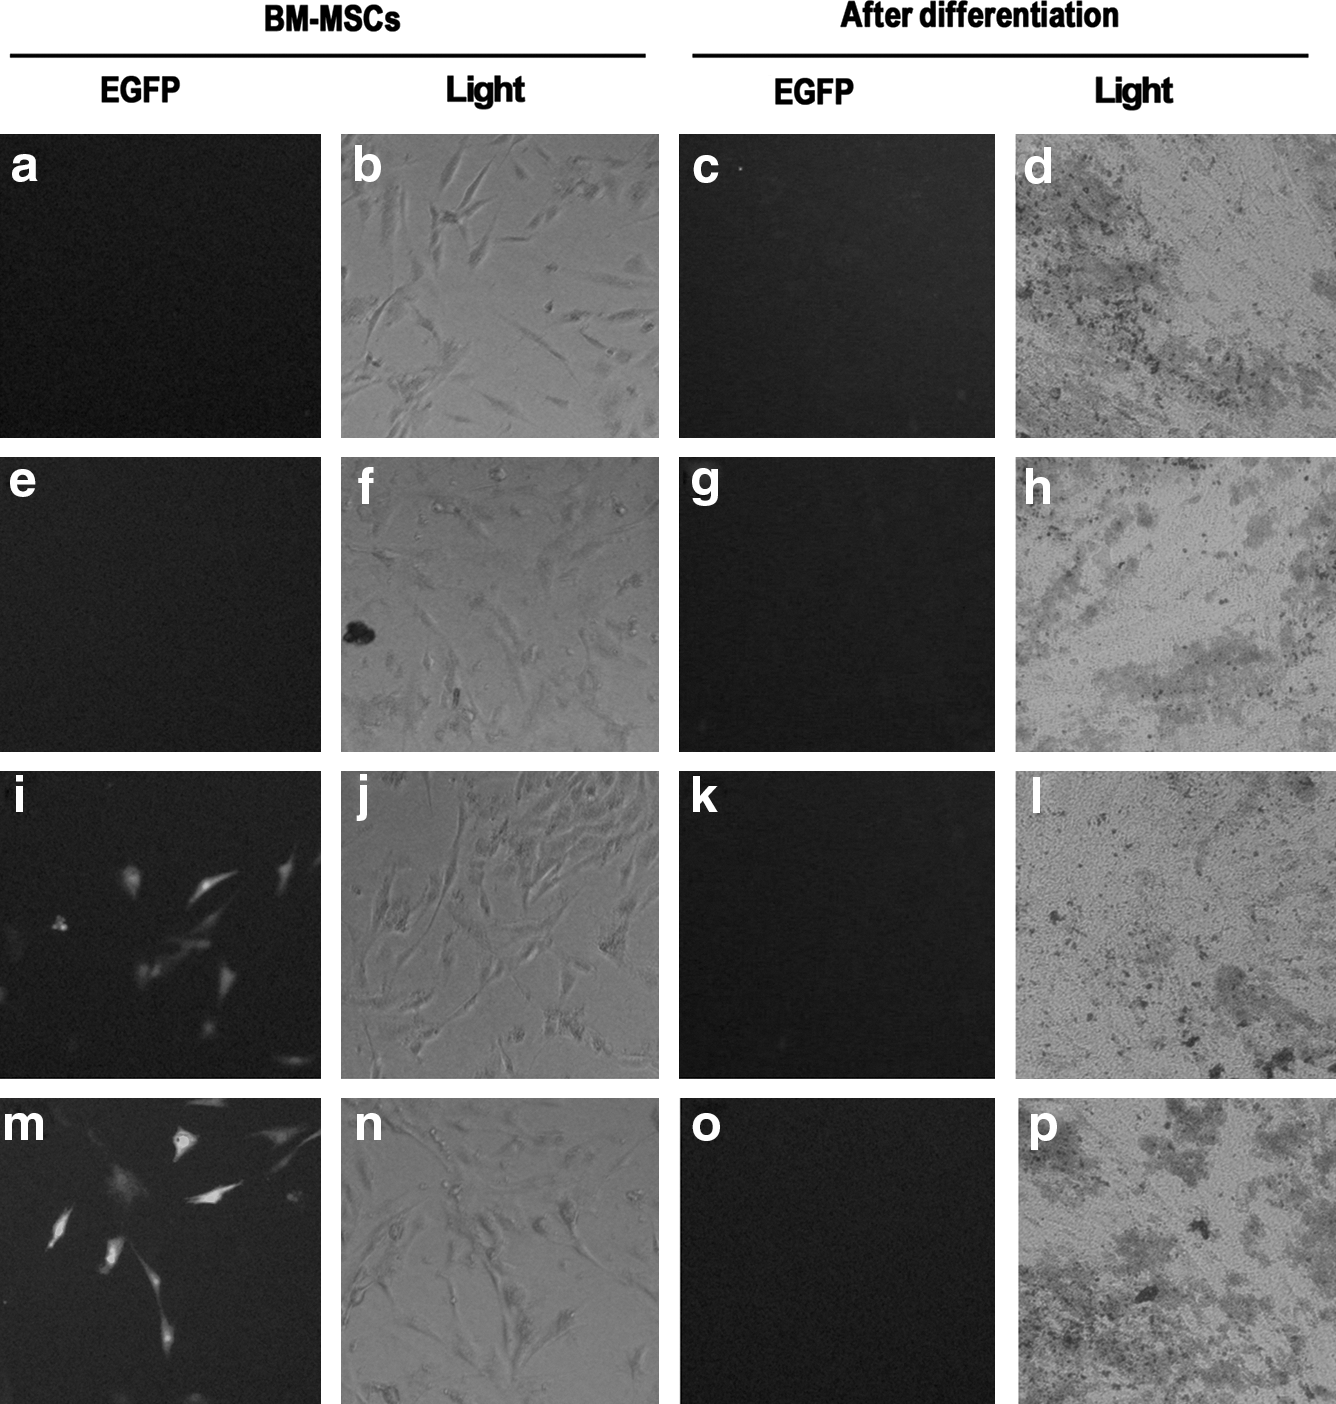
Enhanced green fluorescent protein (EGFP) reporter study of various plasmid constructs. The plasmids were transfected into undifferentiated BM-MSCs and BM-MSCs following osteogenic differentiation. Cells were visualized by either fluorescence microscopy (EGFP) or light microscopy (Light). Plasmid constructs include pGL3-SV40 promoter without site 2A or 2B
No binding of factors Oct4 and Sox2 to octamer and sox elements
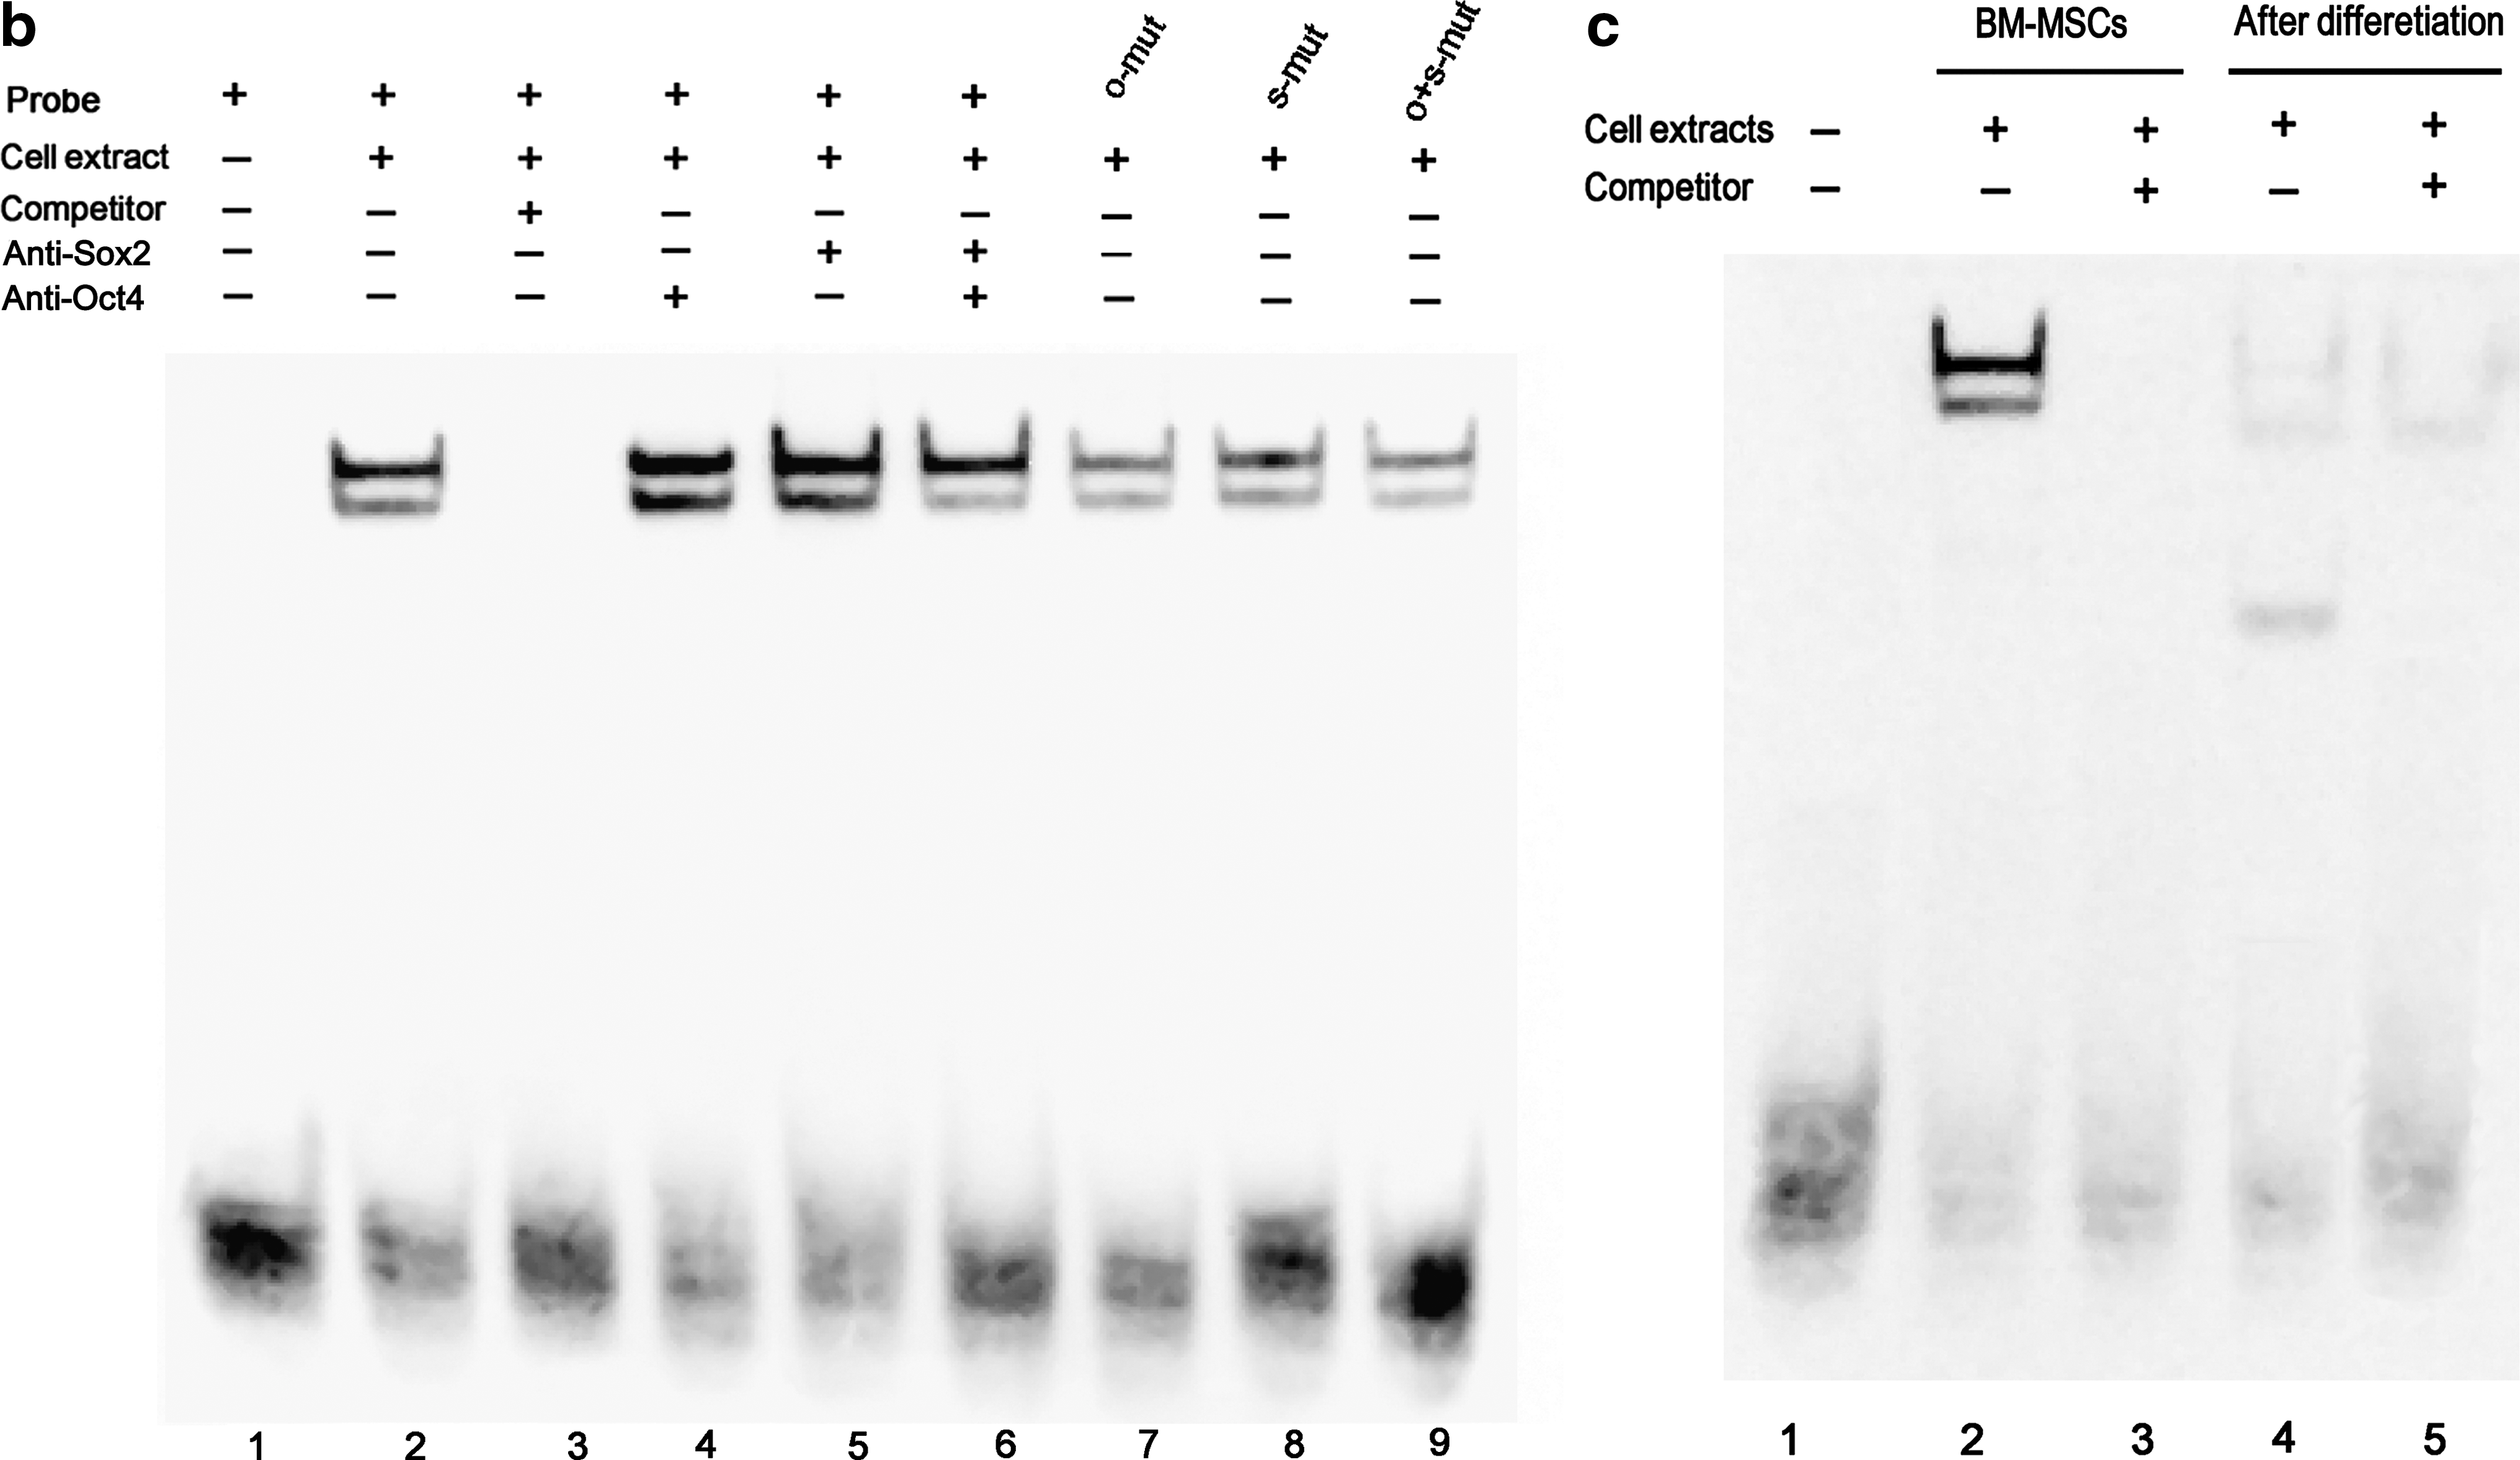
Electrophoretic mobility shift assay (EMSA) showed that site 2B probe gave 2 shifted bands, indicating 2 binding proteins (Fig. 8b, lane 2), and these bands disappeared by incubating with site 2B competitor (Fig. 8b, lane 3). Antibodies to Oct4 and Sox2 did not give supershift bands (Fig. 8b, lanes 4–6), suggesting that the 2 binding proteins are not Oct4 or Sox2 and site 2B does not bind factors Oct4 and Sox2 in BM-MSCs. Site 2B probes containing mutated octamer or sox element, or both, still gave the same 2 shifted bands (Fig. 8a, b, lanes 7–9), further confirming that the 2 shifted bands were not due to the binding of factors Oct4 and Sox2 to their respective binding sites. When cell extract isolated from cells following osteogenic induction was used, the 2 shifted bands described above were not observed (Fig. 8c, lane 4). Instead, 3 faint shifted bands were detected, of which only 1 band disappeared after the addition of 200 × nonlabeled site 2B competitor (Fig. 8c, lanes 4–5).
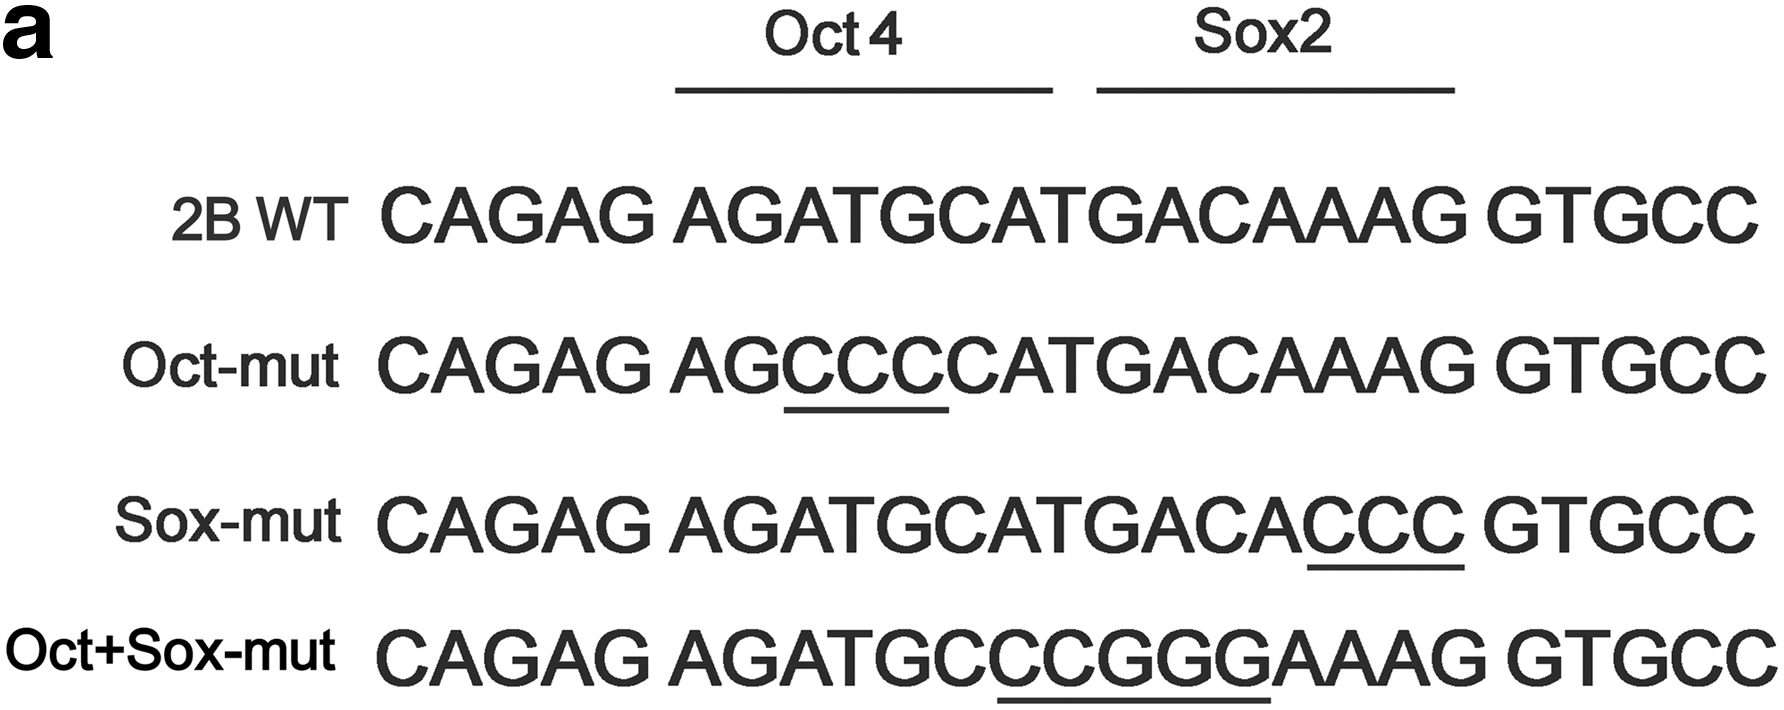
Electrophoretic mobility shift assay (EMSA).
Discussion
Currently, little is known about how self-renewal and differentiation are regulated in BM-MSCs. BM-MSCs express some pluripotent markers such as Oct4, Sox2, Nanog, and SSEA-4 [28,29]. Wnt signaling pathway is important to regulate self-renewal and lineage-specific differentiation of MSCs [26,30]. This pathway inhibits dexamethasone-induced osteogenesis in MSCs [31]. This study showed that Oct4 and Sox2 genes were expressed in undifferentiated BM-MSCs and BM-MSCs on day 7 following osteogenic induction but not on days 14 and 21 (Figs. 3 and 4), suggesting that they could play a role in the determination of osteogenic differentiation of BM-MSCs by regulating the expression of the other genes including wnt signal transduction pathway.
Oct4 gene is transcribed under the control of regulatory elements in the distal region of the gene. This region contains highly conserved sites 2A and 2B. Site 2B contains octamer and sox elements. Both sites are necessary and sufficient for specific activation of Oct4 gene expression in ES cells [19]. ES cells and MSCs share many similarities and both can self-renew as undifferentiated cells and differentiate into many different cells. Therefore, it is very interesting to determine if the expression of Oct4 gene is also regulated by sites 2A and 2B in MSCs. This study showed that site 2A, not 2B, activated the expression of reporter genes luciferase and EGFP in BM-MSCs (Figs. 6 and 7). EMSA confirmed these results by demonstrating that transcription factors Oct4 and Sox2 did not bind to the octamer and sox elements in BM-MSCs (Fig. 8b).
There are several reasons why transcription factors Oct4 and Sox2 do not activate the expression of Oct4 gene in BM-MSCs. The expression of Oct4 gene is reduced after ES cell differentiation and it is caused by a series of repressive epigenetic modifications mediated by histone methyltransferase G9a and de novo DNA methyltransferases DNMT3a/b [32]. A recent study compared the status of DNA methylation in the regulatory regions of Oct4 between nuclear transfer-derived ES cells and in vitro fertilized embryo-derived ES cells [33]. The results showed that the level of DNA methylation correlated negatively with the level of Oct4 transcription in undifferentiated ES cells. During neural differentiation, Oct4 underwent biallelic methylation and reduced amount of Oct4 mRNA was detected in both types of ES cells. DNA methylation could interfere with the binding of transcription factors Oct4 and Sox2 to the site 2B and be responsible for suppressed function of the site 2B in BM-MSCs. Previous studies showed that the expression level of Oct4 and Sox2 was very critical in the determination of their effects on ES cell growth and differentiation. A <2-fold increase in Oct4 expression causes ES cell differentiation into primitive endoderm and mesoderm, and repression of Oct4 expression induces loss of ES cell pluripotency and dedifferentiation to trophectoderm [20]. Overexpression of Sox2 in embryonal carcinoma cells decreases FGF-4 promoter activity and inhibits activation by some coactivators, suggesting that Sox2 expression levels in embryonal carcinoma cells are regulated carefully to avoid interference with the transcription of critical genes [21]. These results demonstrate that appropriate amount of factors Oct4 and Sox2 is required to maintain their functions for regulating the expression of target genes. In this study, the expression of Oct4 and Sox2 was detected in BM-MSCs, but the level was low (Figs. 3 and 4). Therefore, it is possible that low level of factors Oct4 and Sox2 cannot activate the expression of Oct4 gene in BM-MSCs. In this study, EMSA showed the 2 shifted bands with site 2B probe. Antibodies to Oct4 and Sox2 did not supershift these 2 bands and the mutations in the octamer and sox elements of site 2B did not interfere with binding, suggesting that the 2 bands were not due to the binding to site 2B by factors Oct4 and Sox2 and that site 2B probe could bind to 2 unknown factors. The binding of these unknown factors to site 2B probe may interfere with the binding to the same probe by factors Oct4 and Sox2.
Footnotes
Acknowledgments
This work was supported by the National Natural Science Foundation of China (grant no. 30870650 to X.W.). The authors thank all members of Stem Cell laboratory for their technical help and helpful discussion of this work.
Author Disclosure Statement
No competing financial interests exist.