
Abstract
In addition to hematopoietic stem cells, cord blood (CB) also contains different nonhematopoietic CD45−, CD34− adherent cell populations: cord blood mesenchymal stromal cells (CB MSC) that behave almost like MSC from bone marrow (BM MSC) and unrestricted somatic stem cells (USSC) that differentiate into cells of all 3 germ layers. Distinguishing between these populations is difficult due to overlapping features such as the immunophenotype or the osteogenic and chondrogenic differentiation pathway. Functional differences in the differentiation potential suggest different developmental stages or different cell populations. Here we demonstrate that the expression of genes and the differentiation toward the adipogenic lineage can discriminate between these 2 populations. USSC, including clonal-derived cells lacking adipogenic differentiation, strongly expressed δ-like 1/preadipocyte factor 1 (DLK-1/PREF1) correlating with high proliferative potential, while CB MSC were characterized by a strong differentiation toward adipocytes correlating with a weak or negative DLK-1/PREF1 expression. Constitutive overexpression of DLK-1/PREF1 in CB MSC resulted in a reduced adipogenic differentiation, whereas silencing of DLK-1 in USSC resulted in adipogenic differentiation.
Introduction
O
In this study, we demonstrate that different nonhematopoietic stem/progenitor cell populations exist in CB that can be distinguished by their adipogenic differentiation potential and by their DLK-1 expression profile. Overexpression of DLK-1 in initially negative CB MSC results in a marked blunting of their ability to undergo adipogenic differentiation, whereas silencing of high DLK-1 expressing USSC led to the formation of an adipogenic phenotype.
Materials and Methods
Generation and expansion of CB-derived cells
USSC and CB MSC were generated by the same method. Classification of the adherent cells into USSC and CB MSC was only possible after generation by determining the adipogenic differentiation potential and DLK-1 expression. CB was collected from umbilical cord vein with informed consent of the mother. Mononuclear cells (MNC) were obtained by ficoll (Biochrom, density 1.077 g/cm3) gradient separation followed by ammonium chloride lysis of RBCs. The 5–7 × 10⁶ CB MNC/mL were cultured in Dulbecco's modified Eagle's medium (DMEM) low glucose (Cambrex, Charles City, IA) with 30% FCS (Perbio, Woburn, MA), 10−7 M dexamethasone (Sigma-Aldrich, St. Louis, MO), penicillin/streptomycin and l-glutamine (PSG; Cambrex). When colonies were detected, cells were expanded without dexamethasone in a closed system applying cell stacks (Corning, Corning, NY). CB-derived cells (USSC and CB MSC) were incubated at 37°C in 5% CO2 in a humidified atmosphere. Reaching 80% confluence, cells were detached with 0.25% trypsin (Cambrex) and replated 1:3.
Generation of cell clones employing the AVISO CellCelector™
Clonal populations were obtained from established cell lines and, as additional approach, already during generation of cell lines by applying special cloning cylinders with silicone grease at the end of the cylinder (Chemicon, Billerica, MA) (Fig. 1B). In this case, cell lines were generated as described before and if distinct, separate, colonies were observed, a cloning cylinder was attached on a single colony and cells were trypsinated according to the standard protocol. Cells of one colony were subsequently plated at low density into 6-well cell culture plates and single cells were picked employing the AVISO CellCelector™. Remaining cells were expanded as a whole bulk culture and referred to as initial cell line. By this approach, clonal lines were established from the youngest cells. The isolation of separate colonies by cloning cylinders allowed to examine and compare clonal cells derived from different colonies of the same CB. Clonal populations were then obtained applying the AVISO CellCelector™ (Aviso, Greiz, Germany). This combined system consists of a robotic arm with an application-dependent tool, an integrated microscope, and a specialized computer software (Fig. 1B). For the purpose of generating clonal cell populations, a thin glass capillary with a diameter of 800 μm was used as application tool. In brief, cells were plated at low density (166 cells/cm2) in 6-well cell culture plates and after allowing the cells to get adherent again, distinct single cells were selected, picked, and transported to a defined destination well of a 96-well cell culture plate and cultured with preconditioned medium. For verification, pictures were taken before and after each picking process to document successful single cell selection (Fig. 1B and 1C).

Generation, growth kinetics, and age-related assessment of CB-derived cells and corresponding clonal populations. (
Telomere length detection and senescence assay
Telomere length assay
The Telo TAGGG Telomere Length Assay (Roche Diagnostics, Germany) was used for sensitive detection of telomeric DNA from cell cultures and for determination of the telomere length. The genomic DNA was digested applying frequently cutting restriction enzymes (HinfI/RsaI). After digestion, the DNA fragments were separated by gel electrophoresis, blotted, and telomere restriction fragments (TRFs) were visualized. Finally, the size distribution of the TRFs was compared with a DNA length standard and evaluated utilizing ImageQuant™ TL and TELRUN (Version 1.4).
Senescence assay
See Supplementary Data, available online at
Immunophenotyping of USSC and CB MSC
See Supplementary Data.
In vitro differentiation into osteoblasts, adipocytes, and chondroblasts
Differentiation into osteoblasts, adipocytes, chondroblasts, and neural cells was performed as described previously [4,13]. Adipocytes were induced applying DMEM high glucose, 10% FCS, PSG, 10−6 M dexamethasone, 0.2 mM indomethacine, 0.1 mg/mL insulin, and 1 mM 3-isobutyl-methylxanthine. Media was changed twice a week and lipid vacuoles stained with Oil Red O after 21 days. Size and area of chondrogenic pellets were determined applying the AVISO CellCelector™.
RNA isolation and reverse transcription polymerase chain reaction
Total RNA of cells was isolated utilizing the RNeasy Mini Kit (Qiagen, Valencia, CA). RNA of differentiated cells was isolated using TRI Reagent® (Sigma-Aldrich) following the instruction protocol. One microgram RNA was reverse-transcribed applying SuperScriptIII (Invitrogen, Carlsbad, CA) according to the manual.
Reverse transcription polymerase chain reaction and real-time polymerase chain reaction
For reverse transcription polymerase chain reaction (RT-PCR), 2 min 94°C, 35 cycles of 30 s 94°C, 30 s 60°C and 30 s 72°C, and 5 min 72°C were performed. Real-time PCR was performed with SYBR® Green PCR Mastermix (Applied Biosystems, Foster City, CA; primer see Supplementary Table 1; Supplementary materials are available online at
Immunohistochemistry
The 10,000 cells/cm2 were plated on chamber slides (Lek-Tek, Chamber Slide™, 2-Well Glass Slide). Cells were fixed with −20°C acetone for 2 min or 4% paraformaldehyde (PFA). Primary antibody (Supplementary Table 2; Supplementary materials are available online at
Western blot analysis
Total protein was analyzed in western blot analysis (NuPAGE® System, Invitrogen) and ECL PLUS Western Blotting Detection Reagents (GE Healthcare, Piscataway, NJ) applied for detection (see Supplementary Data).
Overexpression of DLK-1
Full-length human DLK-1 was amplified using Phusion® Taq Polymerase (New England Biolabs, Beverly, MA). Insert and vector (pCL7Egwo; Supplementary Fig. 6, available online at
Silencing of DLK-1 in USSC
DLK-1 silencing was performed using human DLK-1 shRNA (SHCLNG-NM_003836; Sigma-Aldrich; see Supplementary Fig. 5; available online at
Affymetrix chip analysis
Five micrograms of total RNA were labeled as described in the Affymetrix Expression Manual Version 2. The Affymetrix Gene Chip protocol (Version 2) was followed for hybridization, washing and staining on the GC Scanner 3000 with G7 update. Images were analyzed with Affymetrix MAS5.0 and “global scaling” was employed for normalization.
Statistics
Statistics were evaluated applying the GraphPadInStat software. A 2-tail unpaired t-test was used.
Results
Generation of CB-derived cells
Over the last years, we initiated adherent cell cultures from 860 CB samples, from which 43% (n = 370) gave rise to an average of 1–11 colonies per CB (Fig. 1A). After trypsinization, these spindle-shaped cells grew into monolayer within 2–3 weeks (Fig. 1A). Cell lines that did not reach >2 passages (n = 196; 53%) were not characterized. Once established, 10% (n = 37) of these cell lines reached passage (P) 3–4, 6% (n = 22) P5–6, 21% (n = 77), and P7–8 10% (n = 37) yielded >9 passages (Fig. 1A). Already in P4, 1.5 × 10⁹ cells could be obtained after expansion under GMP grade conditions [29]. If cells reached P9 (n = 37), they could be further expanded to >20 passages, theoretically yielding up to 1015 cells. USSC and CB MSC were always generated from fresh CB (<36 h after delivery). At the moment, there is no evidence that cellular parameters influence the cloning efficiency of USSC and CB MSC. As previously shown by our group, there was no correlation between generation of CB-derived cell lines and gestational age, CB volume, the number of nucleated cells in the CB collections, hours after elapse, or the number of MNC in the CB after gradient separation [17].
Growth kinetics and age-related assessment of cells
Overall, 623 single cells from 12 different adherently growing CB-derived cell lines were isolated applying the AVISO CellCelector™ (Fig. 1B, with a median cloning efficiency of 33% (n = 205, Fig. 1C). Out of these 205 clonal cell populations, 38% (n = 78) could be expanded for further 6 passages and 21% (n = 43) for further 9 passages.
The median generation efficiency of clonal populations of established USSC bulk cultures was higher (38%) than the generation efficiency of clonal populations of established CB MSC cultures (26%) (Fig. 1D).
Cumulative population doublings (CPD) were assessed from all cell lines tested, including BM MSC. USSC could be cultured for up to maximal 63 CPD, CB MSC reached up to maximal 53 CPD, and BM MSC up to 35 CPD in culture. Clonal populations yielded up to 57 CPD (Fig. 1E). Comparing the CPDs in P5, there were no differences between USSC (32.4 ± 2.2 CPD) and CB MSC (29.8 ± 2.8 CPD) (P = 0.1239), while the CPDs in P9 (USSC 43.1 ± 4.1 CPD, CB MSC 37.8 ± 4.1 CPD) were significantly different (P = 0.0486). USSC-derived clonal populations (37.3 ± 4.1 CPD) reached higher CPDs at the same passage compared with USSC (32.4 ± 2.2 CPD) in P5 (P = 0.0214), as well as in P9 (USSC clonal populations 50 ± 2.4 CPD, USSC 43.1 ± 4.1) (P = 0.0001). In P5, CB MSC derived clonal populations reached 40.5 ± 0.8 CPD, while CB MSC reached only 29.8 ± 2.8 CPD (P < 0.0001). In P9, growth kinetics of CB MSC-derived clonal populations (46.7 ± 3.2 CPD) and CB MSC (37.8 ± 4.1 CPD) were still significantly different (P = 0.0022) (Fig. 1E and Supplementary Fig. 1A; Supplementary materials are available online at
To determine more precisely the “biological age” of tested cell populations, a telomere length assay (Fig. 1F) was performed in P9. USSC telomeres are in average 10.7 ± 1.4 kbp long. CB MSC had 9.5 ± 0.98 kbp long telomeres and in BM MSC telomere length was shortest with 8.8 ± 1.3 kbp (Fig. 1F). USSC-derived clonal populations had shorter telomeres 6.6 ± 0.8 kbp compared with their initial cell line in P9 (data not shown).
In addition, senescence was analyzed at least in 2 different passages by histochemical detection of the senescence-associated β-galactosidase. USSC exhibited a senescent rate of 30%–45% whereas already 70%–80% CB MSC were senescent after 9 passages. For comparison, almost 95% of BM MSC in P9 were senescent (Supplementary Fig. 1B, available online at
Expression of specific surface antigens was analyzed in flow cytometry. All lines tested were negative for CD31, CD34, CD45, CD56, CD106, AC133 (CD133/1), CD184, and HLA-DR. They expressed high levels of CD13, CD29, CD44, CD71, CD73, CD105, CD146, CD166, and HLA-ABC but low levels of NG2, PDGFRα, and PDGFRβ. Fluorescence-activated cell sorting (FACS) analysis did not reveal any significant differences between the different cell lines and CB-derived clones (Supplementary Fig. 2; Supplementary materials are available online at
RT-PCR, real-time PCR, and immunohistochemistry were performed to determine the expression analysis of OCT4A [30,31], NANOG, SOX2, KLF4, and c-MYC utilized for the induction of pluripotent stem cells from adult human fibroblasts [32]. There was no expression of OCT4A, NANOG, and SOX2 in any of the CB-derived cell populations (Supplementary Fig. 3; Supplementary materials are available online at
In vitro adipogenic differentiation as a distinguishing feature between cells derived from CB
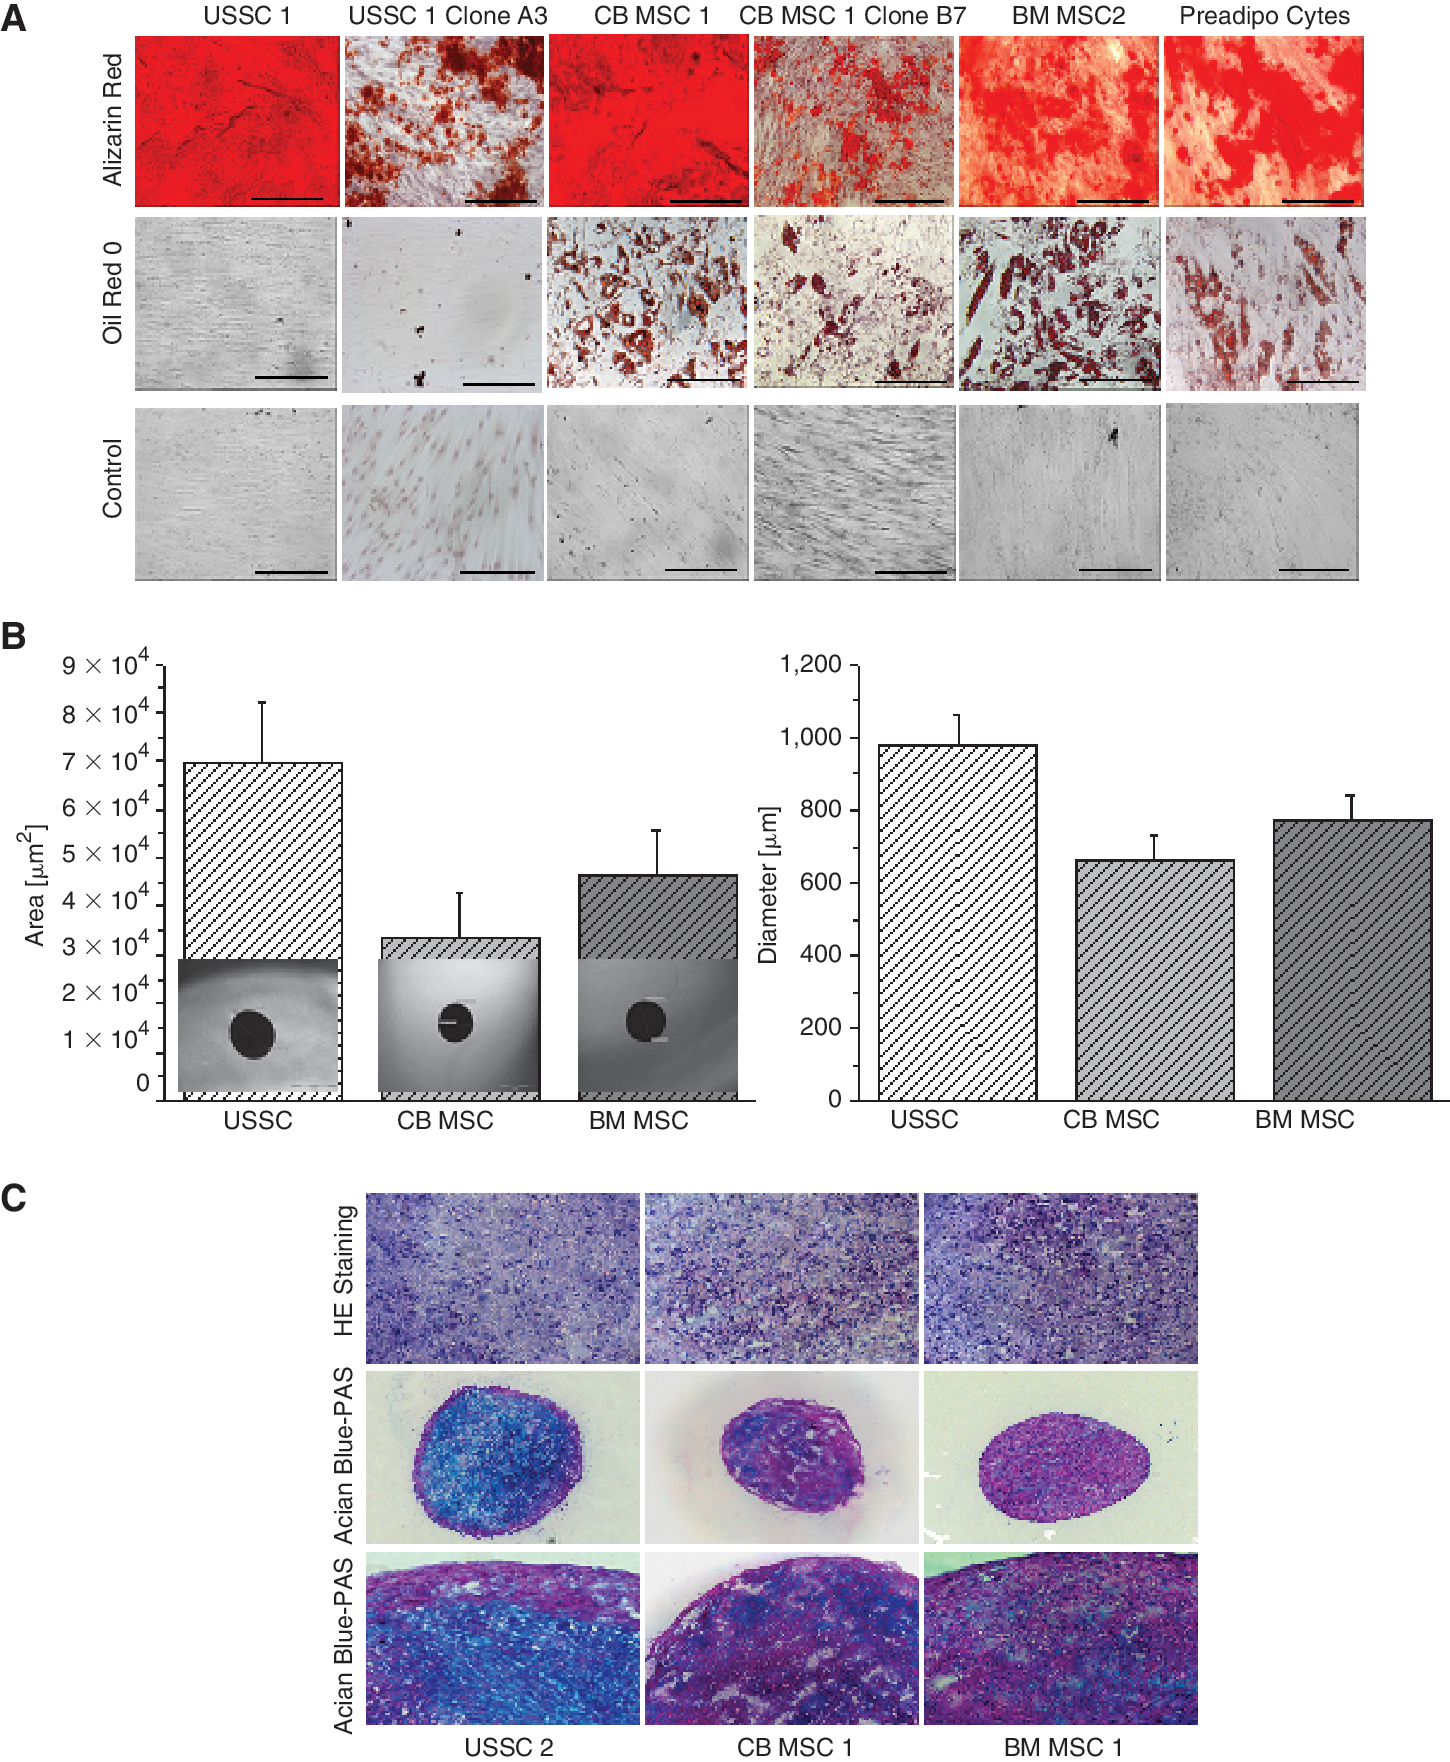
BM MSC (n = 8) and cultured human preadipocytes (Cell Line Service) (n = 2) were used as positive controls for osteogenic, chondrogenic, and adipogenic differentiation. Whereas no differences in the formation of osteoblasts between the different CB-derived cell lines in the analyzed passages (P5 and 9) could be observed by Alizarin Red staining (Fig. 2A), a restricted differentiation potential was observed for the clonal populations, BM MSC and preadipocytes (all in P4–6). Adipogenic differentiation was documented by Oil Red O staining of lipid vacuoles (Fig. 2A). On Day 14 after induction, 43.1% out of 65 CB cell lines and 46% out of 39 cell clones showed the adipogenic phenotype, while no lipid vacuoles were ever detected in the noninduced control cells (Fig. 2A). The osteogenic as well as the adipogenic differentiation potential of USSC and CB MSC was weaker in P10. Corresponding clonal populations in P9–10, if they could be expanded so far, differed in their differentiation capability (Supplementary Fig. 4A; Supplementary materials are available online at
In vitro mesodermal differentiation. (
These results imply that the adipogenic differentiation potential could be a distinguishing feature between the different adherently growing CB-derived cells. We therefore defined CB-derived cells with high adipogenic differentiation potential as CB MSC (n = 28) and the ones without as USSC (n = 35).
After 21 days of chondrogenic induction, no significant differences could be detected analyzing diameter and area or hematoxylin-eosin staining of chondrogenic pellets formed by USSC (n = 5), CB MSC (n = 5), and BM MSC (n = 15) (Fig. 2B). Alcian blue-periodic acid-Schiff (PAS) staining did not reveal clear differences between USSC compared with CB MSC and BM MSC (Fig. 2C). While USSC exhibited a slightly stronger, cartilage specific alcianophilia morphology in the central region of the chondrogenic pellet, Alcian blue-PAS staining in CB MSC and BM MSC indicated a weaker, more diffuse alcianophilia morphology. No remarkable differences between CB MSC and BM MSC were observed.
Screening for a marker linked to adipogenic differentiation revealed DLK-1 as a potential key player to inhibit the adipogenic pathway
Peroxisome proliferator activator γ (PPARγ), CCAAT enhancer-binding protein a (CEBPα), adiponectin (ADIPOQ), fatty acid-binding protein 4 (FABP4), and perilipin (PLIN) are specific genes that are up-regulated during adipogenesis, while DLK-1, one of the key players in adipogenesis, is down-regulated as schematically shown in Supplementary Figure 4B [23]. DLK-1 expression of CB-derived colonies displayed a heterogeneous expression profile. Two out of 8 colonies were DLK-1 +, while 5 colonies were weakly positive and 1 colony was DLK-1 − as detected by real-time PCR (Fig. 3A). DLK-1 expression could be verified by RT-PCR in 16 out of 32 CB-derived cell lines and 11 out of 23 cell clones. These cells never differentiated toward the adipogenic lineage and were therefore termed, as mentioned before, USSC. CB MSC (n = 16), and cultured preadipocytes, were DLK-1 − or very weakly positive but exhibited a strong adipogenic differentiation capacity. BM MSC from young donors were weakly DLK-1 + and BM MSC from older donors were DLK-1 −, correlating with a weaker adipogenic differentiation potential of BM MSC from young donors than BM MSC from older donors. After analyzing DLK-1 expression of USSC and CB MSC and corresponding clonal populations, a very low expression could be detected for CB MSC-derived clonal populations (n = 46), while the DLK-1 expression of USSC-derived clonal populations (n = 43) varied from very high expression to very low expression (Fig. 3B). Some USSC-derived clonal populations lost their ability to express DLK-1 with subsequent passages (P6–10) as illustrated by real-time PCR (Fig. 3B). This indicates a loss of DLK-1 with “biological” aging in culture. Analyzing 65 cell lines, we also found 2 out of 65 bulk cell lines that expressed high levels of DLK-1 and revealed no adipogenic differentiation in P5. With subsequent passages DLK-1 was down-regulated and an adipogenic phenotype could be detected (in P10) by Oil Red O staining (Supplementary Fig. 4C).

Screening for a marker linked to adipogenic differentiation revealed DLK-1 as a potential key player to inhibit the adipogenic pathway (
We classified this cell population between USSC and CB MSC (differentiation potential P5 vs. P10) as intermediate (n = 2).
After osteogenic as well as adipogenic induction (Fig. 3C and 3D), DLK-1 expression was down-regulated in USSC, however not completely absent. During osteogenic differentiation, DLK-1 down-regulation in USSC was accompanied by an up-regulation of RUNX2 expression (Fig. 3C). PPARγ2 expression in adipogenic differentiation was up-regulated in CB MSC during adipogenic differentiation, while no significant up-regulation could be detected in USSC after adipogenic induction (Fig. 3D). Fourteen days after adipogenic induction, expression of the adipogenic markers PPARγ, FABP4, and PLIN could be detected in all BM MSC (positive control, n = 3) and also in all CB MSC (n = 7). After adipogenic induction, ADIPOQ expression was hardly detectable in CB MSC. No expression of adipogenic genes could ever be detected in USSC (n = 6) and in the respective noninduced controls (Supplementary Fig. 4D).
RT-PCR results were confirmed by western blot analysis (Supplementary Fig. 4E and 4F) and immunohistochemical staining for PLIN, a marker for final adipogenesis [33], and DLK-1 21 days after adipogenic induction (Fig. 3E and 3F). USSC were tested negative for PLIN after adipogenic differentiation while CB MSC were positive and the highest amount of PLIN was detected in differentiated BM MSC and in human preadipocytes (positive controls) (Fig. 3E and Supplementary Fig. 4E). No PLIN could be detected in the noninduced controls. The adipogenic-induced USSC, CB MSC, and BM MSC (negative control) and noninduced cells were also analyzed for DLK-1 expression on the protein level. In accordance to the failed adipogenic differentiation, DLK-1 was highly expressed in USSC detected by immunohistochemistry (Fig. 3F) and western blot analysis (Supplementary Fig. 4F).
USSC and CB MSC differ in their neural differentiation potential
USSC (n = 16), USSC-derived clonal populations (n = 6), CB MSC (n = 4), and CB MSC-derived clonal populations (n = 9) were differentiated into the neural lineage. USSC and USSC-derived clones revealed a neural morphology demonstrated by immunohistochemistry for human (β-3-tubulin and neurofilament and by real-time PCR detecting neurofilament light, medium, and heavy polypeptides and β-3-tubulin (Supplementary Fig. 5A and 5B) as described by Greschat et al. [13]. No neural phenotype was ever detected for CB MSC or corresponding clonal populations (Supplementary Fig. 5A).
DLK-1 overexpression in CB MSC
To test whether DLK-1 overexpression of CB MSC might lead to a broader differentiation capacity, CB MSC were transduced with a lentiviral vector (pCL7Egwo_DLK-1), expressing the full-length human DLK-1 cDNA of an internal constitutive promotor and with the control vector pCL7Egwo, containing eGFP instead of DLK-1. Effectiveness of transduction was evaluated by FACS analysis and fluorescence microscopy (Supplementary Fig. 6A). Transduced cells revealed no morphological changes or differences in growth kinetics compared with the nontransduced cells. Concentrating of virus resulted in cell death while virus dilution of 1:10 did not affect the adipogenic differentiation potential of CB MSC (data not shown). Following transfection, high amounts of DLK-1 could be detected in real-time PCR (Fig. 4A), confirmed by immunohistochemistry (Fig. 4C). Correlating with the high DLK-1 expression, these DLK-1 overexpressing cells (CB MSCDLK−1+) revealed a diminished adipogenic differentiation potential compared with the initial cell line (Fig. 4C).
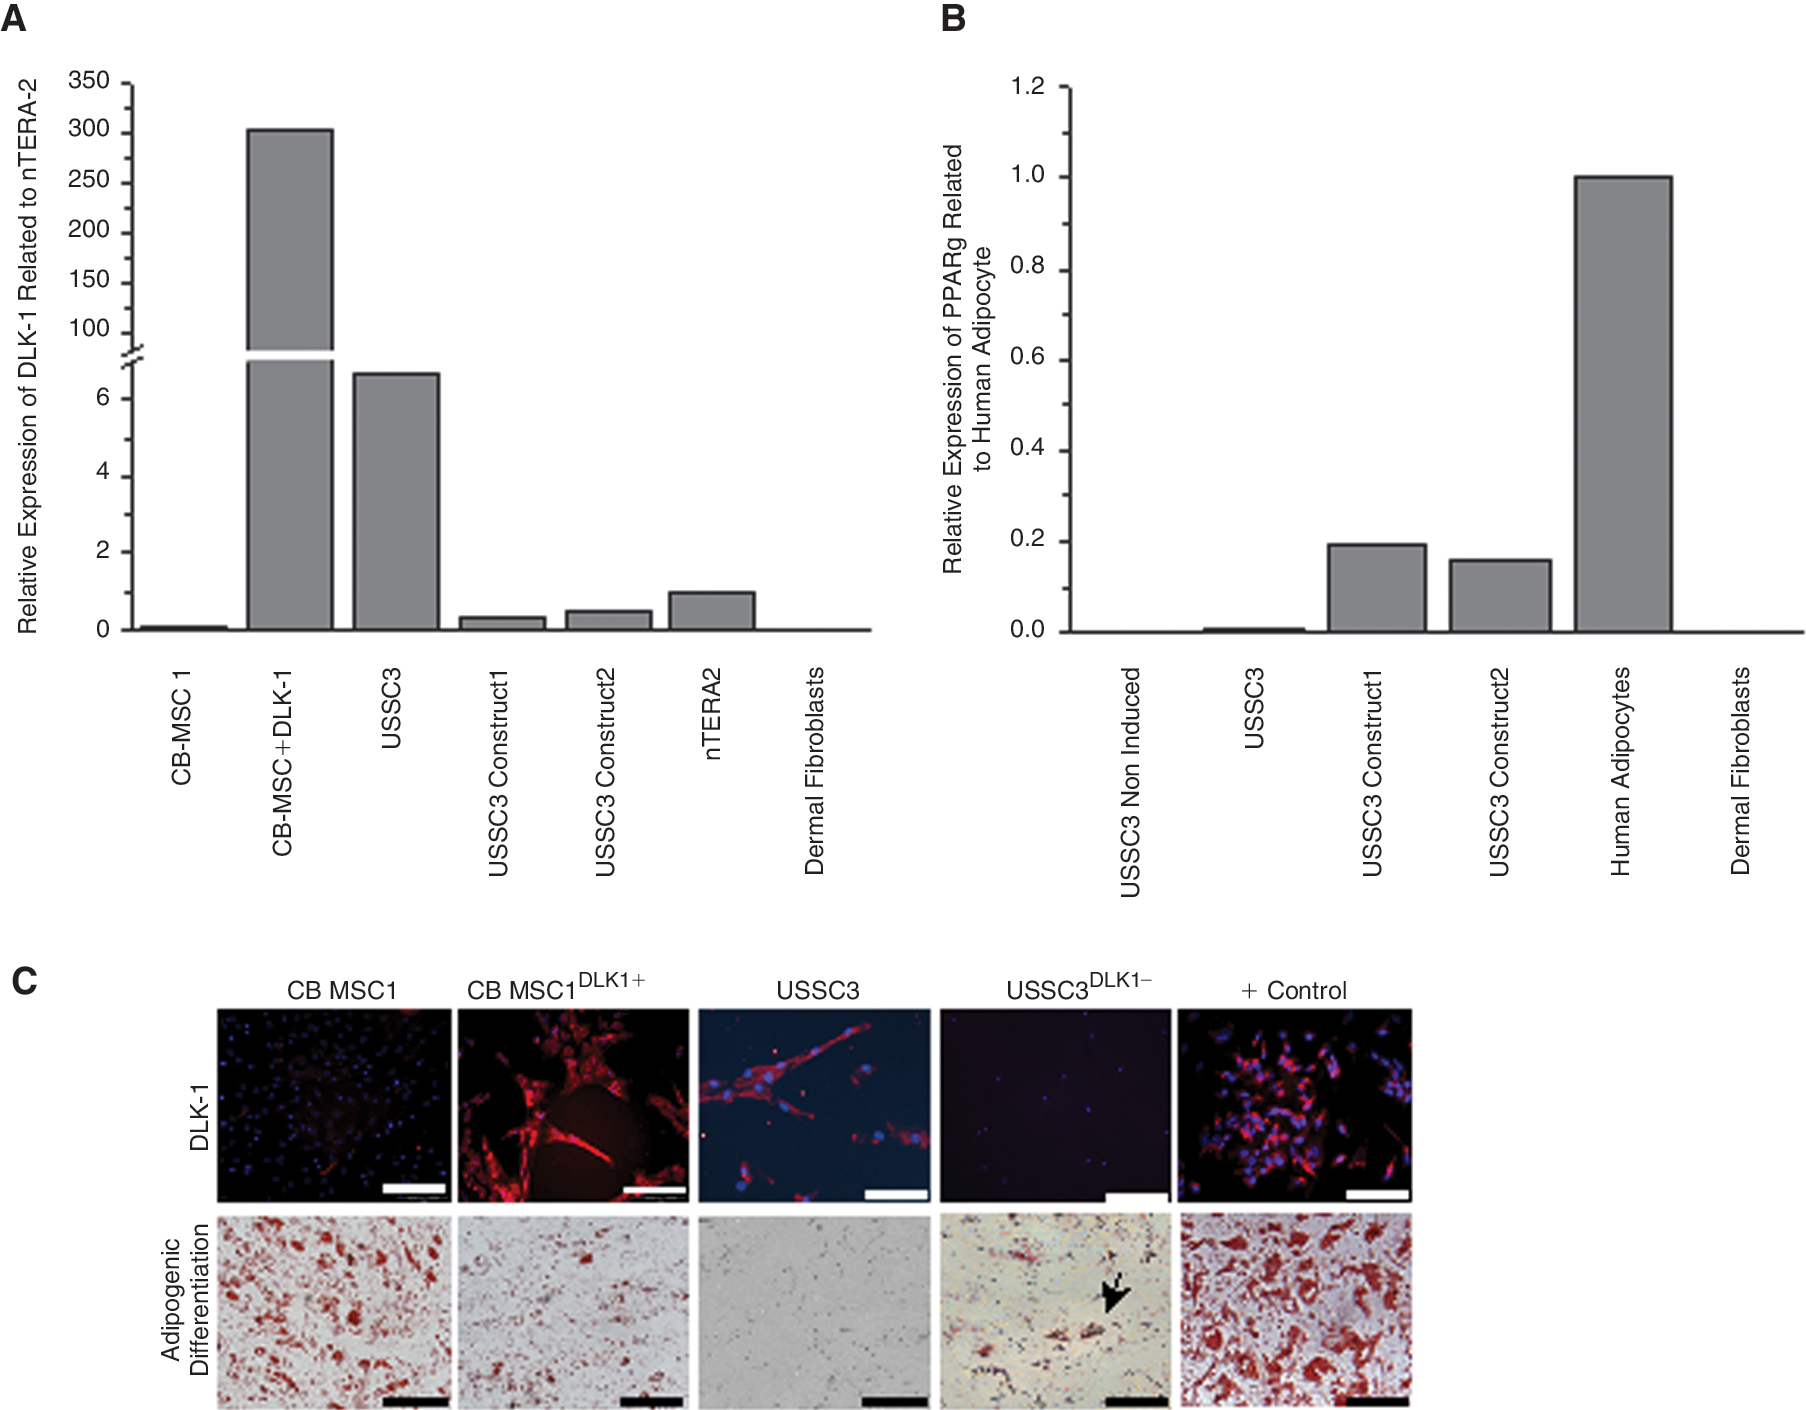
DLK-1 overexpression in non-DLK-1 expressing cord blood mesenchymal stromal cells (CB MSC) and DLK-1 silencing in high expressing unrestricted somatic stem cells (USSC). (
Silencing of DLK-1 in high expressing USSC
DLK-1 expression was repressed in high expressing USSC (USSCDLK-1−) employing a lentiviral plasmid (pLKO.1-puro; SHCLNG-NM_003836, Sigma-Aldrich) for stable transfection. After puromycin selection, cells were expanded and DLK-1 expression was compared with the initial USSC. In real-time PCR, 2 out of 5 plasmids (NM_003836.3-873s1c1: CCGGAGGTCTCACCTGTGTCA AGAACTCGAGTTCTTGACACAGGTGAGACCTT TTTTG; NM_003836.2-1227s1c1: CCGGCCTG GCCGTCAAC ATCATCTTCTCGAGAA GATGATGTTGACGGCCA GGTTTTTG) resulted in a 10-fold decrease of DLK-1 expression compared with the initial cell line (Fig. 4A) and no DLK-1 staining in immunohistochemistry (Fig. 4C), accompanied by a 20-fold up-regulation of PPARγy2 expression after 21 days of adipogenic induction compared with the initial USSC (Fig. 4B) and separate lipid vacuoles stained by Oil Red O (Fig. 4C).
Discussion
In addition to current clinical use, CB is under intense experimental investigation in preclinical models of pathophysiology and it is anticipated that widespread use of CB for nonhematopoietic tissue regeneration will increase. USSC and MSC from CB could have distinct biological advantages compared with their adult BM counterpart. During the last years, MSC from adult BM [34 –37] has drawn attention to therapeutic applications. MSC lines or MSC like lines have been isolated from adult, fetal, and embryonic human and animal tissue; however, the true MSC progenitors had never been exactly defined [38]. Takashima et al. [39] were the first to describe neuroepithelial cells to supply the initial transient wave of multipotent MSC differentiation toward both the neural and the mesodermal lineage. Nevertheless, data from Takashima et al. demonstrated that it is unlikely that MSC established from adult BM are of neural crest origin. It is widely believed that BM MSC are derived from mesoderm [40]. During fetal development, MSC or MSC progenitors play a vital role in tissue remodeling and differentiation. Recently, it was proposed that pericytes are the origin of MSC. As clearly presented in the work by Crisan et al. [41], MSC derived from pericytes exhibit a very strong adipogenic differentiation even on a clonal level. Due to the restricted adipogenic differentiation potential, we do not presume a pericyte but a fetal or fetal liver origin of USSC.
However, inconsistent data on adipogenic differentiation potential of CB-derived cell populations have been published [6,7,42]. Here we demonstrate that USSC and CB MSC can be distinguished by their adipogenic differentiation potential and the inverse correlation with expression of DLK-1. High DLK-1 expressing USSC never exhibited the adipogenic phenotype, or expression of adipogenic genes after adipogenic induction. The inverse correlation of adipogenic differentiation and DLK-1 expression is well known and established in detail [20,21,24,43 –45]. Our findings are based on these data, which showed that high DLK-1 expression prevents adipogenic differentiation in murine 3T3-L1 cells and human MSC.
It has been reported that DLK-1 expression keeps the cells in an undifferentiated status [46 –48] and that DLK-1 is highly expressed during embryonic development [22]. Here we are able to show that DLK-1 expression prevents the formation of lipid vacuoles (Supplementary Fig. 4). Cell lines that expressed high levels of DLK-1 in early passages were not able to differentiate toward the adipogenic lineage, whereas the loss of DLK-1 expression with subsequent passages led to the development of adipocytes. Moreover, DLK-1 expressing USSC are able to differentiate toward neural cells in vitro, whereas MSC behave different [18]. The data demonstrate that DLK-1 plays an essential role in maintaining the undifferentiated/proliferative status of USSC in CB and may have potential to determine the cell fate. Low expression of DLK-1 in BM MSC can be explained by the age of the donors (44 ± 1.5-year-old healthy donors), while preadipocytes lose DLK-1 expression during cultivation with FCS [23].
This function of DLK-1 seems to be consistent with previously reported data in other cellular systems. DLK-1 has an important function in the differentiation of hepatocytes, osteoblasts, neurons, pancreas, and skeletal muscle during human fetal development [22,49,50]. In addition, there is evidence that DLK-1 is a negative regulator of mesodermal differentiation [51]. In extraembryonic tissues, DLK-1 expression could be detected in the visceral endodermal cells surrounding the blood island of the yolk sac and in the stromal cells of the placental villi [22].
USSC and CB MSC could already be isolated in the primary cultures based on DLK-1 expression in primary colonies, as shown in Figure 3A, and followed further by applying real-time PCR. High DLK-1 expression in USSC defined cells with an extensive proliferation and a broader differentiation potential as indicated here (Fig. 1D, 2). USSC could be expanded up to 63 CPD (Fig. 1D) and be differentiated into neural or endodermal cells in vitro (Supplementary Fig. 5) [13,15,52]. The high expression of DLK-1 correlated with an inhibition of adipogenic differentiation. No expression of any adipogenic marker (FABP4, PPARγ, PLIN, and ADIPOQ) could be detected in USSC applying adipogenic culture conditions (Supplementary Fig. 4B). Although the lack of the adipogenic differentiation potential seems to be contradictory to a multipotent cell, it was also shown for embryonic stem cells that no spontaneous adipogenic differentiation could be observed. It was demonstrated that embryonic stem cell-derived adipocytes can be generated only by special protocols applying retinoic acid. In addition, according to the HOX code USSC cluster rather to embryonic stem cells than to fibroblasts [53]. Analyzing the less potent CB MSC, a weak DLK-1 expression and a very strong adipogenic differentiation were observed (Fig. 2A). These CB MSC also revealed slightly shorter telomeres, a higher percentage of senescent cells compared with USSC and revealed a reduced proliferative capacity (Fig. 1E and Supplementary Fig. 1B). When compared with adult BM, the reduced level of cells in CB to generate adipocytes correlates with the biological observation that newborns have adipose tissue only in the toes [54].
Since a hallmark of stem and progenitor cells is their ability to proliferate and give rise to functional progeny on a single cell level, the analysis here was based on both USSC and CB MSC lines including clonal-derived cells. While analyzing clonal populations from CB MSC, as well as clonal populations from USSC, heterogeneous DLK-1 expression profile could be detected (Fig. 3B). Particular single cell clones from DLK-1 expressing USSC cell lines (isolated applying the AVISO CellCelector™) down-regulated DLK-1 expression with increasing age (P6–10, Fig. 3B). Overexpression of DLK-1 applying lentiviral vector pCL7Egwo_DLK-1 in nonexpressing CB MSC changed the cells toward a more undifferentiated status—here a restricted adipogenic differentiation potential compared with the initial cell line was detected (Fig. 4). Silencing of DLK-1 in high expressing USSC resulted in a low adipogenic differentiation potential, indicated by up-regulation of PPARγ expression and separate lipid vacuoles stained by Oil Red O (Fig. 4B and 4C). These data are consistent with previous published data of Wang and Sul who demonstrated that mouse embryonic fibroblast (MEF) cells overexpressing DLK-1 were not able to form adipocytes, while silencing of DLK-1 resulted in an improved adipogenic differentiation potential [55].
Osteogenic differentiation was identical in all the CB-derived lines as shown by Alizarin Red staining (USSC and CB MSC) (Fig. 2A). Microarray analysis showed a down-regulation of DLK-1 (7,276.6-fold higher expression before induction) and SOX9 (26,202.4-fold higher expression before induction) in CB-derived cells after osteogenic induction explaining why, in contrast to previous published data in murine multipotent stem cells (C3H10T1/2) and 3T3-L1 cells [55], no differences in the osteogenic differentiation potential between USSC and CB MSC could be observed. With regard to the endodermal differentiation [52], our data are consistent with the data from Tanimizu et al. [26], who expressed DLK-1 in the fetal hepatocyte primary culture and demonstrated that the time course of expression of hepatic differentiation marker genes was not altered. The fact that DLK-1 is specifically expressed in fetal liver suggests that DLK-1 is implicated in proliferation and/or differentiation of hepatocytes. Another possibility is its involvement in hematopoiesis. Moore et al. [28] described the isolation of DLK-1 expressing fetal murine stroma lines (eg, AFT024) that were able to support hematopoiesis. The authors have demonstrated that not all generated cells from fetal liver expressed DLK-1, and some of them did not exhibit hematopoietic supporting activity.
Several groups demonstrated DLK-1 expression in the embryo, which marks the growing branches of organs that develop through the process of branching morphogenesis [47]. In addition to high proliferating hematopoietic cells, CB MNC can easily form osteoclasts in vitro (unpublished observation by the authors). As reviewed by Gimble et al. [56], preadipocytes, which are not well defined biologically, can create a microenvironment conductive to osteoclast formation and resorptive activity through direct cell contact and release of soluble factors. Since tissue/organs must be designed and remodeled during fetal development, the presence of such cells like USSC or MSC, simultaneously influencing hematopoiesis [28], hepatocytic, and osteogenic can be mandatory to fulfill this function.
DLK-1 is a member of the EGF-like family that is homologous to members of the Notch/Delta/Serrate family, which however lacks the characteristic DSL motif [19,20]. Baladron et al. were the first to describe the negative regulation of Notch1 activation through dlk in murine 3T3-L1 and C3H10T1/2 cells [57]. It is known that Notch1 expression is required for adipogenesis [58] and that Notch ligands inhibit the Notch receptors present on the same cell, as well as activating receptors on adjacent cells [59,60]. Binding of DLK-1 to Notch1 seems to inhibit the capability of cells to differentiate into adipocytes in vitro. Bray et al. were able to describe the functional interaction of Notch1 and DLK-1 despite lacking the DSL motif in Drosophila [61].
Notch2 and DLK-1 seem to be coexpressed in hepatoblasts [62] but no direct interactions of DLK-1 and Notch2–4 have been described so far. Whether the negative effect of DLK-1 expression on adipogenic differentiation of CB-derived cells is Notch-mediated needs to be further defined.
Therefore, we assume that DLK-1 is one of the genes reflecting the undifferentiated status of USSC. Although the different nonhematopoietic CB-derived populations do not differ in the cell surface, the expression profile is different. Data of S. Liedtke of our group document very clearly that USSC and MSC from CB are completely different in their HOX code [53]. CB MSC cluster strongly together with BM MSC, whereas USSC cluster strongly together with human embryonic stem cells. Although we could define 2 out of 36 cell lines that behaved like USSC in P5 (high DLK-1 expression, no adiogenic differentiation) and turned more toward CB MSC in P10 (low DLK-1 expression, formation of adipocytes) (Supplementary Fig. 4), at the moment it is speculative whether there is a hierarchy or precursor daughter relationship between USSC and CB MSC or if they are derived from different origins (for instance, close to fetal liver/fetal bone marrow). These results, together with the different migrating capacity based on c-MET expression between the CB adherent cells [16] and immunological differences to BM MSC [10,11], strongly suggest that there are at least 2 distinct nonhematopoietic populations in CB that can be distinguished by their differentiation capability and by their DLK-1 expression profile.
Footnotes
Acknowledgments
First of all, we would like to thank Prof. P. Bianco (Sapenzia University, Rome) for constructive discussion of the data. Thanks to Aurélie Lefort and Daniela Stapelkamp for their excellent technical support. Thanks to Valentina Bart for histological stainings. Prof. J. Eckel kindly provided human preadipocytes and adipocytes from the Deutsches Diabetes Zentrum, Duesseldorf. This work was supported by the Deutsche Forschungsgemeinschaft (DFG) FOR 717 project Ko2119/6-1, the bilateral project Ko2119/8-1, and the German José Carreras Leukemia Foundation grant DJCLS-R07/05v to Prof. Kögler and by grants from the BMBF network for Inherited Bone Marrow Failure Syndromes and the DFG SPP1230 (HH) to Prof. Hanenberg.
Author Disclosure Statement
The authors do not have any commercial associations to disclose.
References
Supplementary Material
Please find the following supplemental material available below.
For Open Access articles published under a Creative Commons License, all supplemental material carries the same license as the article it is associated with.
For non-Open Access articles published, all supplemental material carries a non-exclusive license, and permission requests for re-use of supplemental material or any part of supplemental material shall be sent directly to the copyright owner as specified in the copyright notice associated with the article.