
Abstract
The transplantation of mesenchymal stem cells (MSCs) proves to be useful to treat pathologies in which tissue damage is linked to oxidative stress (OS). The aim of our work was to evaluate whether primary human MSCs (hMSCs) can manage OS. For this, in vitro we assessed the following parameters: (1) cell viability of hMSCs exposed to increasing concentrations of reactive oxygen species (ROS; source: hydrogen peroxide), reactive nitrogen species (RNS; source: S-nitroso-N-acetylpenicillamine), or both (ROS and RNS; source: 3-morpholinosydnonimine hydrochloride); (2) intracellular level of reactive species in hMSCs exposed to ROS and RNS; (3) basal gene expression and activity of superoxide dismutases, catalase, and glutathione peroxidase of hMSCs; (4) basal level of total glutathione (GSx) of hMSCs; and (5) cell viability of GSx-depleted hMSCs exposed to ROS and/or RNS. Results showed that hMSCs have a high resistance to OS-induced death, which correlates with low levels of intracellular reactive species, constitutive expression of enzymes required to manage OS, and high levels of GSx. When hMSCs were depleted of GSx they lose their capacity to manage OS. Thus, in vitro hMSCs were able to scavenge ROS and RNS and efficiently manage OS. If this potential is maintained in vivo, hMSCs could also contribute to tissue regeneration, limiting OS-induced tissue damage.
Introduction
S
hMSCs are resistant to ex vivo culture and ionizing radiation, which are the 2 conditions that generate a strong oxidative stress (OS) [18,19]. In view of these observations, together with the fact that hMSCs prove to be useful in the treatment of pathologies in which tissue damage is linked to OS, we hypothesize that hMSCs efficiently manage OS. To test our hypothesis we performed in vitro studies to determine the following parameters: (1) hMSC susceptibility to OS-induced death; (2) the correlation of this susceptibility to intracellular levels of reactive species; (3) hMSC gene expression and activity of enzymes involved in the elimination of reactive species such as cytosolic superoxide dismutase (SOD1), mitochondrial superoxide dismutase (SOD2), catalase (CAT), and glutathione peroxidase 1 (GPX1); (4) hMSC basal level of [total glutathione (GSx)]; and (5) hMSC susceptibility to OS-induced death when they were GSx depleted. Data for hMSCs were compared with results obtained for clonal pancreatic beta-cell line (INS-1) cells, an OS-sensitive cell model, and for human skin fibroblasts (hFibs), an OS-resistant cell model [20].
Materials and Methods
Isolation, culture, and characterization of hMSCs
hMSCs were isolated from heparinized bone marrow samples that were discarded because they were unused for allogeneic transplantation procedures. Cells were cultured in minimum essential medium alpha (α-MEM) (Sigma, St. Louis, MO) supplemented with 10% (v/v) fetal bovine serum (FBS; Hyclone, Logan, UT) and 40 mg/mL gentamicin (Calbiochem, San Diego, CA) and maintained at 37°C in a humidified atmosphere containing 5% (v/v) CO2 [2]. One week later, when the monolayer of adherent cells reached almost confluence, the cells were trypsinized, washed, and subcultured at a density of 7,000 cells/cm2. Adherent cells were characterized according to their immunophenotype and their differentiation potential to adipogenic, chondrogenic, and osteogenic lineages [2,3]. In the latter case, the cells were cultured in the presence of differentiation stimuli and then examined for the presence of lipid droplets, proteoglycan secretion, and matrix mineralization, respectively.
Isolation and culture of hFibs
To establish hFib cultures, leftover materials obtained from skin biopsies of normal individuals were utilized. Skin pieces were seeded in plastic culture dishes and covered with α-MEM supplemented with 10% (v/v) FBS, 40 mg/mL gentamicin, and 0.2 mg/mL amphotericin B (Gibco, Grand Island, NY) and maintained at 37°C in a humid atmosphere containing 5% (v/v) CO2. Twice a week, nonadherent skin pieces were eliminated and half of the culture medium was renewed. The adherent skin pieces were discarded when cells were confluent around them. hFibs thus obtained were trypsinized, washed, and subcultured at a density of 7,000 cells/cm2.
Culture of INS-1 cells
Cells referred as INS-1 correspond to INS-1 clone 832/13 cells. They were cultivated in RPMI-1640, 10% (v/v) FBS, 10 mM HEPES, 1 mM pyruvate, 50 μM beta-mercaptoethanol, 100 U/mL penicillin, and 100 mg/mL streptomycin, as previously described [21].
Cytotoxicity assay
Twenty-four hours before the assay, hMSCs and hFibs were seeded at 25,000 cells/cm2 and INS-1 cells at a 60,000 cells/cm2. Then, culture medium was supplemented with hydrogen peroxide (H2O2) (Sigma), S-nitroso-N-acetylpenicillamine (SNAP; Sigma), or 3-morpholinosydnonimine hydrochloride (SIN-1; Sigma). Eighteen hours later, nonadherent cells were discarded and adherent cells were stained with 0.2% (w/v) crystal violet dissolved in 10% (v/v) methanol. After four washes, cell-incorporated dye was solubilized by 5 min incubation in 50% (v/v) methanol and 50% (v/v) 0.1 M NaH2PO4 (pH 4.5). Aliquots of 150 μL were transferred to a 96-plate well and the absorbance at 570 nm (A 570) was measured in a microplate reader (Sunrise; Tecan, Salzburg, Austria). Viability corresponded to the ratio between A 570 in the presence of reactive species source and A 570 in the absence of it, multiplied by 100. Lethal concentration 50 (LC50) was calculated by lineal regression analysis of reactive species source concentration versus viability plots [22].
Assessment of intracellular reactive species level
hMSCs and hFibs were seeded at 25,000 cells/cm2 and INS-1 cells at 60,000 cells/cm2. One day later, the cells were incubated with 0.75 mM SIN-1 for 1 h. Then, the cells were washed with phosphate-buffered saline (PBS) and incubated with 5 μM dihydrorhodamine 123 (DHR; Calbiochem) for 1 h. Samples were examined in a CyAn ADP flow cytometer (488 and 633 nm) (Dako, Carpinteria, CA) and data were analyzed with Summit 4.3 software (Dako). Net fluorescence intensity (NFI) was calculated as the quotient between the mean fluorescence intensity of the cells stained with DHR and its autofluorescence (without DHR). The level of intracellular reactive species in cells submitted to OS was expressed as the ratio between the NFI of the sample (exposed to SIN-1) and the NFI of the control (unexposed).
Real-time reverse transcription–polymerase chain reaction for SOD1, SOD2, CAT, and GPX1
Total RNA of hMSCs and hFibs was extracted using TRIzol reagent (Invitrogen, Carlsbad, CA), following the manufacturer's instructions. Remnant genomic DNA was degraded using DNAse I (Invitrogen). RNA was quantified spectrophotometrically at 260 nm. For reverse transcription (RT) reaction, 1 μg of total RNA, 200 U M-MLV reverse transcriptase (Promega, Madison, WI), and 300 pmol oligo(dT) primer in 25 μL of total reaction mixture were used. The reaction was conducted following the manufacturer's instructions of the enzyme. Real-time polymerase chain reaction (PCR) was performed using 2 μL RT reaction, 0.5 μM each of the specific primers (Table 1), and LightCycler-DNA Master SYBR Green I kit (Roche, Indianapolis, IN) in a LightCycler instrument (Roche). The amplicons were characterized according to their melting temperature in the LightCycler instrument and to their size by agarose gel electrophoresis and by staining with ethidium bromide. The gene expression level of each enzyme was standardized against GAPDH and compared among cells by the comparative Ct method [26].
Temperature (T
m) adjusted to salt concentration of the LightCycler-DNA Master SYBR Green I kit (200 mM K+, 200 mM Na+, and 3 mM Mg+2) using BioMath-T
m calculations in Oligos software (
Enzymatic activity assay for SOD, CAT, and GPX1
hMSCs and hFibs were seeded at 7,000 cells/cm2 and INS-1 cells at 35,000 cells/cm2. When the cells reached 80%–90% confluence they were collected using a rubber policeman and intracellular proteins were released by 3 freeze/thaw cycles (liquid nitrogen/thermoregulated bath at 37°C). Total protein concentration was determined using the BCA1 kit (Sigma), following the manufacturer's instructions.
For SOD activity quantification, 1 mL of SOD lysis buffer (20 mM HEPES, 1 mM ethylene glycol tetraacetic acid (EGTA), 210 mM mannitol, 70 mM sucrose, and 0.1% (v/v) Triton X-100; pH 7.2) was used to extract proteins from 1 million cells. SOD activity was measured using the Superoxide Dismutase Assay II kit (Calbiochem). This spectrophotometric method allows the quantification of SOD activity in a range of 0.025–0.250 U/mL (1 U is defined as the amount of enzyme necessary to dismutate 50% of superoxide species).
For CAT activity quantification, 1 mL of CAT lysis buffer [50 mM potassium, 1 mM ethylenediaminetetraacetic acid (EDTA), and 0.1% (v/v) Triton X-100; pH 7.0] was used to extract proteins from 1 million cells. CAT activity was measured using the Catalase Assay kit (Calbiochem). This spectrophotometric method allows the quantification of CAT activity in a range of 0.25–4.00 nmol/(min mL) (formaldehyde produced).
For GPX1 activity quantification, 1 mL of GPX1 lysis buffer (50 mM Tris-HCl, 5 mM EDTA, and 1 mM DTT; pH 7.5) was used to extract proteins from 1 million cells. GPX1 activity was measured using the Glutathione Peroxides' Assay kit (Calbiochem). This spectrophotometric method allows the quantification of GPX1 activity in a range of 50–344 nmol/(min mL) (nicotinamide adenine dinucleotide phosphate [NADPH] oxidized).
Enzymatic activity data were standardized against total protein amount and expressed as U/mg for SOD and as nmol/(min mg) for CAT and GPX1.
Quantification of GSx
It has been reported that culture media supplements, particularly beta-mercaptoethanol, modified the intracellular levels of glutathione [27]. For this reason, when the basal levels of GSx was assessed all tested cells were cultivated in α-MEM supplemented with 10% (v/v) FBS and 40 mg/mL gentamicin. hMSCs and hFibs were seeded at 25,000 cells/cm2 and INS-1 cells at 60,000 cells/cm2. Twenty-four hours later, the cells were collected by trypsinization and washed 2 times with PBS. The cells were lysed with 50 μL of 0.4% (v/v) Triton X-100 and 3 freeze/thaw cycles (liquid nitrogen/thermoregulated bath at 37°C). Immediately, 50 μL of ice-cold 5% (w/v) sulfosalicylic acid (Sigma) was added and the mix was incubated for 15 min on ice. The cell lysate was centrifuged at 10,000g for 2 min at 4°C. The supernatant was stored at −80°C until GSx quantification. For this, we used the protocol described by Tietze [28] and adjusted for microplates [29]. Briefly, to each well plate, 10 μL cell lysate was mixed with 150 μL of 100 mM phosphate buffer (pH 7.4) containing 3.9 mM EDTA, 15 μg 5-5′-dithiobis (2-nitrobenzoic acid) (DTNB) (Sigma), and 24 mU glutathione reductase (Sigma). Then, 50 μL of phosphate buffer containing 8 μg NADPH (Sigma) was added. The formation of 2-nitro-5-thiobenzoic acid (TNB) was detected spectrophotometrically at 405 nm every 12 s for 2 min, using a plate reader instrument (Tecan). The concentration of GSx was calculated through interpolation in the calibration curve plotted with data from using different concentrations of reduced glutathione (Sigma) prepared in phosphate buffer with 0.2% (v/v) Triton X-100 and 2.5% (w/v) sulfosalicylic acid. Results were standardized to 1 million cells and data were expressed as nmol GSx/million cells.
GSx depletion
hMSCs were seeded at 25,000 cells/cm2. After 24 h, 150 μM butyrate sulfoximine (BSO; Sigma) and 1 mM diethilmaleate (DEM; Sigma) were added to the culture medium. One hour later, cytotoxic assays were performed.
Statistical analysis
Results were expressed as mean ± standard error of the mean. Differences between 2 groups were analyzed by Student's t-test and the differences between >2 groups were analyzed by one-way analysis of variance and Newman–Keuls multiple comparison as a posttest, using GraphPad Prism 5.0 software. We calculated 95% confidence intervals and statistical significance was proved at P < 0.05.
Results
High resistance of hMSCs to OS-induced death
hMSCs were cultured for 18 h with increasing concentrations of reactive oxygen species (ROS; source: H2O2), reactive nitrogen species (RNS; source: SNAP), or both (source: SIN-1). Then, hMSC survival (viability) was evaluated by staining of adherent cells with crystal violet. Figure 1 shows raw data of a cytotoxicity assay and LC50 interpolation in the reactive species source concentration versus viability plot. As seen in Table 2, LC50 values determined for hMSCs were significantly higher than that determined for INS-1 cells, the OS-sensitive cell model. There were no statistical differences when comparing LC50 values obtained for hMSCs versus those obtained for hFibs, the OS-resistant cell model, showing that hMSCs are highly resistant to OS-induced death.
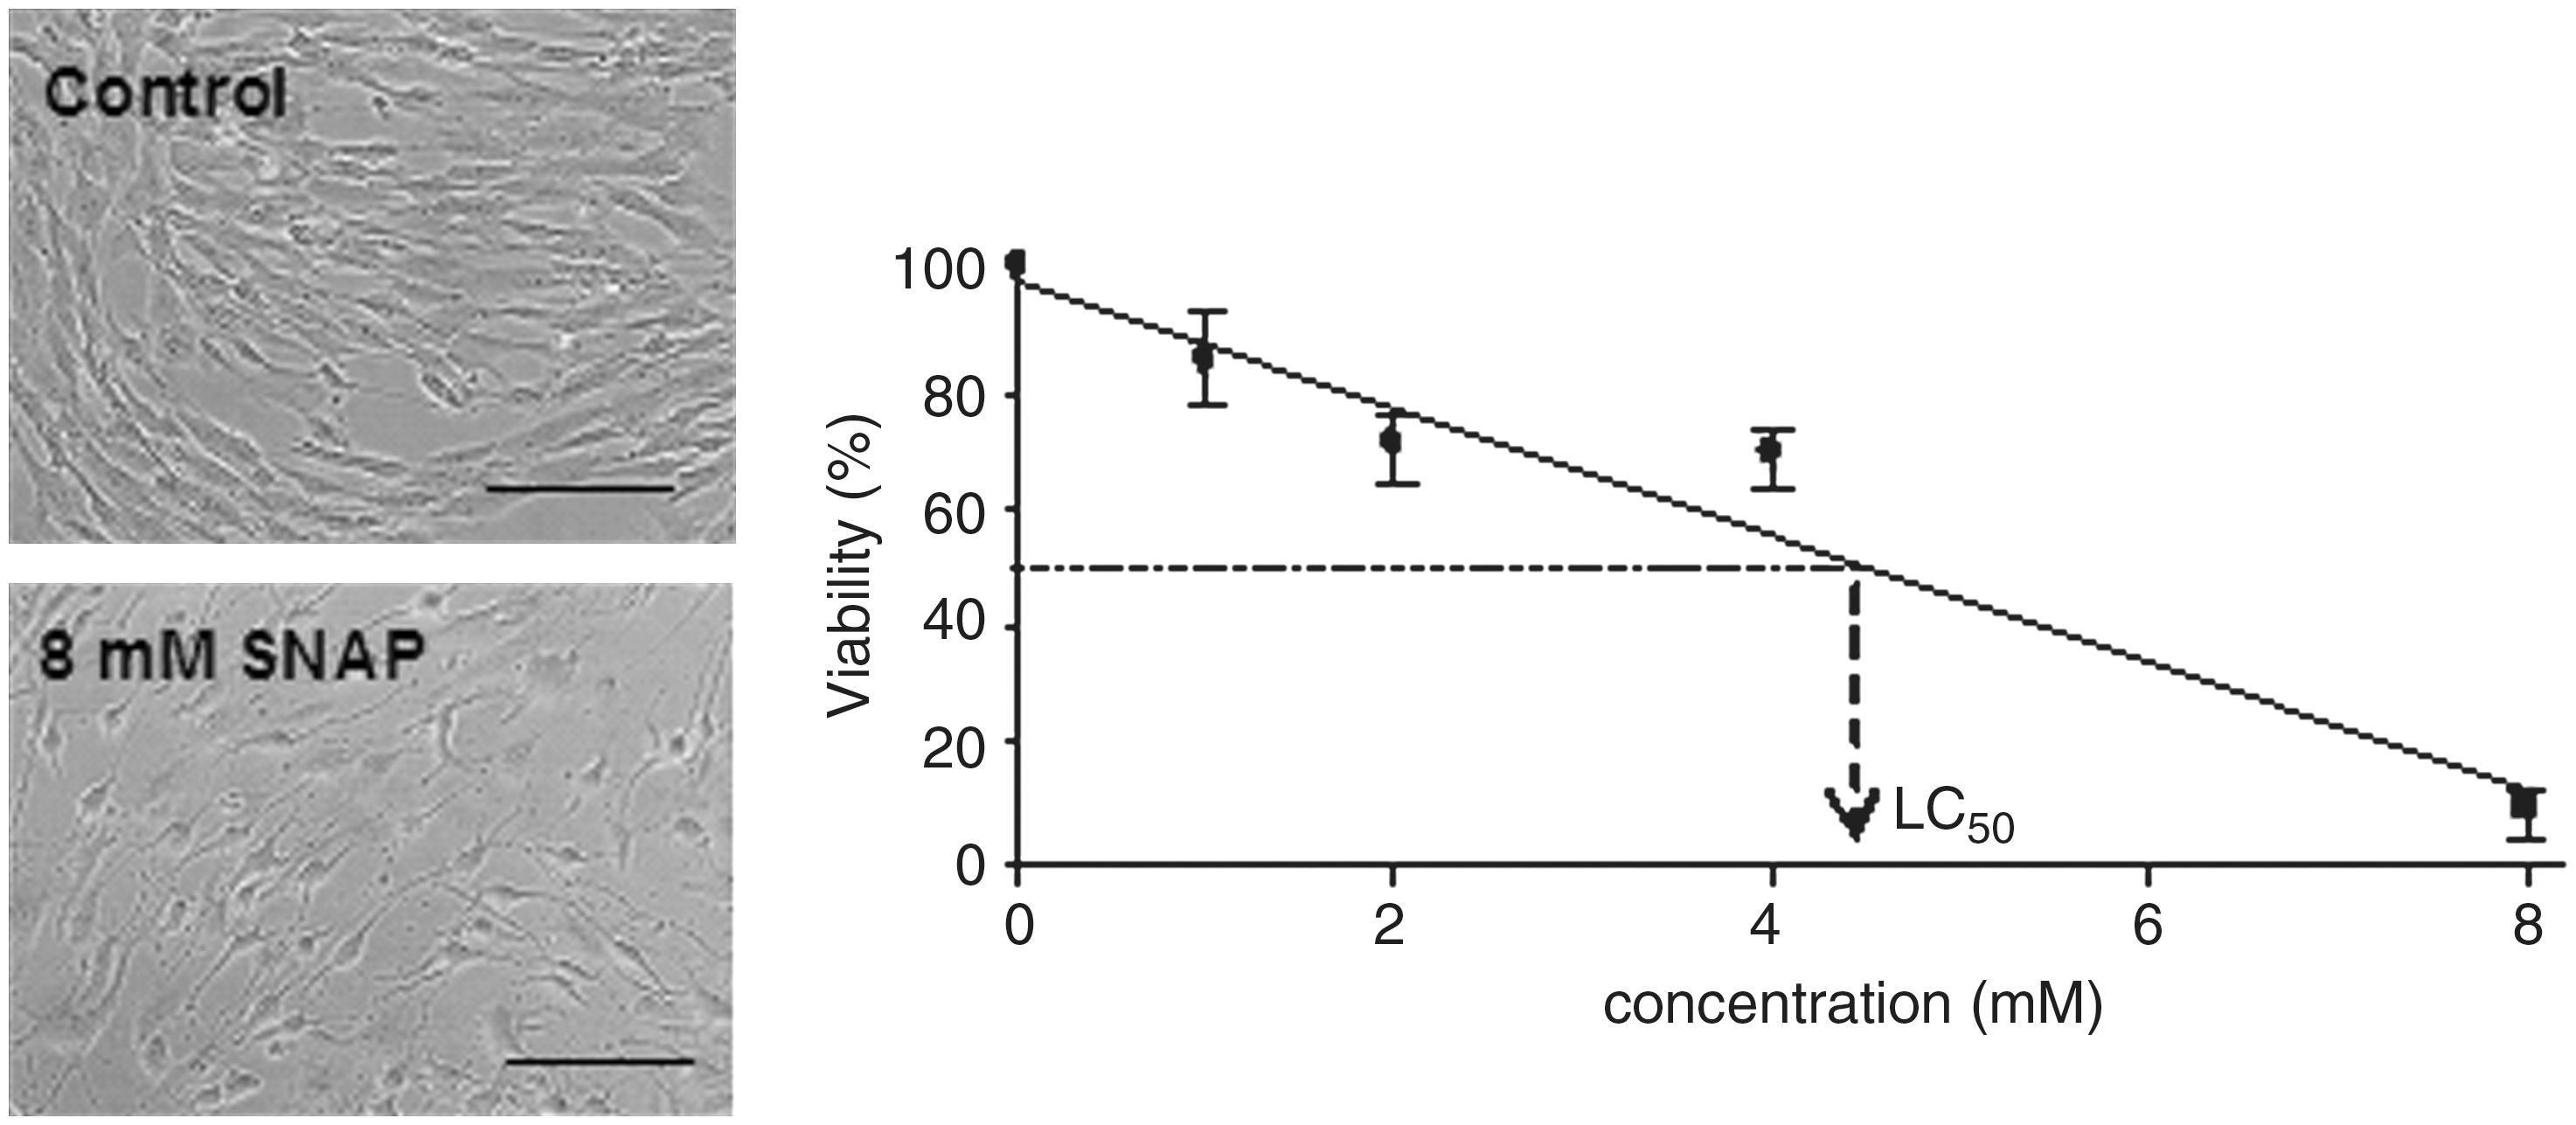
Raw data of cytotoxicity assay and LC50 interpolation. Clonal pancreatic beta-cell line (INS-1) cells, human mesenchymal stem cells, and human skin fibroblasts were cultured in the presence or absence of different concentrations of reactive oxygen species and/or reactive nitrogen species sources. Eighteen hours later, adherent cells were stained with crystal violet and the percentage of cells that survived (viability) in each condition was determined. Data were plotted and lineal regression analysis was performed. LC50 value corresponds to the concentration at which viability is 50%. SNAP, S-nitroso-N-acetylpenicillamine. Scale bars = 200 μm.
Numbers in parentheses indicate the number of samples analyzed. Data correspond to mean ± standard error.
Statistical analysis versus INS-1 cells: a P < 0.05, b P < 0.0005.
hFibs, human skin fibroblasts; hMSCs, human mesenchymal stem cells; H2O2, hydrogen peroxide; LC50, concentration at which 50% of the cells survived; SIN-1, 3-morpholinosydnonimine hydrochloride; SNAP, S-nitroso-N-acetylpenicillamine. INS-1, clonal pancreatic beta-cell line.
Low intracellular levels of reactive species in hMSCs exposed to OS
To determine the levels of intracellular reactive species in hMSCs exposed to OS, cells were incubated for 1 h in α-MEM + 10% (v/v) FBS supplemented or not with 0.75 mM SIN-1. The levels of intracellular reactive species were determined by flow cytometry after staining with DHR. The DHR is a cell-permeable fluorogenic probe that diffuses within the cell, where it reacts with peroxide and peroxynitrite generating rhodamine. In turn, as this is a water-soluble compound, it is trapped in the cells. Thus, after staining, the fluorescence emitted by each cell is directly proportional to the amount of intracellular reactive species. As shown in Fig. 2, hMSCs exposed to ROS and RNS presented intracellular levels of reactive species significantly lower than those of INS-1 cells (P < 0.0015) and similar to those of hFibs (no statistical significance). Therefore, hMSCs efficiently scavenge reactive species.

Low intracellular levels of reactive species in hMSCs exposed to oxidative stress. INS-1 cells, hMSCs, and hFibs were incubated with or without 0.75 mM SIN-1 for 1 h. Levels of intracellular peroxide and peroxynitrite were assessed by flow cytometry after staining with dihydrorhodamine 123. Data shown correspond to the ratio between NFI of cells exposed to SIN-1 and NFI of cells unexposed. Numbers in parentheses indicate the number of samples analyzed. hFibs, human skin fibroblasts; hMSCs, human mesenchymal stem cells; NFI, net fluorescence intensity; ns, no statistical significance; SIN-1, 3-morpholinosydnonimine hydrochloride. INS-1, clonal pancreatic beta-cell line.
Gene expression and enzymatic activity of SOD1, SOD2, CAT, and GPX1 in hMSCs
Expression of the genes coding for enzymes involved in the elimination of reactive species (SOD1, SOD2, CAT, and GPX1) was assessed by real-time RT-PCR. For all tested genes, a single peak at the predictable theoretical values was obtained when amplicon melting point analyses were performed (Fig. 3 and Table 1). Also, a single band of the expected size was observed when PCR products were gel electrophoresed (data not shown). Hence, hMSCs express SOD1, SOD2, CAT, and GPX1 constitutively. Further, quantitative analysis showed that hMSCs express SOD1, SOD2, CAT, and GPX1 at similar levels to those expressed in hFibs (no statistical significance; Table 3). Accordingly, the activities of SOD, CAT, and GPX1 were similar between hMSCs and hFibs (no statistical significance; Fig. 4). However, the enzymes of hMSCs presented a basal activity significantly higher than that of INS-1 cells (in the limit of statistical significance for SOD; P < 0.005 for CAT and GPX1; Fig. 4).
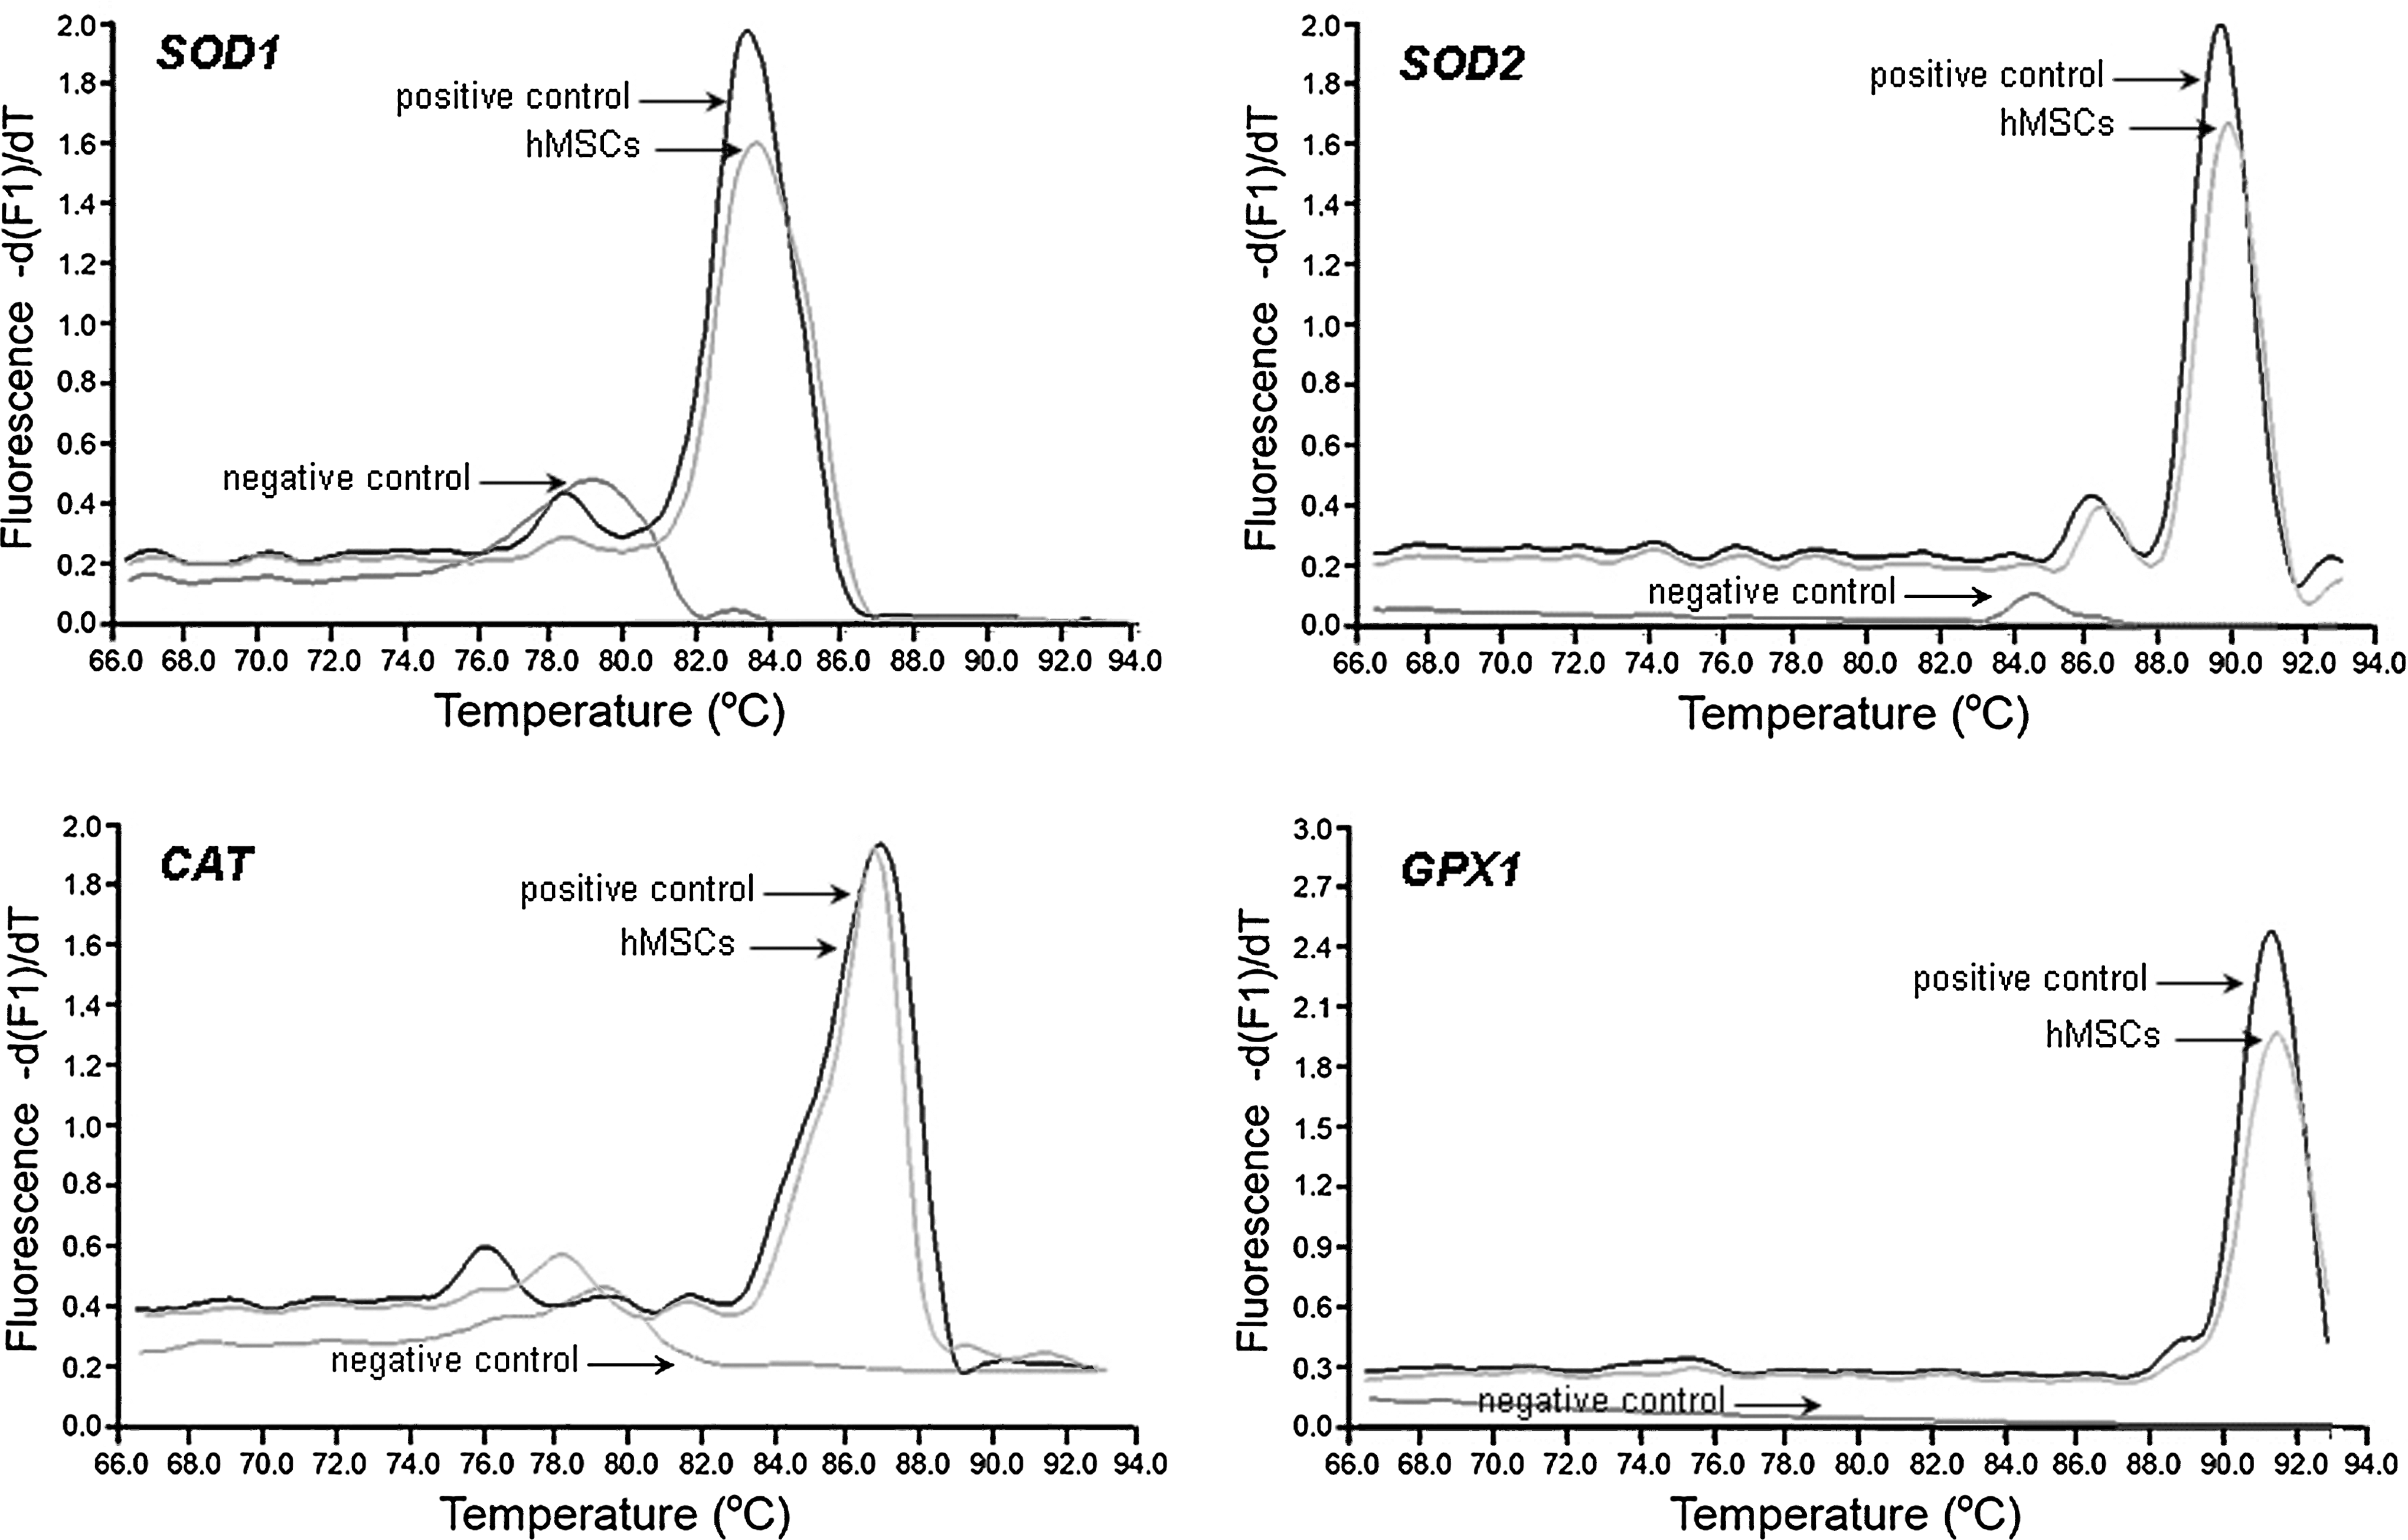
Gene expression of SOD1, SOD2, CAT, and GPX1 in hMSCs. Total RNA isolated from hMSCs was amplified with specific primers for referred genes. Real-time polymerase chain reaction products were analyzed according to their melting point. Positive control: RNA isolated from HeLa cells; negative control: reaction without template. Data are representative of 3 different samples. hMSCs, human mesenchymal stem cells.

Enzymatic activity of SOD, CAT, and GPX1 in hMSCs. INS-1 cells, hMSCs, and hFibs were collected and the enzymatic activity of SOD
Relative gene expression: Ct gene of interest/Ct GAPDH. Numbers in parentheses indicate the number of samples analyzed. Data correspond to mean ± standard error. Statistical analysis versus hFibs: no statistical significance.
hFibs, human skin fibroblasts; hMSCs, human mesenchymal stem cells.
High levels of GSx in hMSCs
As seen in Fig. 5, the basal level of GSx was significantly higher in hMSCs than in INS-1 cells (P < 0.05). On the other hand, both hMSCs and hFibs presented the same basal levels of GSx (no statistical significance).

High levels of GSx in hMSCs. INS-1 cells, hMSCs, and hFibs were collected and intracellular GSx was assessed by the method described by Tietze [28] and adjusted for microplates [29]. Numbers in parentheses indicate the number of samples analyzed. GSx, total glutathione; hFibs, human skin fibroblasts; hMSCs, human mesenchymal stem cells; ns, no statistical significance.
Data obtained for INS-1 cells, an OS-sensitive cell model, and hFibs, an OS-resistant cell model, suggest a correlation between the presence and extent of the cellular mechanisms required to scavenge reactive species and the cell susceptibility to OS-induced death. Thus, the high resistance of hMSCs to OS-induced death could be considered as a functional proof of their substantial antioxidant defense potential.
High resistance of hMSCs to OS-induced death depends on GSx availability
As expected, the exposure of hMSCs to BSO and DEM resulted in a significant decrease of the intracellular level of GSx (>80%). Observed depletion lasted for 11 h after withdrawal of BSO and DEM. As seen in Fig. 6, GSx-depleted hMSCs showed LC50 values for H2O2, SNAP, and SIN-1 significantly lower than that of hMSCs (P < 0.05) and similar to that of INS-1 cells (no statistical significance). Hence, GSx-depleted hMSCs completely lose their ability to highly resist OS-induced death, becoming as sensible as INS-1 cells.
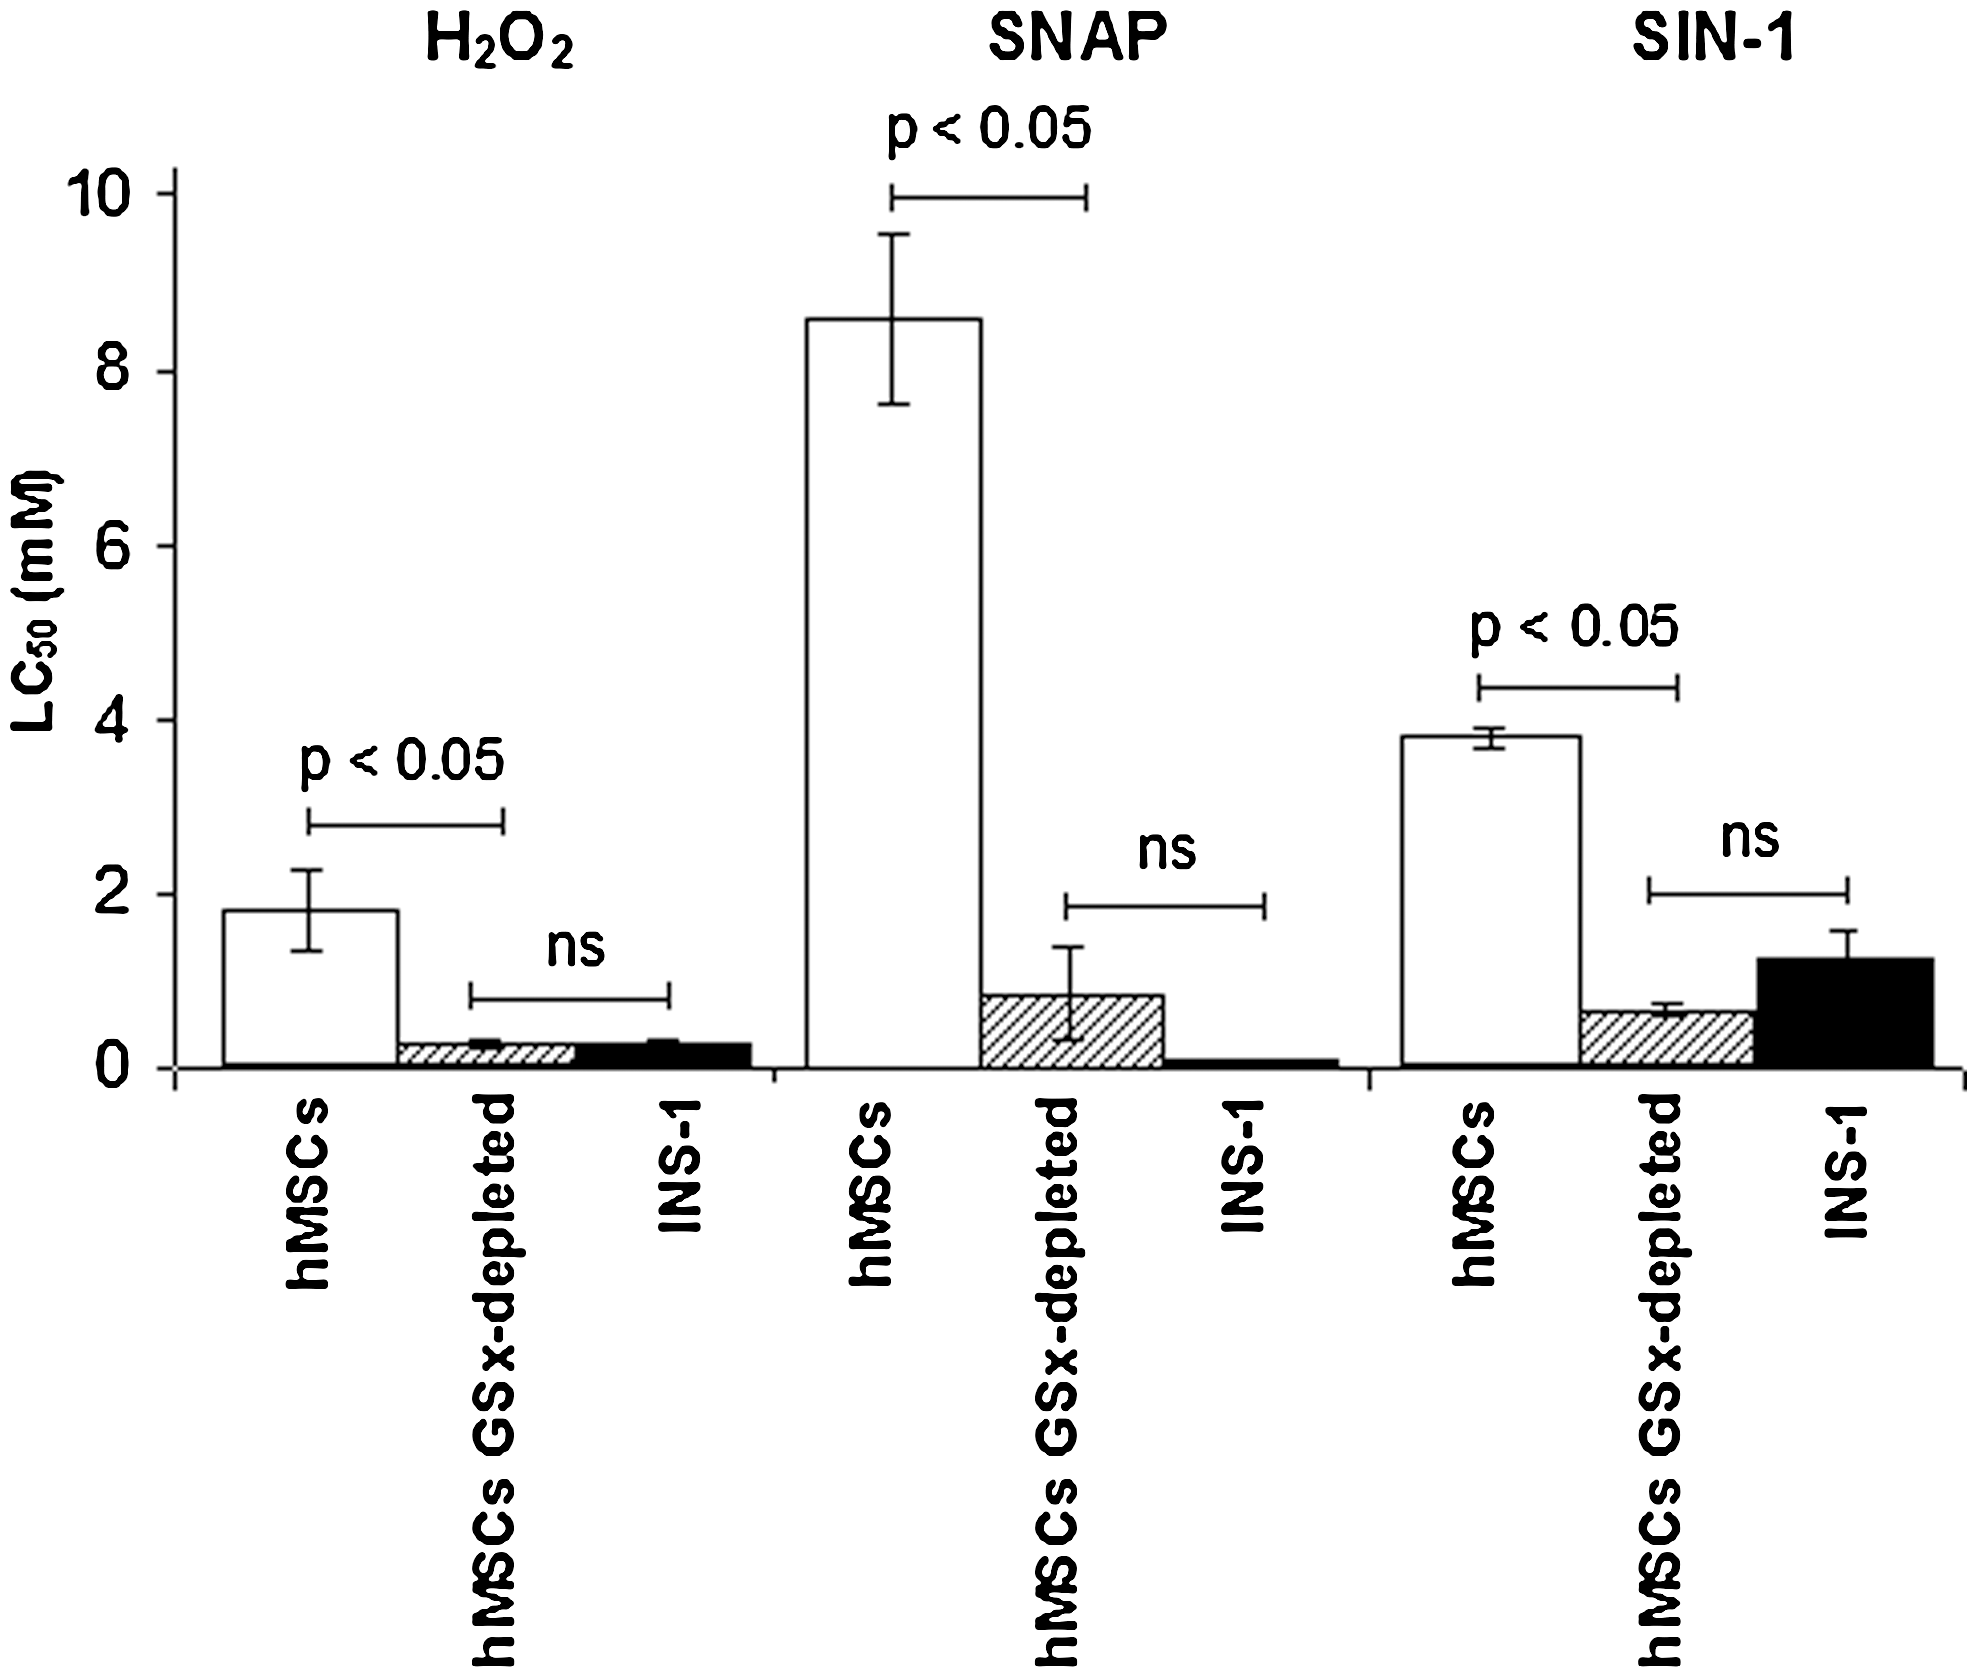
High resistance of hMSCs to oxidative stress-induced death depends on GSx availability. Cytotoxicity assays were performed with hMSCs (n = 7) and INS-1 cells (n = 3) cultured in standard conditions and with hMSCs exposed to butyrate sulfoximine and diethilmaleate (GSx-depleted hMSCs, n = 3). Exposure of hMSCs to these inhibitors resulted in >80% depletion of GSx that lasted for up to 11 h. GSx, total glutathione; hMSCs, human mesenchymal stem cells; H2O2, hydrogen peroxide; LC50, lethal concentration at which viability is 50%; ns, no statistical significance; SNAP, S-nitroso-N-acetylpenicillamine; SIN-1, 3-morpholinosydnonimine hydrochloride. INS-1, clonal pancreatic beta-cell line.
Discussion
hMSC transplantation has been proved as a therapeutic strategy in individuals with OS-related diseases such as acute myocardial infarction [13], cerebral ischemia [14], and diabetes [15,16]. However, there is only scarce information related to the potential of hMSCs to manage OS. In the present work, we show that hMSCs are highly resistant to OS-induced death (Table 1). This low susceptibility to the harmful effect of reactive species correlates with the ability of hMSCs to effectively scavenge peroxide and peroxynitrite (Fig. 2). In turn, the latter associates with the constitutive expression and activity of SOD1, SOD2, CAT, and GPX1 enzymes (Figs. 3 and 4) and depends on the high level of intracellular GSx (Figs. 5 and 6) detected in hMSCs. Further, we found that hMSCs expressed constitutively and at a high level the methionine sulfoxide reductase A (data not shown), an enzyme crucial for the repair of oxidized proteins and for the recovery of methionine residues that act as scavengers of oxidants [30]. Also, it has been reported that hMSCs express the enzymes required for DNA repair [31]. Hence, hMSCs possess the main enzymatic and nonenzymatic mechanisms to detoxify reactive species and to correct oxidative damage of proteome and genome, guaranteeing an efficient management of OS. Our biochemical results were not without precedent because it has been published that rat MSCs, the immortalized cell line hMSC-telomerase reverse transcriptase (TERT), and human bone marrow stromal cells cultured in the presence of ascorbate express active SOD1, SOD2, CAT, GPXs, and thioredoxin reductases [32,33]. However, up to our knowledge, there were no evidences for the high resistance of hMSCs to OS-induced death or for the main role played by GSx on it.
Appropriate intracellular levels of ROS play a key role in regulating the self-renew and differentiation potential of HSCs [34]. However, when they become excessive, oxidative damage accumulates and results in senescence, apoptosis, and/or transformation of the cells. Here we show that the maintenance of the redox status of hMSCs is ensured by a machinery that is complex and abundant. Therefore, an accurate management of OS seems to be a critical feature for all stem cells—a fact that takes more relevance when considering that in vivo stem cells have a long lifespan and are exposed to OS for long periods of time.
Using rat MSCs and hMSC-TERT, Stolzing and Scutt [32] and Ebert et al. [33] concluded that in “routine” cell culture, MSCs have low antioxidant capacity. This conclusion is based on the observation that modifications (selenium supplementation or temperature reduction, respectively) of the culture conditions used by these authors increased the activity of cells' antioxidant system. As no comparison was performed against other cell types, a more appropriate conclusion should be that the basal antioxidant capacity of MSCs can be upregulated—a question that we have not tested, except for the depletion of GSx, in our primary low-passaged hMSCs isolated and expanded in α-MEM supplemented with FBS and at 37°C.
The dependence of OS resistance to high levels of intracellular GSx is explained because reduced glutathione plays a critical role in cellular defense against OS and nitrosative stress [35]. It is a substrate not only for GPX1 but also for other enzymes related to the management of OS. Together, it is able to directly scavenge reactive species. This dependence is not exclusive for hMSCs, because it has been shown that human T-cell lymphocytes with high GSx levels readily eliminate ROS and are less susceptible to apoptosis [36].
A niche is a spatial microenvironment that allows tissue cells to function and also protects them. The redox status of the niche determines the intracellular levels of reactive species in parenchymal cells [34]. Stromal cells may scavenge extrinsic oxidative insults, for example, inflammation. Hence, the therapeutic effects observed after the transplantation of MSCs into individuals with OS-related diseases might be attributed, among other mechanisms, to their potential to effectively scavenge exogenous ROS and RNS, once homed into the niche of damaged tissues. This hypothesis is supported by data shown here and also by the observation that mice with experimental diseases that received MSCs showed a discrete but statistically significant lower ratio of reduced glutathione to oxidized glutathione [37] and a lower increase of disease-induced oxidative markers [38]. Further studies are needed to establish a causative relationship between the potential of hMSCs to efficiently scavenge reactive species and their contribution to tissue regeneration. Meanwhile, the correlation observed between OS management and therapeutic effects has, at least, 3 main implications when thinking on hMSCs as a tool for cell therapy: (1) the concern that prolonged ex vivo expansion might impair the antioxidant defense ability of hMSCs; (2) the broadening of the putative therapeutic use of hMSCs. Now, they might be envisioned as a tool for cell therapy strategies aimed to treat patients with diseases in which onset and progression is associated with OS, such as diabetes, cancer, Parkinson's, Huntington, and Alzheimer diseases [35]; and (3) the fact that hMSC pleiotropy is an outstanding feature because a single tool might limit tissue damage and promote its regeneration.
Footnotes
Acknowledgments
The authors thank Dr. Lisa Poppe (University Medical Center of Duke) for providing the INS-1 clone 832/13 cells and Dr. Mafalda Maldonado (Universidad de Concepcion, Chile) for sharing the protocols to measure intracellular glutathione. The authors also thank Mrs. Patricia Luz for real-time RT-PCR standardization and Mrs. Valeska Simon (Clinica Alemana-Universidad del Desarrollo, Chile) for helping with flow cytometry analysis. The authors are very grateful to Dr. Yedy Israel (Universidad de Chile, Chile) and to Mrs. Michel Sparman (Oregon National Primate Research Center) for English editing of this article. This work was supported by a grant from the Universidad del Desarrollo (grant no. 4020203, to A.V.-P.) and by CONICYT fellowship (24071089, to A.V.-P.). A.V.-P. was recipient of a Ph.D. studentship from CONICYT.
Author Disclosure Statement
No competing financial interests exist.