
Abstract
Emerging data suggest that mesenchymal stem cells (MSCs) are part of a periendothelial niche, suggesting the existence of heterotypic cell–cell crosstalk between endothelial cells and MSCs that regulate MSCs in their local microenvironment. We determined the effects of paracrine factors secreted by human umbilical vein endothelial cells (HUVECs) on MSC survival, proliferation, and differentiation by using an optimized, serum-free HUVEC-conditioned medium (CM). HUVEC-CM induced a significant increase in the size and number of colony-forming units–fibroblast (CFU-F) and CFU-osteoblast (CFU-O) and stimulated the proliferation of MSCs as determined by 5-bromo-2′-deoxyuridine incorporation, compared with non-CM. We also demonstrated that CM significantly enhanced the osteogenic differentiation of MSCs as shown by alkaline phosphatase enzyme histochemistry and von Kossa staining of mineralized nodules as well as by quantitative reverse transcriptase–polymerase chain reaction analysis of osteogenic markers. In contrast, there was no effect on the adipogenic differentiation of MSCs. Bioinformatic integration of HUVEC and MSC gene expression datasets identified several candidate signaling pathways responsible for mediating these effects, including fibroblast growth factor, Wnt, bone morphogenetic protein, and Notch. These data suggest strongly that endothelial cells secrete a soluble factor (or factors) that stimulates progenitor cell activity and, selectively, the osteogenic differentiation of MSCs that could contribute to niche exit.
Introduction
B
The stem cell niche concept was first proposed by Schofield in 1978 [28] as a specialized local microenvironment that protects the stem cells from differentiation and apoptotic stimuli or uncontrolled proliferation. Although the hematopoietic [29 –33], epithelial [34,35], and neural [36,37] stem cell niches have been identified to some extent, the factors that regulate MSCs in their microenvironment remain uncharacterized. A number of studies have suggested a widespread perivascular niche for MSCs [38,39]. In support of this, it has been argued that MSCs are in coordinate contact with blood vessels (both pericytes and endothelial cells, which contribute to blood vessel structure) [40], supported by the fact that the dramatic decrease in MSC titers with age mirrors the decrease in vascular density [41,42]. The stem cell niche integrates all the elements surrounding the stem cells, including the interactions between neighboring cells, extracellular matrix components, and soluble molecules [43,44]. The role of secretory factors in the MSC niche is still poorly understood, and identifying the signaling molecules that regulate MSCs in their local microenvironment is a critical step in successfully describing the MSC niche. Further, characterization of the niche and factors that regulate niche exit will be important for the efficient use of MSCs for a broad range of therapeutic applications.
Given the emerging recognition of MSCs as part of a perivascular niche [38,45,46], we hypothesized that the regulation of MSC activity within their niche can occur via a crosstalk with endothelial cells and that this communication was mediated through secreted factors. Using an optimized, serum-free medium for conditioning, our results show that endothelial cells produce a soluble factor (or factors) that significantly influence MSC colony-forming ability, proliferation, and differentiation. Our data demonstrate that a component(s) of the endothelial cell secretome is able to exert a profound regulatory effect on MSCs and we have identified several candidate signaling factors; however, the precise combination of mechanisms and factors responsible for these activities are still to be fully defined.
Materials and Methods
Isolation and culture of primary human MSCs
Tissue culture plasticware were purchased from Corning and all tissue culture media and supplements were obtained from Invitrogen unless otherwise stated. Primary human MSCs were isolated from the femoral heads of patients undergoing hip replacement operations following informed consent (Harrogate District Hospital), as described previously [47]. The mononuclear cells were isolated with a density gradient (Ficoll-Paque; Amersham Biosciences) and maintained in Dulbecco's modified Eagle's medium (DMEM) containing 100 U/mL penicillin, 100 μg/mL streptomycin, and 15% batch-tested fetal bovine serum (FBS) in 75-cm2 flasks at 37°C in 5% CO2 and 95% air atmosphere. After 4–5 days of culture, the nonadherent cells were discarded and the medium was refreshed twice a week. On reaching 90% confluence, the cells were subcultured using 0.05% trypsin–0.02% EDTA at a 1:3 ratio. MSCs were used up to passage 6 for all studies.
Clonal MSC culture
To establish a clonal population of MSCs, single-cell suspension of MSCs prepared as described earlier were plated onto 100-mm tissue culture-treated Petri dishes at a clonal density of 10 cells/cm2. After settling overnight, the cultures were washed with MSC growth medium to remove any nonadherent cells. After 14–16 days in culture as described earlier, discrete colonies were identified by microscopy and labeled on the bottom of the dish. To exclude the possibility of combining 2 merging colonies, only colonies that were of an average size (very large colonies were assumed to be caused by aggregates of cells) and well isolated from other colonies were used. After 2 washes with 1 × phosphate-buffered saline (PBS), sterile cloning cylinders (1/4 inches × 5/16 inches; Sigma-Aldrich) were attached to the dish to encircle single colonies with sterile Dow Corning® high-vacuum grease, and cells were trypsinized and replated to individual wells of 6-well culture plates. On reaching confluence, the subcultured cells were transferred to 25-cm2 flasks followed by 75-cm2 flasks.
Human umbilical vein endothelial cell culture and collection of conditioned media
Human umbilical vein endothelial cells (HUVECs) purchased from PromoCell were grown to subconfluence in endothelial cell growth medium (PromoCell) supplemented with the provided supplement mix, 100 U/mL penicillin, 100 μg/mL streptomycin, and 10% FBS in a humidified atmosphere (5% CO2, 37°C), with the media replaced twice a week. HUVECs were subcultured at a seeding density of 5,000 cells/cm2 and cells between passages 3 and 6 were used for all experiments. We trialed several different conditioning media, with the aim of avoiding serum, maintaining basal conditions close to those used for routine MSC growth, and still supporting endothelial cell survival. We found the optimal conditions to produce HUVEC-conditioned medium (CM) required HUVECs grown to confluence on 75-cm2 flasks coated with 0.1% gelatin (Fisher Scientific). HUVECs were rinsed gently and re-fed with serum-free DMEM containing 1% ITS premix (insulin, transferrin, and selenium; BD Biosciences) and ascorbic acid phosphate (50 μg/mL; Sigma). This serum-free medium proved suitable for HUVEC survival compared with others tested. Following 24 h incubation, HUVEC-CM was collected and centrifuged for 10 min at 2,000 rpm before being sterile filtered using a 0.2-μm filter. The CM was then used freshly or stored at −20°C until use. Control nonconditioned medium (NCM) was processed under identical conditions on cell-free, gelatin-coated flasks.
Bromodeoxyuridine proliferation assay
MSC proliferation was assessed by measuring the incorporation of 5-bromo-2′-deoxyuridine (BrdU), a thymidine analog, into the newly synthesized DNA of replicating cells by immunofluorescent staining. MSCs were seeded at 4 × 10³ cells/cm2 in basal medium on sterilized coverslips (13 mm diameter) in 24-well dishes and left overnight. Cells were then treated for 48 h with HUVEC-CM and NCM containing 2% FBS, and each condition was performed in triplicate. The same experiment was performed using a clonal population of MSCs. BrdU (Sigma-Aldrich) was added to the medium for the last 24 h to give a final concentration of 50 nM. After washing in PBS, the cells were fixed with 4% paraformaldehyde and then incubated for 5 min in bovine serum albumin antibody buffer [0.1% Triton X-100 (Sigma-Aldrich), 0.02% sodium dodecyl sulfate (Ambion), 10 mg/mL bovine serum albumin in PBS (Sigma-Aldrich)]. After a PBS wash, the cells were incubated overnight at 37°C with a mouse monoclonal anti-BrdU antibody (Amersham Biosciences), followed by an FITC-conjugated anti-mouse IgG (1/200; Sigma-Aldrich) for 2 h at 37°C. The nuclei were then stained with DAPI (1/5,000 of 5 mg/mL; Molecular Probes). The samples were washed 3 times for 10 min in PBS and mounted onto glass slides in Vectashield mounting medium (Vector Laboratories). The BrdU-positive cells were visualized and counted using a Leica DMLA microscope (Leica UK Ltd.). Three experiments using MSCs and clonal lines from 3 different donors were carried out.
MTT assay
The MTT assay was used to determine viable cell numbers [48]. The principle of the assay is that MTT, a tetrazolium aqueous substrate, is taken up by viable cells in which it gets converted into an insoluble formazan product that can be quantified spectrophotometrically at 570 nm absorbance. The absorbance is directly proportional to the number of viable cells. MSCs seeded in 96-well plates at 4,000 cells/cm2 were treated with HUVEC-CM and NCM containing 2% FBS for 0, 24, 48, and 72 h. Briefly, the medium was replaced with 100 μL fresh medium, 25 μL of 3-(4,5-dimethylthiazol-2-yl)-2,5-diphenyltetrazolium bromide (Sigma-Aldrich) at a concentration of 5 mg/mL was added to each well, and the plates were incubated at 37°C for 3 h. Then, 100 μL lysis buffer (0.04 M acidic isopropanol) was added to the wells and incubated for a further 30 min before absorbances were read at 570 nm using a Dynex MRX II plate reader (Dynex Technologies Worthing).
Colony-forming unit–fibroblast and colony-forming unit–osteoblast assays
For colony-forming unit–fibroblast (CFU-F) assay, MSCs were suspended in HUVEC-CM and NCM containing 20% FBS (Hyclone) and seeded at 10 cells/cm2 in triplicate into 60-mm-diameter tissue culture-treated Petri dishes (Iwaki) and incubated for 2 weeks. For direct visualization of colonies, the cells were washed with PBS, fixed in 95% ethanol for 5 min, and then incubated for 30 min at room temperature in 0.5% crystal violet in 95% ethanol. Excess stain was removed by washing with H2O. The Petri dishes were then left to dry and images of the colonies were taken on a light box using identical exposure settings. The images were analyzed to determine colony size and number using Leica QWin image analysis software. CFU-F assay was also performed in the presence of 10%, 50%, and 100% HUVEC-CM. To determine the colony-forming unit–osteoblast (CFU-O) potential of MSCs in response to HUVEC-CM and NCM, cells were suspended in basal media containing 10 nM dexamethasone (Sigma), 5 mM sodium-β-glycerophosphate (Sigma), and 50 μg/mL ascorbic acid-2-phosphate (Sigma) and plated as described above. After 14–16 days in culture days, CFU-O cultures were terminated and stained for alkaline phosphatase, followed by staining with 1% silver nitrate (von Kossa stain) for mineralization (see below). A light microscope (DMIRB; Leica Microsystems) was used to visualize the alkaline phosphatase–positive cultures and mineralized nodule areas. In an attempt to identify the factors in the CM affecting the colony number and area, CFU-F assays were performed as above in the presence of small-molecule inhibitors wortmannin (50 nM; Calbiochem), AZD6244 (40 nM; ChemieTek), and DKK-1 (100 ng/mL; R&D Systems) to inhibit phosphatidylinositol 3 kinase, mitogen-activated protein kinase, and Wnt signaling pathways, respectively.
Microarray data
To identify candidate signaling pathways between HUVECs and MSCs, publicly available raw microarray data of both MSCs and HUVECs from the Gene Expression Omnibus (GEO) database at the National Center for Biotechnology Information (NCBI) were loaded [49]. Using Affymetrix HGU133 Plus 2 arrays, genes encoding HUVEC-secreted proteins and those encoding MSC surface proteins were identified based on gene ontology terms. Potential interactions were then extracted using the latest BioGRID (The Biological General Repository for Interaction Datasets) database of curated protein–protein interactions [50].
Differentiation assays
Osteogenic differentiation was induced by culturing confluent MSCs in HUVEC-CM or NCM supplemented with 100 U/mL penicillin, 100 μg/mL streptomycin, 15% FBS, 5 mM β-glycerophosphate (Sigma-Aldrich), 50 μg/mL ascorbic acid phosphate (Sigma-Aldrich), and 10 nM dexamethasone (Sigma-Aldrich) for 21 days, before being stained for alkaline phosphatase activity and mineralization using the von Kossa staining.
To induce adipogenic differentiation, confluent MSCs were cultured in HUVEC-CM or NCM supplemented with 100 U/mL penicillin, 100 μg/mL streptomycin, 15% FBS, 1 μM dexamethasone, 500 μM isobutylmethylxanthine (Sigma-Aldrich), 100 μM indomethacin (Sigma-Aldrich), and 1 μg/mL insulin (Sigma-aldrich). Cells were cultured for up to 21 days before identifying adipocytes by oil red O staining.
Histochemical staining
Alkaline phosphatase is an enzyme expressed by osteoblasts, activity of which can be determined using the following staining protocol. To stain for alkaline phosphatase, the culture medium was removed, and the cells were washed in PBS and incubated for 2 min in 1 mg/mL Fast red TR (Sigma-Aldrich) and 0.2 mg/mL napthol AS-MX phosphate (Sigma-Aldrich), dissolved in 1% N,N-dimethylformamide (Sigma-Aldrich) diluted in 0.1 M Tris buffer at pH 9.2. The cells were then fixed in 4% paraformaldehyde for 5 min, and sites of mineralization were identified using the von Kossa staining. Briefly, the cells were incubated in 1% silver nitrate (Fisher Scientific) on a light box at room temperature for 10–60 min. The cells were then incubated for 5 min in 2.5% Na2S2O3 and washed 3 times with dH2O, and then images were taken.
For oil red O adipocytic staining, cells were fixed in 60% isopropanol for 5 min before incubating in 0.3% oil red O (Sigma-Aldrich) solution in 60% isopropanol for 30 min. After 3 washes in dH2O, the cells were mounted in glycerol/gelatine solution before imaging.
Quantitative reverse transcriptase–polymerase chain reaction
To determine the relative expression levels of the osteogenic markers alkaline phosphatase, bone morphogenetic protein (BMP)-2, osteonectin, and osteopontin, MSC cultures were established in the presence of HUVEC-CM or NCM with addition of osteogenic supplements, and the samples were analyzed by quantitative reverse transcriptase–polymerase chain reaction (qRT-PCR) after 3, 7, 10, 14, 18, and 21 days of differentiation. MSCs were cultured in 25-cm2 flasks containing basal medium until confluence before the medium was changed to osteogenic HUVEC-CM or NCM. Total RNA was extracted from CM- and NCM-treated cells at each time point using Trizol (Invitrogen) according to the manufacturer's protocol. Genomic DNA was then removed from all samples using the DNA-free DNase digestion kit (Ambion) according to the manufacturer's instructions. cDNA was synthesized from 1 μg total RNA using Superscript II reverse transcriptase (Invitrogen), followed by RNA digestion with RNase H (Invitrogen). To control for genomic DNA contamination, parallel cDNA synthesis reactions were carried out in the absence of reverse transcriptase (no-RT controls). The resulting cDNA concentrations were quantified using a Nanodrop ND-1000 spectophotometer and their purity was confirmed by PCR for glyceraldehyde-3-phosphate dehydrogenase (GAPDH). No products were amplified using no-RT control samples. Quantitative real-time PCR was carried out using the ABI Prism 7000 sequence detection system (Applied Biosystems) with SYBR green (Applied Biosystems). All samples were run in triplicate in 96-well plates, with each well containing 5 μL cDNA diluted 1 in 5 in a total reaction volume of 25 μL. Reactions were carried out at 95°C for 10 min, followed by 40 cycles of 95°C for 15 s and 50°C for 1 min. Primers for the osteogenic markers and the housekeeping gene ribosomal protein subunit 27A (RPS27A) were designed using PrimerExpress software from Applied Biosciences. Primer sequences used were as follows: alkaline phosphatase—forward 5′-GGGAACGAGGTCACCTCCAT-3′ and reverse 5′-TGGTCACAATGCCCACAGAT-3′; BMP-2—forward 5′-CATGATGGAAAAGGGCATCCT-3′ and reverse 5′-AGGCGTTTCCGCTGTTTG-3′; osteonectin—forward 5′-CCTGGATCTTCTTTCTCCTTTGC-3′ and reverse 5′-TCAGGCAGGGCTTCTTGCT-3′; osteopontin—forward 5′-ACCTGAACGCGCCTTCTG-3′ and reverse 5′-CATCCAGCTGACTCGTTTCATAA-3′; RPS27A—forward 5′-TGGATGAGAATGGCAAAATTAGTC-3′ and reverse 5′-CACCCCAGCACCACATTCA-3′. Relative expression levels of each gene were analyzed using 7000 System SDS software (Applied Biosciences) with the 2−ΔΔCt method [51]. Briefly, the Ct value for each target gene was normalized to the Ct value of the housekeeping gene at each time point (ΔCt), which was then normalized to the ΔCt of the calibrator (the untreated day 0) to give ΔΔCt. The relative expression level was then calculated using ΔΔCt to determine 2−ΔΔ for each sample. The data are shown as mean 2−ΔΔCt ± standard error. The experiment was repeated using MSCs from 3 different donors. The results from one representative donor are shown.
Statistical analysis
Data are presented as means ± standard error. All experiments were independently repeated 3 times using different donors and all measurements were done at least in triplicates. All data were analyzed for normality by the Kolmogorov–Smirnov test and equality of variances by the Levene test. Data from the BrdU incorporation assay and qRT-PCR were analyzed using the independent samples t-test assuming unequal variances, whereas MTT assay and colony-forming assay data were analyzed using the independent samples t-test assuming equal variances. Differences with a P value of <0.05 were accepted as statistically significant.
Results
Effect of HUVEC-CM on CFU-F and CFU-O activity
To determine the capacity of HUVEC-CM to support progenitors capable of developing into fibroblastic or osteogenic colonies, human MSCs were seeded at their optimal seeding density (10 cells/cm2) onto tissue culture Petri dishes in the presence of HUVEC-CM and NCM under CFU-F and CFU-O assay conditions. After 2 weeks in culture, CFU-F (crystal violet–positive colonies) development was assayed (Fig. 1A). Enumeration of the CFU-F colony number from each treatment revealed a significant increase (P < 0.001) when MSCs were treated with HUVEC-CM compared with the NCM control (Fig. 1A, D). Mean colony size was also significantly enhanced by >4-fold when cells were treated with HUVEC-CM compared with NCM (P < 0.01; Fig. 1A, E). We further investigated the dose-responsiveness of the observed effects of HUVEC-CM on CFU-F formation in human MSCs. We found that the colony number in the presence of HUVEC-CM was significantly and dose-dependently higher than that of NCM (P < 0.01 with 50% CM; P < 0.001 with 100% CM; Fig. 1F). To determine the osteoprogenitor potential of BM-derived MSCs in response to HUVEC-CM exposure, MSCs were seeded under CFU-O assay conditions. After 12 days, CFU-O cultures were stained for alkaline phosphatase and for sites of mineralization using von Kossa staining to identify the osteogenic colonies. Only cells treated with osteogenic HUVEC-CM were positive for alkaline phosphatase and von Kossa (Fig. 1B, C). Colonies were then stained with crystal violet to facilitate determination of colony number and colony size. A 2-fold increase in CFU-O numbers was observed under HUVEC-CM relative to NCM, and the size of the osteogenic colonies in HUVEC-CM was significantly higher than controls (P < 0.01; Fig. 1E).
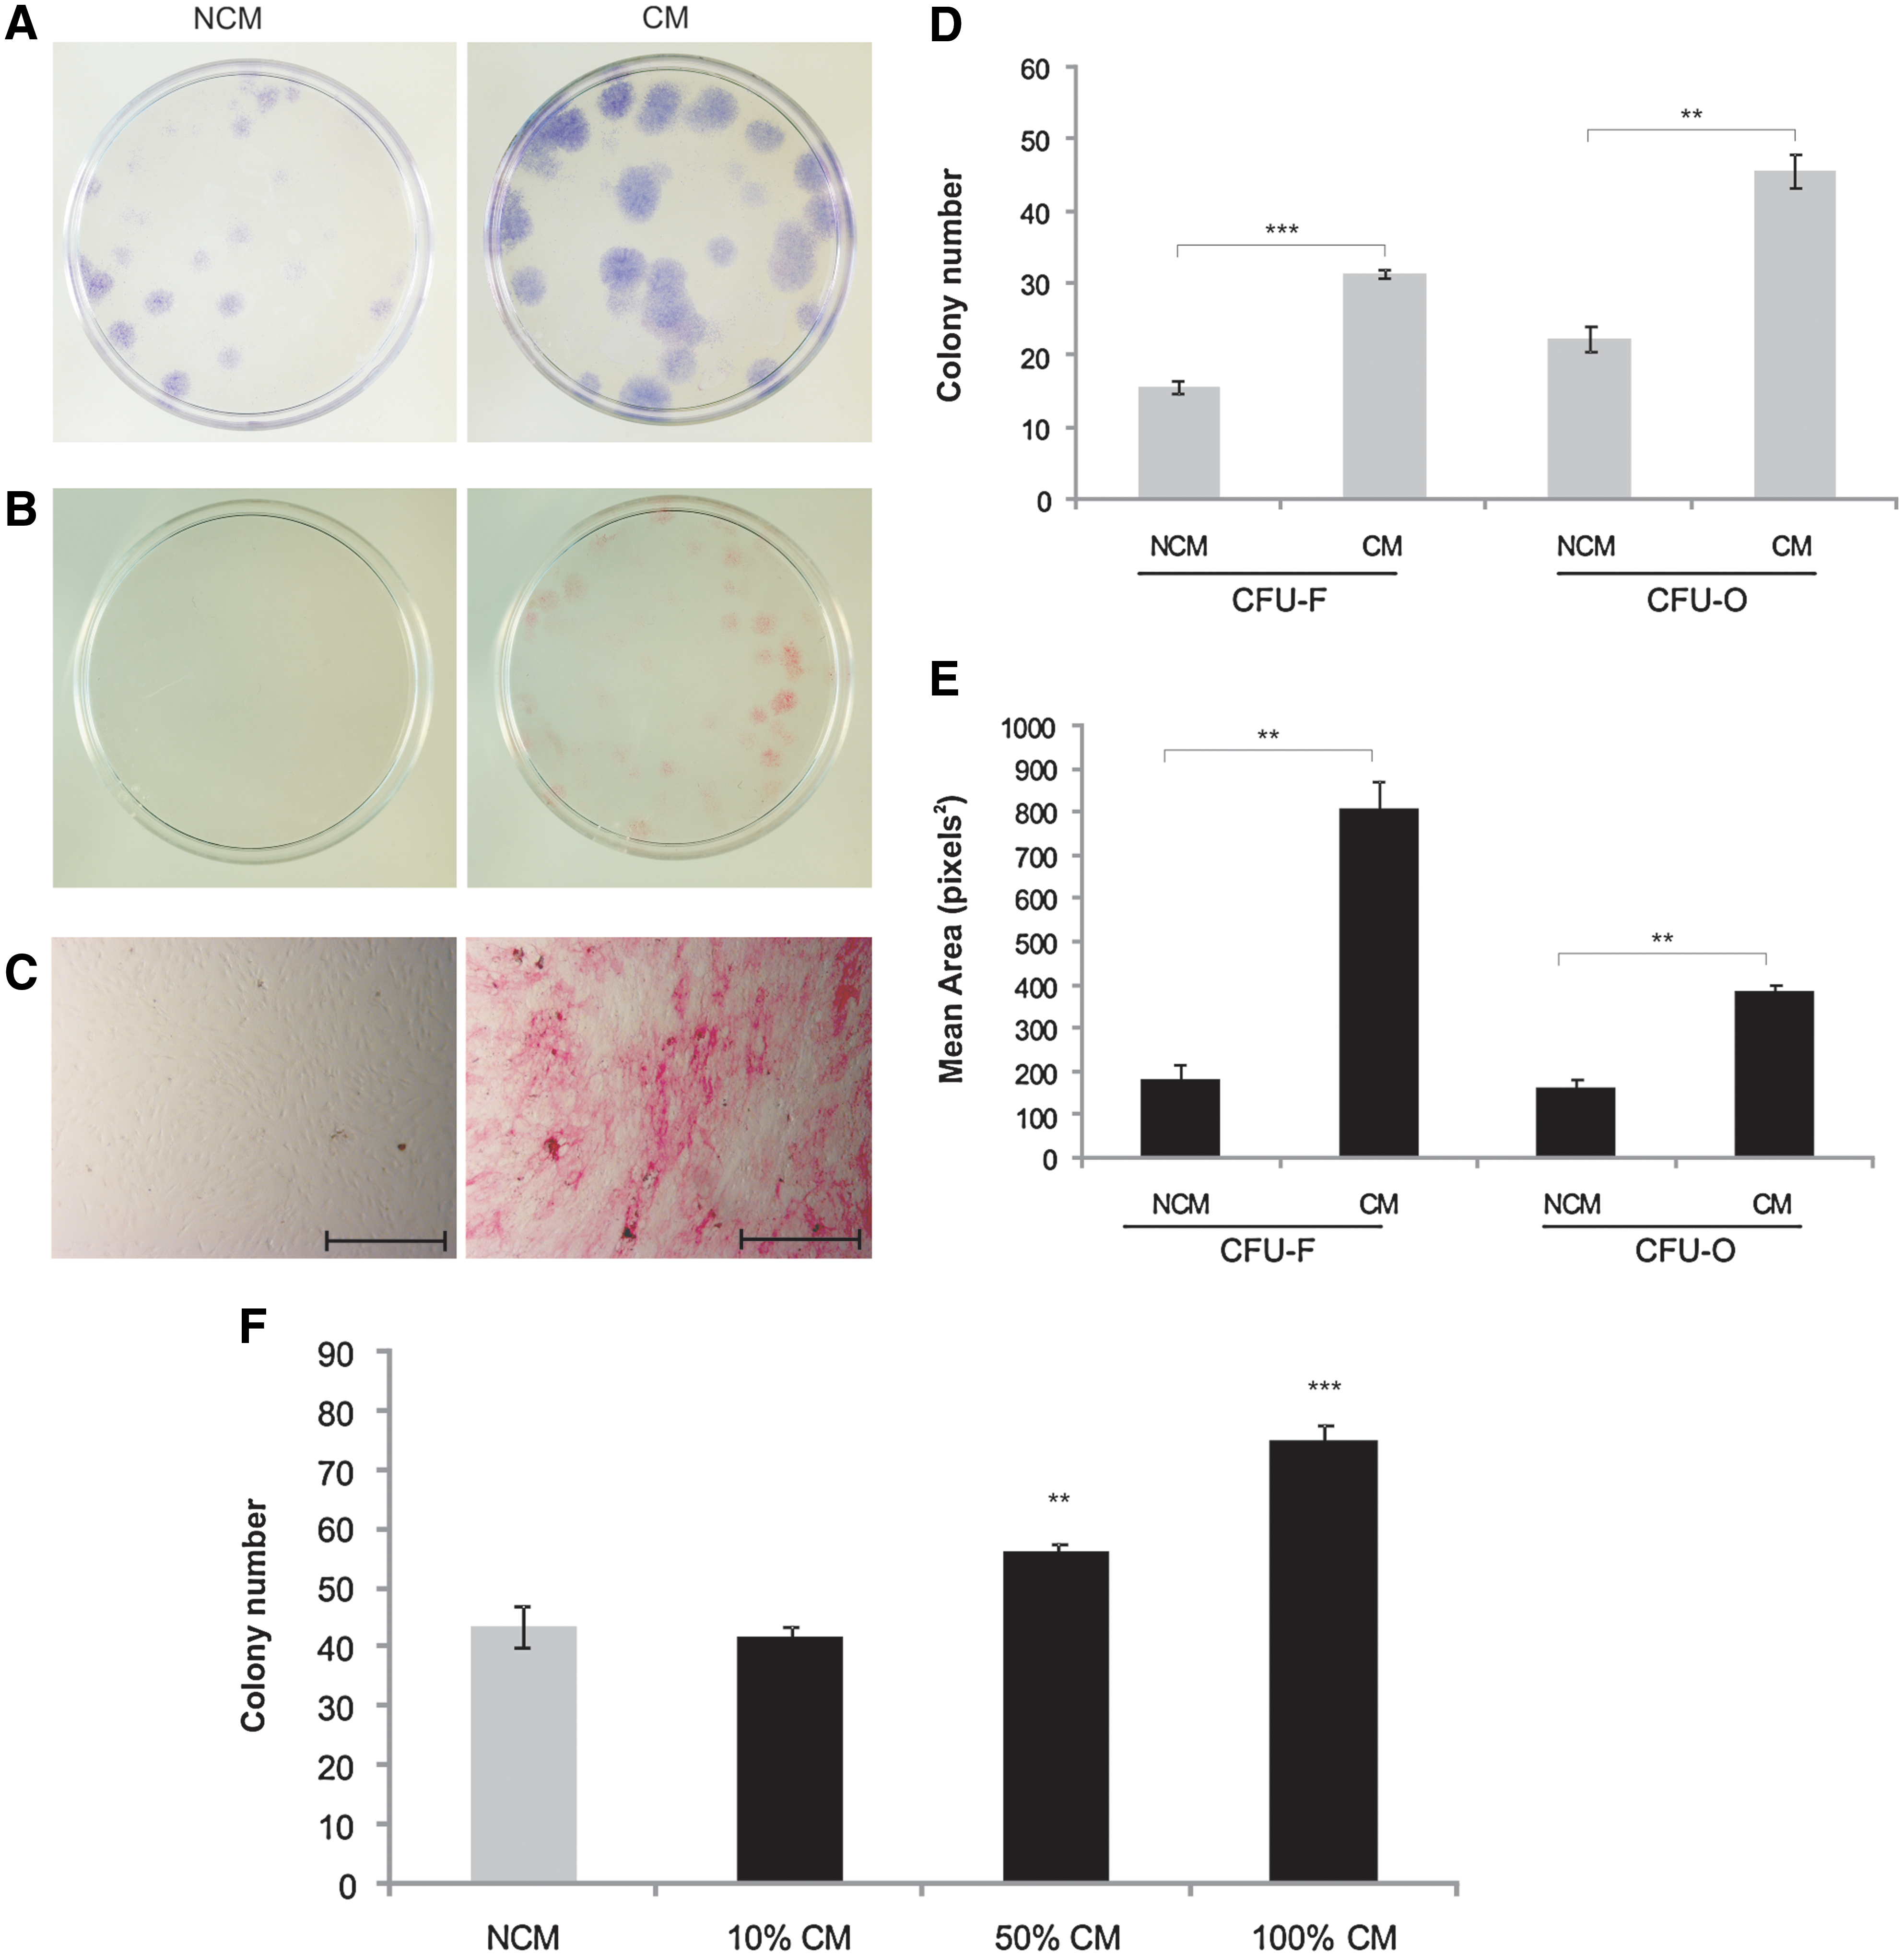
Effects of human umbilical vein endothelial cell (HUVEC)–conditioned medium (CM) on colony-forming unit–fibroblast (CFU-F) and colony-forming unit–osteoblast (CFU-O) formation.
In an attempt to identify the signaling crosstalk between the HUVEC-CM and the establishment and growth of adherent bone marrow progenitor cells, we determined the effects of a series of inhibitors to candidate pathways (wortmannin, AZD6244, and DKK-1) using the CFU-F assay. In control cultures, we confirmed that CM significantly increased colony size and area compared with NCM (Fig. 2A, top panel and Fig. 2B). We found that all the inhibitors significantly enhanced colony formation in cultures treated with NCM only (P < 0.001), with no effect on CM-treated CFU-Fs. Mean colony area remained fairly constant throughout, with no significant differences observed between controls and treated cultures (Fig. 2).
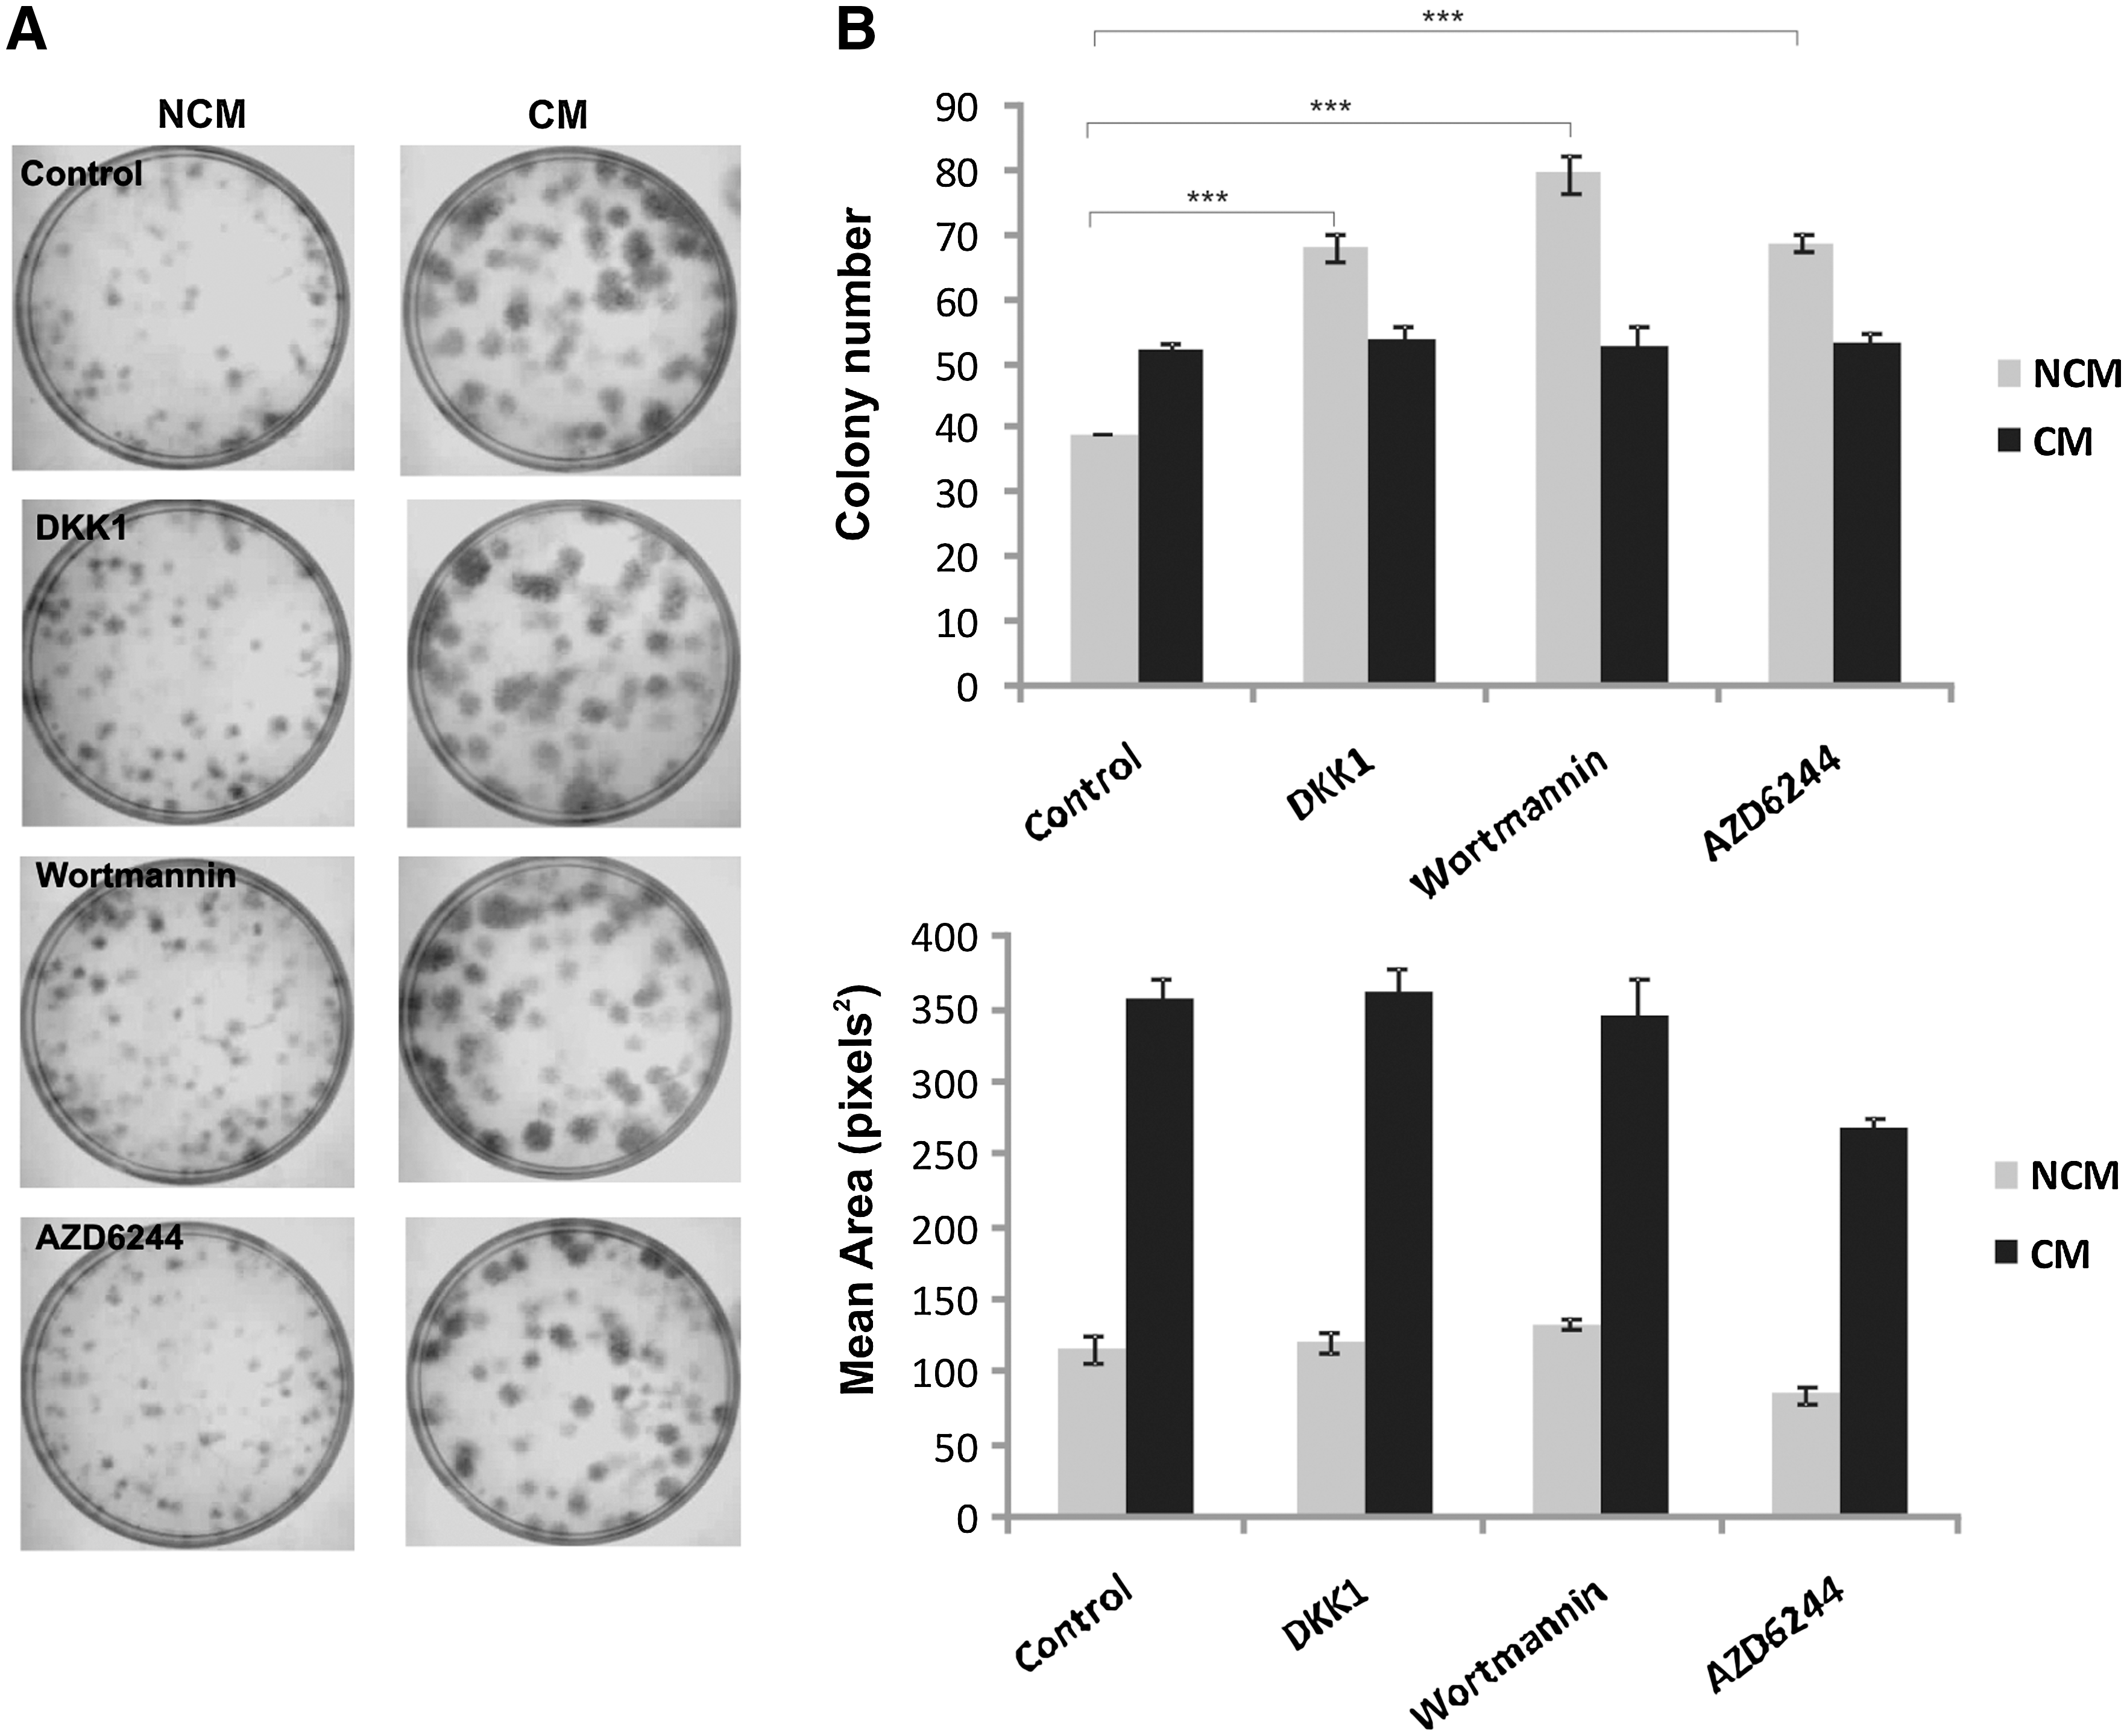
Effects of 3 inhibitors on CFU-F assay using HUVEC-CM and NCM. MSCs were prepared and cultured as CFU-Fs in the presence of wortmannin (50 nM), AZD6244 (40 nM), and DKK-1 (100 ng/mL). The medium was changed twice a week, with NCM used as a control.
Identification of candidate signaling pathways between HUVECs and MSCs
Following the observations made in the CFU-F pathway inhibitor study and the apparent complexity of overlapping signaling mechanisms, we used microarray data analysis to determine possible interactions between HUVEC-secreted proteins and MSC membrane-bound receptors to identify candidate signaling pathways that may be involved in crosstalk between MSCs and HUVECs. Using BioGRID computational software, over 1,500 potential interactions were detected by these initial screens. With further refinement and manual sorting, we identified fibroblast growth factor (FGF), Wnt, platelet derived growth factor (PDGF), transforming growth factor-β, BMP, Notch, and Ephrin as candidate HUVEC-MSC signaling mediators (Table 1). Midkine and pleiotrophin were also identified as being HUVEC-derived signaling molecules, which may regulate MSC activity, though the MSC-expressed cognate receptors were not identified using this screen.
HUVECs, human umbilical vein endothelial cells; MSCs, mesenchymal stem cells.
Effect of HUVEC-CM on MSC number
Cell viability was assessed with the MTT colorimetric assay. CM from HUVECs caused a significant (P < 0.001) increase in the number of viable MSCs compared with MSCs treated with NCM at all time points measured (Fig. 3).
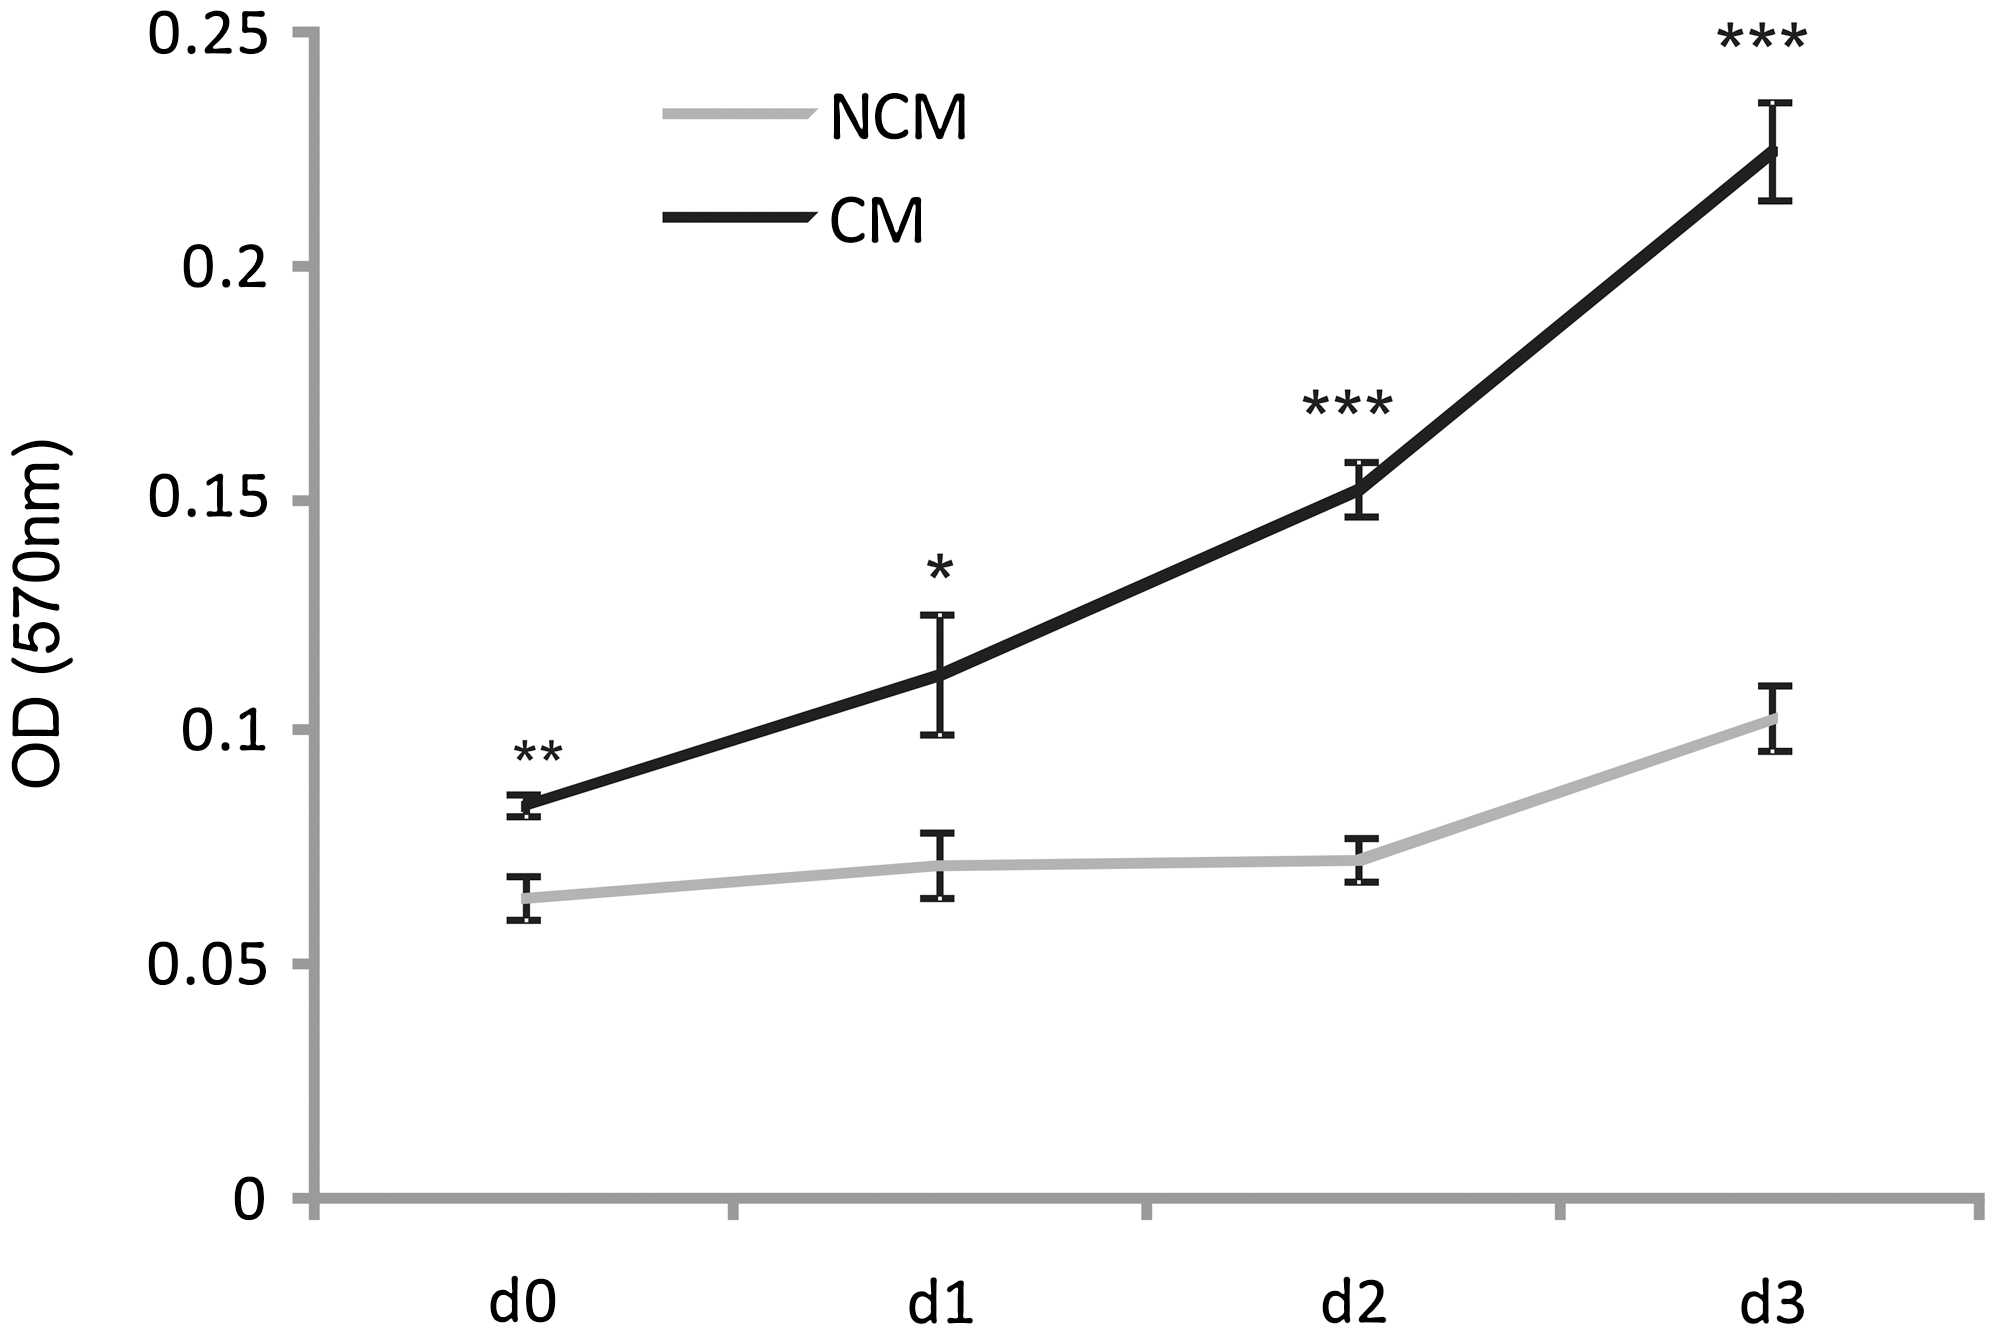
Effects of HUVEC-CM on viable MSC numbers. MSCs were seeded into 96-well plates and incubated for 1, 2, and 3 days (d) with CM and NCM supplemented with 2% fetal bovine serum. MTT assays were performed at the time points indicated. Mean values ± SE are shown (n = 6, *P < 0.05; **P < 0.01; ***P < 0.001). OD, optical density.
To further characterize the effect of CM collected from HUVECs on MSC proliferation, incorporation of BrdU into the newly synthesized DNA of replicating cells was determined over a 24-h incubation period. HUVEC-CM treatment for 48 h significantly (P < 0.001) increased BrdU incorporation in MSCs by an average of 45% compared with controls (Fig. 4A, D). Using a clonal MSC line, HUVEC-CM also significantly (P < 0.001) increased the percentage of proliferating cells by ∼55% compared with NCM-treated cultures (Fig. 4C, D).
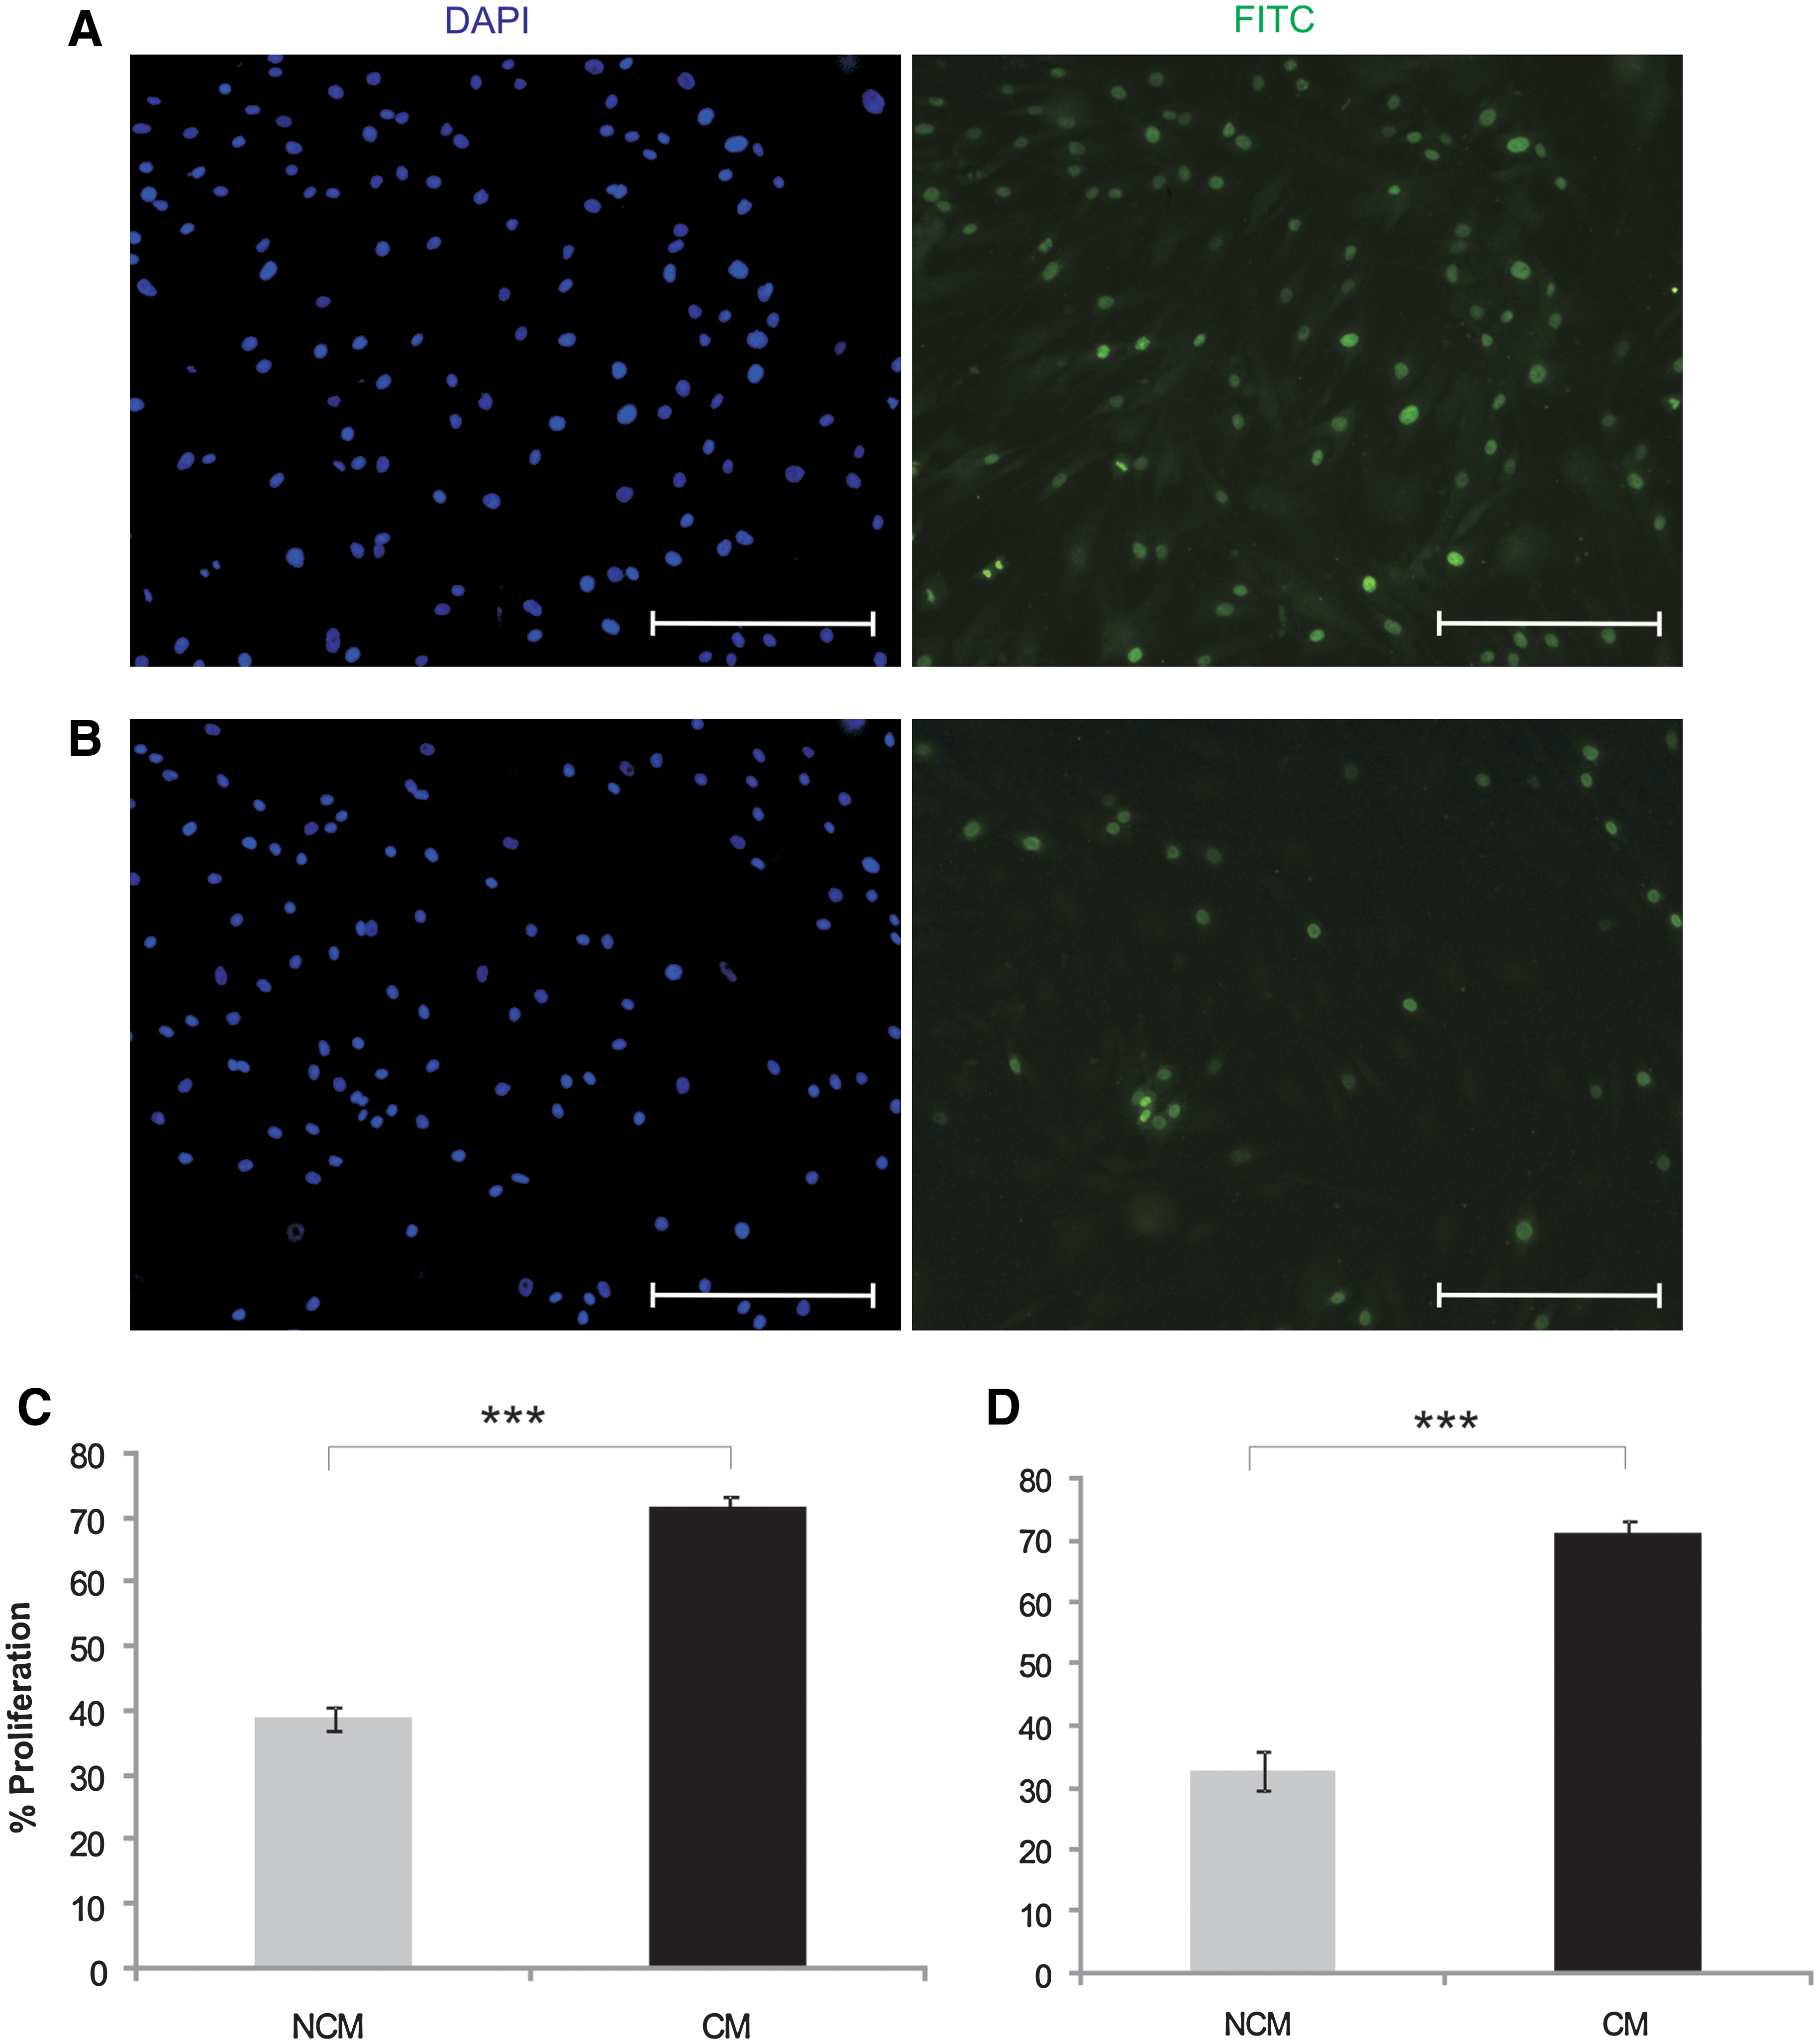
Effect of HUVEC-CM on MSC proliferation. 5-Bromo-2′-deoxyuridine (BrdU) labeling in MSCs treated with HUVEC-CM
Effect of HUVEC-CM on MSC differentiation
Osteogenic differentiation
The CFU-O data indicated that HUVEC-CM could promote the growth of osteoprogenitors. To determine the effect of HUVEC-CM on the osteogenic differentiation potential of MSCs, confluent cells were grown in osteogenic conditions and the extent of differentiation was analyzed by alkaline phosphatase and von Kossa staining at days 3, 7, 10, 14, 18, and 21. Alkaline phosphatase staining was detected in CM-treated cultures as early as day 3 (Fig. 5A). Alkaline phosphatase staining intensity was increasingly stronger on days 7, 10, 14, and 18 of differentiation, with weaker activity levels detected on day 21. Alkaline phosphatase staining was also detected on osteogenic NCM-treated cells but to a much lower extent (Fig. 5A). There was no mineralization detected by von Kossa staining in the early stages of differentiation. However, at later time points, the results showed clearly that HUVEC-CM caused a marked increase in von Kossa staining, when compared with NCM. To confirm these observations, the osteogenic potential of the cells was also assayed by qRT-PCR in a time-dependent manner to determine the relative mRNA expression levels of the osteogenic markers alkaline phosphatase, BMP-2, osteonectin, and osteopontin. MSCs were cultured in CM and NCM supplemented with osteogenic factors and the gene expression levels were analyzed at days 3, 7, 10, 14, 18, and 21 of osteogenic differentiation. The expression level of alkaline phosphatase, which is an early osteogenic marker, peaked earlier in osteogenic potential and remained higher at each time point throughout the 21 days of differentiation in CM-treated MSCs relative to NCM-treated cells. For example, on day 7 there was a 6-fold increase (P < 0.05) in the HUVEC-CM–treated culture compared with control (Fig. 6). There was also a significant and persistent increase in the expression of both osteonectin and osteopontin throughout the differentiation period, reaching at day 21 an expression level of 10-fold and 3-fold increase, respectively, in the HUVEC-CM–treated cultures relative to NCM controls. However, although the expression levels of BMP-2 increased during osteogenic induction, there was no significant difference between CM- and NCM-treated samples.
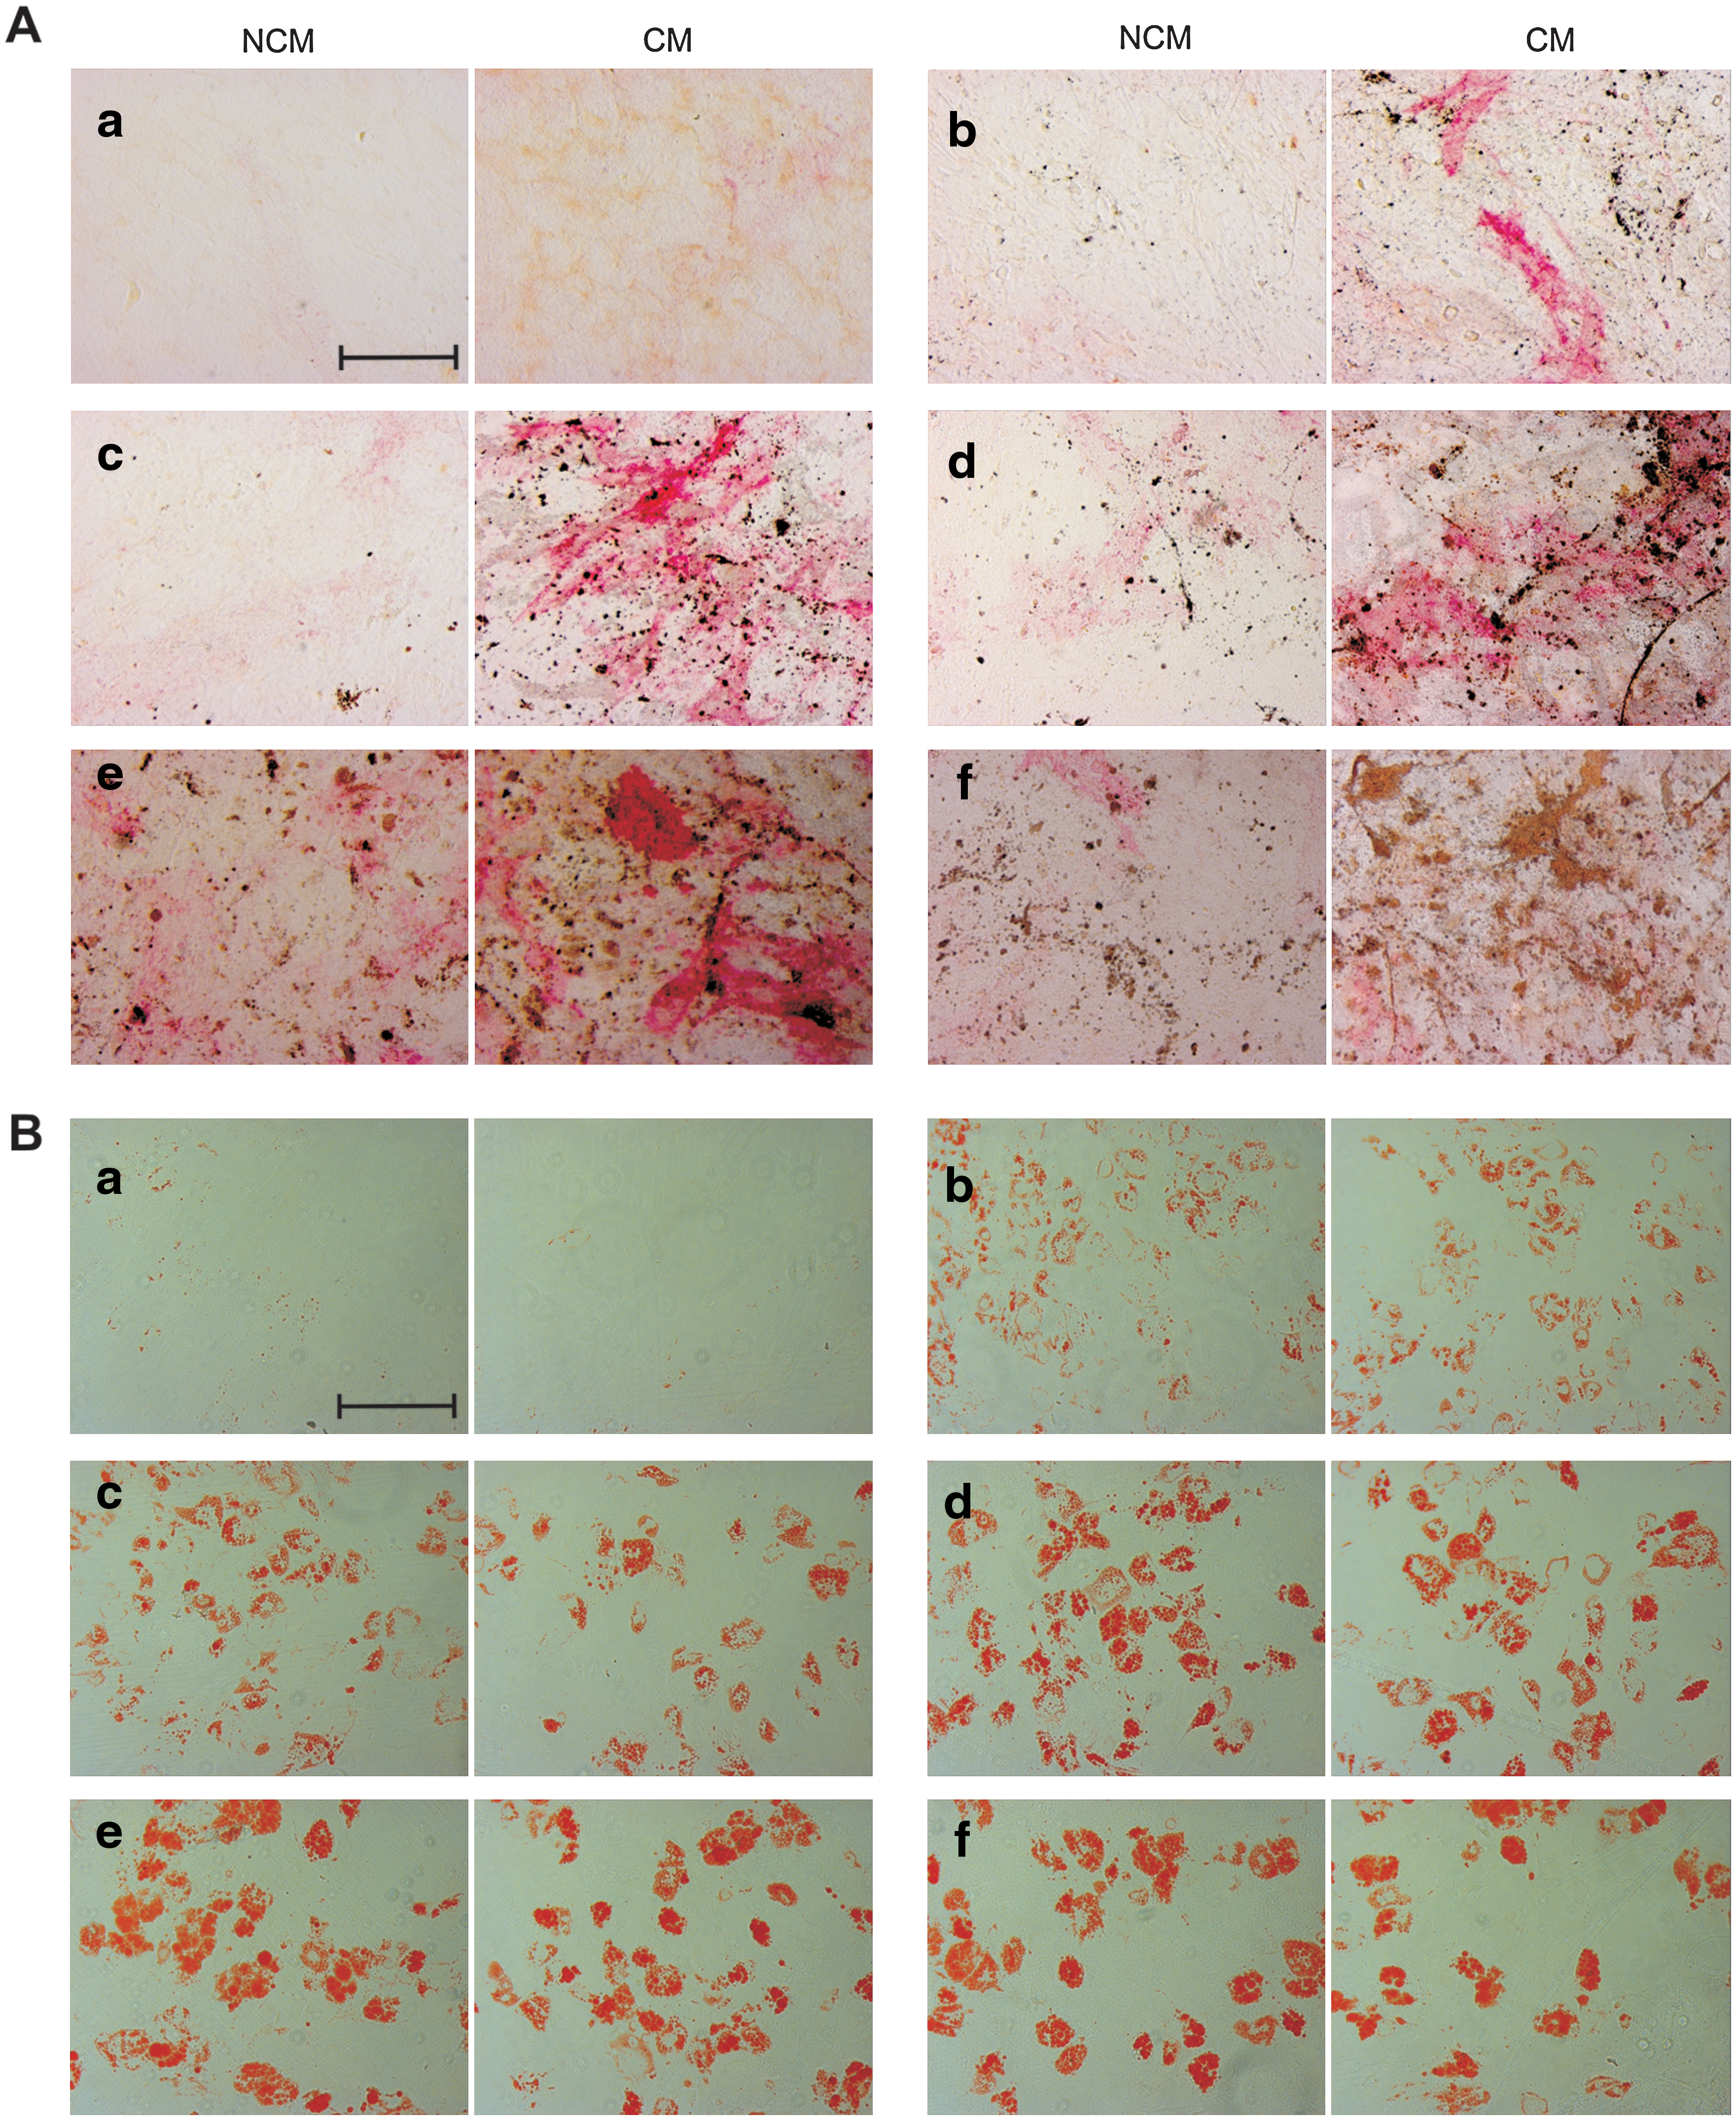
Effect of HUVEC-CM on osteogenic
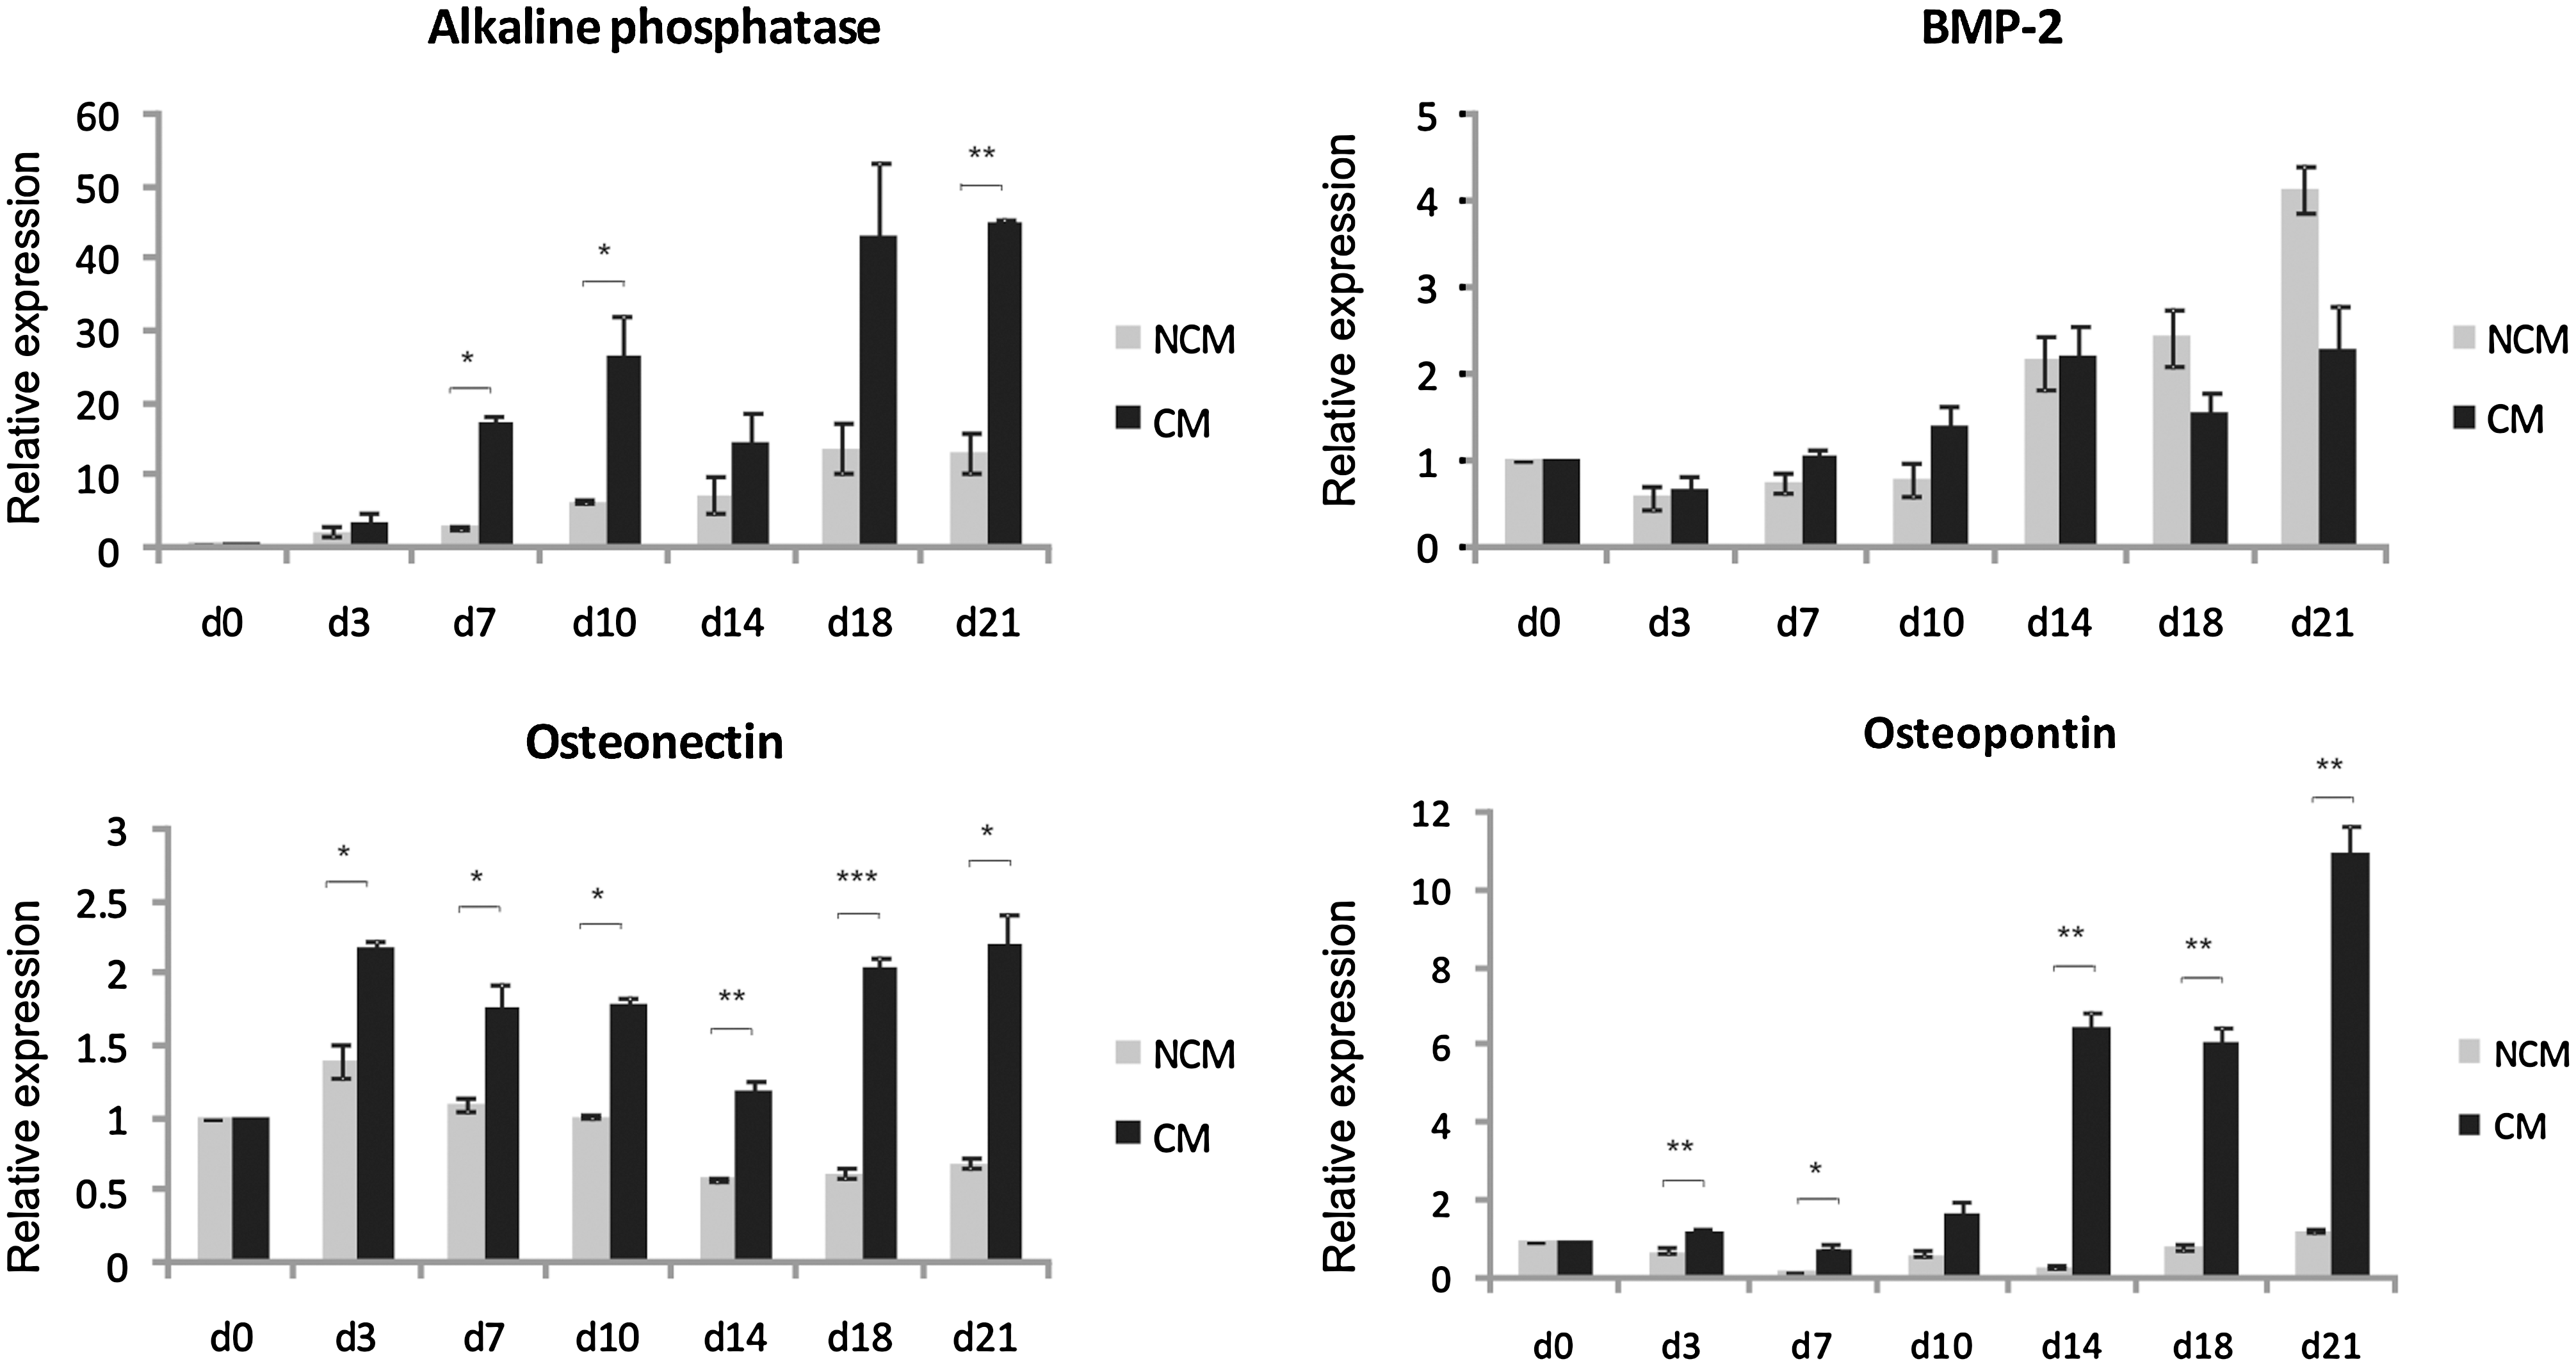
Real-time polymerase chain reaction analysis of the expression levels of osteogenic markers. Gene expression levels of alkaline phosphatase, bone morphogenetic protein (BMP)-2, osteonectin, and osteopontin were determined by MSCs cultured in HUVEC-CM and NCM under osteogenic conditions for 21 days (d). Mean values ± SE are shown (n = 3; *P < 0.05, **P < 0.01, and ***P < 0.001).
Adipogenic differentiation
To examine the lineage specificity of these effects, MSCs were also cultured in the presence of HUVEC-CM and NCM and supplemented with adipogenic factors. A typical time course of adipogenic differentiation was shown; at early time points (day 3), there were a limited number of cells in the MSC cultures that contained lipid-filled vesicles, which were stained with oil red O (Fig. 5B). At later time points, more lipid staining was evident in the MSC cultures, and the size of the lipid-filled vacuoles had also become larger and coalesced. This pattern continued through to the end of the 21 days of adipogenic differentiation. However, there were no significant differences in oil red O staining intensity in CM-treated cultures compared with NCM at any of the time points.
Discussion
At present, the precise identification as well as specific markers that would allow better isolation and purification of the cell type characterized as MSC are lacking. One critical factor in defining these cells' identity is the microenvironment or niche where the MSCs reside in vivo. The MSC niche is not only a complex structure, but also represents both physical and chemical interactions such as heterotypic cellular interactions as well as soluble factors that play a critical role in the regulation of MSCs in their niche. Key areas of research have focused on identifying elements that maintain the cells in their quiescent, undifferentiated state until they are called upon by certain cues that signal to the cells to exit the niche, increase in number, and differentiate for the repair, regeneration, or repopulation of damaged tissue [52]. Because of emerging recognition of MSCs occupying a periendothelial niche in human bone marrow and dental pulp [38,45,46], we hypothesized that in the bone marrow microenvironment, endothelial cells influence MSC activity using secreted signaling factors. In an attempt to test this hypothesis, the medium conditioned by HUVECs was collected and its effects on MSC colony formation, proliferation, and osteogenic and adipogenic differentiation were assessed.
Our data showed a dramatic effect of HUVEC-CM on MSC viability, proliferation, and colony formation. Our findings support previous data showing the ability of the medium conditioned by endothelial cells to stimulate mitotic propagation of other progenitor cell populations. Davis et al. reported that primary porcine endothelial cell CM promoted the in vitro proliferation, hematopoietic cell production, and colony formation of primitive human hematopoietic progenitor cells [53]. Consistent with these observations, related studies show that endothelial cells produce soluble factors that induce proliferation of vascular smooth muscle cells as well as precursor cells such as adipose precursors and oligodendrocyte precursor cells [54 –56]. However, there have been no reports to date on the effect of HUVEC-CM on the proliferative activity of MSCs, including clonally derived lines.
This study also clearly demonstrated that endothelial cells enhance the osteogenic potential of MSCs when exposed to HUVEC-CM as shown by histochemical and real-time PCR analysis of osteogenic markers. Apparently contradictory data exist on the effects of endothelial cells on osteogenesis. For example, Kaigler et al. [57] and Villars et al. [58] showed that endothelial cells significantly increase the osteogenesis of bone marrow stromal cells and osteoprogenitors, respectively, only when cultured in direct contact. Kaigler et al. also found that endothelial cell CM had no effect on osteogenesis, whereas other studies supported the hypothesis that endothelial cell CM inhibited BMSC differentiation into mature osteoblasts [59]. It should be noted that in both of these latter studies the CM contained 5% and 10% serum, respectively. Our work purposefully identified a basic medium (DMEM) that was able to support HUVEC growth in the absence of serum and other growth supplements. By growing HUVECs on gelatin with ITS, we can maintain HUVEC survival and avoid potential masking and depletion issues caused by serum components, to increase the likelihood of identifying true effects of endothelial-derived factors. Our data were in agreement with previous report that showed that HUVEC-CM increases alkaline phosphatase activity in human osteoblast-like cells [60]. In addition, we determined the effects of HUVEC-CM on a range of osteogenic markers using qRT-PCR. These results demonstrated that most, but not all, osteogenic markers increased in CM compared with NCM controls, suggesting that although HUVECs are able to induce osteogenesis, other factors may also be required.
In an attempt to identify the mechanism(s) involved and factor(s) in the CM responsible for the effects on MSC colony formation, we used selective small-molecule inhibitors AZD6244, wortmannin, and DKK-1 to inhibit mitogen-activated protein kinase 1/2, phosphatidylinositol 3 kinase, and canonical Wnt signaling, respectively. Our findings revealed that inhibition of these pathways significantly enhanced the CFU-F colony formation in NCM-treated cultures only. Similar observations have been reported previously where inhibition of signaling pathways, including FGF and the ERK cascade, in embryonic stem cells can promote colony formation, suggesting that embryonic cells intrinsically self-replicate if deflected from inductive differentiation stimuli [61]. Similarly, our findings suggest that the pathway inhibitors promote the independent growth and recruitment of MSC progenitors by inhibiting endogenous differentiation-inducing signaling pathways, allowing maintenance of stem cell phenotype. Notably, there was no significant effect on CM-treated cultures, suggesting that the high concentration of differentiation-inducing signaling factors secreted into the CM may have masked this effect. For a more comprehensive analysis of putative HUVEC-derived signaling factors, we screened subsets of whole-genome expression profiles to select for HUVEC-secreted signals that would interact with MSC-expressed receptors. This approach efficiently identified multiple potential signaling interactions between these cell types. We found that Dickkopf1 (Dkk1), which was identified as being secreted by HUVECs, binds to the cell-surface–associated low-density lipoprotein receptor–related protein 6 on MSCs, thus indicating a possible role for canonical Wnt signaling in the communication between MSCs and HUVECs. Other potential signaling pathways identified were FGF, PDGF, BMP, transforming growth factor-β, Notch, and Ephrin, and it is likely that some or all of these factors could have overlapping roles in mediating the observed effects in MSCs. For example, FGF signaling has been found to play an important function during proliferation and osteogenic differentiation of rat bone marrow stem cells [62]; PDGF signaling has a functional role for recruitment of mesenchymal progenitors during bone development and remodeling [63] and a number of studies have documented the involvement of BMPs in MSC biology and osteogenesis [64].
The regulatory activities of endothelial cells on MSCs may be lineage specific as HUVEC-CM had no effect on adipogenic differentiation, as shown by oil red O staining. These findings support observations by Meury et al. [59], suggesting that endothelial cell-CM does not promote bone marrow stromal cell differentiation along the adipogenic lineage. However, related work has shown that endothelial cells reduce adipogenesis of adipose stromal cells through paracrine communication [65]. These slight variations could be due to different cell lines, culture conditions, donor variability, as well as different preparation of CM as discussed earlier. Regardless, few data exist to support a role for endothelial cells in promoting adipogenesis.
Collectively, our data suggest for the first time that HUVECs secrete soluble factors that signal to MSCs to enhance proliferation and osteogenic differentiation. These properties of endothelial cells may allow MSCs to emerge from their niche, increase in numbers, and contribute to bone formation when required. Further identification of the network of factors and the relative contribution of cell contact-dependent and -independent events will help define the endothelial cells' regulatory control exerted over MSC behavior.
Footnotes
Acknowledgments
The authors thank the staff and patients of Harrogate District Hospital for the provision of bone samples and BBSRC and Smith and Nephew Plc. for supporting this research.
Author Disclosure Statement
M.W. is an employee of Smith and Nephew Plc., who helped to support this work. All other authors have no commercial associations. No competing financial interests exist.