
Abstract
High maternal blood glucose levels caused by diabetes mellitus can irreversibly lead to maldevelopment of the growing fetus with specific effects on the skeleton. To date, it remains controversial at which stage embryonic development is affected. Specifically during embryonic bone development, it is unclear whether diminished bone mineral density is caused by reduced osteoblast or rather enhanced osteoclast function. Therefore, the aim of this study was to characterize the growth as well as the skeletal differentiation capability of pluripotent embryonic stem cells (ESCs), which may serve as an in vitro model for all stages of embryonic development, when cultured in diabetic levels of D-glucose (4.5 g/L) versus physiological levels (1.0 g/L). Results showed that cells cultivated in physiological glucose gave rise to a higher number of colonies with an undifferentiated character as compared to cells grown in diabetic glucose concentrations. In contrast, these cultures were characterized by slightly decreased expression of proteins associated with the stem cell state. Furthermore, differentiation of ESCs into osteoblasts and osteoclasts was favored in physiological glucose concentrations, demonstrated by an increased matrix calcification, enhanced expression of cell-type-specific mRNAs, as well as activity of the cell-type-specific enzymes, alkaline, and tartrate resistant acidic phosphatase. In fact, this pattern was noted in murine as well as in primate ESCs. Our study suggests that an interplay between both the osteoblast and the osteoclast lineage is needed for proper skeletal development to occur, which seems impaired in hyperglycemic conditions.
Introduction
D
Recent studies have supported the notion that preimplantation exposure to high glucose (HG) levels can have an even earlier impact on the offspring and showed that poor maternal glycemic control increases the risk for miscarriage [9]. Wyman and colleagues reported that exposure to HG during early stages of pregnancy, such as oogenesis, fertilization, and blastocyst development, was enough to permanently program the fetus to develop significant morphological changes. However, how glucose affects the development of the blastocyst, its implantation, and the subsequent development of the embryo is not well known. Not only does the serum of diabetic patients show an elevated glucose concentration, but also alterations in insulin, free fatty acid, and ketone body circulation are found. Therefore, the inhibitory effect on the blastocyst or embryonic skeletal development by glucose only is hard to establish in vivo. Here, predictive cellular models represent a useful tool to study the effects of single serum components associated with diabetes in vitro. Based on their inner cell mass origin and their pluripotent nature, embryonic stem cells (ESCs) provide the only available in vitro model that mimics the development of an embryo from implantation to maturity. Although there is existing concern that ESC differentiation does not always reflect the real differentiation process in embryonic development, it is an appropriate model to analyze specific differentiation pathways [10,11]. ESCs are normally cultivated in media containing glucose concentrations equivalent to glucose serum levels of a diabetic, but which was shown to enhance cell growth and proliferation [12,13]. This fact raises the question whether changes in the glucose level can influence maintenance and differentiation ability of these cells, as seen in vivo in the developing embryo.
In the present study, we intended to describe the effect of elevated glucose supply on the maintenance of murine ESCs (mESCs) and their differentiation into the osteogenic lineage to characterize the impact of diabetic glucose levels on the peri-implantation embryo and on embryonic bone formation. First, we cultivated these cells for four passages in a medium supplemented with glucose equivalent to a physiological low glucose (LG; 1.0 g/L) or poorly controlled diabetic (HG, 4.5 g/L) blood glucose level. Subsequently, mRNA and protein expression levels of pluripotency and early differentiation markers were analyzed. Secondly, the cells were differentiated into skeletal cell types in the respective glucose concentrations according to a previously established protocol [14]. Expression levels of bone specific markers and the amount of deposited calcified matrix were analyzed. Finally, by demonstrating that rhesus ESCs showed the same osteogenic phenotype in the diverse glucose concentrations, application of our data to primate diabetic phenotypes seems possible. In conclusion, we were able to show that hyperglycemic glucose concentrations in the culture medium have a negative impact on pluripotency and osteogenic differentiation of ESCs.
Material and Methods
ESC growth and differentiation
Murine ESCs (D3, American Type Culture Collection) were routinely cultured in the presence of Leukemia Inhibitory Factor as described previously [15]. Cells were split every second day and 1.2 × 10⁴ cells/cm2 were seeded for every new passage. The cells were either cultivated in DMEM (no glucose, Invitrogen) supplemented with 1.0 g/L D-glucose (LG) or 4.5 g/L D-glucose (HG) for four passages before analysis. Differentiation was performed from cells routinely cultivated in HG-supplemented medium as specified [14]. Briefly, differentiation was initiated with the hanging drop protocol. On day 5, the resulting embryoid bodies were trypsinized and 50,000 single cells per cm2 were plated onto gelatin-coated dishes. The cells were grown for an additional 25 days in medium supplemented with ascorbic acid (25 μg/mL), β-glycerophosphate (10 mM), and 1α,25-(OH)2 vitamin D3 (5 × 10⁻⁸ M).
Rhesus ESCs R366.4 (WiCell Research Institute) were grown in mTeSR1 medium (Stem Cell Technologies). Differentiation was initiated by a switch to differentiation medium as used for mESCs as specified [14]. Osteogenic inducers, described above, were added to the culture medium, when the cells were confluent. For both cell lines, differentiation was performed in medium containing 1.0 g/L D-glucose (LG), 4.5 g/L D-glucose (HG), or 1.0 g/L D-glucose + 3.5 g/L D-mannitol (osmotic control; Man).
Biochemical assays
For biochemical analyses, cells were grown on a 24-well plate and lysed at day 30 of differentiation by addition of radio immunoprecipitation assay buffer (RIPA) consisting of 10 mM Tris pH 7.2, 10 mM sodium chloride, 0.1% sodium dodecyl sulfate, 1% Triton X-100, and 1% sodium deoxycholate supplemented with protease inhibitor mix (Sigma-Aldrich). For complete lysis, samples were swayed in the cold room for 30 min. Insoluble matrix was pelleted and stored at −20°C for calcium determination. Calcium as well as phosphatase assays were performed from the same samples and normalized to the total protein content.
Determination of protein content
The total protein content of the samples was measured using the BioRad DC protein assay kit according to the manufacturer's instructions. Absorbance was measured in a Tecan Infinite M1000 plate reader at 750 nm. A BSA standard curve was analyzed along with the samples to estimate the protein concentration. In a subsequent step, the amount of total protein was calculated for the given sample volume [16].
Alkaline phosphatase and tartrate resistant acidic phosphatase assay
Tartrate resistant acidic phosphatase (TRAP) and alkaline phosphatase (ALP) activity was measured through the colorimetric conversion of p-nitrophenylphophate substrate. For both assays, the yellow reaction product nitrobenzene can be detected photometrically at 405 nm. For the enzyme activity assay an aliquot of the RIPA lysate was mixed with TRAP assay buffer (0.1 M sodium acetate buffer pH 5.8, 10 mM p-nitrophenylphophate, 0.2 M KCl, 0.1% Triton X-100, 10 mM sodium tartrate, 1 mM ascorbic acid, and 0.1 M FeCl3) or ALP substrate (Sigma-Aldrich), respectively. Absorbance was measured instantly after adding the substrate and at multiple times during incubation at 37°C. Based on the measured change in absorbance, the specific enzyme activity of each sample was calculated in U/mg total protein as a function of the incubation time and the protein amount [16].
Calcium determination
The amount of matrix calcification was quantified as described [16] using the purple substrate Arsenazo III (Genzyme Diagnostics), which yields a blue colored complex after reaction with bivalent ions. Measurements were performed from the RIPA lysate and from the pelleted insoluble matrix. In a prior step, the calcium was extracted from the insoluble pellet by dissolving it in 1 M HCl at 4°C over night with gentle rocking. Both lysates were then individually mixed with Arsenazo III reagent for 5 min at room temperature. The absorbance of the calcium-arsenazo complex was measured at 650 nm with a Tecan Infinite M1000 plate reader. Additionally, a calcium standard was analyzed for subsequent calculation of the calcium amount for each sample. The amounts obtained for the RIPA lysate and the HCl lysate were summed up and normalized to the protein content of the sample.
Osteocalcin enzyme-linked immunosorbent assay
The secretion of undercarboxylated osteocalcin was measured with an osteocalcin enzyme-linked immunosorbent assay kit (Hoelzel Diagnostics) on differentiation day 30 from media samples that had been incubated with the cells for 48 h. Culture supernatants were either measured directly or incubated with 25 μg/μL hydroxyapatite for 15 min to bind carboxylated OCN before measurement. Hydroxyapatite was pelleted by centrifugation and bound OCN eluted by addition of 0.5 M sodium phosphate buffer, pH 8.0. Untreated samples and eluate were analyzed in duplicate together with appropriate concentrations of an OCN standard. To calculate the amount of undercarboxylated OCN the portion of carboxylated OCN was subtracted from the total amount of OCN.
Lactate and pH measurement
Lactate secretion and associated pH changes were measured from culture supernatant on day 30 of differentiation. Sample pH was determined using a glass electrode pH meter. Changes in lactate secretion were monitored with a YSI 7100 Multiparameter Bioanalytical System (YSI Life Sciences).
RNA isolation, cDNA synthesis, and quantitative PCR
Total RNA was isolated at the time points indicated using the GenElute mammalian total RNA purification kit (Sigma-Aldrich). The RNA concentration was determined with a NanoDrop by measuring the absorbance at 260 and 280 nm. Samples with an inappropriate 260/280 ratio were excluded from further analysis. For quantitative PCR, cDNA was synthesized from 625 ng RNA in a total volume of 25 μL with Superscript II as indicated by the manufacturer (Invitrogen) and described previously [17]. Primer sequences were generated with primer 3 (
Flow cytometry
Cells were trypsinized at the time point indicated to yield a single-cell suspension, washed in PBS twice, and the cell number was determined with a CASY cell counter (Innovatis). About 1.5 × 10⁶ cells per sample were fixed at 4°C for 10 min with 4% formaldehyde. Fixed cells were then incubated in PBS/1% BSA/0.1% saponin/0.05% NaN3 solution containing the diluted first (goat polyclonal anti mouse advanced glycation end products [AGE; AbD Serotec], mouse monoclonal anti mouse SSEA-1 [Chemicon], rabbit polyclonal anti mouse Oct-3/4 [Santa Cruz], and rabbit polyclonal anti mouse nanog [Millipore]) or secondary antibody (AlexaFluor® conjugated, Invitrogen), respectively. To eliminate unbound antibody, cells were washed 3 times with staining buffer before adding the secondary antibody and again directly before measurement. About 10,000 positive events were measured in a Beckmann Coulter FC500 flow cytometer on the same day of harvesting. Time corresponding unstained cells were used for gate setting and cells stained with an isotype control antibody were used as negative control. Analyses were done with the corresponding CXP Analysis software.
Histochemical and immunofluorescent staining
Matrix in mature cultures was observed with Alizarin Red S (mineralization) or van Gieson (collagen) staining. Methanol/aceton (7:3) fixed cells were overlaid with a 2% Alizarin Red S solution or van Gieson mixture (0.1% acid fuchsin and 1% picric acid), respectively, incubated for 5 min at room temperature, and washed afterward with an ascending alcohol series (70%, 80%, 90%, and 100%) to remove nonspecific stain.
Osteoclasts were identified in glutaraldehyde-fixed cultures (10%) using TRAP staining solution over night at 37°C, which contained 50 mM sodium acetate buffer (pH 5.0), 30 mM sodium tartrate, 100 μg/mL naphtol-AS-MX phosphate disodium salt, 0.1% Triton X-100, and 300 μg/mL Fast Red Violet LB salt.
For immunofluorescence, cells were fixed in 4% formaldehyde. To block unspecific antibody binding sites, cells were overlaid with 1% milk powder/PBS for 30 min at room temperature. Staining was done with appropriate dilutions of the first and secondary antibody (see flow cytometry) at 4°C over night or for 1 h at room temperature. Pictures were taken with a fluorescence microscope (Zeiss, Axio Observer Z1).
Statistical analysis
All experiments were performed from three biological samples, each set including three or four technical replicates, respectively. Data are displayed as the mean ± standard deviation. ANOVA or Student's t-test (Sigma Plot) was used to detect differences between the various treatment groups. Before analysis the data were checked for normality and homogeneity of variances. Bonferroni's method was used to perform appropriate pair-wise comparisons of treatment groups. For data not meeting eligibility criteria to perform a conventional ANOVA, an ANOVA on Ranks test was used followed by Dunn's method to perform pair wise comparisons.
Results
Effect of glucose on the maintenance of ESC pluripotency
To test hyperphysiological (diabetic) glucose concentrations in the peri-implantation model, ESCs were cultivated for four passages in a HG (4.5 g/L D-glucose) or LG (1.0 g/L D-glucose) containing medium reflecting diabetic or physiological blood glucose levels, respectively. Subsequently, the cells were analyzed for a variety of pluripotency markers (Fig. 1). Cells cultivated in a physiological glucose concentration (LG) gave rise to a significantly higher number of colonies with an undifferentiated morphology than cells cultivated in HG (Fig. 1A, B). As shown in the inset in Fig. 1A, such undifferentiated colonies are tightly packed and round with distinct borders, containing very small ESCs with a high nuclear-to-cytoplasmic ratio [19]. In HG conditions 64% ± 2.5% of all colonies showed such an undifferentiated morphology, whereas 72.5% ± 3.5% colonies with an undifferentiated conformation were counted in LG conditions (Fig. 1B; p = 0.034).
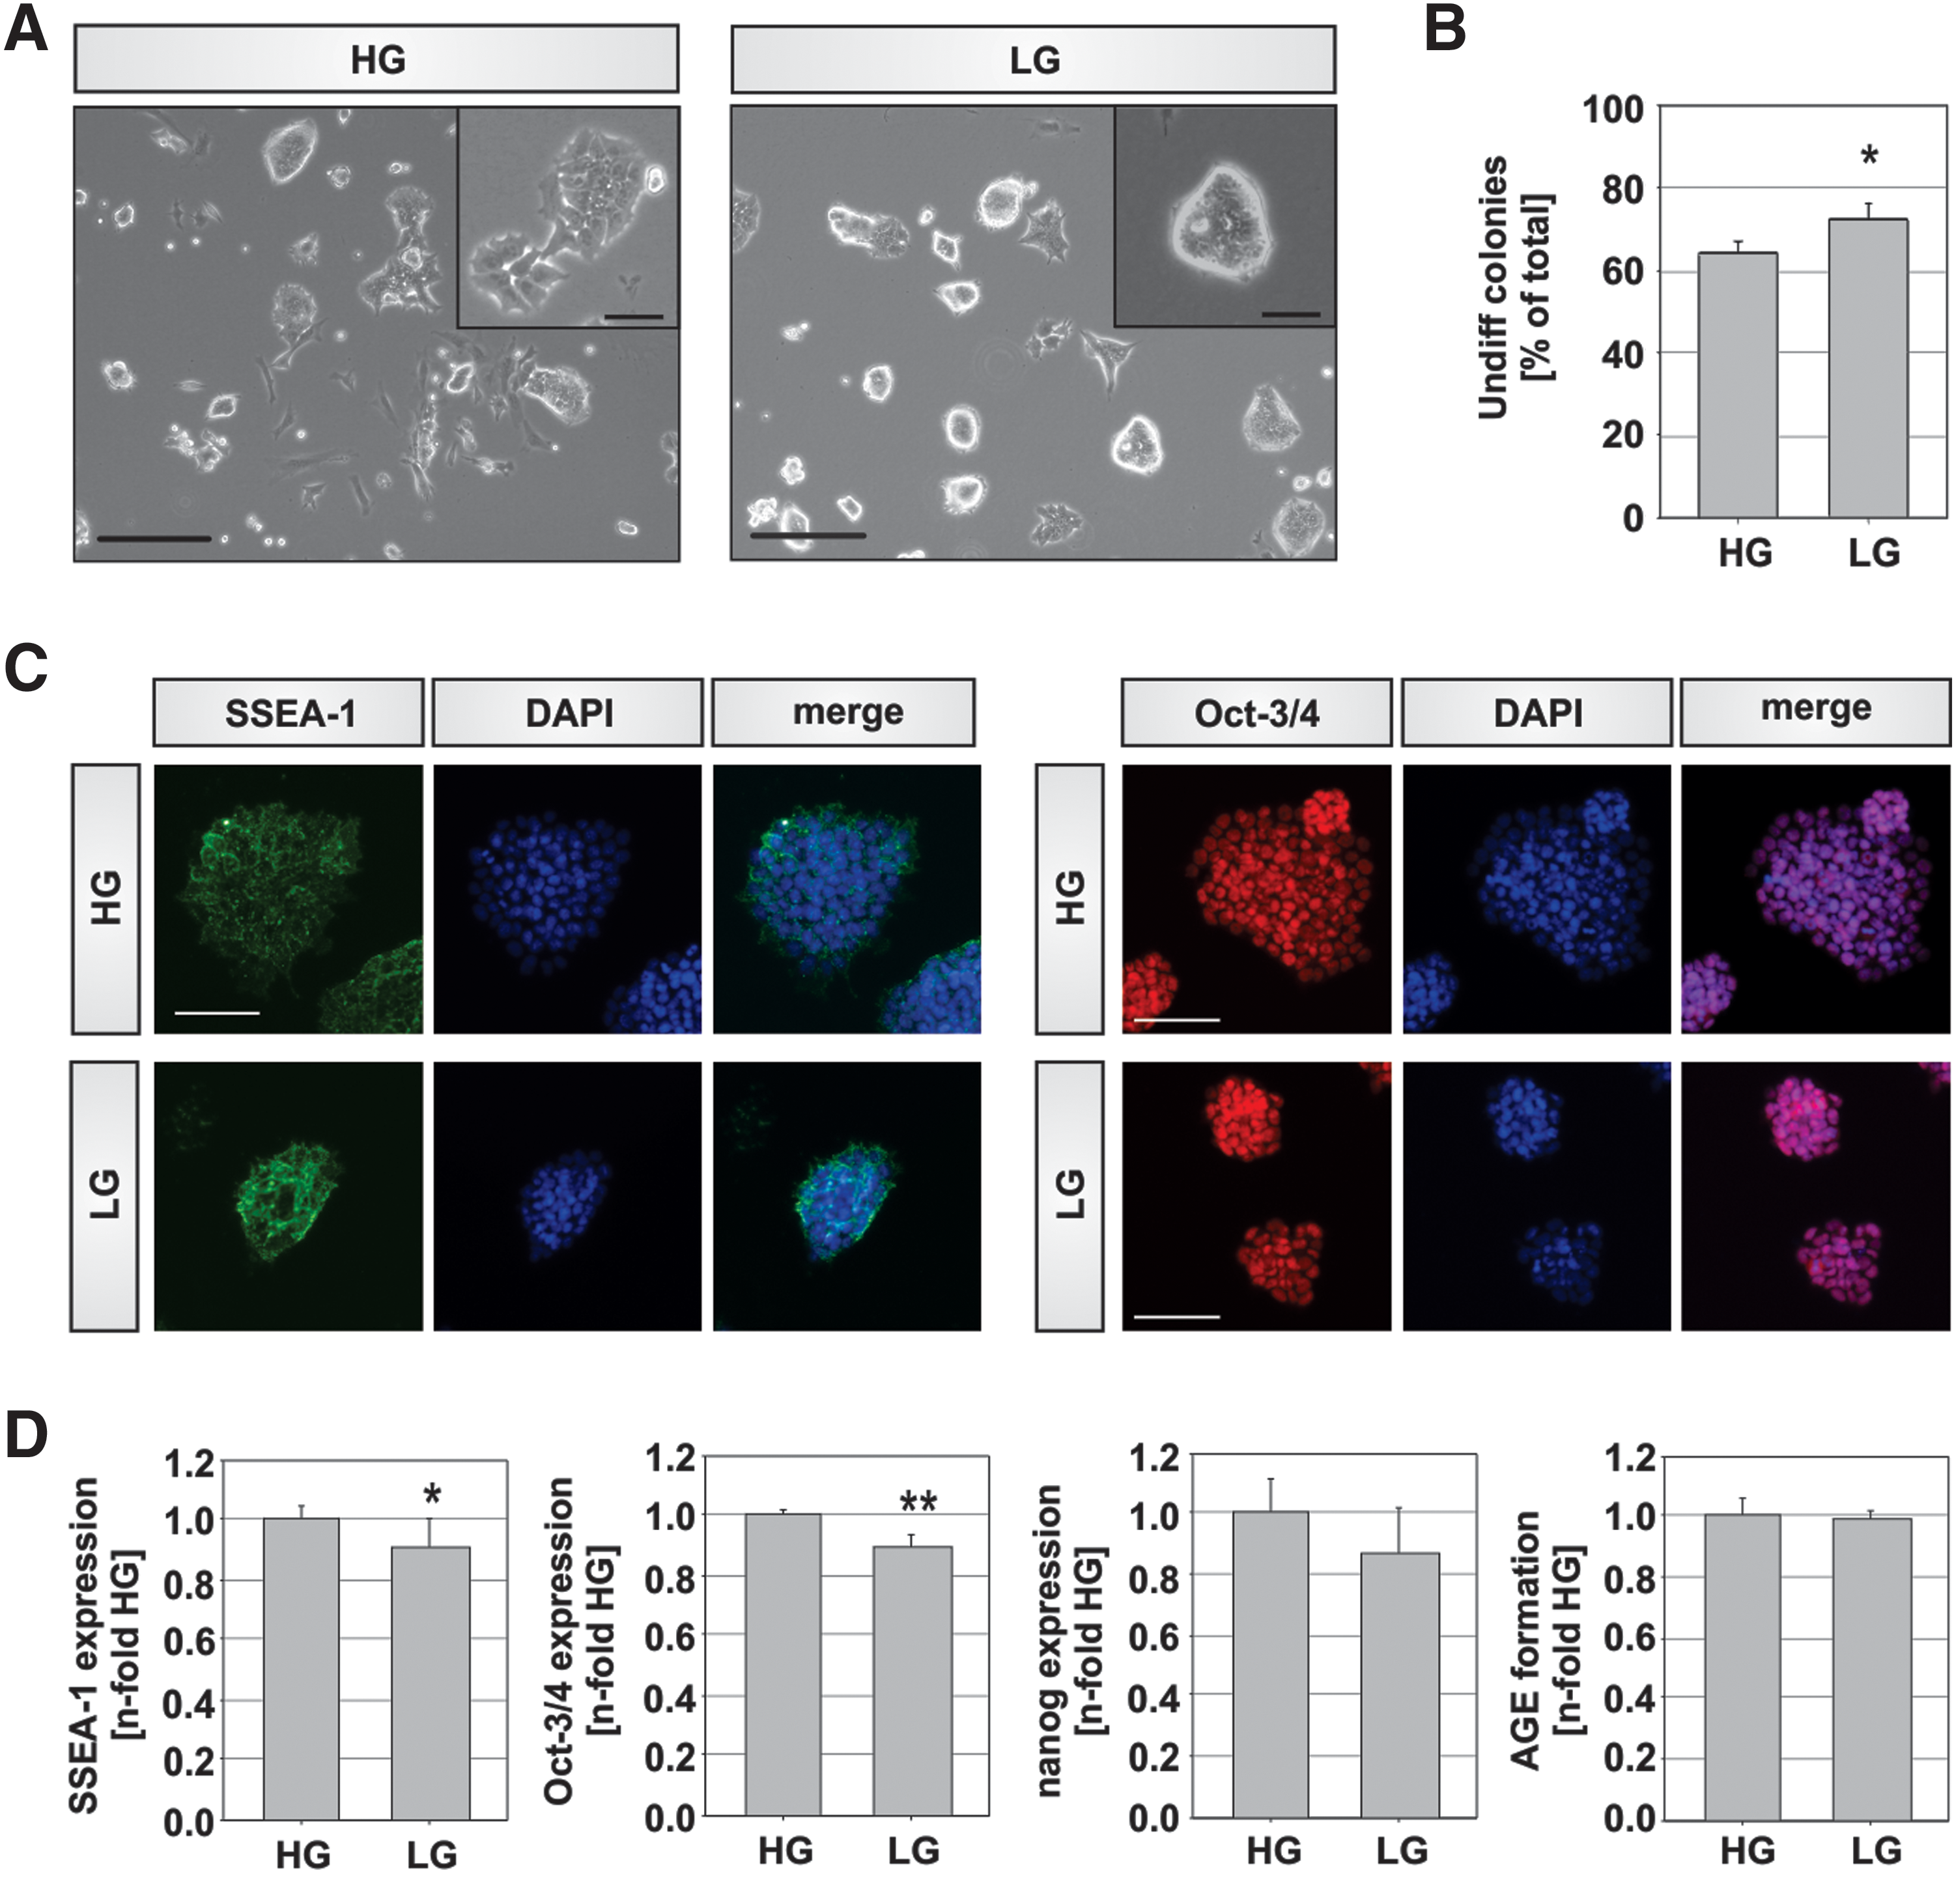
Characterization of pluripotency in murine embryonic stem cells (mESCs) cultivated in high glucose (HG) and low glucose (LG) conditions. Undifferentiated murine D3 ESCs were cultivated for 4 passages in 1.0 g/L (LG) and 4.5 g/L (HG) D-glucose containing medium.
Since differentiation initiation is most often accompanied by a change in the morphology of the colonies [19], we expected to detect a loss of pluripotency marker expression in HG cultures. Therefore, we measured protein expression levels for three pluripotency associated molecules, SSEA-1, a cell surface antigen, as well as Oct-3/4 and nanog, two transcription factors of the pluripotency factor triad that regulates the transcription of a tight network of mRNAs in undifferentiated ESCs [20]. Measurement of these markers by flow cytometry showed a slight reduction in the percentage of cells expressing nanog, Oct-3/4, and SSEA-1 in LG conditions compared to HG (Fig. 1D). This reduction was significant for SSEA-1 (p = 0.022) and Oct-3/4 (p < 0.001), but not for nanog. As expected, we found a clear nuclear localization for Oct-3/4 and membrane bound distribution of SSEA-1 when we dissected the localization of these proteins by immunofluorescence staining (Fig. 1C).
In addition to the three pluripotency markers, we also examined how many cells in the population expressed AGEs (Fig. 1D). Generally, we detected a large number of cells containing glycated proteins (around 70%–80% cells), but no significant difference was found between the two glucose concentrations (Fig. 1D).
Glucose influences the formation of bone cells
In a subsequent stage of the study, we performed an osteogenic differentiation protocol to simulate the effect of glucose on the post-implantation bone development of the embryo. Since suppression of osteogenic development may be caused by changes in osmolarity associated with higher levels of D-glucose [21], an osmotic mannitol control was included in the study (Man). As ESCs are normally maintained in HG concentrations before differentiation is induced, we also performed our experiment with cells routinely cultivated in HG before initiation of differentiation in HG, LG, or Man conditions. After 30 days of osteogenic induction several endpoint markers for bone specific differentiation were analyzed. First, we examined the culture phenotype for the appearance of black calcification, which is specifically found in ESC cultures that differentiate toward osteoblasts [17]. In bright-field microscopy a higher proportion of calcified matrix was visible in LG conditions and the osmotic control containing additional mannitol (Fig. 2A, first series). A specific histological staining using the Alizarin Red S dye was additionally used to characterize the presence of mineralized calcium deposit (Fig. 2A, second series). Again, cells differentiated in HG medium showed reduced matrix calcification characterized by a diminished staining pattern. In addition to this qualitative analysis, the amount of incorporated calcium was quantified using an absorbance-based assay (Fig. 2B) [16]. The amount of calcium was significantly decreased when cells were differentiated in a medium reflecting hyperglycemic conditions. In contrast, LG concentrations led to an over 100-fold increase in matrix calcification compared to HG conditions (p < 0.001).
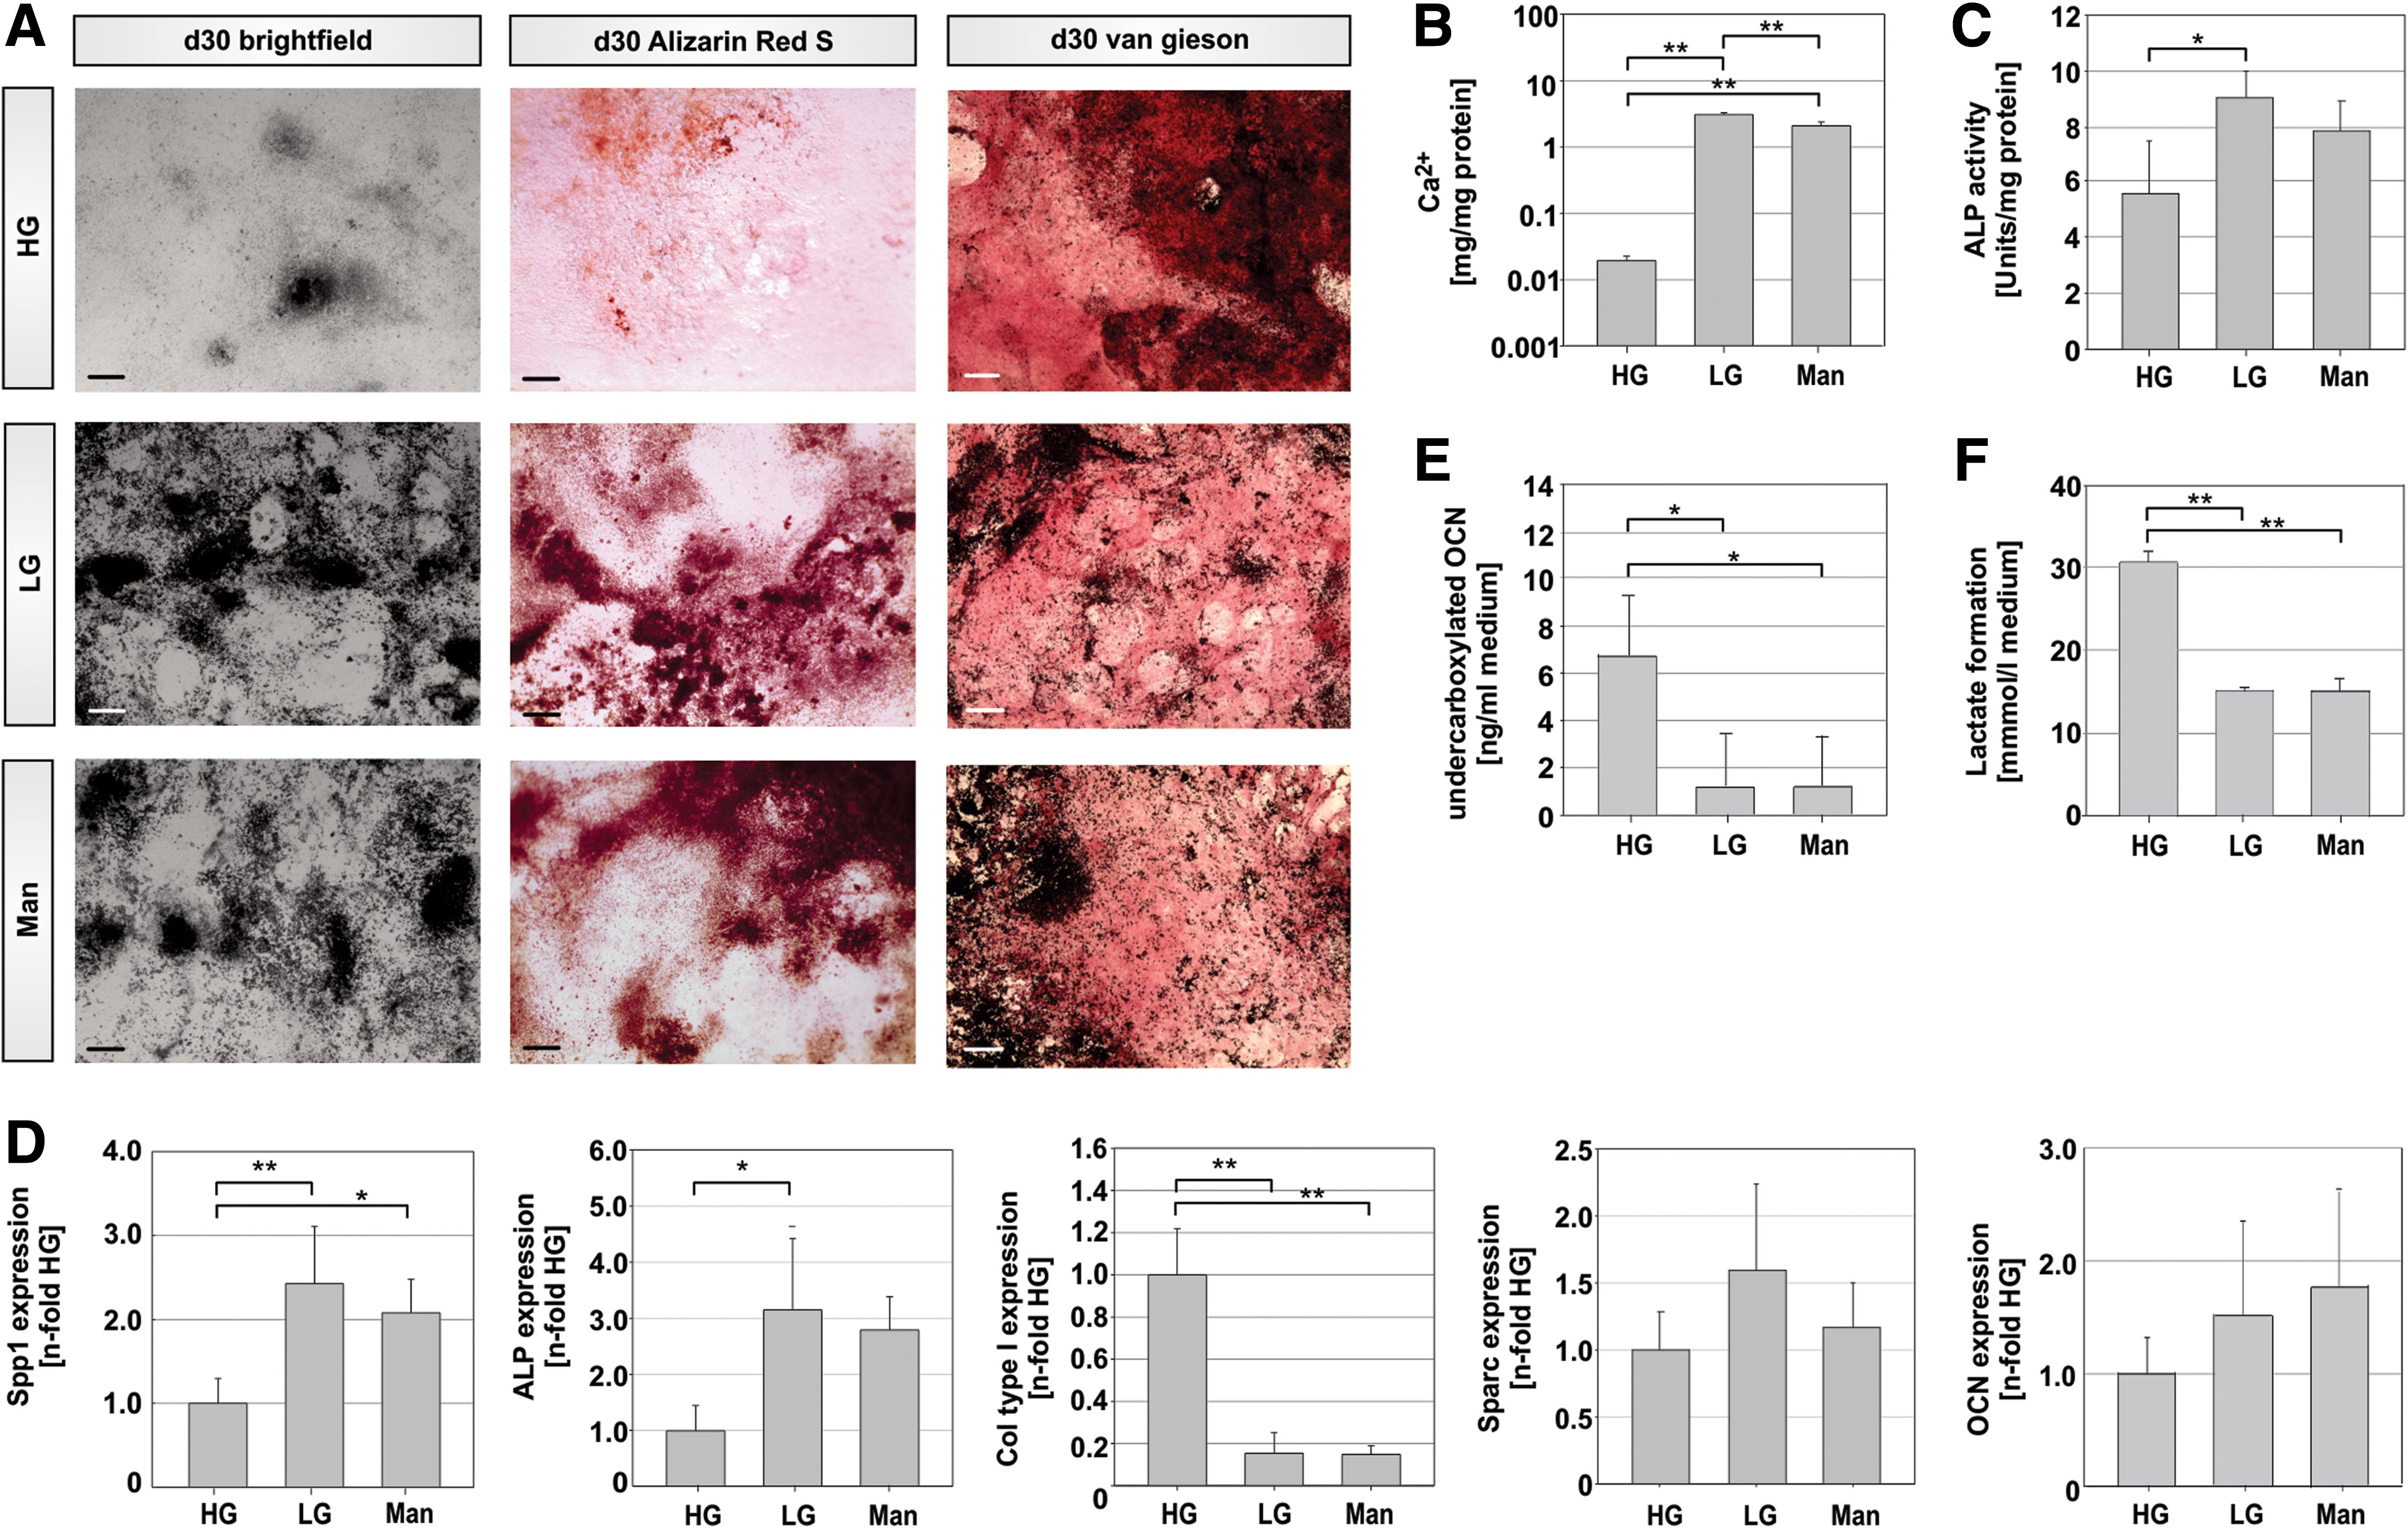
Osteoblast maturation in mESCs differentiated in high (HG) and low glucose (LG) concentrations.
While the Alizarin Red S staining and the calcium assay allow conclusions as to the calcification state of the cultures, suggesting that maturation of osteoblasts was affected in HG, they do not allow drawing conclusions as to the specification of osteoprogenitors or other prior stages of skeletal development. Therefore, a van Gieson staining was performed, which identifies secreted collagen. In bone, collagen type I (Col1) is one of the major proteins found in the extracellular matrix and is typically secreted by osteoblasts before the mineralization stage [22]. In LG- or Man-treated cultures, this staining only revealed a slight pink coloration, whereas HG cultures showed an intense red staining pattern (Fig. 2A, right series), thereby suggesting that more collagen was secreted in HG cultures.
Next, the activity of ALP was measured. This enzyme is expressed by osteoblasts and aids in the mineralization process through cleavage of phosphate substrates, thereby providing inorganic phosphate for deposition into the extracellular matrix [23]. While ALP activity found for HG cultures was at 5.6 U/mg total protein, values were 1.6-fold higher in LG (8.98 U/mg, p = 0.04) (Fig. 2C).
Analysis of expression of osteoblast-specific mRNAs revealed a significantly increased expression of ALP and osteopontin (Spp1) when cells were differentiated in LG concentrations (Fig. 2D). This was in line with the trend seen with the Ca2+ assay and for ALP activity (Fig. 2B, C), suggesting an increased osteoblast differentiation in LG and Man conditions. In contrast, Col1 mRNA expression was downregulated in LG and enhanced in hyperglycemic concentrations, as shown in Fig. 2D, confirming the result obtained with the van Gieson staining (Fig. 2A, right series). No difference was found in the mRNA expression for osteonectin (Sparc) and osteocalcin. Although a slight increase in expression of both mRNAs was noted in LG and Man conditions, this difference was not statistically significant (Fig. 2D).
As osteocalcin functions not only as an extracellular matrix protein in the bone, but also as an endocrine regulator of metabolism, we checked the formation of free circulating undercarboxylated protein. In HG an increased formation of metabolically active undercarboxylated osteocalcin was detected in comparison to LG- or Man-treated cultures (Fig. 2E). While performing this experimental series, we further noticed a rapid color change in the medium of the HG cultures suggesting a shift to a more acidic pH. To analyze this observation quantitatively, we therefore measured the pH of the cultures (Fig. 1F). We detected an acidic pH of 6.66 ± 0.067 in HG cultures (p < 0.05), whereas LG or Man conditions provided a more basic environment for the differentiating cells (pH = 7.97 ± 0.17 and 7.98 ± 0.15, respectively). This decrease in pH was accompanied by a significantly increased secretion of lactate (p < 0.001; Fig. 1F).
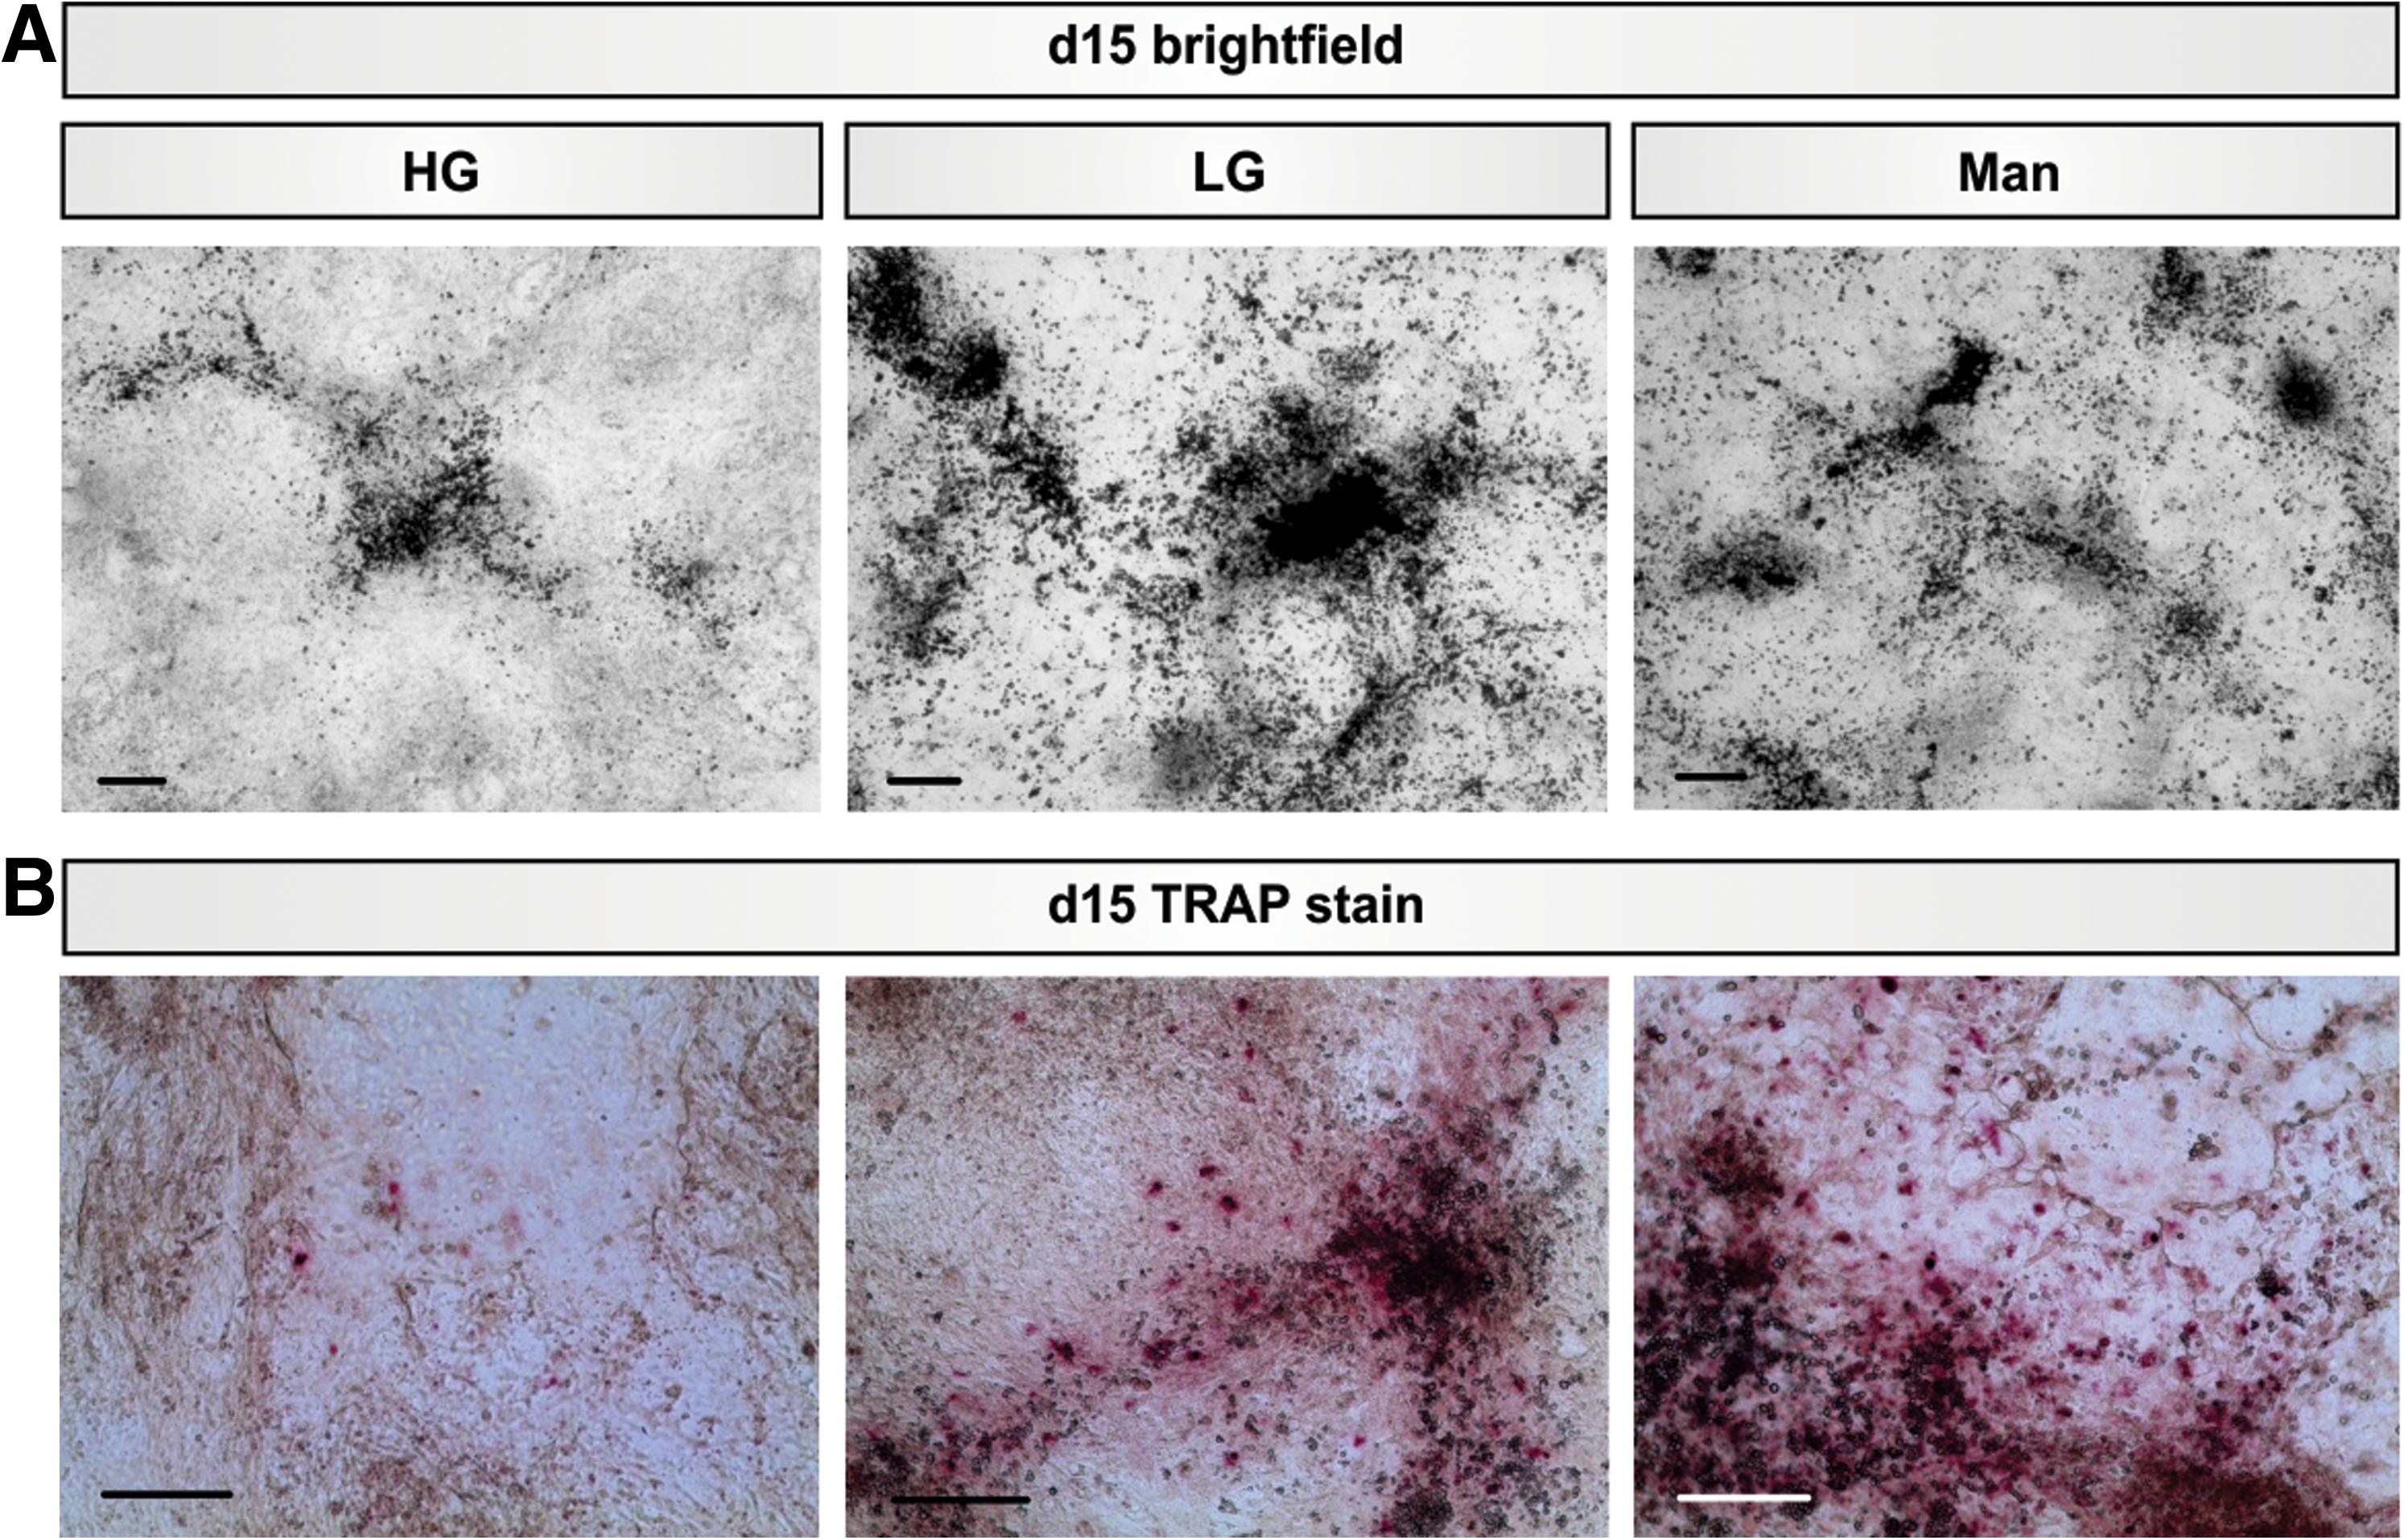
Aside from defective osteoblast function, altered activity of the osteoclast may also contribute to low bone mass and mineralization defects. Due to their diverse embryonic origin, osteoblasts and osteoclasts may seldom be investigated in one single cellular in vitro model. In fact, due to their pluripotent nature ESCs are the only cell type that is capable of being differentiated into osteoblasts and osteoclasts simultaneously using one single inducer, vitamin D3 [24]. Hence, we have also examined the osteoclast content in the different glucose concentrations. As TRAP is known as a specific marker for osteoclasts, we confirmed the generation of TRAP+ cells with a cell-specific TRAP stain and by measuring TRAP activity. Similar to the TRAP staining, which revealed an increased presence of positive cells in LG and Man (Fig. 3A), LG cultures showed a 1.2-fold higher TRAP activity than HG cultures (Fig. 3B). This trend was also noted in the mRNA levels of TRAP and other osteoclast-specific genes. The mRNAs for TRAP, CathepsinK (CtsK), and the Calcitonin receptor (Calcr) showed decreased expression when cells were differentiated in HG concentrations (Fig. 3C, D). This reduction was independent of osmotic stress, as Man-treated controls also showed an augmented expression as seen in LG concentrations. Interestingly, the formation of TRAP+ cells, TRAP activity, and TRAP mRNA expression was significantly greater in osmotic controls compared to LG differentiations (Man, Fig. 3A–C). In addition, matrix calcification is significantly lower in these conditions (Fig. 2B). In conclusion, a decrease in osteoblast formation and an impairment in the development of TRAP+ cells and their function was shown here. In addition, we reported a decrease in the calcification of cultures differentiated in hyperglycemic conditions.
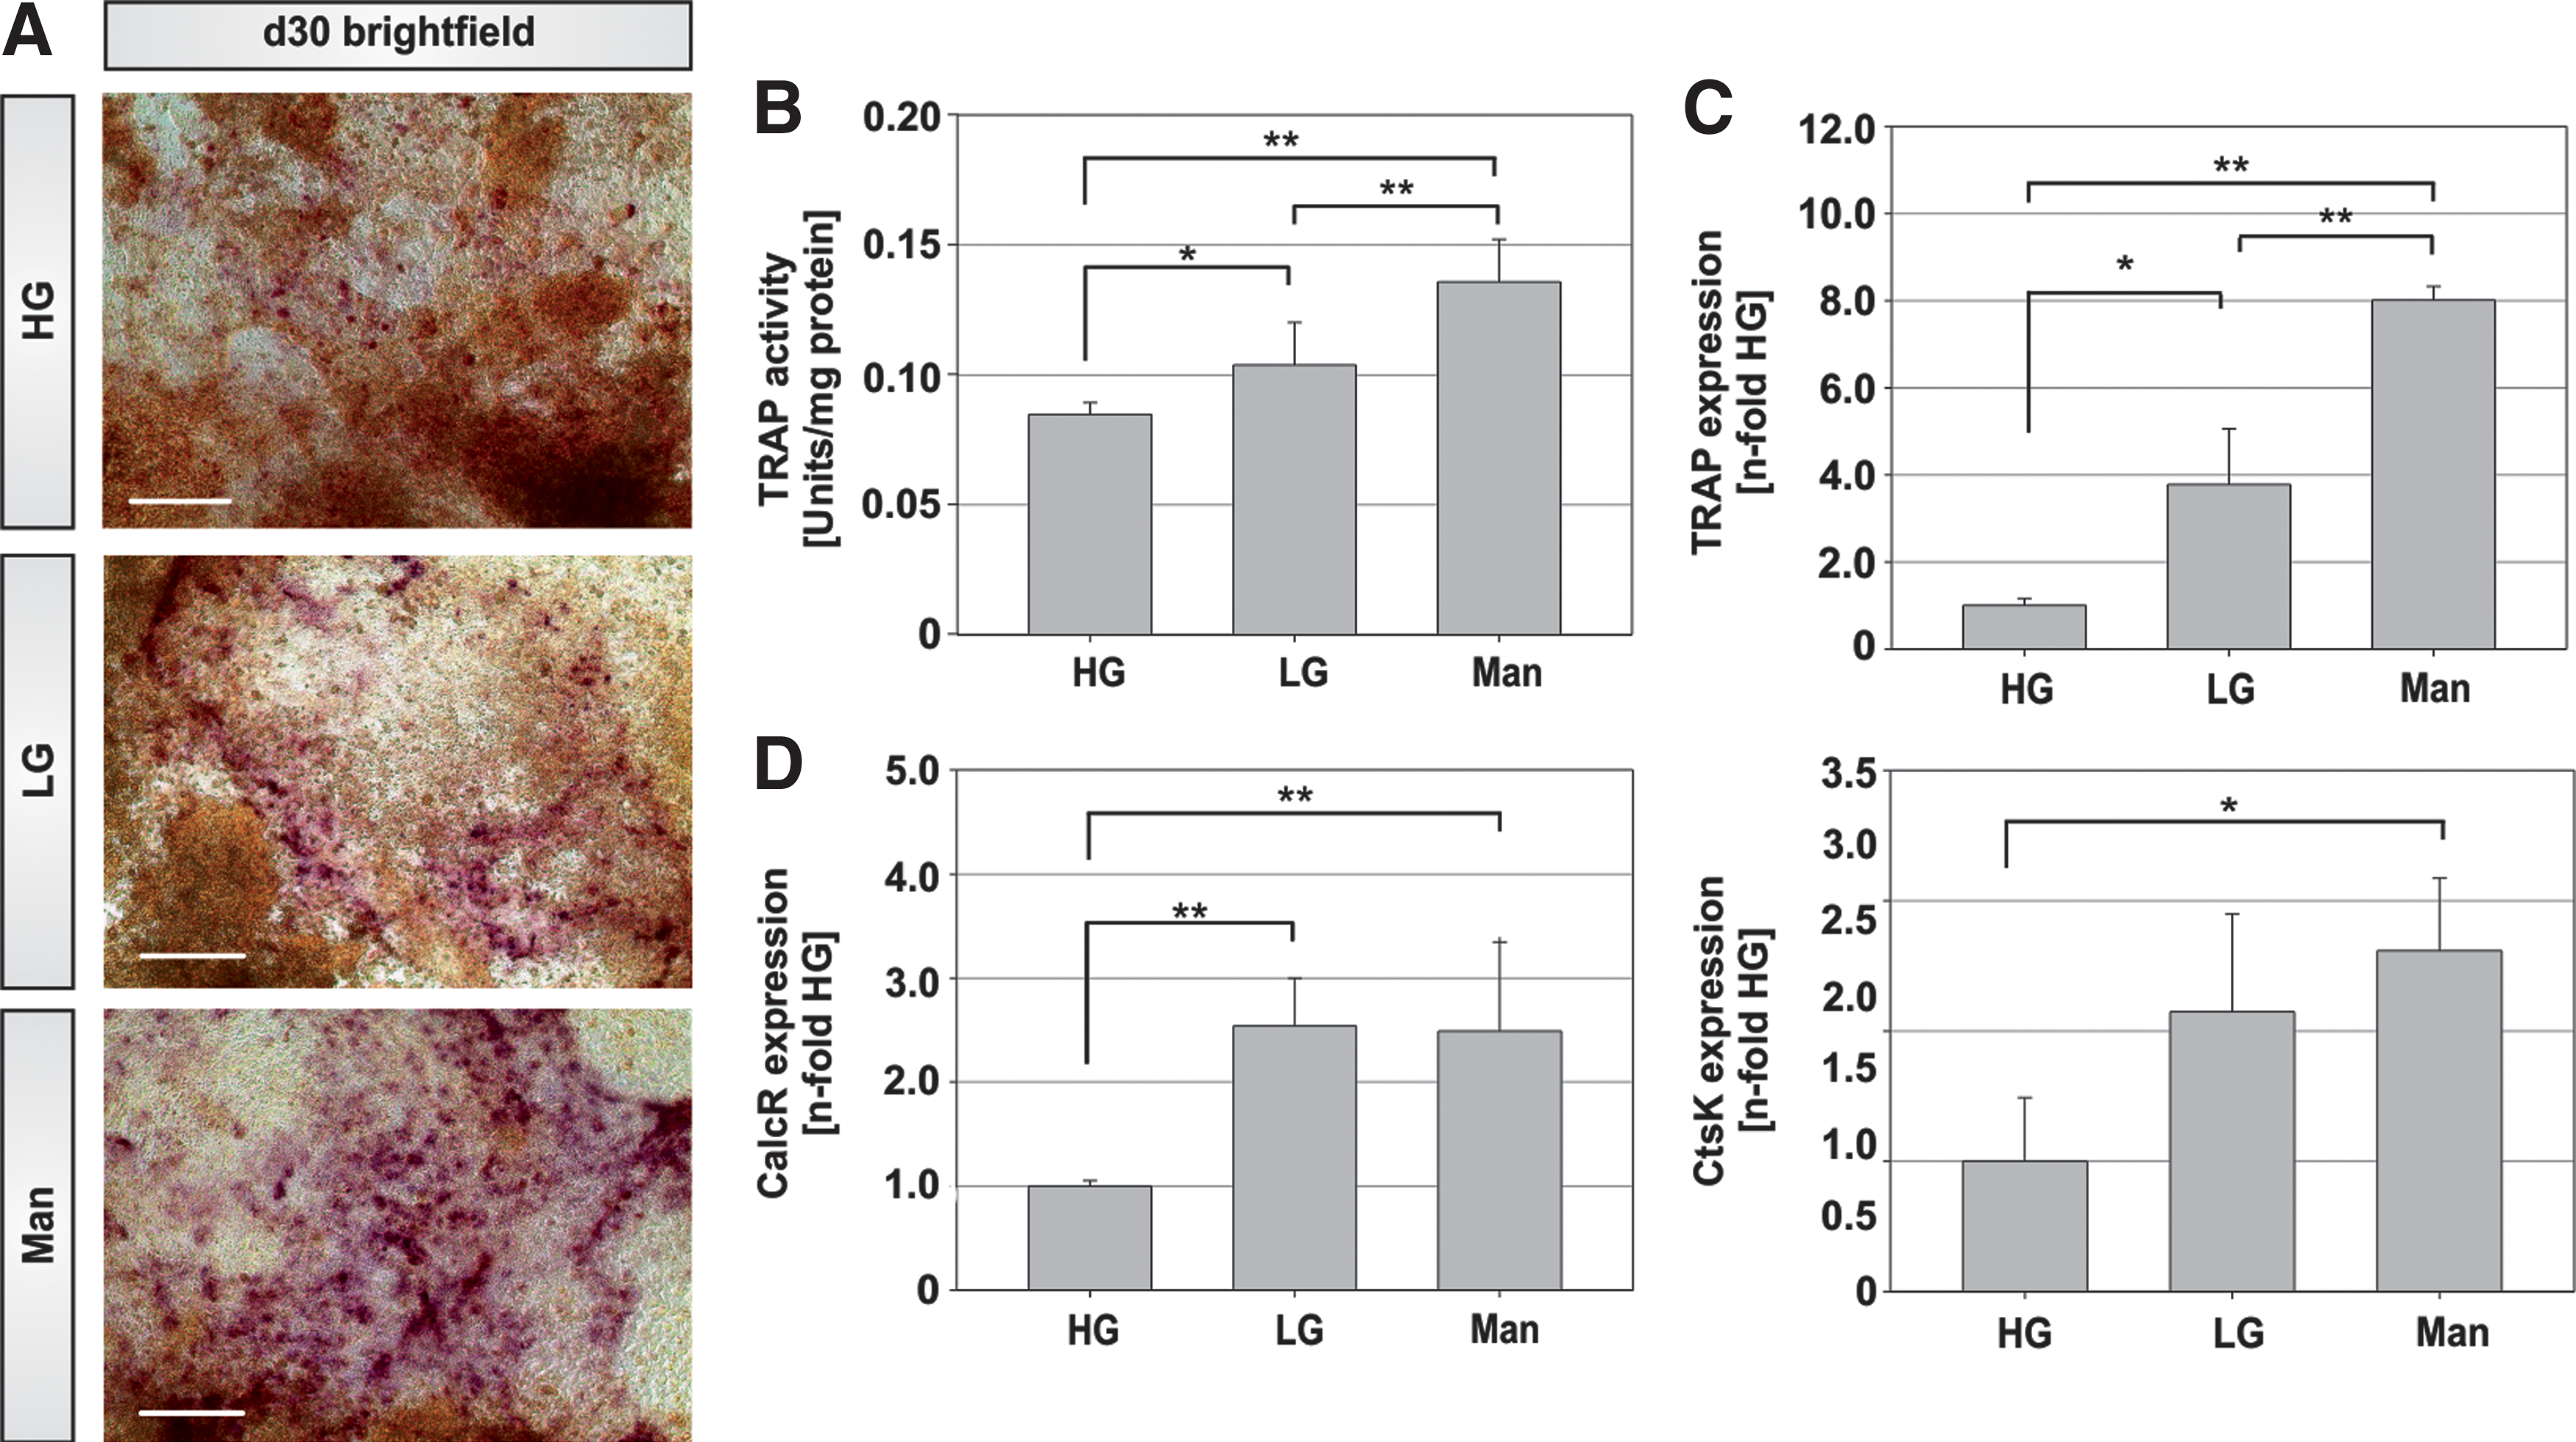
Osteoclast development in differentiating mESCs is dependent on glucose concentrations.
While these experiments so far indicated that adverse effects of maternal diabetic glucose levels on bone tissue would exist in gestating mice, the aim of the study was to show that similar observations can be made in primate species, including humans. To prove transferability of the data to higher mammalian species, a differentiation study was performed with rhesus ESCs. As seen in the mouse model, cells differentiated in LG and Man conditions showed an increased matrix calcification over cells cultured in hyperglycemic conditions (Fig. 4A). Moreover, the formation of TRAP+ osteoclasts was increased in physiological glucose concentrations and the respective osmotic control in comparison to diabetic glucose concentrations (Fig. 4B). In summary, these results are in line with the findings obtained from mESCs.
Diabetic glucose concentrations impair osteoblast and osteoclast differentiation in rhesus ESCs.
Discussion
In the present study we analyzed the effect of glucose on maintenance and osteogenic differentiation of ESCs, to characterize the impact of diabetic glucose levels on embryonic bone formation. We were able to show that decreasing the glucose concentration led to an increased calcification caused by osteoblasts and an enhanced differentiation into TRAP+ cells. ESCs are routinely cultured in HG-containing medium, and therefore they are continuously exposed to diabetic glucose levels. Similar to the impact of glucose on differentiation, we also report here that pluripotency of ESCs was affected by HG. Han and colleagues had previously shown that short-term incubation (12 h) of mESCs in HG accelerated cell cycle progression and ultimately increased cell proliferation [12]. However, it has been previously shown that the derivation of ESC lines from mouse blastocysts is less efficient under diabetic glucose conditions [25]. Dissecting the pluripotent state after cultivation of mESCs in different glucose concentrations, it was evident that cultures grown in physiological glucose conditions showed more colonies with an undifferentiated character. We were unable to correlate this observed morphology to an increased level of pluripotency marker expression. We would have expected to find increased expression of proteins triggering the pluripotency cascade, especially since we noted a more undifferentiated morphology in LG. Instead, we found a slight reduction in pluripotency marker protein expression in LG conditions. The question is, what steady state level of pluripotency associated gene expression is necessary for the cell to obtain optimal pluripotent conditions? For Oct-4 in particular, overexpression to 1.5-fold as well as knockdown to 0.5-fold was reported to initiate differentiation of ESCs [26]. Before differentiation experiments were set up, ESCs were routinely maintained in the presence of leukemia inhibitory factor in HG conditions for ∼3–4 weeks, before cultivation for 4 passages in HG or LG concentrations, respectively. If the chronic diabetic environment during routine ESC expansion culture had increased the Oct-3/4 level before the start of this study, a reduction in Oct-3/4 expression as seen in the LG condition would speak for an enhanced pluripotent status. As a recent study treating mESCs with glucose for a short term (12 h) found no apparent difference in Oct-3/4 expression and SSEA-1 between diabetic and physiological conditions [12], it is furthermore possible that the effect on ESC maintenance observed in the present study is not directly caused by the sugar added, but mediated by adapted changes in the overall metabolism or by altered signaling pathway activities.
In addition to expression of diverse pluripotency factors, we also analyzed the cells for the presence of AGE modified proteins. It had previously been reported that undifferentiated ESCs intrinsically contain a high content of proteins modified with AGEs, which are degraded during differentiation due to upregulated activity of the 20S proteasome [27]. For our study, this would suggest that cells cultivated in high sugar concentrations would tend to have a higher amount of AGE-modified proteins, which could negatively influence cell function. This in turn could possibly lead to the spontaneous differentiation of the ESCs seen in our HG cultures. However, as we could not detect differences in the formation of AGEs between the different glucose concentrations, we have to hypothesize that this was not the case in our study.
Considering these described effects and the fact that ESCs are derived from the blastocyst stage of embryonic development, it is not surprising to find significantly lower implantation rates and higher malformation rates for blastocyst stage embryos of diabetic mothers in vivo [28].
Beside the effects on maintaining pluripotency, we also described here an impact of glucose on the osteogenic differentiation of ESCs. We were able to show that increasing the glucose concentration during differentiation leads to a reduced formation of mineralized matrix associated with downregulated ALP activity. Decreased matrix mineralization measured by the number of ossification centers and Ca and P content was also reported in fetuses from diabetic pregnant rats [29,30]. Previously, Zhen et al. have shown that differentiation of primary rat calvarial osteoblasts is reduced by cultivation in glucose concentrations between 22–44 mmol/L (4–8 g/L) [31]. Not only cellular proliferation was reduced, but also diminished osteoblast development was illustrated by decreased ALP activity and nodule formation, partially mediated by inhibition of runx2. As a key transcriptional regulator of osteoblast differentiation runx2 has been shown to induce ALP activity and expression of bone matrix protein genes [32]. Disturbance of these gene is therefore likely to lead to the said defects in osteoblast maturation. Zhen and colleagues also confirmed that the diminished pre-osteoblast activity leads to a reduced matrix calcification [31], similar to the reduction in calcification detected in HG in our study.
In addition to the disturbed matrix calcification and diminished ALP activity, we also found a decrease in mRNA expression of ALP and the osteoblast markers osteopontin, osteonectin, and osteocalcin. This is in line with previous results describing a diminished expression of several osteogenic markers in osteoblastic MG-63 cells when cultivated in hyperglycemic conditions [33]. While we found a decreased expression for all analyzed osteogenic markers in HG conditions, collagen secretion and Col1 mRNA were enhanced. HG concentrations were previously reported to promote Col1 secretion in other cell types. For instance, Li et al. have shown in several reports that HG concentrations can increase Col1 expression and secretion in distinct ligament cells [34,35]. Our data are therefore consistent with previous studies letting us believe that the bone-specific phenotypes seen in newborns of diabetic mothers may originate from insufficient maturation of osteoblast precursors. That this may be an effect specific to a particular maturation stage of development is also supported by previous data from Sugimoto's group [36]. In their experiments, calvarial MC3T3-E1 cells, which may resemble a different osteogenic commitment stage than MG-63 cells, were cultivated in a hyperglycemic medium, and no negative effect on mineralization, a final step of the osteogenic differentiation program, was found [36].
While osteoblasts are required for the formation of the bone-specific extracellular matrix, which confers the typical strength and rigidity to the tissue, they also function in the regulation of the metabolism of the entire body by influencing insulin signaling [37 –39]. It was previously reported that the undercarboxylated form of OCN can induce insulin secretion from beta-cells in vivo [40] and thereby increases cellular glucose uptake. In our study we found an enhanced formation of this bioactive form of OCN in cells differentiated in diabetic conditions. Karsenty's group reported that decarboxylation of osteocalcin is induced by an acidic pH, which is caused by H+ ions secreted into the osteoclastic resorption pits [38]. We only detected minimal formation of osteoclasts in HG, however, accompanied by a decrease in pH. Here, the lower pH seemed to be caused by an increase in lactate generation. As this high lactate formation rate could not be observed in LG concentrations or the respective osmotic control, it can be assumed that pH changes caused by intensified lactate secretion can lead to the increased decarboxylation of osteocalcin observed in the hyperglycemic conditions. As the active form of OCN can enforce insulin secretion and subsequent insulin signaling, it is possible that altered signaling pathway activation in HG is responsible for the phenotypic effects noted. As such, it has been reported that insulin signaling increases collagen protein expression in osteoblasts [41,42], which is consistent with the increased Col1 formation in HG observed here.
Whereas alterations in osteoblast function through glucose are relatively well established, previous data for the involvement of osteoclasts in the development of diabetic bone diseases are scarce. We have undoubtedly confirmed here a reduction in the formation of TRAP+ cells in hyperglycemic conditions. Although osteoclast function is reliably proven through the formation of multinucleated cells and the generation of resorption pits on a calcified substrate, this technique is difficult to establish in a cell culture system, such as the one used here, in which osteoblasts and osteoclasts differentiate simultaneously. As we have found increased expression and activity of TRAP, and noted an increase in expression of other known osteoclast specific genes, we propose that the TRAP+ cells may reflect the generation of mature osteoclasts in our cultures.
Consistent with our results, the few studies that do exist have demonstrated that HG concentrations inhibit osteoclast maturation [43,44]. As such, receptor activator for nuclear factor κB ligand (RANKL)-induced TRAP activity was maximal when murine RAW264.7 monocytic cells and bone marrow macrophages (BMMφ) were treated with 5 mM of glucose [43]. This TRAP activity gradually decreased with glucose concentrations over 5 mM accompanied by a decrease in pH at 40 mM glucose [43], a concentration higher than the diabetic concentration used here. At the mRNA level, 25 mM glucose seems to decrease RANKL-induced expression of Calcr and CtsK [44]. Furthermore, RANKL-induced responsiveness of a luciferase reporter coupled to NFKB response elements declined to near basal levels in HG-treated cells. While we have not validated the role of NFKB in ESC-osteoclastogenesis, we were able to confirm the influence of HG on Calcr and CtsK mRNA expression. As both promotors have binding sites for NFKB [45,46], it may be possible that the dysregulation of Calcr and CtsK expression that we see in the ESCs in HG conditions is caused by changes in NFKB. Interestingly, studies that used differentiated osteoclasts instead of progenitors reported an increased activity of these cells in hyperglycemic conditions instead of the decrease described here [47,48], mediated by an increased expression of the H+-ATPase in turn caused by an activation of p38 MAP kinase [48]. This, together with our study, supports the notion that glucose may only inhibit the differentiation process of osteoclasts, but not their function once mature.
In addition to the effects of the sugar molecule alone, we also found that the mRNA expression and also the activity of TRAP was increased in Man-treated cells compared to cells cultivated in LG, potentially indicating that the maturation of osteoclasts could be affected by osmotic stress. Similarly, the calcification of the Man cultures was lowered in comparison to LG, which may indicate an increased matrix degradation in the hyperosmotic controls by an elevated presence of osteoclasts.
Finally, after characterizing the formation of osteoblasts and osteoclasts from mESCs, we were able to show that primate ESCs have the same phenotypic outcome with diminished formation of both osteoblasts and osteoclasts, when differentiated in HG concentrations. Therefore, we propose that the results gained in the present publication are not species specific and can also be transferred to higher mammalian ESC lines.
Conclusion
This study showed that changes in glucose levels can influence the maintenance of ESCs and further demonstrated that hyperglycemic conditions inhibit osteoblast and osteoclast maturation as well as their functionality. The results presented here are in agreement with the clinical findings that bone diseases are a long-term side-effect of diabetes and that gestational diabetes increases the risk for skeletal maldevelopment in the newborn. While we were able to show that increased glucose levels can disturb pluripotency and differentiation of mammalian ESCs into the osteogenic lineage, it may be possible that changes in glucose concentrations would also affect the differentiation paths of other cell types generated from endo- or ectodermal precursors. This supports the fact that ESCs are a useful tool to study the development of the entire embryo in diabetic conditions in vitro.
Footnotes
Acknowledgments
This study was supported with start-up funds from the Fraunhofer Institute for Cell Therapy and Immunology to N.z.N.
Author Disclosure Statement
The authors declare no conflict of interest.