
Abstract
Sjogren's syndrome and radiotherapy for head and neck cancer result in severe xerostomia and irreversible salivary gland damage for which no effective treatment is currently available. Cell culture methods of primary human salivary gland epithelial cells (huSGs) are slow and cannot provide a sufficient number of cells. In addition, the majority of cultured huSGs are of a ductal phenotype and thus not fluid/saliva secretory cells. Some reports indicated that mesenchymal stem cells (MSCs) possessed the potential to differentiate into epithelial cells. To test this hypothesis with huSGs, a coculture system containing 2 chambers separated by a polyester membrane was used to study the capacity of human MSCs to adopt an epithelial phenotype when cocultured with human salivary gland biopsies. Results were that 20%–40% of cocultured MSCs expressed tight junction proteins [claudin-1 (CLDN-1), -2, -3, and -4; occludin; junctional adhesion molecule-A; and zonula occludens-1] as well as other epithelial markers [aquaporin-5, α-amylase (α-AMY), and E-cadherin], and generated a higher transepithelial electrical resistance. Electron microscopy demonstrated that these MSCs had comparable cellular structures to huSGs, such as tight junction structures and numerous secretory granules. Quantitative real time (RT)-polymerase chain reaction revealed an upregulation of several salivary genes (aquaporin-5, AMY, and CLDN-2). Moreover, the amounts of α-AMY detected in cocultured MSCs were comparable to those detected in huSGs control cultures. These data suggest that cocultured MSCs can demonstrate a temporary change into a salivary gland acinar phenotype.
Introduction
S
Materials and Methods
MSC culture
Human MSCs from bone marrow were purchased from Cambrex. As indicated by the company, MSCs were from 5 healthy adult donors (3 men and 2 women; age between 20 and 35 years). These cells were defined as MSCs based on magnetic-activated cell sorting by Cambrex, which reported a purity of 90%–95% cells positive for cluster of differentiation (CD)44, CD73, CD105, and CD166. Cells were initially thawed and expanded in T-75 tissue culture flasks containing 15 mL of the MesenCult MSC basal medium and its stimulatory supplements (MesenCult Proliferation Kit; Stem Cell Technologies). The flasks were incubated in 5% CO2 at 37°C. Half of the medium was changed every 3–4 days until cells reached 80%–90% confluence. MSCs were passaged using 0.05% trypsin–ethylene diamine tetraacetic acid (Gibco, Invitrogen). Cells used in the current experiments were between passages 5 and 11.
Source of salivary glands
We were permitted by the Institutional Review Board at McGill University to receive human salivary tissues. Biopsies of human parotid (n = 3) and submandibular glands (n = 7) were received from either the Cooperative Human Tissue Network (University of Virginia, Charlottesville, VA) or from the Royal Victoria Hospital (Montreal, Quebec). Salivary glands were from 6 men and 4 women (age range, 20–73 years). These patients did not receive radiotherapy or chemotherapy before surgery. We receive salivary tissues that were removed as part of the surgical dissection to remove head and neck tumors (such as melanoma or oral squamous cell carcinoma). At the time of excision, the pathologist identified an area where a piece of healthy salivary tissue can be donated for our research. The tissue was shipped overnight to us for cell culture experiments. The pathologist would subsequently perform a histological examination on the remaining part of that salivary gland and send us a report indicating that the excised salivary gland was judged as normal tissues.
Culture of huSGs
Salivary biopsies (0.5–1.5 g) were prepared as previously described [5]. In brief, they were mechanically minced with a pair of curved scissors, dissociated enzymatically, and cell pellet filtered through a 70 μm strainer. huSGs were cultured in the serum-free Hepato-STIM medium supplemented with 500 U/mL penicillin/streptomycin, 12.5 μg/mL Fungizone, and 1% glutamine (BD Biosciences Discovery Labware).
MSCs cocultured with huSGs
All coculture experiments were performed using the Transwell-Clear system 12-well or 24-well plates (Corning Life Sciences) and in the Hepato-STIM medium. MSCs (2 × 10⁴ cells/cm2) were cultured in the upper Transwell chamber (i.e., on the polyester membrane) and huSGs (6 × 10⁴ cell/cm2) in the lower chamber. This porous membrane of clear polyester allowed visual examination of MSCs under light microscope. The polyester membrane had pores of 0.4 μm and allowed for the passage of soluble factors between MSCs and huSGs, but did not allow cells to migrate from one chamber to the other. Thus, MSCs and huSGs were physically separated by a barrier (no cell-to-cell contact). As controls, a group of Transwell plates had MSCs (from each of the 5 healthy donors) cultured alone, whereas other plates had huSGs (from each of the 10 patients) cultured alone. All control cultures had the same cell seeding density and amount of the serum-free Hepato-STIM medium as the cocultured ones. Cocultures and control cultures were analyzed at several time points: 1, 2, 3, 5, 7, 9, and 14 days. We received small pieces of salivary tissues from the 10 biopsies and had insufficient cell numbers to cocultured with each of the 5 MSC donors. Therefore, each huSG was cocultured randomly with MSCs from 2 of the 5 patients. This resulted in 20 sets of huSG-MSC cocultures.
Osteogenic differentiation
MSCs used, between passages 5 and 11, were cultured in a 6-well plate (2 × 10⁴ cell/cm2) with an osteogenic medium consisting of Dulbecco's modified Eagle's medium/F-12 supplemented with 10% fetal bovine serum (Hyclone), 10 nM dexamethasone, 5 μg/mL sodium ascorbate-2phosphate, 10 mM β-glycerol-phosphate, and 100 U penicillin/100 μg streptomycin/0.25 μg Fungizone. Cultures were fed with a fresh medium every 3 days. After 21 days, the medium was removed. Cells were washed with 0.09% NaCl and fixed in 70% ethanol. Afterward, cells were incubated in von Kossa stain (1% wt/vol silver nitrate solution; Sigma Aldrich) and developed under direct light for 60 min.
Immunostaining and confocal microscopy
At day 7, huSGs and MSCs were fixed with 10% paraformaldehyde, and permeabilized with methanol and 0.2% Triton X-100. These antibodies were tested on huSGs and MSCs: rabbit anti-claudin-1 (CLDN-1), CLDN-2, CLDN-3, Occludin, junctional adhesion molecule-A (JAM-A), mouse anti-zonula occludens-1 (ZO-1), and CLDN-4 (Zymed); mouse anti-Vimentin and anti-E-cadherin (Invitrogen); goat anti-aquaporin-5 (AQP-5) (Santa Cruz); and rabbit anti-α-amylase (α-AMY) (Sigma Aldrich). For control cultures of MSCs, additional antibodies were used to verify that they were still MSCs during passages 5–11: positive for anti-Stro-1, anti-CD90, anti-CD106, anti-CD105, anti-CD146, anti-CD166, and anti-CD44, and negative for anti-CD19 and anti-CD45. As negative controls for immunofluorescent staining, we used goat (R&D Systems), rabbit, and mouse (Zymed Labs) isotype control antibodies. Cells were incubated with the primary antibodies (dilution 1:100) or with the isotype control antibodies overnight at 4°C. Secondary antibodies were either donkey anti-mouse, or anti-rabbit, or anti-goat Rhodamine Red-X-conjugated (Jackson ImmunoResearch) for 1h at room temperature (dilution 1:100). Finally, 4′,6-diamidino-2-phenylindole,dihydrochloride (Invitrogen) was added for 3–5 min. The polyester membranes (on which MSCs were cultured) were then cut-off from the Transwell chamber inserts using a scalpel blade and mounted on microscope glass slides using a fine surgical tweezers. Fluorescence images were taken using a Zeiss LSM 510 laser scanning confocal microscope (Jena). Images shown are representative of at least 3 separate experiments with multiple images taken per slide.
Measurements of transepithelial electrical resistance
Epithelial cells with a primary secretory function, such as in salivary glands, must be polarized to achieve a unidirectional secretion. Tight junctions (TJs) are the primary structure that forms a barrier between the apical and basal region of the cell. A measure of epithelial barrier function associated with TJ formation is the generation of a transepithelial electrical resistance (TER) across a cellular monolayer. TER was measured as described previously [5]. TER was measured at days 7 and 14 of coculture in 6 separate determinations.
Western blot analysis
To remove the possibility that the α-AMY detected on Western blot membranes originated from huSGs (both intracellular and secreted into the cultured medium), the Transwell inserts containing MSCs were removed from the Transwell system at 1, 3, 5, and 7 days of coculture, washed 3 times with a new medium, and then transferred into a new Transwell system that had no huSGs cultured below. These newly transferred Transwell chambers (containing only MSCs) were allowed to expand in the Hepato-STIM medium for an additional amount of time, comparable to their former cocultured times (1, 3, 5, and 7 additional days). These MSCs and their conditioned media were then collected and analyzed for the quantity of α-AMY produced. As positive controls for the amount of α-AMY in cell lysates and conditioned media, huSGs were grown alone in Transwells using Hepato-STIM media for the same time intervals (1, 3, 5, and 7 days). As negative controls, MSCs were grown alone in Transwells using Hepato-STIM media for these same time intervals. All cells and their media were collected separately and analyzed by Western blot. MSCs and huSGs from control and cocultures were lysed in 200 μL/well of cold RIPA buffer. Lysates or conditioned media were collected and centrifuged at 10,000 g for 20 min to pellet the cell debris and keep the supernatants for further analysis. Protein concentrations of all preparations were determined with a bichinchonic acid (BCA) protein assay kit (Pierce Biotechnology, Rockford, IL). Protein samples (30 μg each) were subjected to 10% sodium dodecyl sulfate–polyacrylamide gel electrophoresis on mini-gels and transferred to nitrocellulose membranes. Membranes were blocked for 1 h with 5% fat-free dry milk in Tris-buffered saline [0.137 M NaCl and 0.025 M Tris (hydroxymethyl)-aminomethane, pH 7.4] containing 0.1% Tween-20 (TBST) and incubated overnight with rabbit anti-α-AMY antibody (1:2,000 dilution; Sigma Aldrich) at 4°C in TBST containing 5% bovine serum albumin and 0.02% sodium azide. We used nonimmune rabbit (Zymed Labs) isotype control antibody. Membranes were washed 3 times for 15 min each with TBST and incubated with horseradish peroxidase-conjugated goat anti-rabbit IgG antibody (1:5,000 dilution; Santa Cruz Biotechnology) at room temperature for 1 h. A chemiluminescence detection reagent containing 20 mM Tris buffer (pH 8.5), 250 mM Luminol, and 90 mM coumaric acid (Sigma Aldrich) was then used. Protein bands were observed on X-ray film. The surface area occupied by the protein bands was scanned and quantified using ImageJ software (NIH). All experiments were performed in duplicate and repeated at least 3 separate times.
Transmission electron microscopy
MSCs and huSGs from cocultures and control cultures were fixed at several time intervals (days 1, 3, 5, 7, 9, and 14) in 2% formaldehyde, 2% glutaraldehyde, 0.1 M cacodylate buffer (pH 7.4), 1% osmium tetroxide, and embedded in Epon812 (Electron Microscopy Sciences). Thin sections (70 nm) were cut and mounted onto copper grids. Grids were stained with 3% uranyl acetate and 2% lead citrate, and then examined at various magnifications using a 100-CXII transmission electron microscopy (TEM, JEOL) at an accelerating voltage of 120 kV.
Quantitative real-time polymerase chain reaction
Total RNA was isolated from MSCs and huSGs at days 1, 2, 3, 5, 7, and 9 using the RNeasy micro kit (Qiagen Ltd.) with in-column DNase digestion. The concentration of RNA was determined using Qubit (Molecular Probes). Total RNA (2 μg per sample) was reverse transcribed using the high-capacity cDNA Archive Kit (Applied Biosystems) in 20 μL volume. For polymerase chain reaction (PCR) amplification, 5% of the cDNA was used with real-time PCR primers and 6-carboxy-fluorescein (FAM)-labeled minor groove binder probes. The probes and primers for AQP-5, α-AMY, CLDN-2, and glyceraldehyde 3-phosphate dehydrogenase (GAPDH, housekeeping gene) were selected from the Applied Biosystems database. PCRs (20 μL) were performed in duplicates using TaqMan Universal Master Mix (Applied Biosystems) on a Prism Sequence Detection System 7500 (Applied Biosystems) with the default settings (50°C for 2 min, 95°C for 10 min, and 40 cycles of 95°C for 15 s and 60°C for 1 min). Gene expression levels were calculated by normalizing the target RNA value to GAPDH and reported as fold-changes in gene expression relative to control huSGs cultured for 9 days (as these samples expressed the lowest levels of the target genes tested). Results were from 5 patients for MSC controls and cocultures, and from 10 patients for huSG cocultures. Results shown were an average of 5 replicates from each experiment.
Statistical analysis
Data are presented as means ± standard error of the means of results from 3 or more separate experiments. Our data were analyzed by ANOVA, where P value <0.05 represents significant differences between groups at specified times. Cell percentages presented in this study were determined upon examination of at least 1,000 cells per slide, copper grid, or polyester filter.
Results
Cell morphology of MSCs and huSGs in cocultures
MSCs in control cultures showed typical fibroblast-like appearance (Fig. 1A). Within 24 h, 40% of cocultured MSCs lost their fibroblast appearance and aggregates of 6–10 cells started to form (Fig. 1B). These cell aggregates grew in size and resembled salivary-like acinar units (starting from day 3) connected to fibroblast-like strings (Fig. 1C). huSGs in cocultures retained their usual round, oval, and polygonal shape (Fig. 1D). Results were comparable between gland types (parotid vs. submandibular glands) and gender of the patients. As for the age of the patients, we noticed no differences between the 5 MSCs healthy donors (20–35 years). However, from the 10 patients who donated their glands, huSGs derived from older patients (60–73 years) were slower to attach and took longer time to become confluent when compared to those from younger patients (20–52 years).
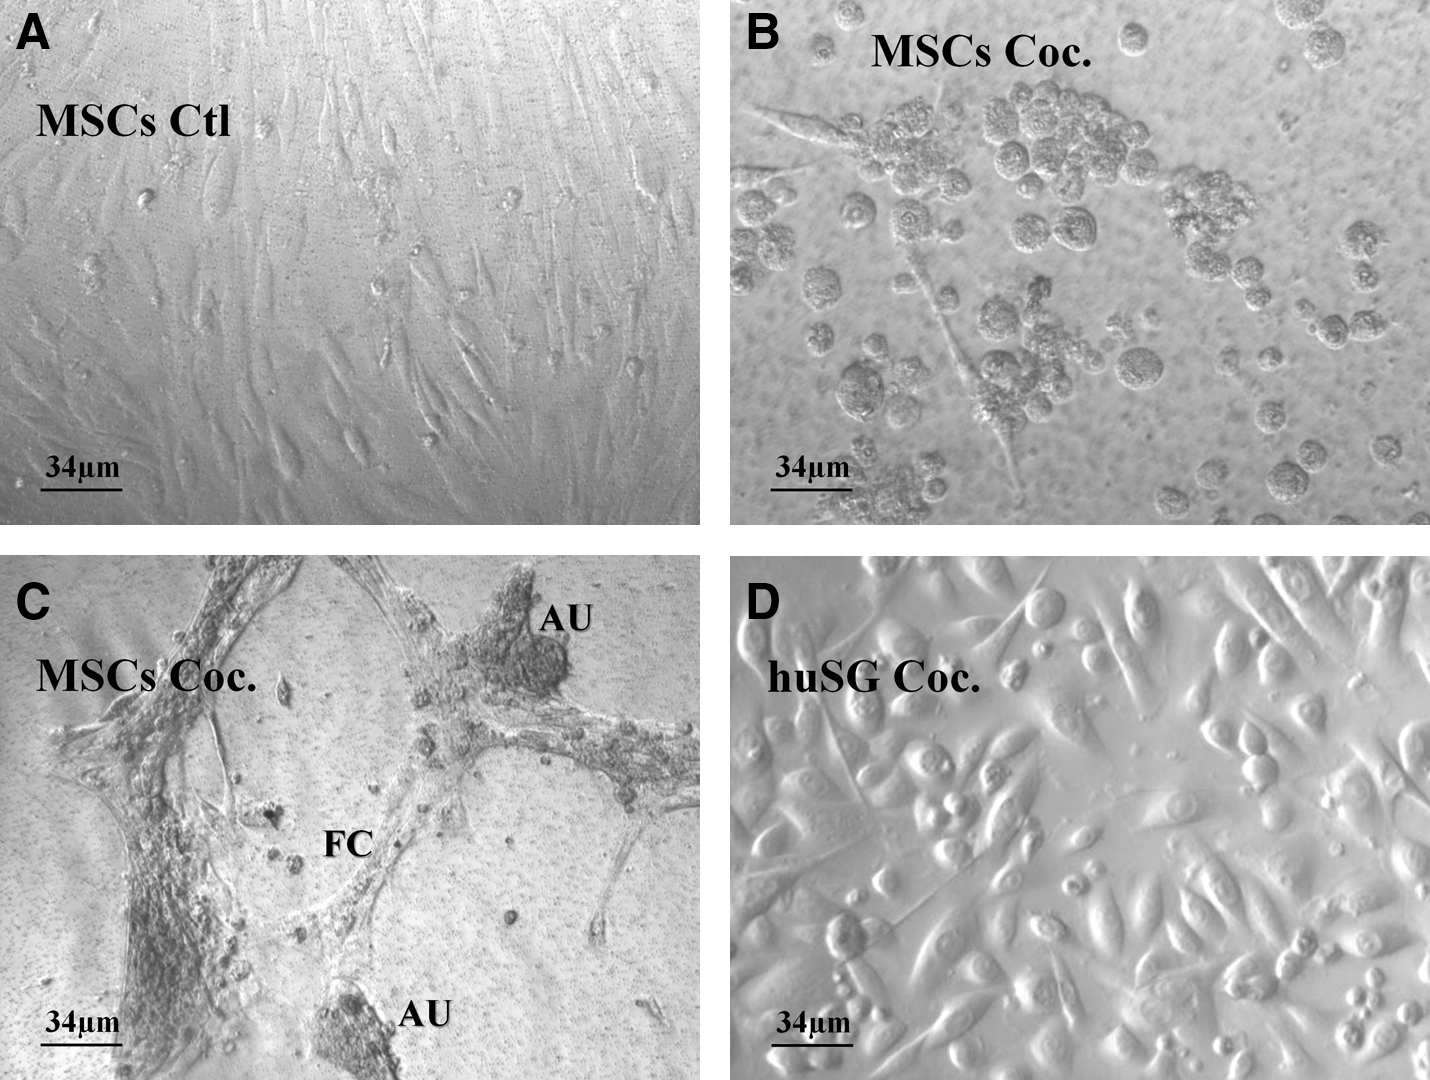
Light micrograph of
MSCs used in our experiments were considered MSCs as they were preliminary-sorted by Cambrex using magnetic-activated cell sorting for CD44, CD73, CD105, and CD166. We continued to verify their MSC identity between passages 5 and 11 by immunofluorescence staining using a panel of markers to define MSCs (from R&D Systems; Cat. no. SC017). We found 95%–97% cells used in our experiments were positive to all MSC markers tested. Specifically, they were positive for Stro-1 (96% ± 2%), CD90 (95% ± 2%), CD106 (95% ± 1%), CD105 (97% ± 1%), CD146 (95% ± 3%), CD44 (97% ± 2%), and CD166 (96% ± 1%), and negative for CD19 (0%) and CD45 (0%). These results were determined from a count of at least 1,000 cells.
For this study, we showed the ability of MSCs to differentiate into osteoblasts and into salivary epithelial cells to make the point that the cells tested (MSCs) were indeed MSCs (and not epithelial cells initially). In the osteogenic differentiation media, MSCs changed their morphology from spindle-shaped to cubical accompanied by mineral deposition. Approximately 50%–60% of MSCs were positive to von Kossa stain. The calcium phosphate formed in MSCs precipitated along the cell membrane and showed as black aggregated particles in the extracellular matrix even after 10 passages in culture (Supplementary Fig. S1; Supplementary Data are available online at
Formation of a functional epithelial barrier by a proportion of cocultured MSCs
Salivary cells have the ability to form an epithelial barrier; this is not a characteristic of fibroblasts or MSCs. TJs are the primary structure forming that barrier. Using immunofluorescence microscopy, we detected several key TJ proteins (e.g., CLDN-1, -2, -3, and -4; occludin; JAM-A; and ZO-1) in 20%–40% of MSCs cocultured in Transwell system (Table 1 and Fig. 2). Confocal microscopy demonstrated that TJs were correctly localized on the lateral sides of MSCs (Fig. 2).
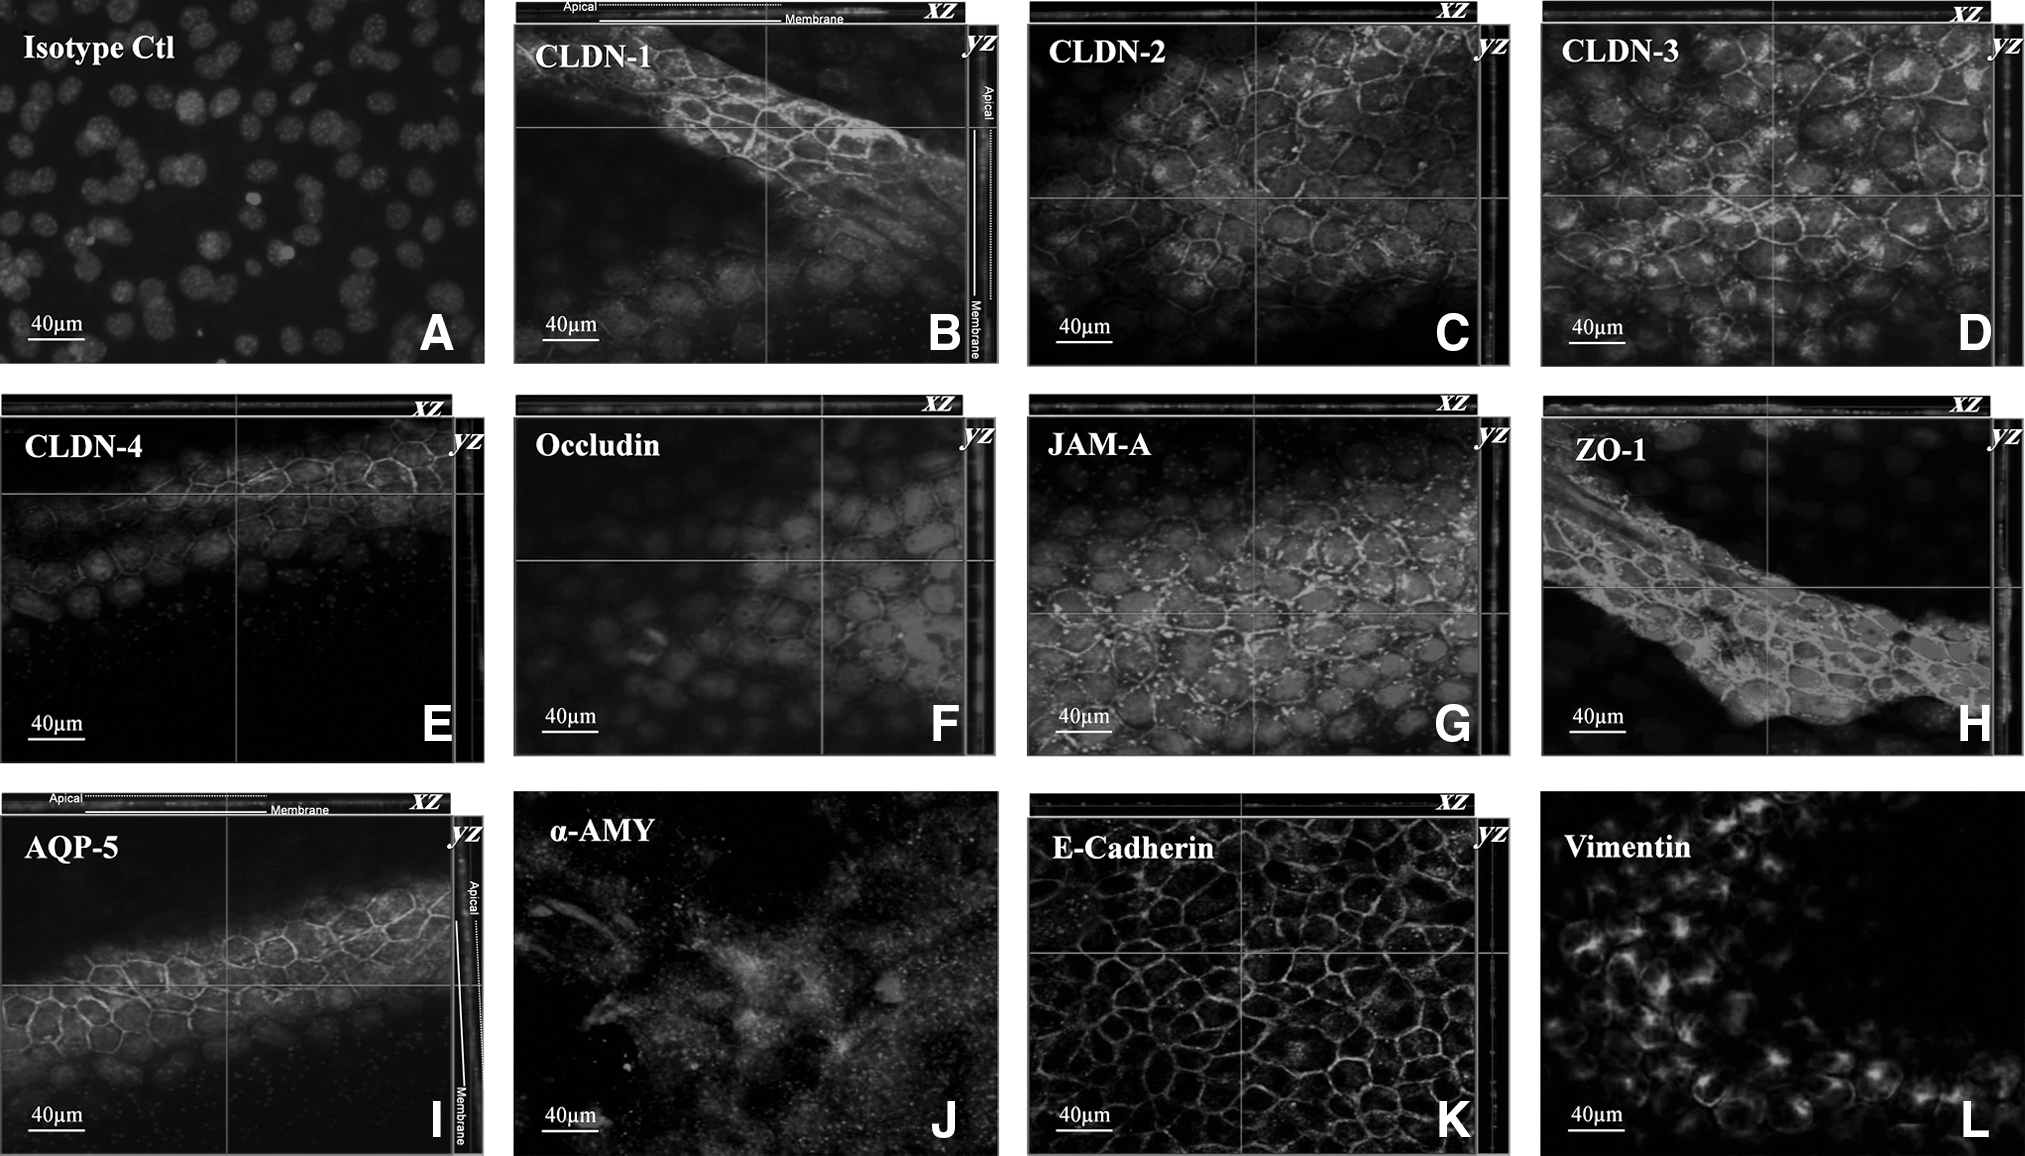
Confocal micrographs of MSCs cocultured for 7 days.
Results show that 20%–40% of MSCs in cocultures expressed epithelial salivary markers. Results are reported in percentile ± standard error of the means from the count of at least 5 slides and 1,000 cells per patient. TJ proteins: CLDN-1, -2, -3, and -4; occludin; JAM-A; and ZO-1. α-AMY, a marker for salivary serous cells; AQP-5, a marker for a water channel in salivary acinar cells; vimentin, a marker for mesenchymal cells (some immature salivary cells are also positive for vimentin); E-cadherin, a marker for epithelial cells.
α-AMY, α-amylase; AQP-5, aquaporin-5; CLDN, claudin; huSG, human salivary gland epithelial cells; JAM-A, junctional adhesion molecule-A; MSCs, mesenchymal stem cells; TJ, tight junction; ZO-1, zonula occludens-1.
We compared TERs of MSCs in cocultures with those of huSGs and MSCs from control cultures. huSGs were used here as a positive control because these cells express TJ proteins and modestly high TERs. MSCs in control cultures were used as a negative control, because they do not express key TJ proteins and exhibit low TER values. Cocultured MSCs exhibited TERs of 126 and 169 Ω cm2 at days 7 and 14, respectively. These TERs were significantly different (P < 0.05) from control MSCs, which had TERs below 12 Ω cm2 (Fig. 3). TERs of huSG cells were higher (376 and 464 Ω cm2) than those of cocultured MSCs. However, as only 20%–40% of MSCs were detected with TJs, these results explained this difference.
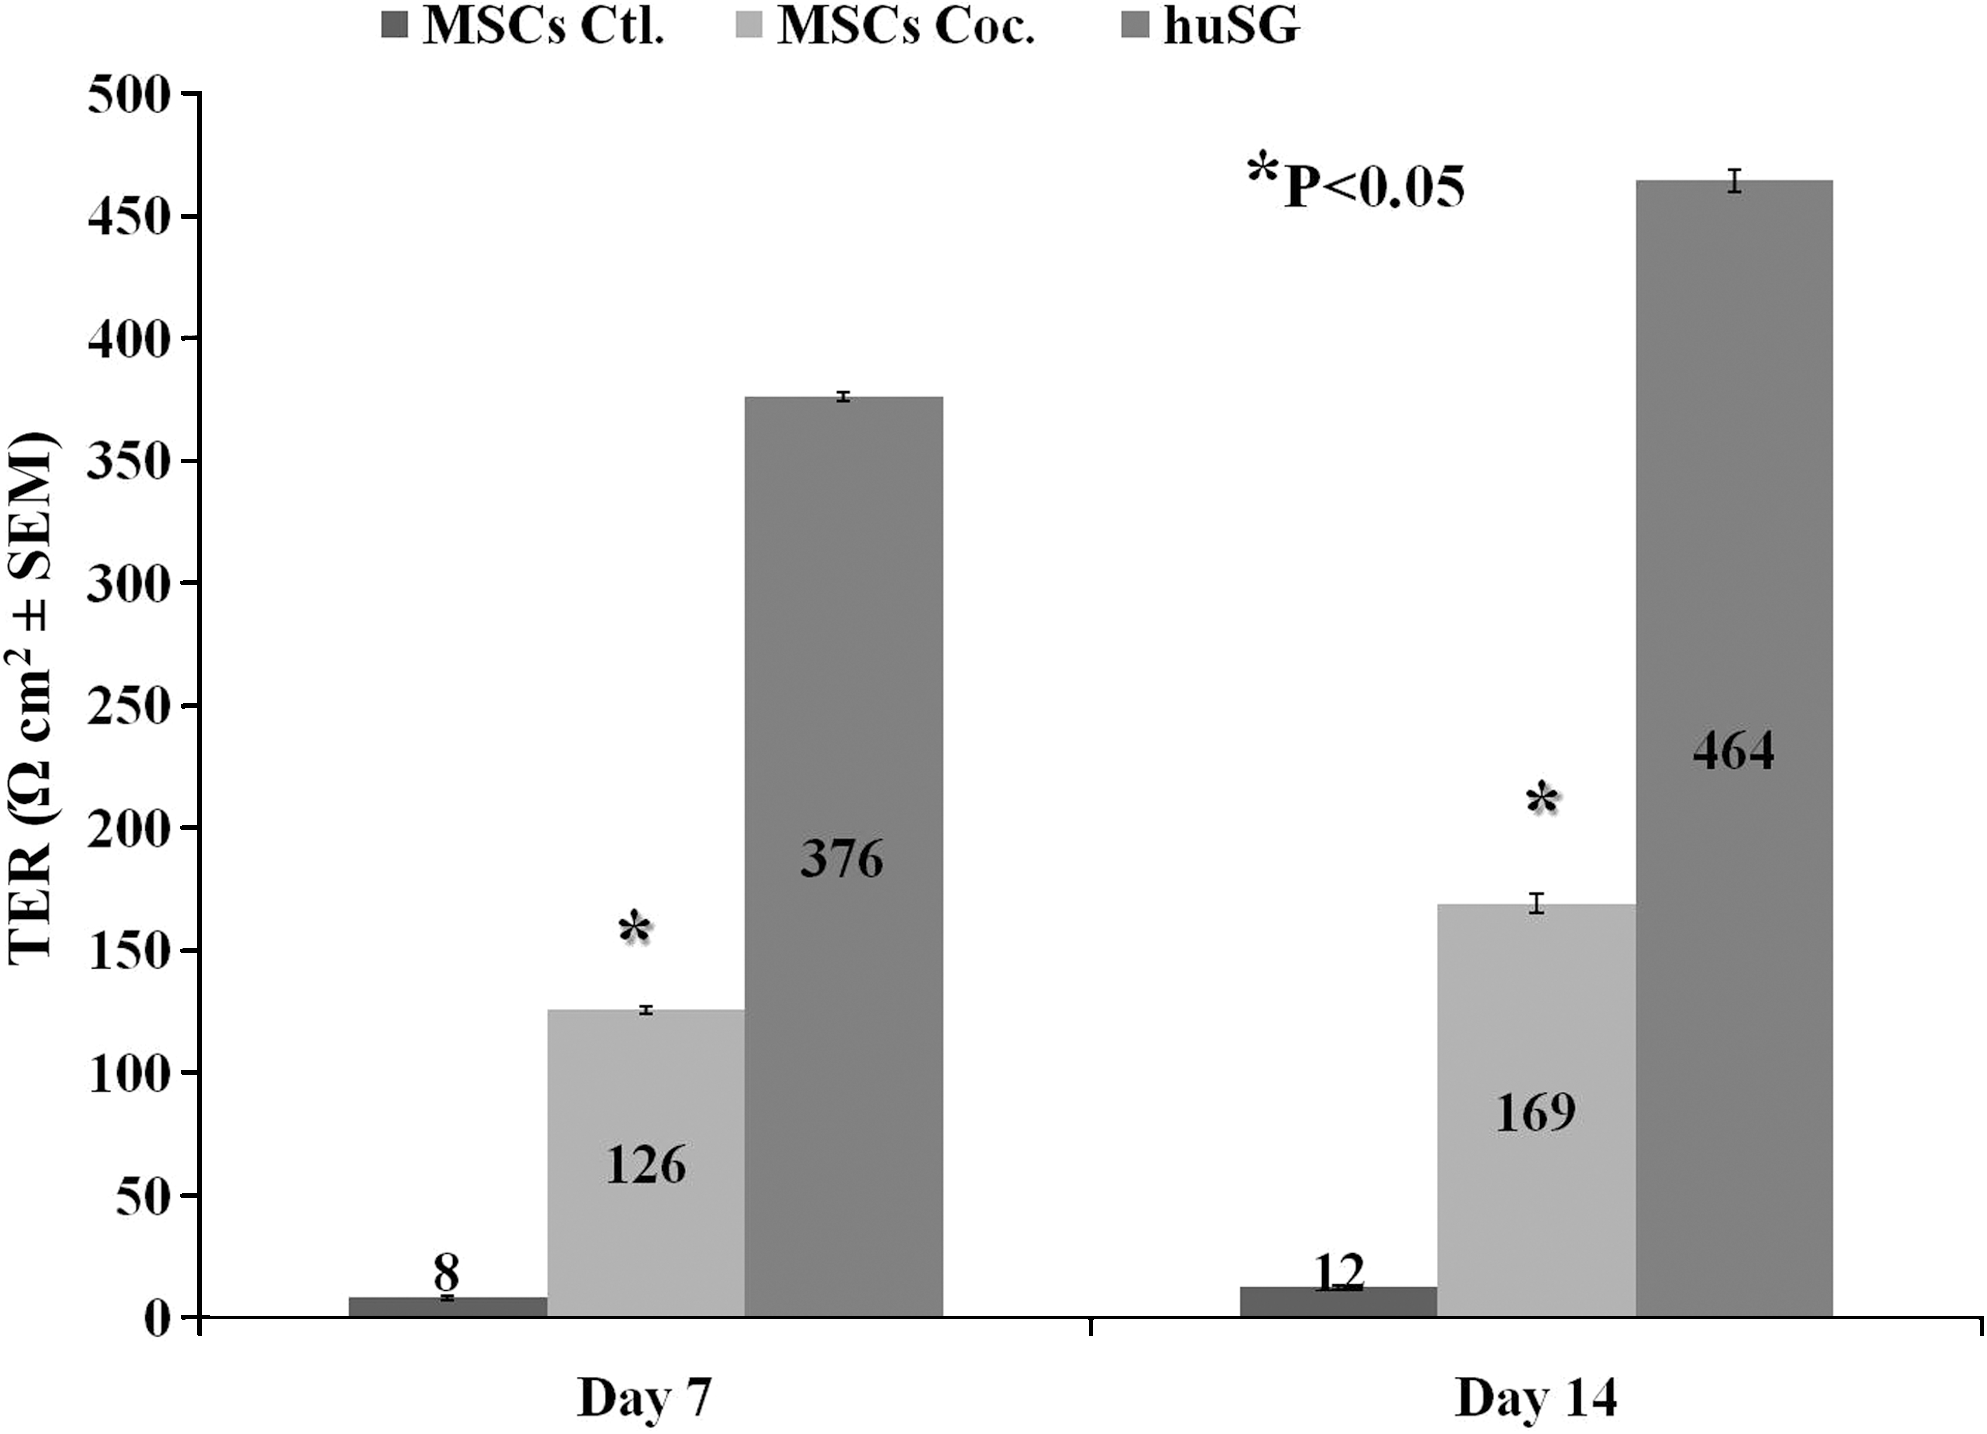
Transepithelial electrical resistance (TER) measurements at days 7 and 14. MSCs grown alone (MSCs Controls) exhibited almost no TER values, whereas MSCs grown in cocultures (MSCs Coc.) exhibited moderate TER levels at both days 7 and 14. These values were significantly different (*P < 0.05) from controls. TER values of huSGs were used here as a positive control. Results represent the average ± standard error of the means of 6 separate determinations for each cell type.
Other epithelial characteristics of cocultured MSCs
MSCs from Transwell systems expressed other epithelial markers such as AQP-5 (20% ± 2%), α-AMY (40% ± 3%), and E-cadherin (39% ± 5%) (Fig. 2 and Table 1). The mesenchymal marker, vimentin, was still present in 80% ± 4% of cocultured MSCs (while 100% in control cultures of MSCs). This indicated that a portion of the differentiated MSCs (20%) had an immature salivary phenotype.
Cocultured MSCs secrete α-AMY
Western blot results obtained from the conditioned media are presented in Fig. 4. α-AMY protein was detected in the media of both cocultured MSCs and huSGs at days 1, 3, 5, and 7. The amounts of α-AMY detected in cocultured MSCs were comparable to those detected in huSGs (Fig. 4). We observed that huSGs cocultured with MSCs had a 2–3-fold increase of α-AMY than that of control huSGs, after adjusting for the number of cells in culture. Control MSC cultures did not show any α-AMY in their media.
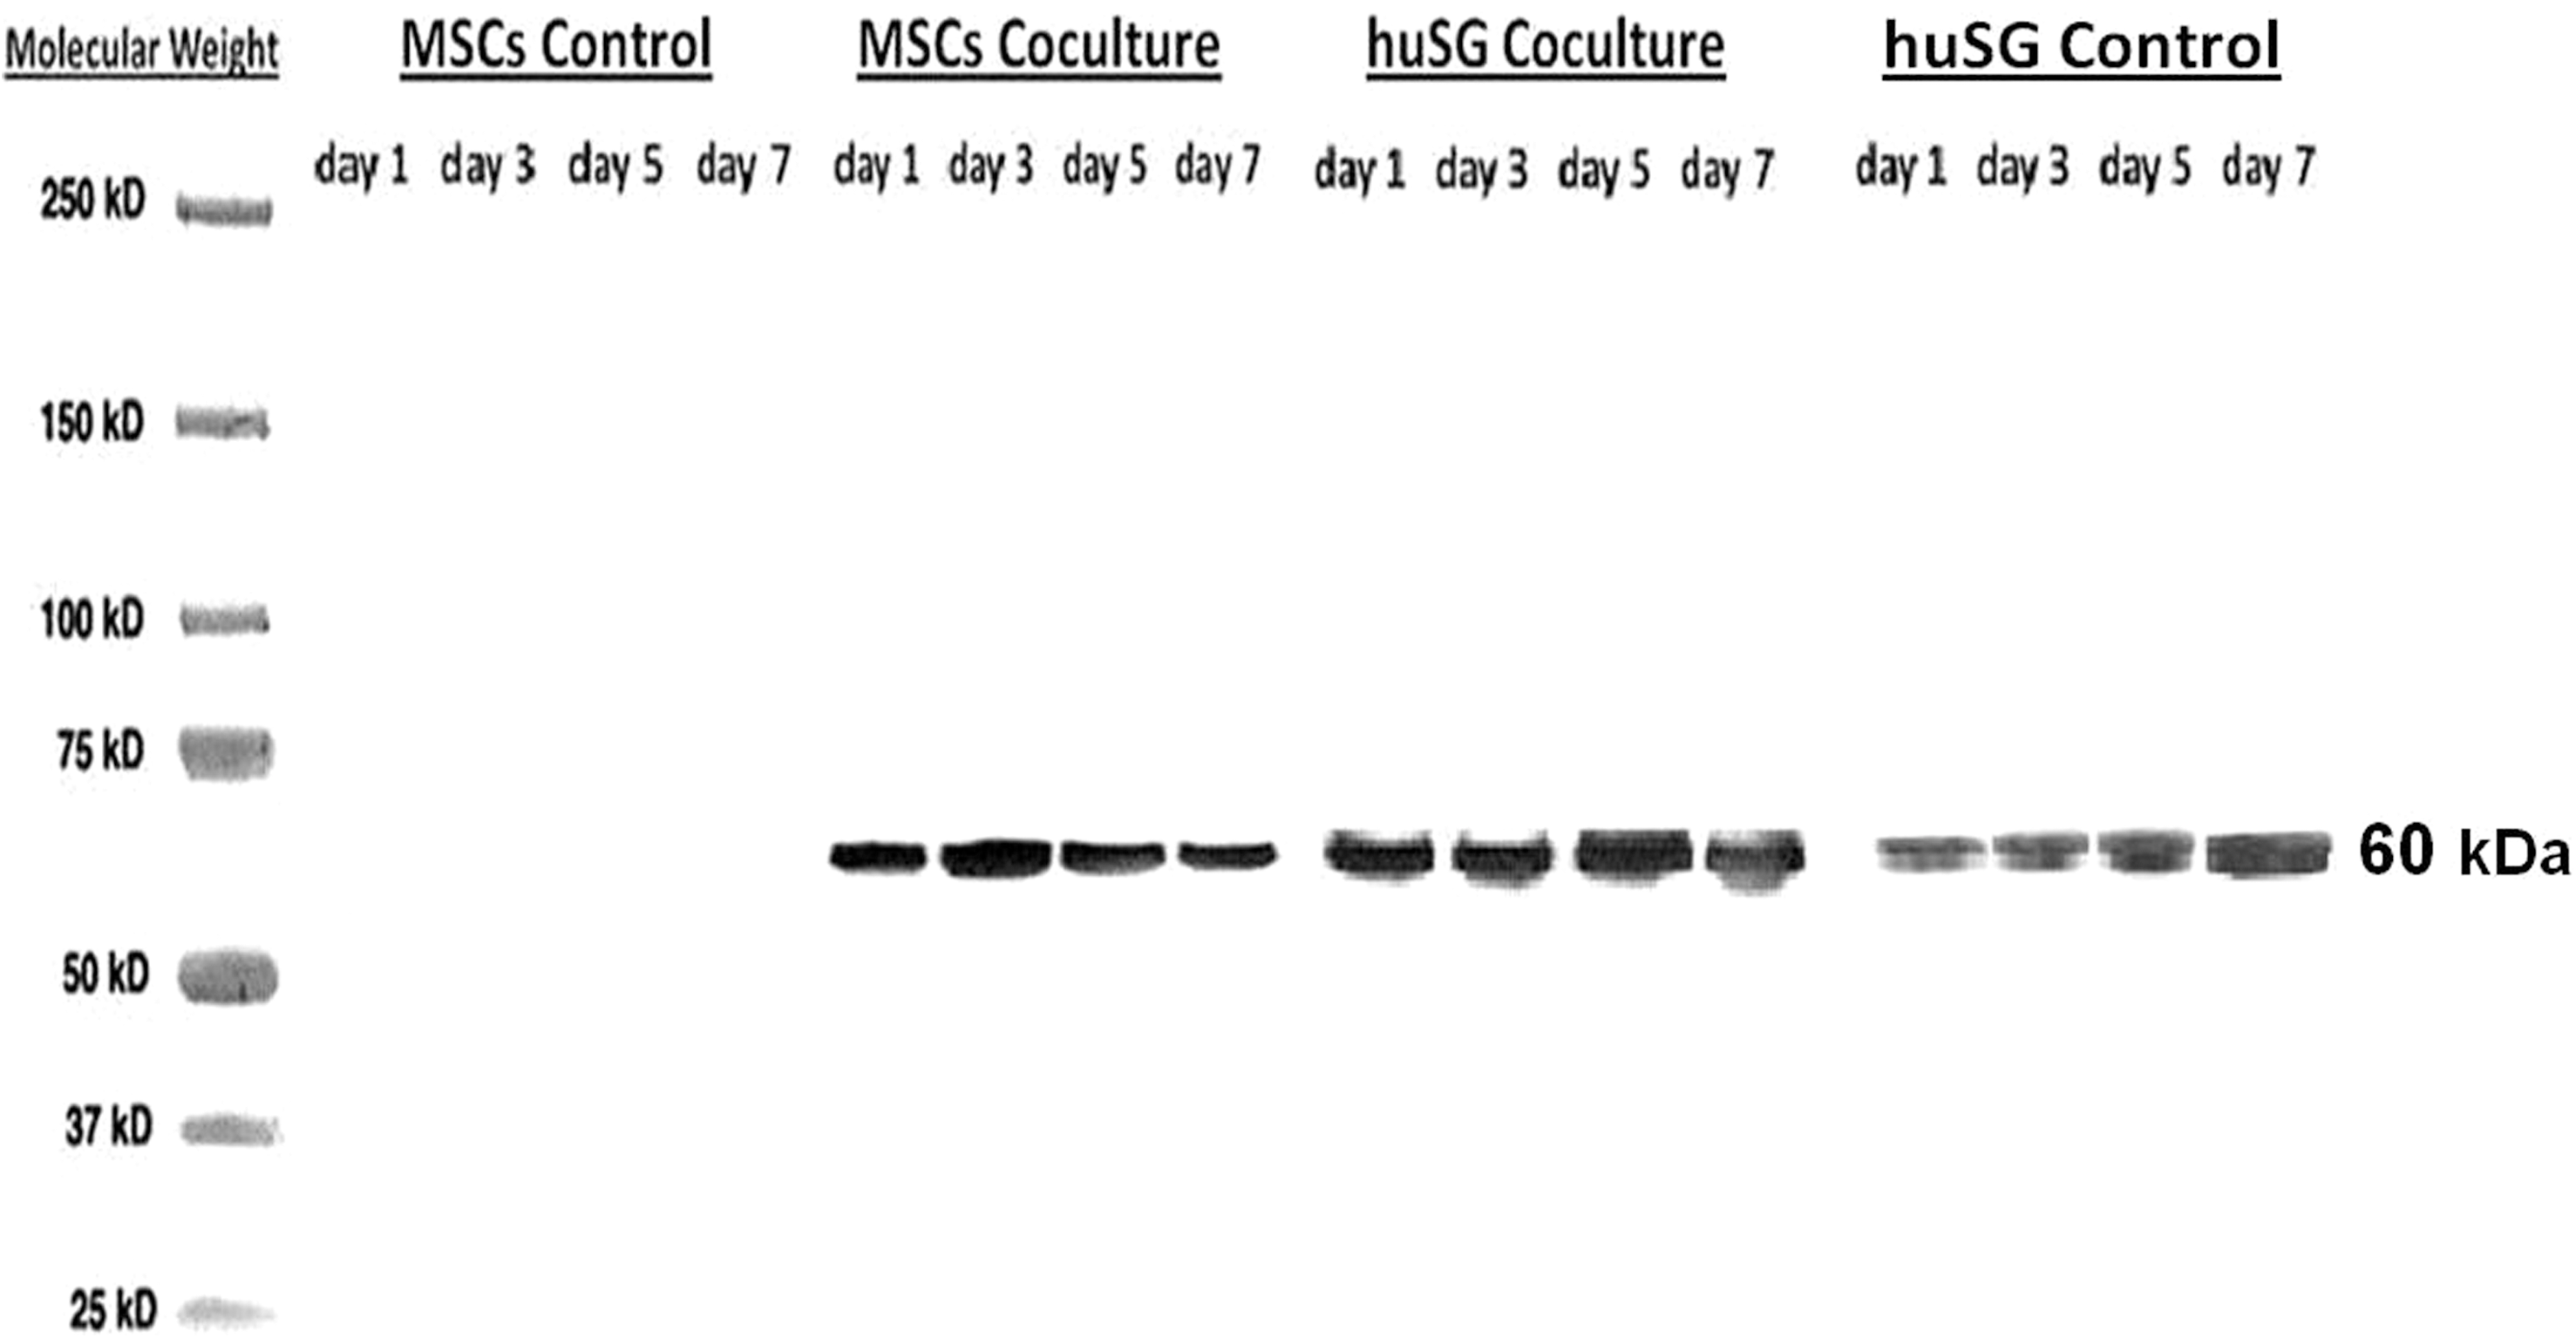
Western blot analysis of α-AMY protein (60 kDa) secreted in conditioned media of huSGs in cocultures and control cultures (at days 1, 3, 5, and 7). The conditioned media of MSC cocultures were from fresh media added after the transfer of MSCs into new Transwell systems without huSGs, and cultured alone for an additional 1, 3, 5, or 7 days. Cocultured MSCs secreted α-AMY at comparable amounts to huSGs. MSC control (cultured alone) did not secrete α-AMY. huSGs in cocultures secreted 2–3-folds more α-AMY than huSGs cultured alone as evaluated by ImageJ software.
Ultrastructural analysis
TEM demonstrated that some cocultured MSCs had comparable cellular structures to huSGs such as TJ structures and electron-lucent/electron-dense secretory granules (Fig. 5A). As expected, most huSGs in cultures gradually lost their acinar phenotype as they formed a cell monolayer (only 40% huSGs were observed with secretory granules at day 14; Fig. 5B). The remaining 60% of huSGs adopted a salivary striated ductal cells phenotype with many large mitochondria, few rough endoplasmic reticulum cisternae and Golgi saccules, and no secretory granules or microvilli. Although control cultures of MSCs (i.e., MSCs cultured alone in Hepato-STIM media) were active in protein formation as revealed by well-developed rough endoplasmic reticulum, Golgi apparatus, and multiple mitochondria, their cytoplasm did not show any salivary-like secretory granules, microvilli, or TJ structures (Fig. 5C). Interestingly, 20%–40% of MSCs cocultured in Transwell system showed budding salivary-like secretory granules next to Golgi saccules (Fig. 5D, E), and these granules were of comparable electron density to those observed in huSGs at day 1 through 14. In addition, cocultured MSCs had TJ structures (Fig. 5F).

Transmission electron microscopy micrographs.
MSCs expressed genes of salivary epithelial cells
To determine whether cocultured MSCs underwent some salivary epithelial differentiation, quantitative real-time PCR was used to measure the gene expression levels of the AQP-5 (a water channel protein in acinar cells), α-AMY gene (a protein secreted by acinar cells), and CLDN-2 (a TJ protein in salivary ductal and acinar cells). huSGs grown from day 1 to 9 are expected to have the fewest amount of surviving acinar cells at day 9. We used this time point as a relative reference because it had the lowest level of expression for the 3 target genes examined. AQP-5 expression increased starting from day 2 in cocultured MSCs and were significantly different (P < 0.01) from MSC control cultures, which had no expression of AQP-5 from day 1 to 9 (Fig. 6A). The α-AMY expression was detected after 24 h in cocultured MSCs (Fig. 6B). This 9.5-fold change was significantly less than the 64.6-fold change for huSGs at day 1, but certainly more than the expected 0 gene expression from MSC controls. CLDN-2 expression was also detected in cocultured MSCs, but with a smaller fold changes (1.1–2.2; Fig. 6C) than the 2 other genes (AQP-5 and α-AMY). These results indicated that cocultured MSCs were capable of expressing these critical salivary epithelial genes. Gene expression levels were different among patients, and this might be related to their age or general health conditions.

Gene expression levels of salivary epithelial proteins at days 1, 2, 3, 5, 7, and 9. Gene expression levels were calculated by normalizing the target RNA value to GAPDH and reported as mean fold-changes + standard error in gene expression relative to control huSGs cultured for 9 days. Results were from 5 patients for MSC controls and cocultures, and from 10 patients for huSG cocultures. At least 3 separate experiments were performed per gene/patient.
Discussion
In this study, we used a system containing 2 chambers separated by a polyester membrane (Transwell-Clear system) to study the capacity of human MSCs to adopt an epithelial salivary phenotype when cocultured with human salivary gland biopsies. Our findings were that 20%–40% of MSCs demonstrated a temporary change into a salivary gland acinar phenotype. These MSCs formed functional TJs, expressed the salivary acinar cell marker AQP-5, secreted α-AMY, and resembled salivary cells at the ultrastructural level.
For the past decade, several reports have proposed that MSCs possess greater plasticity (transdifferentiation) than dictated by established paradigms of embryonic development [9]. Kopen et al. [10] were the first to report that MSCs adopted morphological and phenotypic characteristics of astrocytes and neurons when injected into rats. This report prompted efforts to identify conditions that could induce differentiation of MSCs in vitro. Spees et al. [11] found that human MSCs differentiated into epithelial cells after coculture with heat-shocked airway epithelial cells. Zurita et al. [12] observed differentiation of MSCs into Schwann cells upon coculture. Jang et al. [13] reported that 2.6% hematopoietic stem cells converted to liver cells within 48 h after coculture. However, later studies showed that MSCs had low levels of engraftment, differentiation, and transdifferentiation within tissues and might contribute little to physically regenerating tissue to a significant degree [9]. Rather, it was observed that functional improvements in several animal models and in certain patients happened with transient appearances of the transplanted cells; this led to a new paradigm that MSCs repaired tissues through paracrine secretions and cell-to-cell contacts [14]. Culture-propagated MSCs can secrete anti-apoptotic, immune-regulatory, angiogenic, anti-scaring, chemo-attractant molecules, and extracellular matrix components [15]; these factors would support in vivo tissue regeneration [16]. A critical characteristic of this new paradigm is that repair of tissues is not only dependent on soluble factors produced by MSCs in cultures; instead, MSCs are activated by cross talking with the microenvironment generated by the injured tissues to express factors specifically needed for that tissue [14].
There is an inference that all mesenchyme is derived from epithelia because the epithelia precede the mesenchyme both evolutionarily and ontogenetically [9]. Therefore, our question should not be, “Do MSCs possess broad developmental plasticity? (such as an ability to differentiate into epithelial cells),” but rather, “Which cells within this heterogeneous population of MSCs represent bona fide stem cells and retain the capacity to undergo mesenchymal-to-epithelial transitions in vivo?” [9]. During fetal development, salivary gland morphogenesis involves interactions between the oral epithelium and the condensing neural crest-derived mesenchyme [17,18]. Salivary tissue is formed from a heterogeneous mix of ectomesenchymal cells. This epithelial-to-mesenchymal transition, which occurs during development [19,20], although limited in adult tissues, might explain MSCs' roles in tissue repair [21].
We observed that 20%–40% of cocultured MSCs differentiated into an epithelial salivary phenotype. The mechanism governing this differentiation process is unknown. We are proposing some explanations to this observed phenomenon, based on the new paradigm mentioned above. The Transwell culture system did not allow direct cell-to-cell contact. Therefore, we believe that cocultured MSCs were activated by cross-talking within the microenvironment generated by the injured salivary tissues. This tissue was surgically removed from the patient, shipped in a container for 12–24 h, before being minced mechanically with scissors, and digested enzymatically for several additional hours before being cocultured with MSCs. This harsh and long procedures endured by the salivary tissue could have generated injury signals that were detected by MSCs. We observed that huSGs cocultured with MSCs attached faster to the culture dish surface and secreted a higher amount of α-AMY into the media, as compared to huSGs cultured without MSCs in Transwell system. This cross-talk activated MSCs to express certain genes that were upregulate in comparison to control huSG sample at day 9, such as for the α-AMY and AQP-5 genes (Fig. 6). Also this cross-talk induced a proportion of MSCs to temporarily adopt a salivary epithelial phenotype to assist in the repair of the injured salivary tissue. The hypothesis of “cells cross-talking with the microenvironment” is currently being pursued by several groups of investigators, and they inject the cells locally to enhance tissue repair [14]. A recent example of the effects of microenvironmental cues on re-directing cell fate was the demonstration of thymus epithelial cells adopting the fate of hair follicle multipotent stem cells, when exposed to a skin microenvironment [22]. This potential approach would be of interest to the repair of injured salivary glands.
A coculture cell ratio of 1:3 MSC:huSG was used to favor a differentiation into an epithelial salivary phenotype. We do not know why a proportion of 20%–40% MSCs (and not more) adopted an epithelial salivary phenotype. We speculate that because MSCs are a heterogeneous population of cells, the 20%–40% of MSCs that adopted an epithelial salivary phenotype must have different characteristics than the remaining 60%–80% MSCs. These characteristics were beyond the panel of MSC surface markers we were using to define the MSC population being expanded (positive for CD90, CD106, CD105, CD146, CD44, and CD166, and negative for CD19 and CD45). Also, cultured MSCs have been reported to create their own “in vitro niches” [14]. We observed that MSCs that adopted an epithelial salivary phenotype were clustered into selected islands of cells, whereas MSCs that did not express the epithelial markers (e.g., E-cadherin, AQP-5, and CLDNs) were dispersed elsewhere in the Transwell chamber. These results indicated that a subpopulation of MSCs (which we did not identify) still possess the capacity to undergo mesenchymal-to-epithelial transitions in vitro. Our study was performed for a short duration (14 days of coculture), and the epithelial transition reported here might only be temporary. We have not tested if this transition is possible for MSCs in vivo. Whether this transition is temporary or not, our results indicate as a proof of concept that a proportion of MSCs can adopt a fluid- and/or salivary protein-secretory phenotype in the current coculture system.
Footnotes
Acknowledgments
The authors are grateful to Dr. Christopher Moskaluk and Dr. Olga Gologan for the histopathological analysis of salivary glands, the Cooperative Human Tissue Network and Dr. Anthony Zeitouni for providing the salivary biopsies. We are most appreciative of the technical help provided by Mrs. Jeannie Mui and the Facility of Electron Microscopy Research at McGill University for TEM samples preparation. The authors would also like to thank Dr. John Presley and Dr. Judith Lacoste at the Cell Imaging and Analysis Network for confocal microscopy use. This work was in part funded by the Canada Research Chairs, Canadian Institutes for Health Research, Quebec Oral Health and Bone Network, and the Egyptian Ministry of Higher Education and Scientific Research.
Author Disclosure Statement
No competing financial interests exist.
References
Supplementary Material
Please find the following supplemental material available below.
For Open Access articles published under a Creative Commons License, all supplemental material carries the same license as the article it is associated with.
For non-Open Access articles published, all supplemental material carries a non-exclusive license, and permission requests for re-use of supplemental material or any part of supplemental material shall be sent directly to the copyright owner as specified in the copyright notice associated with the article.