
Abstract
Adipose tissue–derived stem cells (ASCs) are among the more attractive adult stem cell options for potential therapeutic applications. Here, we studied and compared the basic biological characteristics of ASCs isolated from humans (hASCs) and mice (mASCs) and maintained in identical culture conditions, which must be examined prior to considering further potential clinical applications. hASCs and mASCs were compared for immunophenotype, differentiation potential, cell growth characteristics, senescence, nuclear morphology, and DNA content. Although both strains of ASCs displayed a similar immunophenotype, the percentage of CD73+ cells was markedly lower and CD31+ was higher in mASC than in hASC cultures. The mean population doubling time was 98.08 ± 6.15 h for hASCs and 52.58 ± 3.74 h for mASCs. The frequency of nuclear aberrations was noticeably lower in hASCs than in mASCs regardless of the passage number. Moreover, as the cells went through several in vitro passages, mASCs showed changes in DNA content and cell cycle kinetics (frequency of hypodiploid, G0/G1, G2/M, and hyperdiploid cells), whereas all of these parameters remained constant in hASCs. Collectively, these results suggest that mASCs display higher proliferative capacity and are more unstable than hASCs in long-term cultures. These results underscore the need to consider specificities among model systems that may influence outcomes when designing potential human applications.
Introduction
S
Adipose tissue represents an optimal source of stem cells because it is abundant and easy to sample [5 –7]. Several studies demonstrated that adipose tissue–derived stem cells (ASCs) are able to differentiate into a variety of cell lineages, including the osteogenic [8,9], adipogenic [6,10], chondrogenic [9,11,12], skeletal [13] and smooth muscle [14], cardiomyocyte [15,16], endothelial [17 –19], and hepatic lineages [20]. Moreover, ASCs can overcome their mesenchymal commitment and differentiate into nerve cells [21 –23].
In the present study, we evaluated the behavior of ASCs obtained from humans (hASC) and mice (mASC) that were expanded and maintained in culture for long periods of time. Our data demonstrate that hASCs and mASCs expanded in vitro differ in their proliferative capacity and frequency of genome-instability phenotypes. The disparate phenotypes acquired during the culture period may result in different outcomes of cell therapy in human and mouse models, especially if the cells are expanded or maintained for long periods in vitro.
Methods
Reagents
Dulbecco's modified Eagle's medium (DMEM) with low glucose, fetal bovine serum (FBS), penicillin, streptomycin, magnesium chloride, and X-gal (5-bromo-4-chloro-3-indolyl β-
Isolation and ex vivo expansion of mASCs and hASCs
Subcutaneous adipose tissue was obtained with approval from and in accordance with the guidelines of The University of Sao Paulo Ethics Committee (Protocol No. 16688/06) from 24- to 53-year-old patients who had undergone liposuction procedures and from 8- to 12-week-old FVB mice. Cells were isolated from adipose tissue as previously described [7,24,25], using identical conditions for both species. In brief, harvested tissue was enzymatically dissociated using 1.0 mg/mL collagenase type 1A in DMEM low-glucose supplemented with 1% bovine serum albumin in a proportion of 2 mg of enzyme per gram of tissue. Digestion was carried out under continuous agitation for 45 min at 37°C and followed by a 15-min centrifugation (377 g). The pelleted cells were then recovered and plated onto 10-cm (human) or 3.5-cm (mouse) culture plates, maintaining constant the proportion between amount of tissue and plated surface (0.1 g/cm2) for both species. These initial plates represented the passage 0 (P0). At 24-h intervals, cultures were washed with phosphate-buffered saline (PBS) to remove contaminating erythrocytes and other unattached cells. This procedure was repeated every day for 3 days. The plating and expansion medium consisted of low-glucose DMEM with 10% FBS and 1% penicillin/streptomycin. Cells were maintained at 37°C with 5% CO2 in tissue culture dishes or flasks and fed twice per week for further experiments. Cultures reached confluence within 5–7 days after the initial plating (P0). Once 80% confluence was reached, the adherent cells were detached with 0.5% trypsin–ethylenediaminetetraacetic acid and then either replated at 1.0 × 10⁴ cells/cm2 or immediately used in experiments. Cultures were passaged every 3–5 days until they were ready for analysis.
Surface protein expression
For cell surface characterization, flow cytometry analyses were performed. In brief, cells were harvested using 0.25% trypsin–ethylenediaminetetraacetic acid, and 1.0 × 10⁶ cells were stained with 1 μg of fluorescein isothiocyanate– and phycoerythrin (PE)–conjugated antibodies for 30 min at 4°C and then washed twice in PBS containing 2% FCS and 0.1% sodium azide. The antibodies used were obtained from BD Biosciences and Miltenyi Biotec (Supplementary Table S1, available online at
Differentiation of ASCs
ASCs were evaluated for multilineage developmental plasticity using in vitro assays well described in the literature [7,26]. Briefly, adipogenic differentiation was induced by incubating cells on P3 in low-glucose DMEM and 10% FBS supplemented with 1 μM dexamethasone, 500 μM isobutylmethylxanthine, 200 μM indomethacin, and 10 μM insulin for 21 days. Osteogenic differentiation was accomplished by incubating human cells in low-glucose DMEM and 10% FBS supplemented with 0.1 μM dexamethasone, 10 mM β-glycerophosphate, and 50 μg/mL ascorbic acid for 21 days. In addition to this protocol, mouse cells were incubated with 2.5 μM all-trans retinoic acid, which was previously described as critical for enhancing the differentiation of mouse cells toward osteoblasts [26]. Differentiation along the adipogenic and osteogenic lineages was assessed qualitatively based on cell morphology and cytochemistry (Oil Red O and von Kossa stain, respectively) as previously described [7].
Growth kinetics determination
For determination of doubling time, 5.0 × 10⁴ cells/well were seeded in 6-well plates, harvested every 24 h, and fixed in 37% formaldehyde prior to counting in a hemocytometer in a blind manner. Doubling time was calculated from the log phase of the resulting growth curve.
To determine the number of cumulative population doublings (CPDs), cells were seeded at 1.0 × 10⁴ cells/cm2 into culture flasks. Upon reaching 80% confluence, the cells were trypsinized, counted, and reseeded at the same density. The number of PDs was calculated using the following formula: PD = log N/log 2, where N is the cell number of the harvested monolayer divided by the initial number of cells seeded [27,28]. This procedure was repeated for every passage.
Cell senescence determination
To determine when the cells reached senescence, the cytochemical senescence-associated β-galactosidase (SA-β-galactosidase) assay (X-gal, pH 6.0) was employed as described previously [29,30]. In brief, cells were washed twice with PBS and fixed with 2% formaldehyde and 0.2% glutaraldehyde in PBS for 5 min at room temperature. After washing with PBS, cells were incubated with SA-β-galactosidase staining solution [1 mg/mL 5-bromo-4-chloro-3-indolyl-β-
Nuclear morphology analysis
Cells were treated according to the procedure described by Freshney [28]. In brief, cell cultures were washed twice with PBS, prefixed in 1:1 PBS:methanol for 2 min, and fixed in anhydrous methanol for 10 min. The cells were then stained with undiluted Giemsa stain for 2 min and analyzed at a magnification of 200 × using a Leica light microscope. Cells of 10 randomly selected microscope fields were counted and classified, in a blind manner, according to the morphology of the nucleus (Supplementary Fig. S1, available online at
DNA content and cell cycle analysis
Cell cycle assays were performed as previously described [31]. Briefly, the trypsinized cells were fixed in 70% ethanol, washed with PBS, and then incubated with propidium iodide (20 μg/mL) in PBS containing RNase A (40 μg/mL) for 30 min at 37°C. After washing, cells were analyzed by flow cytometry (FACScan; Becton Dickenson).
Statistical analysis
Results were expressed as means ± standard error of the mean, and normal frequency distribution and equal variances between groups were assumed. Differences between groups were analyzed using paired Student's t-test and analysis of variance with Bonferroni test post hoc. P values of <0.05 were considered significant.
Results
Cell surface immunophenotype
Flow cytometry analyses of hASCs and mASCs were performed on the fourth passage to discern potential interspecific differences in the expression of a panel of surface markers characteristic of mesenchymal stem cells (MSCs). As shown in Fig. 1A, the phenotype of ASCs derived from humans and mice was similar. Both ASCs showed comparable percentages of CD90+, CD29+, and CD44+ cells. Cells positive for CD73 were also observed in both ASCs, but with a markedly lower frequency in those from mice (P < 0.014). The marker CD31 was observed in <2% of the hASCs, whereas it was present in >15% of the mASCs (P < 0.002). As expected, both ASCs were essentially negative for CD45 (<6% in both species).
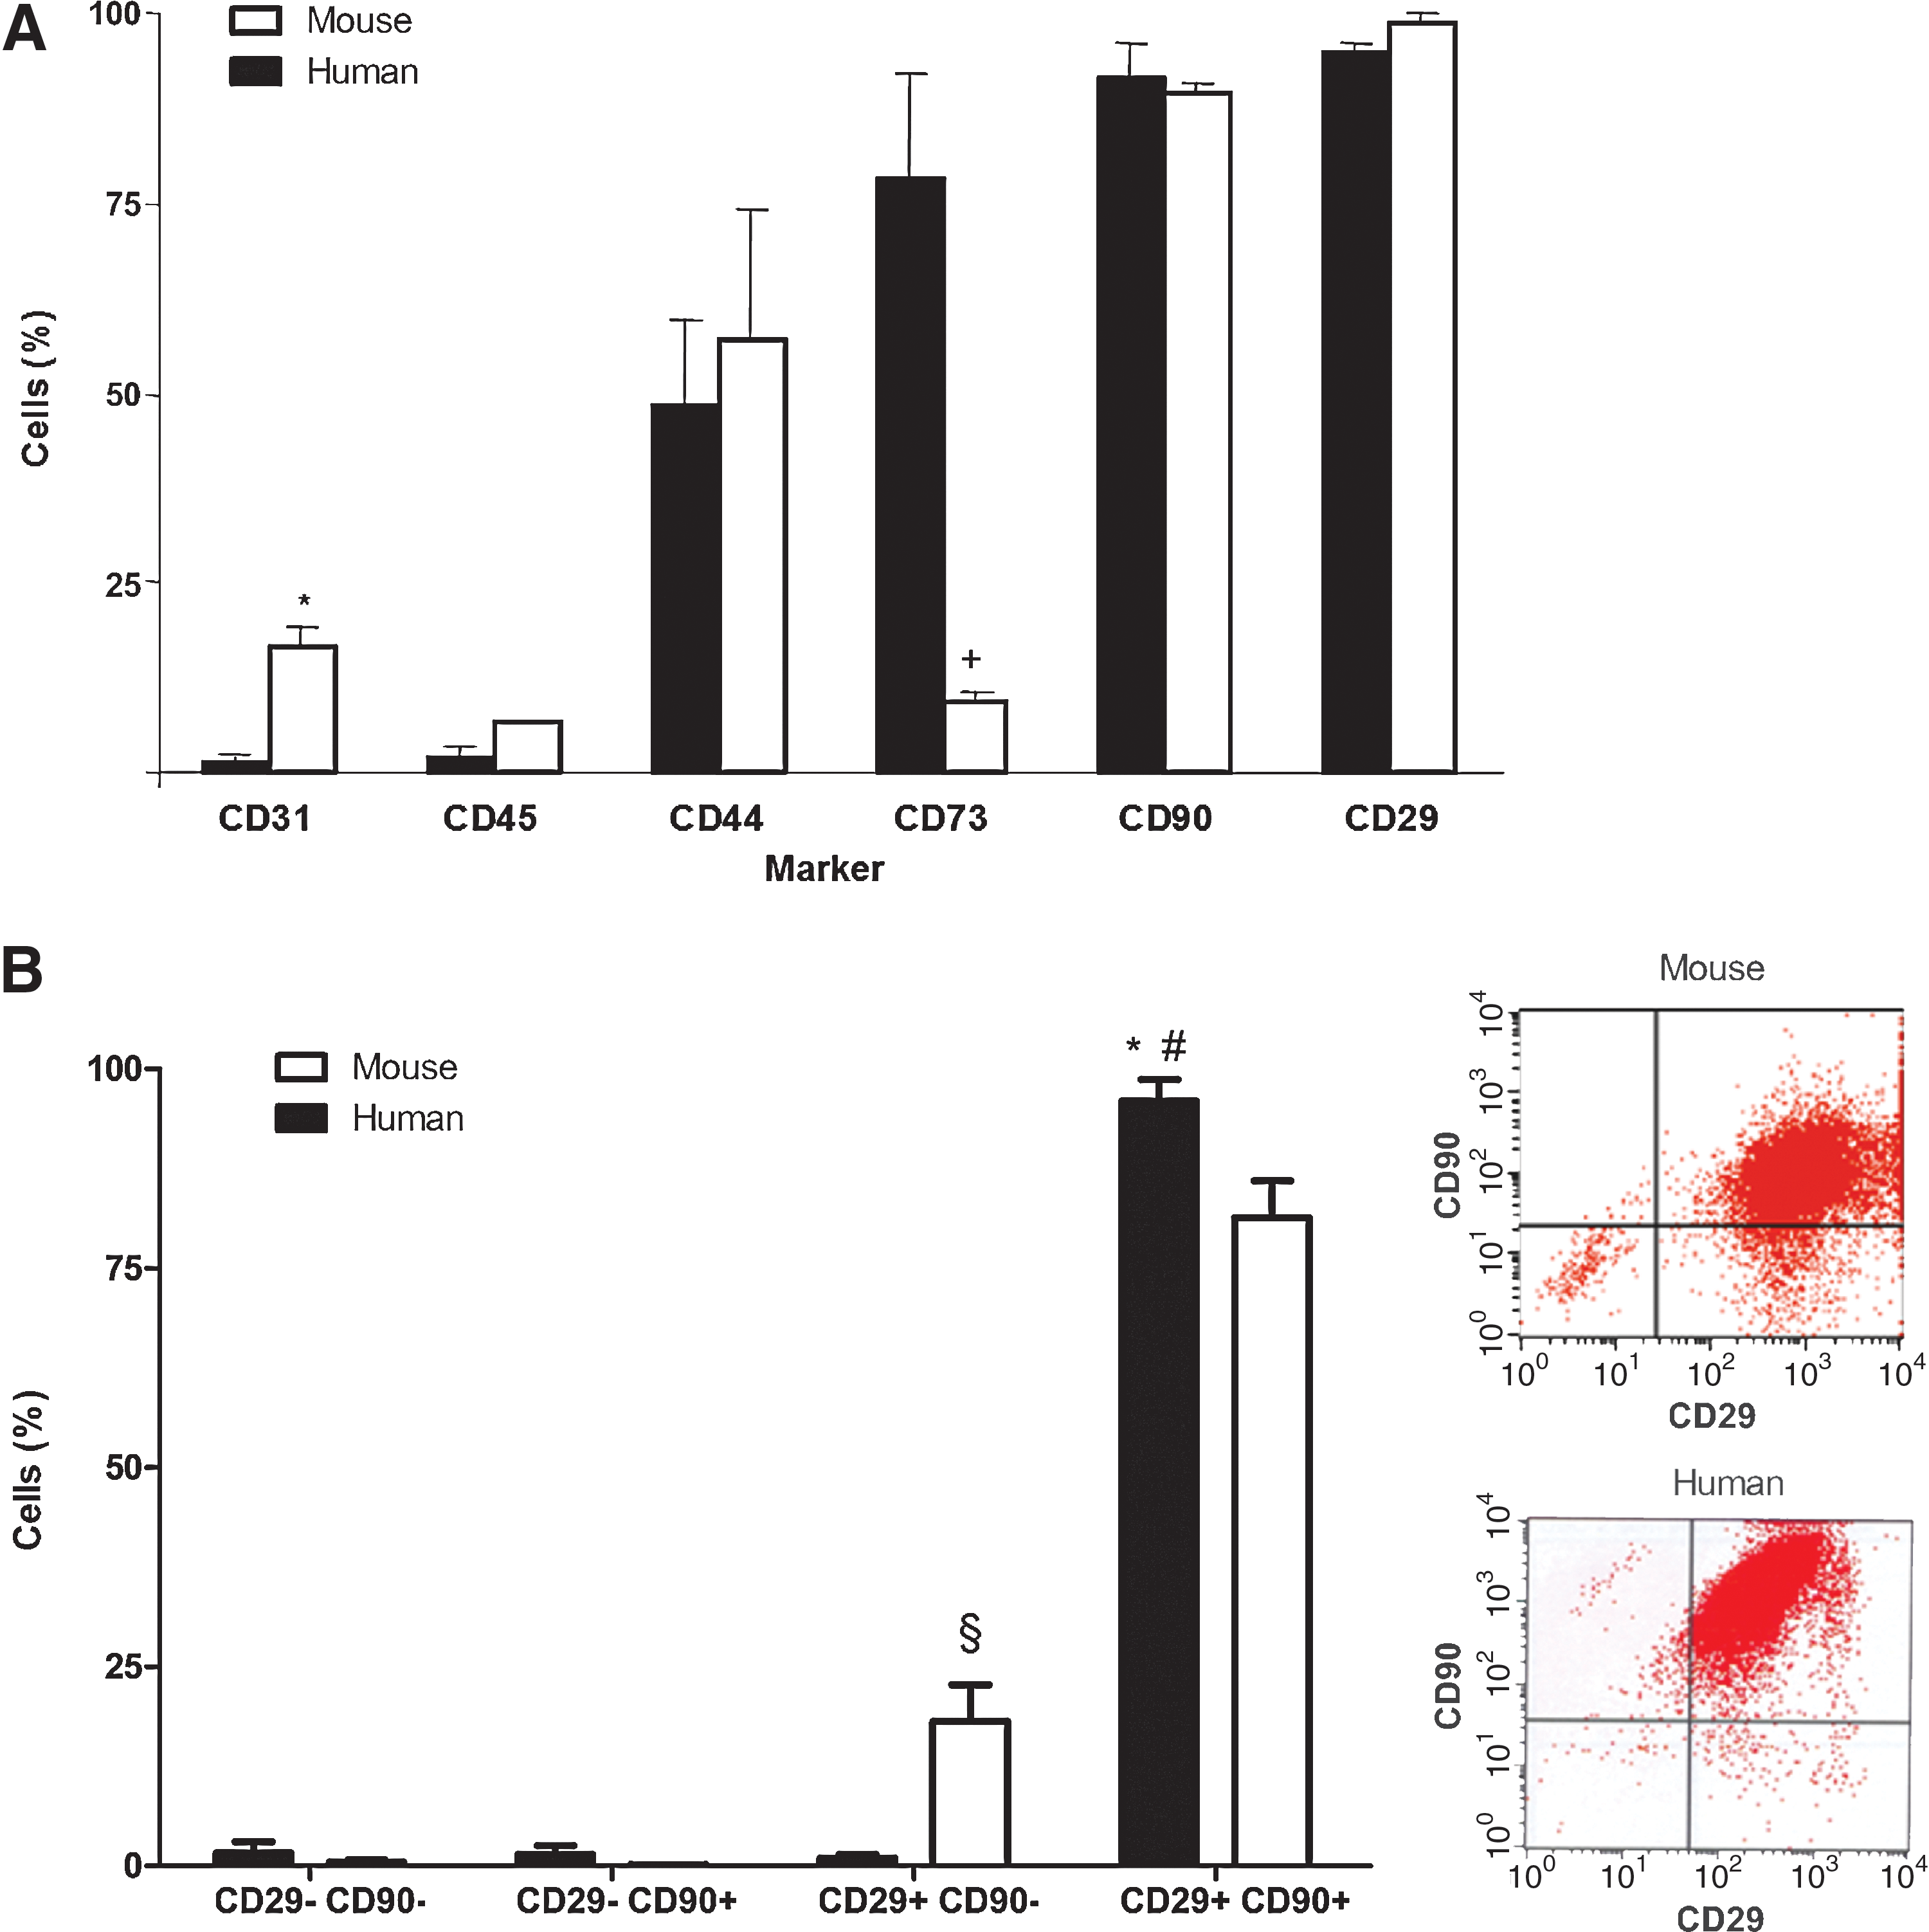
Surface immunophenotype of hASCs and mASCs.
Interestingly, in contrast to human cells, mASCs had a CD29+CD90− subpopulation (18.00% ± 4.65%, N = 6; Fig. 1B). However, the combination of markers CD90 and CD29 defined relatively homogeneous populations in both hASCs and mASCs.
Multilineage potential
To compare the differentiation potential of hASCs and mASCs toward the adipogenic and osteogenic lineages, cells at P3 and P4 were cultured in lineage-specific inductive media. After adipogenic induction, both ASCs showed accumulation of lipid vesicles (Fig. 2A, C), thus confirming the adipogenic differentiation potential of ASCs from both human and mouse sources. The potential for osteogenic differentiation was also verified in both ASCs (Fig. 2B, D), although using a different differentiation protocol for each type of ASCs. Specifically, medium modifications described by Wan et al. [26] were necessary to induce murine ASCs to differentiate toward the osteogenic lineage.
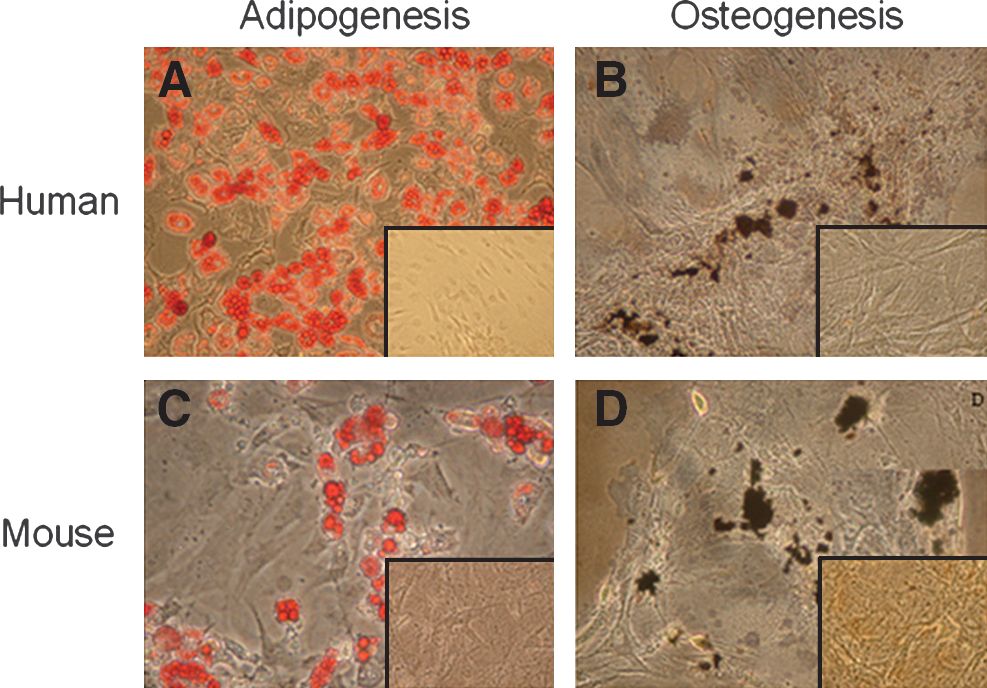
Adipogenic and osteogenic differentiation of mASCs and hASCs.
Cell growth characteristics
Although both ASCs could be maintained in vitro for extended periods, hASCs and mASCs displayed markedly different proliferative kinetics. As shown in Fig. 3A, as early as 48 h in culture, the mean number of harvested hASCs and mASCs at P2 varied significantly (P < 0.05). Thus, to further examine the self-renewal capabilities of human and murine ASCs, PD times (PDTs) were determined in consecutive passages up to P10. The mean PDT along passages was 98.08 ± 6.15 h for hASCs, ranging from 72.11 to 129.23, and 52.58 ± 3.74 h for mASCs, ranging from 24.45 to 104.70. The difference in average PDT between hASCs and mASCs was statistically significant (P < 0.05).

Comparison of short- and long-term cell proliferation profiles in vitro.
To examine the long-term growth patterns of ASCs, we analyzed the CPDs of hASCs and mASCs with respect to the passage number. In hASCs, the average number of CPDs increased until ∼P15, reaching an apparent plateau phase thereafter (Fig. 3B). In contrast, in mASCs the average number of CPDs increased steadily, failing to plateau over the period of study, and reached levels significantly higher than those observed for humans.
Cell senescence
To determine the variables affecting the growth kinetics of hASCs and mASCs, cell senescence levels were evaluated from P1 to P10. Relatively constant percentages of SA-β-galactosidase–positive cells were found in hASC cultures as they were passaged, whereas the percentage of positive cells in mASC cultures tended to be higher after P6 (Fig. 4, P not significant). Before P6, the levels of cell senescence in mASCs were lower than those of hASCs at corresponding passages, becoming higher thereafter. Still, the observed interspecific differences were small and not statistically significant.
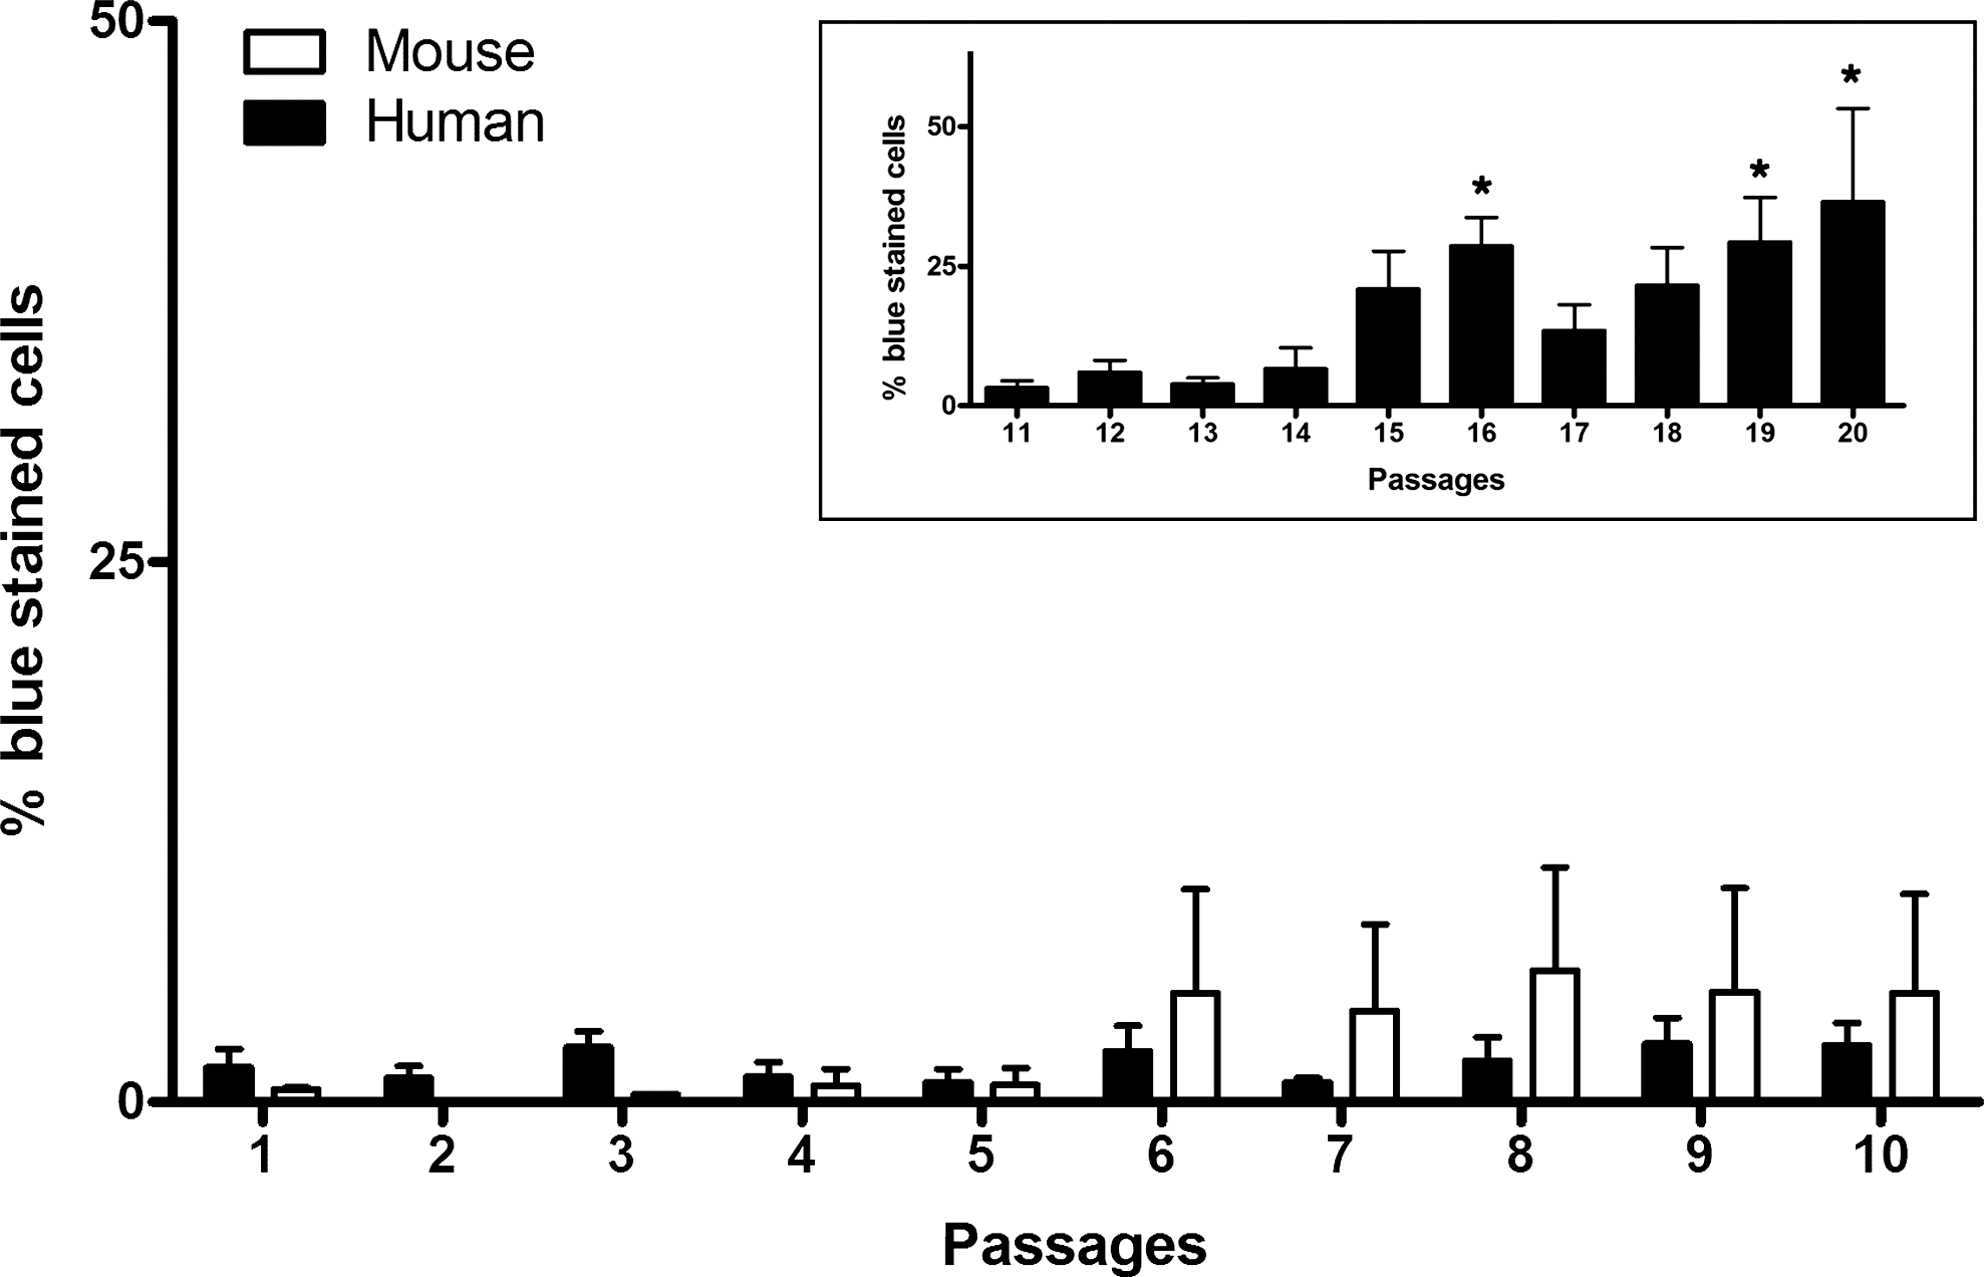
Replicative senescence of ASCs along passages. For hASCs, replicative senescence was determined up to passage 20 (passage 11 to 20 are shown in the inset graph) [*P < 0.05 vs. passages 1 to 13 (1-way ANOVA with Tukey post hoc); n = 3 for mASCs and n = 3–4 for hASCs].
As hASCs display a CPD plateau after P15, cell senescence of hASC cultures was further evaluated until P20. Interestingly, as shown in Fig. 4, replicative senescence may indeed explain the CPD plateau observed for hASCs.
Nuclear morphology
Routine examination of ASC cultures under inverted phase-contrast microscopy revealed further interspecific differences. Human cells exhibited a regular appearance as they were passaged, whereas murine cells were small and highly condensed, initially, and became more distended and irregular at later passages. The presence of binuclear cells was noted in both mASC and hASC cultures. Thus, to characterize and determine the frequency of potential nuclear alterations, fixed cell preparations from P1 to P7 were stained and nuclear morphology was categorized as described in the Methods section. As shown in Table 1 and Supplementary Fig. S2 (available online at
Cells were categorized based on their nuclear morphology as described in the Methods section. Percentages represent the mean (±standard error of the mean) cell frequency of 3–4 independent experiments per species at each passage (P). The data presented here are graphically shown in Supplementary Fig. 2, available online at
DNA content and cell cycle kinetics
As atypically large nuclei could be a consequence of polyploidy, we next investigated the DNA content and cell cycle kinetics of ASC cultures at various passages. As shown in Fig. 5A, the frequency of hyperdiploid mASCs increased until P10, whereas that of hASCs showed a mild tendency to decrease along passages. Moreover, in mASCs the frequency of hyperdiploid cells is correlated with the frequency of cells with large nuclei (Fig. 5B), suggesting that cells with large nuclei may, indeed, have a hyperdiploid DNA content.

DNA content and nuclear size. Cells were categorized based on their nuclear morphology as described in the Methods section.
Interestingly, the cell cycle distribution of the 2 ASCs revealed patterns more dissimilar than expected (Fig. 6 and Supplementary Fig. S3, available online at
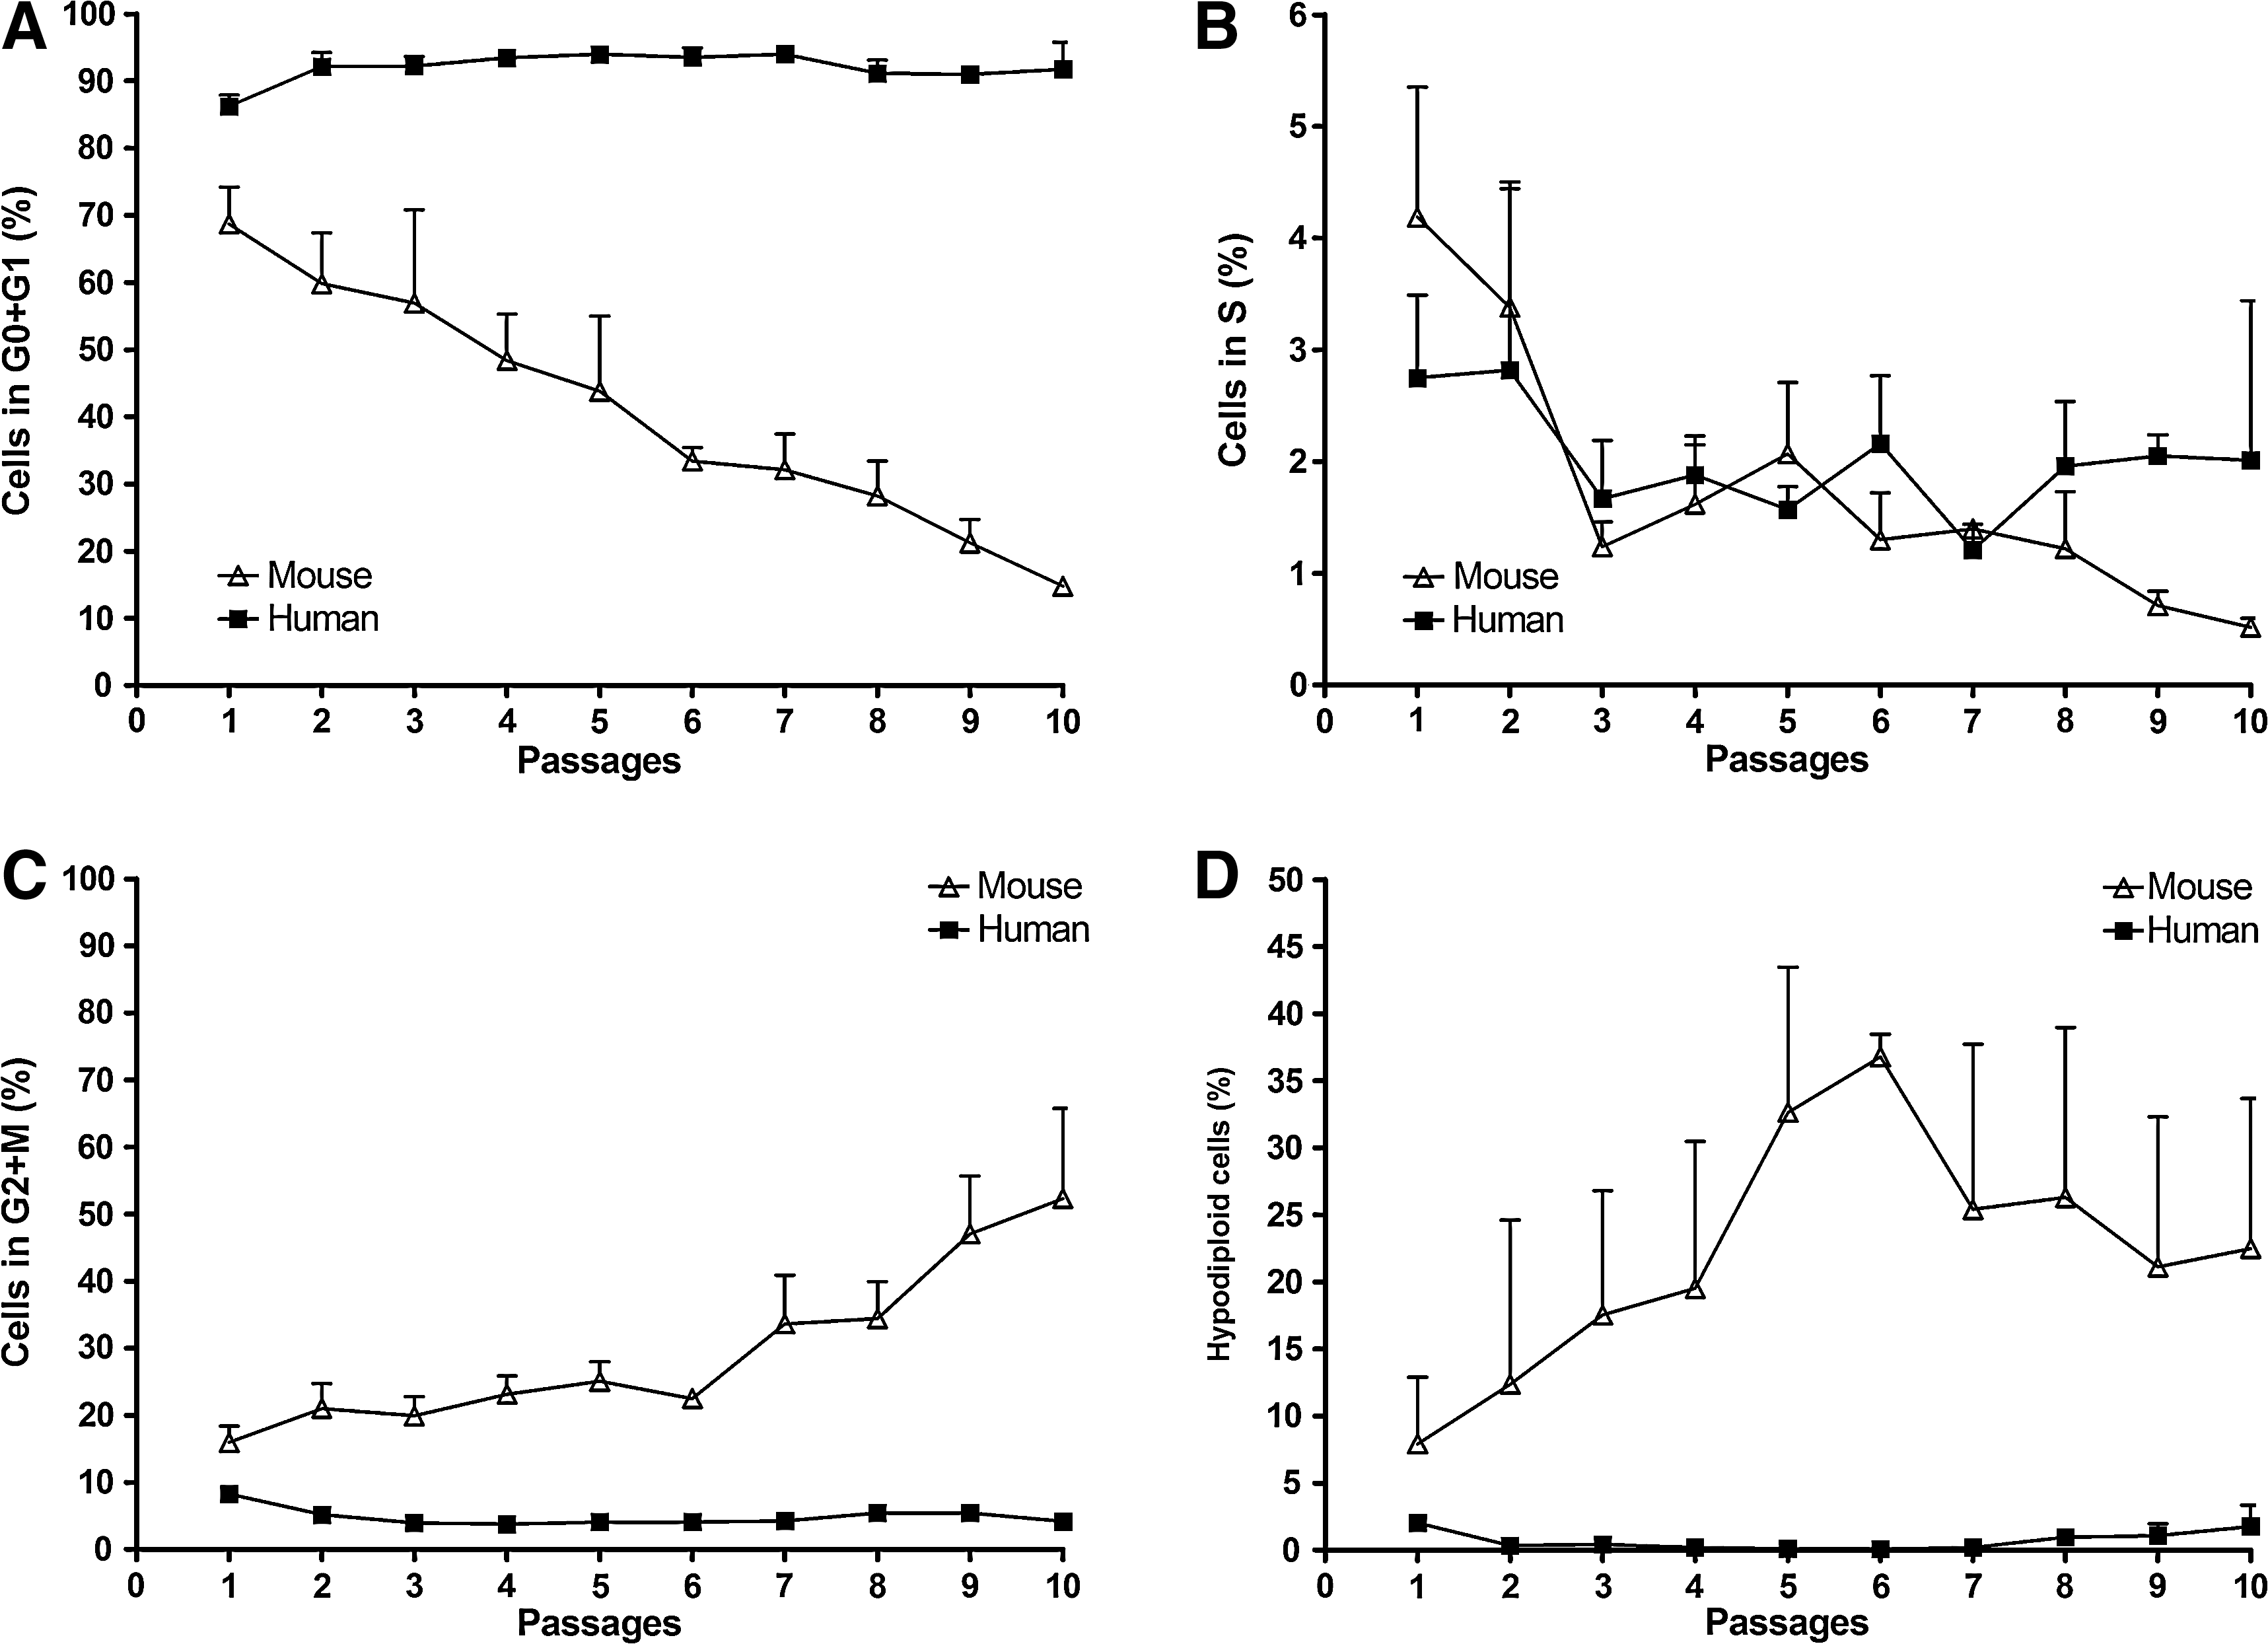
Flow cytometric analysis of propidiumiodide (PI)-stained ASCs at different passages (n = 3). Percentages of ASCs in G0/G1
Another important difference observed between mASCs and hASCs was that the frequency of hypodiploid cells in mASCs was at least 3-fold higher than in hASCs at corresponding passages (Fig. 6D). This interspecific difference in hypodiploid cell frequency increased steadily from P1 to P6 and slightly decreased thereafter. Interestingly, the frequencies of hypodipliod mASCs were more highly variable than those of hASCs.
Discussion
In the present study, we have demonstrated that ASCs derived from humans and mice share comparable characteristics such as the immunophenotype and multilineage differentiation potential, but differ markedly in terms of growth kinetics. Interestingly, this interspecific difference is not due to discrepancies in cell senescence levels. In the case of mASCs, although the percentage of senescent cells tends to increase after P6, senescence levels remain low and do not affect the self-renewal parameters PDT and CPD. Further, the difference in growth characteristics is not due to differences in cell cycle kinetics. Both ASCs show similar frequencies of cells in S phase along passages, as well as similar mitotic indices (data not shown).
ASCs from mice and humans also differ in terms of frequency of nuclear aberrations. ASCs derived from mice show not only a higher frequency of nuclear aberrations but also a greater number of different kinds of aberrations. For instance, the presence of micronuclei and nuclear blebs was almost exclusive to mASC cultures. These alterations are commonly associated with genomic instability and chromosomal damages that are relevant to the processes of immortalization and malignant transformation, which in turn affect the proliferative capacity of a cell. Indeed, we found chromosomal alterations in mASCs, mainly centric fusions and aneuploidies (data not shown). However, the most frequent alterations in nuclear morphology in both hASCs and mASCs were the presence of a large nucleus and 2 nuclei. In mASCs, the change in nuclear volume was accompanied by a change in DNA content, namely hyperdiploidization. Both binucleation and increased ploidy levels are common consequences of alterations in cell division, mainly as adaptive responses to stress. Another interesting observation is the increasing percentage of mASCs with 4C DNA content. This may indicate a higher number of either diploid cells in M phase, diploid cells arrested in G2, or tetraploid cells in G0/G1. However, as the mitotic index of mASCs (which was determined during the nuclear morphology analysis and allows discrimination of cells of the 4C DNA content fraction that were in M phase) was low and constant along passages (data not shown), the last 2 possibilities are more likely to be responsible for the increasing percentage of 4C mASCs. In agreement with the other data presented in this study, this accumulation of diploid cells arrested in G2 and/or tetraploid cells in G0/G1 also suggests an increasing loss of genomic integrity of mASCs with time in culture. Finally, as the hypodiploid cell fraction contains not only apoptotic cells but also aneuploid cells and micronuclei cells, the high and increasing frequency of hypodiploid mASCs further supports the idea of species-specific genome instability of ASCs derived from mice.
Several divergences between rodents and human cell cultures have been already described. Murine bone marrow MSCs (BMSCs) are far more difficult to isolate and culture than those from rat and human [32]. Further, rat BMSCs are more sensitive to plating density and expand more rapidly from single-cell–derived colonies than human BMSCs [33]. Similarly, it was recently found that the osteogenic differentiation of mASCs requires the addition of retinoic acid and bone morphogenetic protein [26,34], whereas human cells require only the basic cocktail containing the hormone dexamethasone. Moreover, several characteristics of murine cells seem to be altered with time in culture [35 –37]. For example, MSCs from several mouse strains can acquire chromosomal abnormalities after few passages [35,38]. On the contrary, human cells undergo spontaneous transformation only after culture periods of about 4–5 months [39,40].
However, there are limitations that must be considered when interpreting the results presented here. Even though strict criteria were followed, the classification of diverse nuclear morphologies into discrete categories is subjective, and nuclear volume was not determined by any quantitative method. Still, a positive correlation between the frequency of cells with large nuclei and the frequency of hyperdiploid cells was confirmed for mASCs, suggesting that the criteria adopted to classify cells according to their nuclear size were effective at distinguishing cells with a DNA content superior to 4C. This is not the case for hASCs, in which the lack of such association suggests that, along with DNA content, there may be other factors affecting nuclear size. Equally subjective and error prone is the commonly accepted cytochemical determination of SA-β-galactosidase–positive cells. Finally, our study rendered higher PDTs than previously described for hASCs [41,42]. Similarly, the percentages of mASCs and hASCs in S phase were lower than expected for MSCs [43 –45]. However, as culture conditions in our study differed to some extent from those previously described, but were kept constant for mASC and hASC cultures, similarities and dissimilarities between cells from these species are validated regardless of discrepancies with data from other laboratories. The molecular mechanisms underlying the described differences remain unknown and should be pursued in future studies.
Taken together, the data indicate that mASCs and hASCs share many characteristics, but differ in terms of proliferative capacity and frequency of genome-instability phenotypes. Even though some of these interspecific differences were described for other cell types [37], we present the first direct comparison of basic cell biology characteristics for ASCs from humans and mice kept under the identical experimental conditions. The data described here indicate important issues that must be taken into account when designing potential human applications based on data obtained from specific animal model systems.
Footnotes
Acknowledgments
The authors thank Tiago da Veiga Pereira for the assistance with statistical data analyses. They also thank Giancarlo Fatobene, Carolina Lavini-Ramos, and Paulo Sampaio Gutierrez for technical assistance, and Aurelio Silvestroni for critical revision of the manuscript. This study was funded by grants from Fundação de Amparo a Pesquisa do Estado de São Paulo (FAPESP; No. 01/0009-0) and Ministério da Ciência e Tecnologia/Conselho Nacional de Desenvolvimento Cientifico e Tecnológico/Ministério da Saúde/Departamento Ciência e Tecnologia (MCT/CNPq/MS/DECIT No. 552324/20005-1 and 10120104096700). M.E.D., V.B., J.S.N., and G.R.S.J. were recipients of fellowships from FAPESP (05/54695-3, 05/57591-4, 04/06784-4, and 06/57937-0, respectively).
Author Disclosure Statement
The authors have no conflicts of interest to disclose.
References
Supplementary Material
Please find the following supplemental material available below.
For Open Access articles published under a Creative Commons License, all supplemental material carries the same license as the article it is associated with.
For non-Open Access articles published, all supplemental material carries a non-exclusive license, and permission requests for re-use of supplemental material or any part of supplemental material shall be sent directly to the copyright owner as specified in the copyright notice associated with the article.