
Abstract
Human dermal fibroblasts (FBs) express mesenchymal stem cell (MSC)-specific cell surface markers and differentiate into several cell types under appropriate conditions. Molecular mechanisms controlling the early stages of differentiation of dermal FBs and MSCs isolated from different sources have not been well studied. Here, we have analyzed the cell type-specific changes of adipose tissue-derived mesenchymal stem cells (AdMSCs) and dermal FBs in the process of differentiation into adipocytes and osteoblasts. Analysis of gene expression in the course of adipogenic differentiation of AdMSCs and FBs isolated from the same individuals revealed a time lag in the induction of adipogenesis-related genes in FBs compared with AdMSCs, a phenomenon not previously described. Further, preliminary evidence suggests that delayed adipogenesis of FBs is related to the delayed induction of preadipocyte transcription factor ZNF423 in FBs. These findings clearly show that AdMSCs and FBs have similar developmental potential but different molecular control mechanisms of initial stages of adipogenic differentiation.
Introduction
M
Many functional characteristics and biomarkers of MSCs and stromal cells indicate that they can be considered similar or even identical [11 –13]. For example, MSCs and stromal cells both express CD90, CD105, CD73, and STRO-1 [14,15]. Lorenz et al. have demonstrated that both MSCs and dermal fibroblasts (FBs) can differentiate into fat and bone cells presenting lineage-specific markers, either peroxisome proliferator-activated receptor gamma (PPARγ) and lipoprotein lipase or osteopontin and osteocalcin, respectively. Pluripotent cells from bone marrow, adipose tissue, hair papilla, and skin dermis express cell surface markers that are characteristic to MSCs (CD105, CD49d, and STRO-1) and differentiate into adipocytes and osteoblasts [16].
Adipose tissue-derived mesenchymal stem cells (AdMSCs) differentiate into a variety of cell types including osteoblasts, chondrocytes, adipocytes, tenocytes, and skeletal myocytes [2,17 –19]. Gene and protein expression data show that isolated AdMSCs and dermal FBs (stromal cells) have both similarities and differences [14,20,21]. FBs derived from lamina propria have the same cell surface markers, immunophenotypic characteristics, and differentiation potential as BmMSCs and AdMSCs [22]. Dermal FBs that express vimentin, fibronectin, and collagen and AdMSCs have similar expression patterns of CD29, CD44, CD71, CD73/SH3-SH4, CD90/Thy-1, CD105/SH2, and CD166/ALCAM [12]. When cultured under appropriate conditions, both cell types differentiate along the adipogenic and osteogenic lineages. Also, adult bronchial FB-like cells revealed a similar expression pattern of antigens characteristic to BmMSCs, including CD90/Thy-1, CD73/SH3-SH4, CD105/SH2, and CD166/ALCAM, whereas STRO-1 antigen was weakly expressed in bronchial FBs [11]. Both cell types differentiated along the adipogenic, osteogenic, and chondrogenic mesenchymal pathways when cultured under appropriate conditions.
Little is known about the molecular changes that occur at the early stages of differentiation of stromal cells (FBs) and AdMSCs into osteoblasts and adipocytes. Long-term differentiation assays have demonstrated that the final differentiation of FBs and AdMSCs is nearly identical, as both express a set of lineage-specific markers. Differentiation along adipogenic and osteogenic pathways requires sequential induction of specific genes. Adipogenesis depends on the transcription factors CCAAT/enhancer binding protein alpha (C/EBPα) and PPARγ, the expression of which is facilitated by CCAAT/enhancer binding protein beta (C/EBPβ) and CCAAT/enhancer binding protein delta (C/EBPδ). All these transcription factors together promote adipogenic differentiation by activating the full adipose-specific gene expression program leading to adipocyte maturation [23,24]. Fatty acid binding protein 4 (FABP4), a key mediator of intracellular transport and metabolism of fatty acids in adipose tissue, is one of the adipogenic genes directly regulated by PPARγ. Recently, it was shown that zinc finger transcription factor ZFP423 robustly activates PPARγ and stimulates adipocyte differentiation [25].
Development of osteoblasts is regulated by a number of transcription factors including runt-related transcription factor 2 (RUNX2) (CBFA1), Osterix, ATF4, and β-catenin [26 –29]. RUNX2 has been identified as the key transcription factor regulating cell commitment and differentiation into osteoblasts [30]; however, various regulatory factors such as TAZ, pRB, HOXA10, GRG5, and BAPX-1 control the activity of RUNX2 [31 –35]. The temporal and spatial expression and activity of those regulatory factors cause RUNX2 target genes to be often absent in cells that express RUNX2 [36]. The coordinated action of different transcription factors results in expression of osteogenic genes and acquisition of the osteoblast phenotype.
Comparative studies of the multipotency of FBs and MSCs have been mostly based on long-term differentiation assays with the analysis of terminal differentiation. Also, majority of gene expression profiling studies of FBs and MSCs have been done using commercially available cells that rarely originate from the same donor, which makes the genetic background unknown and may introduce individual variation into the comparison of different cell types. The objective of this study was to investigate cell type-specific changes of AdMSCs and FBs during the course of differentiation into adipocytes and osteoblasts in donor-matched samples. Results of gene expression analysis revealed a time-lag in the induction of adipogenesis-related gene expression in FBs, compared with AdMSCs, and delayed differentiation. This delayed differentiation can be related to late induction of zinc finger protein ZNF423 in FBs, compared with AdMSCs.
Materials and Methods
Cell culture
Human subcutaneous adipose tissue and skin dermis from the same donor were used to isolate MSCs and FBs, respectively. AdMSCs were isolated according to Lin et al. and Yamamoto et al. [37,38] with slight modifications. Briefly, adipose tissue was digested with 0.1% collagenase (Gibco) in serum-free DMEM/F12 (Gibco) at 37°C for 1.5 h, followed by neutralization of enzyme activity with 20% fetal bovine serum (FBS) and 1% penicillin–streptomycin DMEM/F12 growth medium. Following centrifugation, stromal cell pellet was passed through a 100-μm nylon mesh (BD Biosciences), resuspended in growth medium, plated at a density of 10,000 cells/cm2, and incubated at 37°C with 5% CO2. After 48 h, medium was replaced to remove nonadherent cells. Further cultivation was performed under standard cell culture conditions. FBs were isolated from dermal skin as previously described [39]. Briefly, primary culture was established by FB outgrowth from skin explants placed onto Primaria dish (BD Falcon) containing 10% FBS and 1% penicillin–streptomycin DMEM-high glucose (Gibco) growth medium.
Immunophenotyping
About 0.5 × 10⁶ cells were collected by trypsinization and incubated on ice for 1 h with 2.5 μg/mL antibodies in phosphate-buffered saline containing 2% bovine serum albumin. Primary antibodies against CD90 (Chemicon), CD73, and CD105 (BD Biosciences) and V5-tag (Invitrogen) as a nonreactive control were used. After incubation with primary antibodies, the cells were washed and incubated on ice for 45 min with secondary antibody conjugated with Alexa-488 (Molecular Probes), washed, and analyzed using FACS Calibur™ flow cytometer (BD).
In vitro differentiation
Passage 2 or 3 cells were plated at a density of 25,000 cells/cm2 at 24 h prior to induction of differentiation. Growth medium containing 10% FBS and 1% penicillin–streptomycin was supplemented with 100 nM dexamethasone, 50 μM
Accumulation of lipid droplets in adipocytes was determined by Oil Red O (ORO) staining at 7, 14, and 21 days postinduction. Briefly, 4% paraformalde-hyde (PFA)-fixed cells were washed with 60% isopropanol, dried for 30 min at room temperature, and incubated with 2 mg/mL ORO solution in isopropanol:water at a ratio of 3:2. Cells were washed 4 times with water and photographed. For quantitative analysis, bound ORO was eluted with 100% isopropanol and optical density was measured at 500 nm.
Osteoblasts were analyzed for the formation of calcified matrix by Alizarin Red S (ARS) staining at 7, 14, and 21 days postinduction. Briefly, 4% PFA-fixed cells were washed with water, incubated for 30 min at room temperature with 20 mg/mL ARS solution, washed 4 times with water, and photographed. For quantitative analysis, the color intensity was determined using Scion Image Analysis software (National Institutes of Health, Bethesda, MD).
Reverse transcription–polymerase chain reaction analysis
Total RNA was isolated from control cells and from cells induced toward adipogenesis and osteogenesis at 1, 2, 3, 7, 14, and 21 days postinduction using a commercial RNA-aqueous kit (Ambion). RNA samples were treated with DNase I using DNA-free™ kit (Ambion) and applied to first-strand cDNA synthesis at 50°C for 60 min with SuperScript™ III Reverse Transcriptase kit (Invitrogen) using Oligo(dT)20 primers. mRNA expression analysis was performed using semiquantitative reverse transcription (RT)–polymerase chain reaction (PCR) with FirePol Master Mix (Solis Biodyne). 7900HT Fast Real Time qPCR System (Applied Biosystems) and Platinum SYBR Green qPCR SuperMix-UDG (Invitrogen) were used for real-time (qRT-PCR) analysis. Primer sets used for amplification are listed in Table 1. mRNA expression values relative to GAPDH were calculated according to Applied Biosystems' Comparative Ct Method [40].
ALP, alkaline phosphatase; C/EBPα, CCAAT/enhancer binding protein alpha; FABP4, fatty acid binding protein 4; GAPDH, glyceraldehyde 3-phosphate dehydrogenase; RUNX2, runt-related transcription factor 2; SHARP1, basic helix-loop-helix transcription factor.
Western blot analysis
Cells were lysed in RIPA buffer (50 mM Tris–HCl [pH 7.4], 150 mM NaCl, 2 mM EDTA, 1% NP-40, 0.1% sodium dodecyl sulfate) with 1 × Protease Inhibitor Coctail (Roche) for protein extraction at indicated time points following initiation of differentiation. Twenty-eight micrograms of protein lysate was separated on 10% sodium dodecyl sulfate–polyacrylamide gel electrophoresis and transferred onto polyvinylidene fluoride (PVDF) membrane using a semidry blotting system (Amersham Biosciences). The membrane was stained with Ponceau dye (Amresco) for loading control prior to blocking with 4% nonfat dry milk solution in 1 × TBS–0.1% Tween 20 for 2 h at room temperature. Primary antibody incubations were performed overnight at 4°C at dilutions 1:1,000 for mouse anti-human PPARγ (Chemicon), 1:1,000 for rabbit anti-human C/EBPβ (Santa Cruz), and 1:2,000 for mouse anti-human adiponectin (Chemicon). Secondary horseradish peroxidase-conjugated anti-mouse or anti-rabbit antibody (Abcam) incubations at 1:10,000 dilutions were performed for 1 h at room temperature, followed by washing and signal visualization with SuperSignal West Pico Chemiluminescent Substrate (Thermo Scientific).
Data analysis
Differentiation assay and mRNA expression analysis were performed in triplicates using cells from 2 donors. Values for ORO or ARS staining for each time point were obtained by subtracting mean values of control cells from mean values of treated cells for each donor. The resulting values were then statistically compared (2 against 2) using Student's t-test (α = 0.05), assuming equal 2-sample variance.
PPARγ2, C/EBPα, and FABP4 mRNA expression values were calculated relative to their expression at day 0 time point in AdMSCs from one of the donors. Basic helix-loop-helix transcription factor (SHARP1) and ZNF423 mRNA expression values were calculated relative to their expression at day 0 time point in AdMSCs. Each value for mRNA expression (from 2 donors in triplicate) was separately included in the statistical comparison using Student's t-test (α = 0.05), assuming equal 2-sample variance. Single-factor analysis of variance was used to compare relative SHARP1 and ZNF423 mRNA expression values between different time points during differentiation.
Results
AdMSCs and FBs share similar phenotype and differentiation potential
Similarity of AdMSCs and tissue FBs (stromal cells) has been reported in several publications. Flow cytometry analysis of early passage AdMSCs and dermal FBs isolated from 2 individuals showed that both cell types express surface molecules 5′-nucleotidase/CD73, Thy1/CD90, and endoglin/CD105 that are characteristic to MSCs and lack the expression of leukocyte marker CD45 (Fig. 1). In general, we observed AdMSCs to be morphologically more heterogeneous and to exhibit lower growth rate in cell culture compared with FBs.
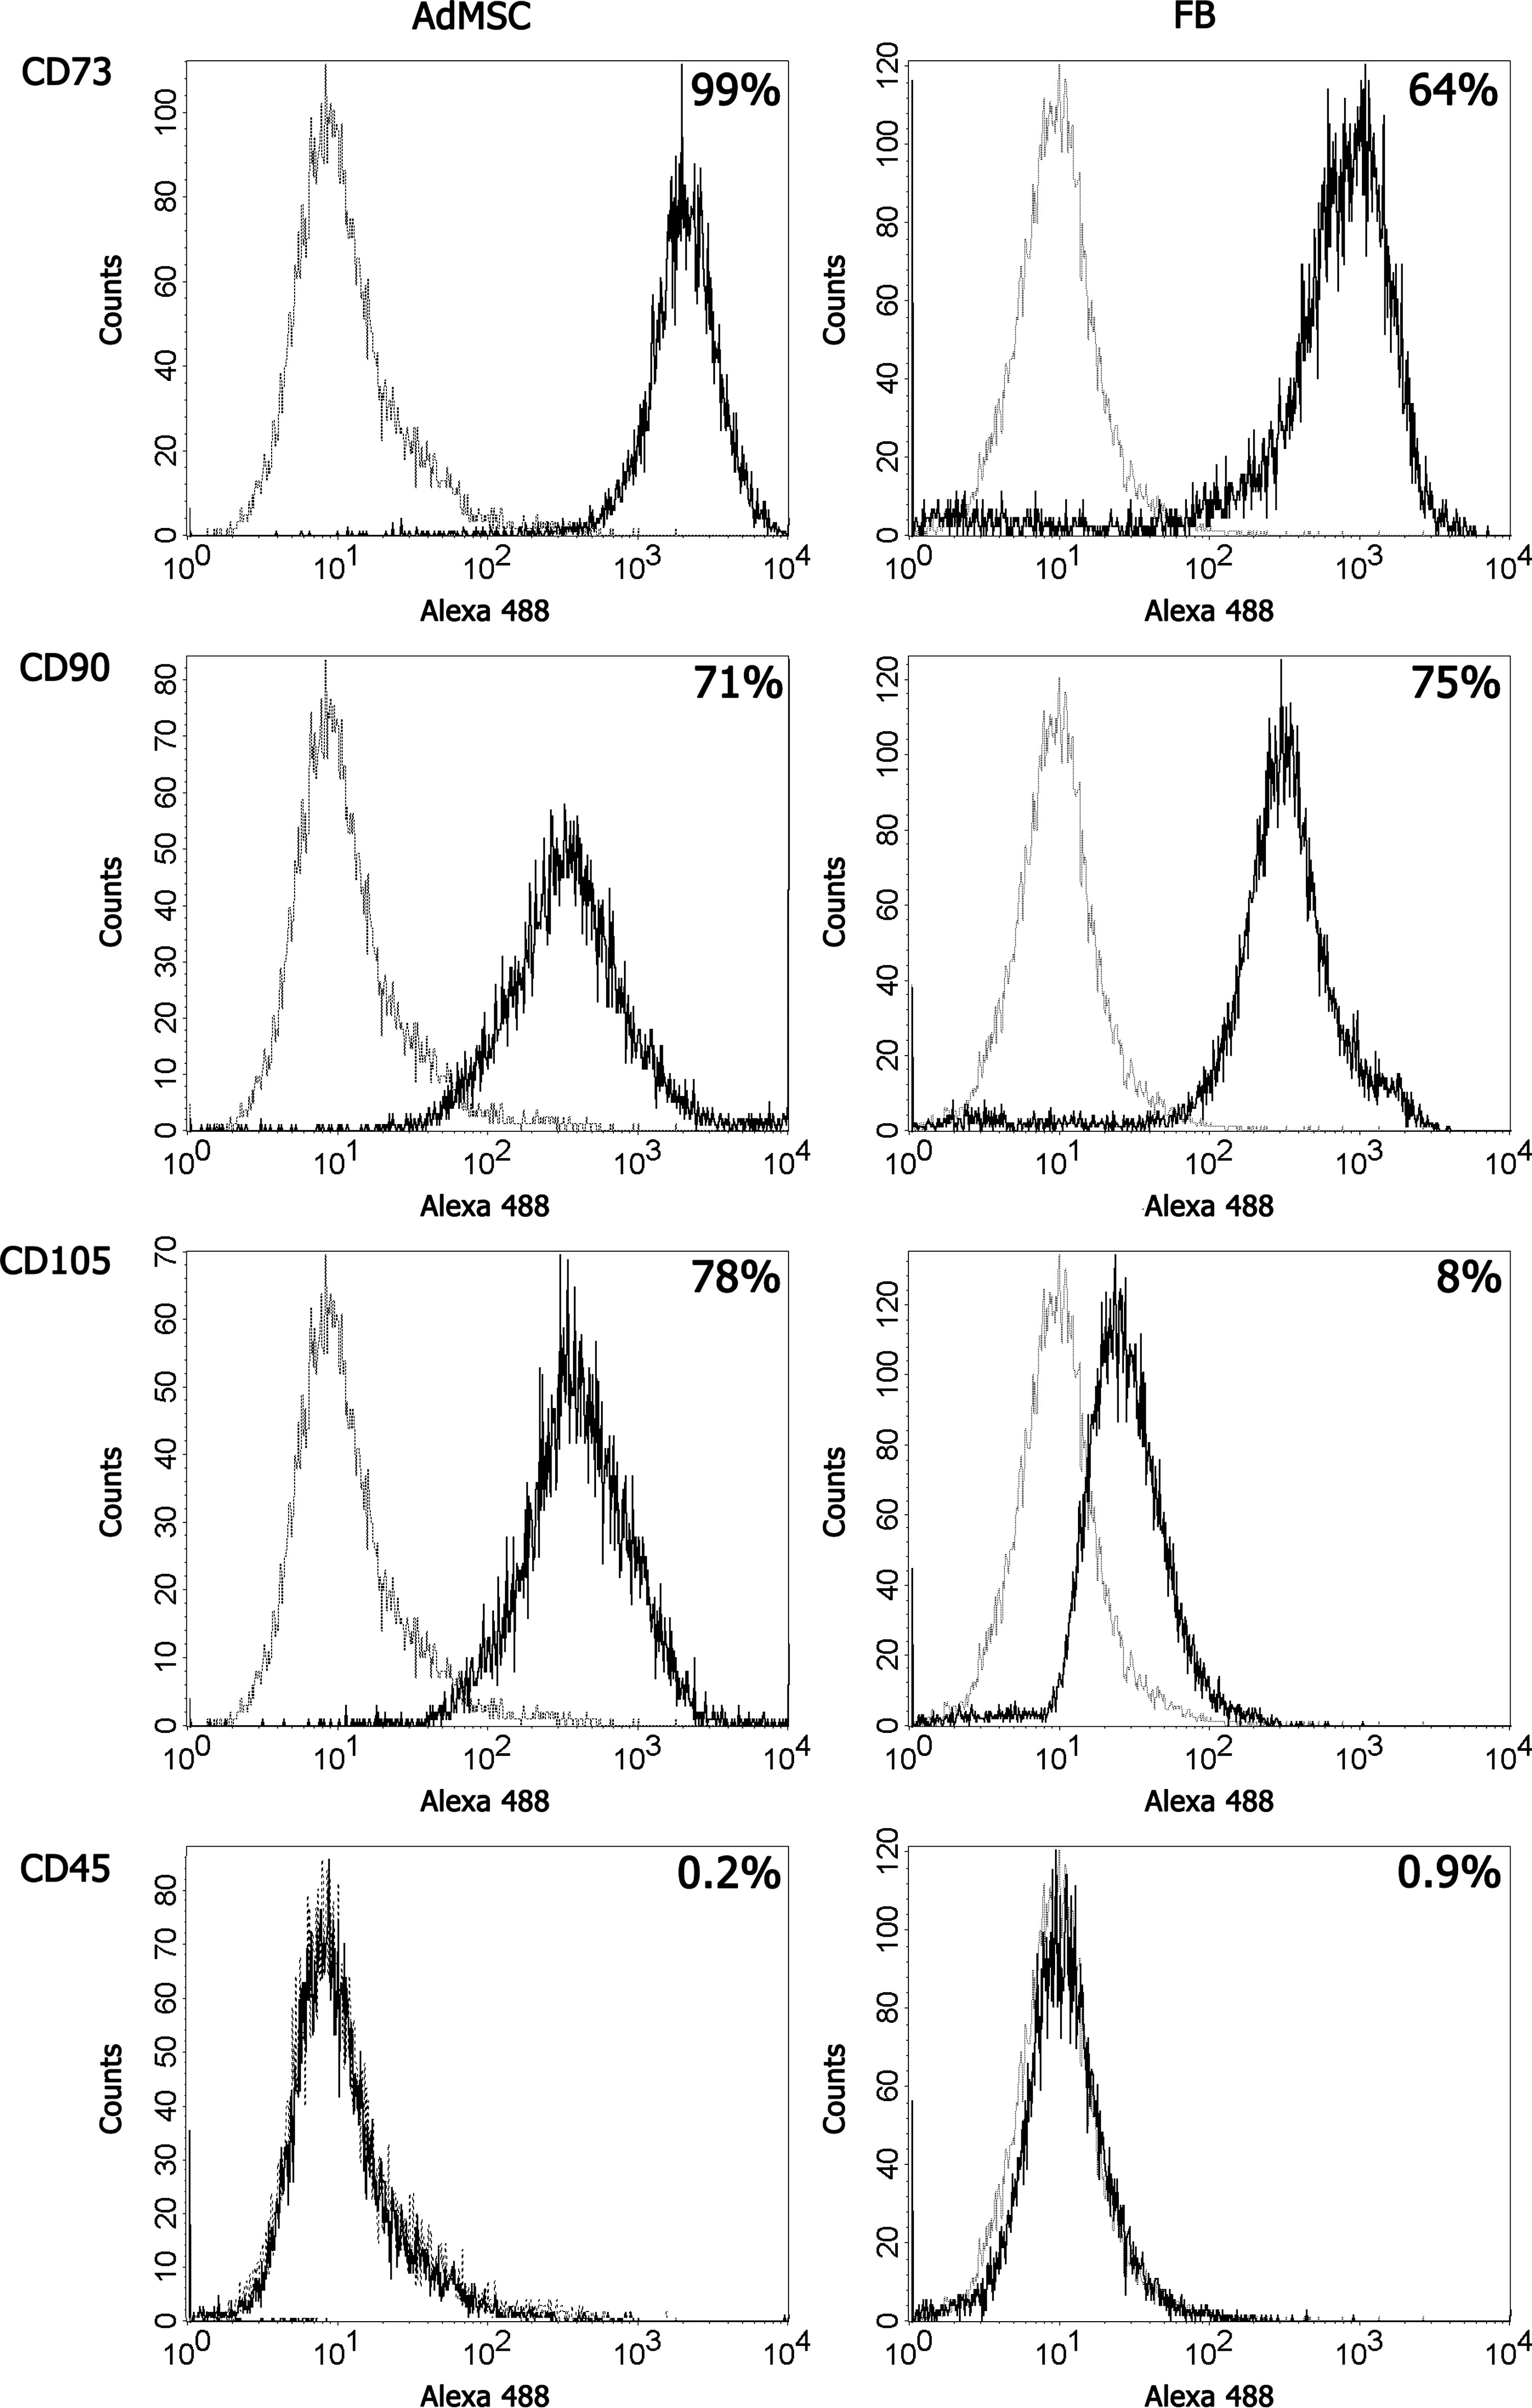
AdMSCs and FBs express MSC-specific surface markers. AdMSCs (left column) and FBs (right column) were stained with antibodies against indicated surface molecules and analyzed using flow cytometry. Histograms depict positive antibody reactivity (bold line) in relation to irrelevant V5-tag antibody staining (regular line) and are representative of cells from 2 donors. AdMSCs, adipose tissue-derived mesenchymal stem cells; FBs, fibroblasts.
To compare the adipogenic and osteogenic differentiation potential of isolated AdMSCs and FBs, passage 2 or 3 cells were plated at 24 h prior to addition of differentiation media supplemented with dexamethasone, IBMX, indomethacin, and insulin for induction of adipogenesis or with dexamethasone,
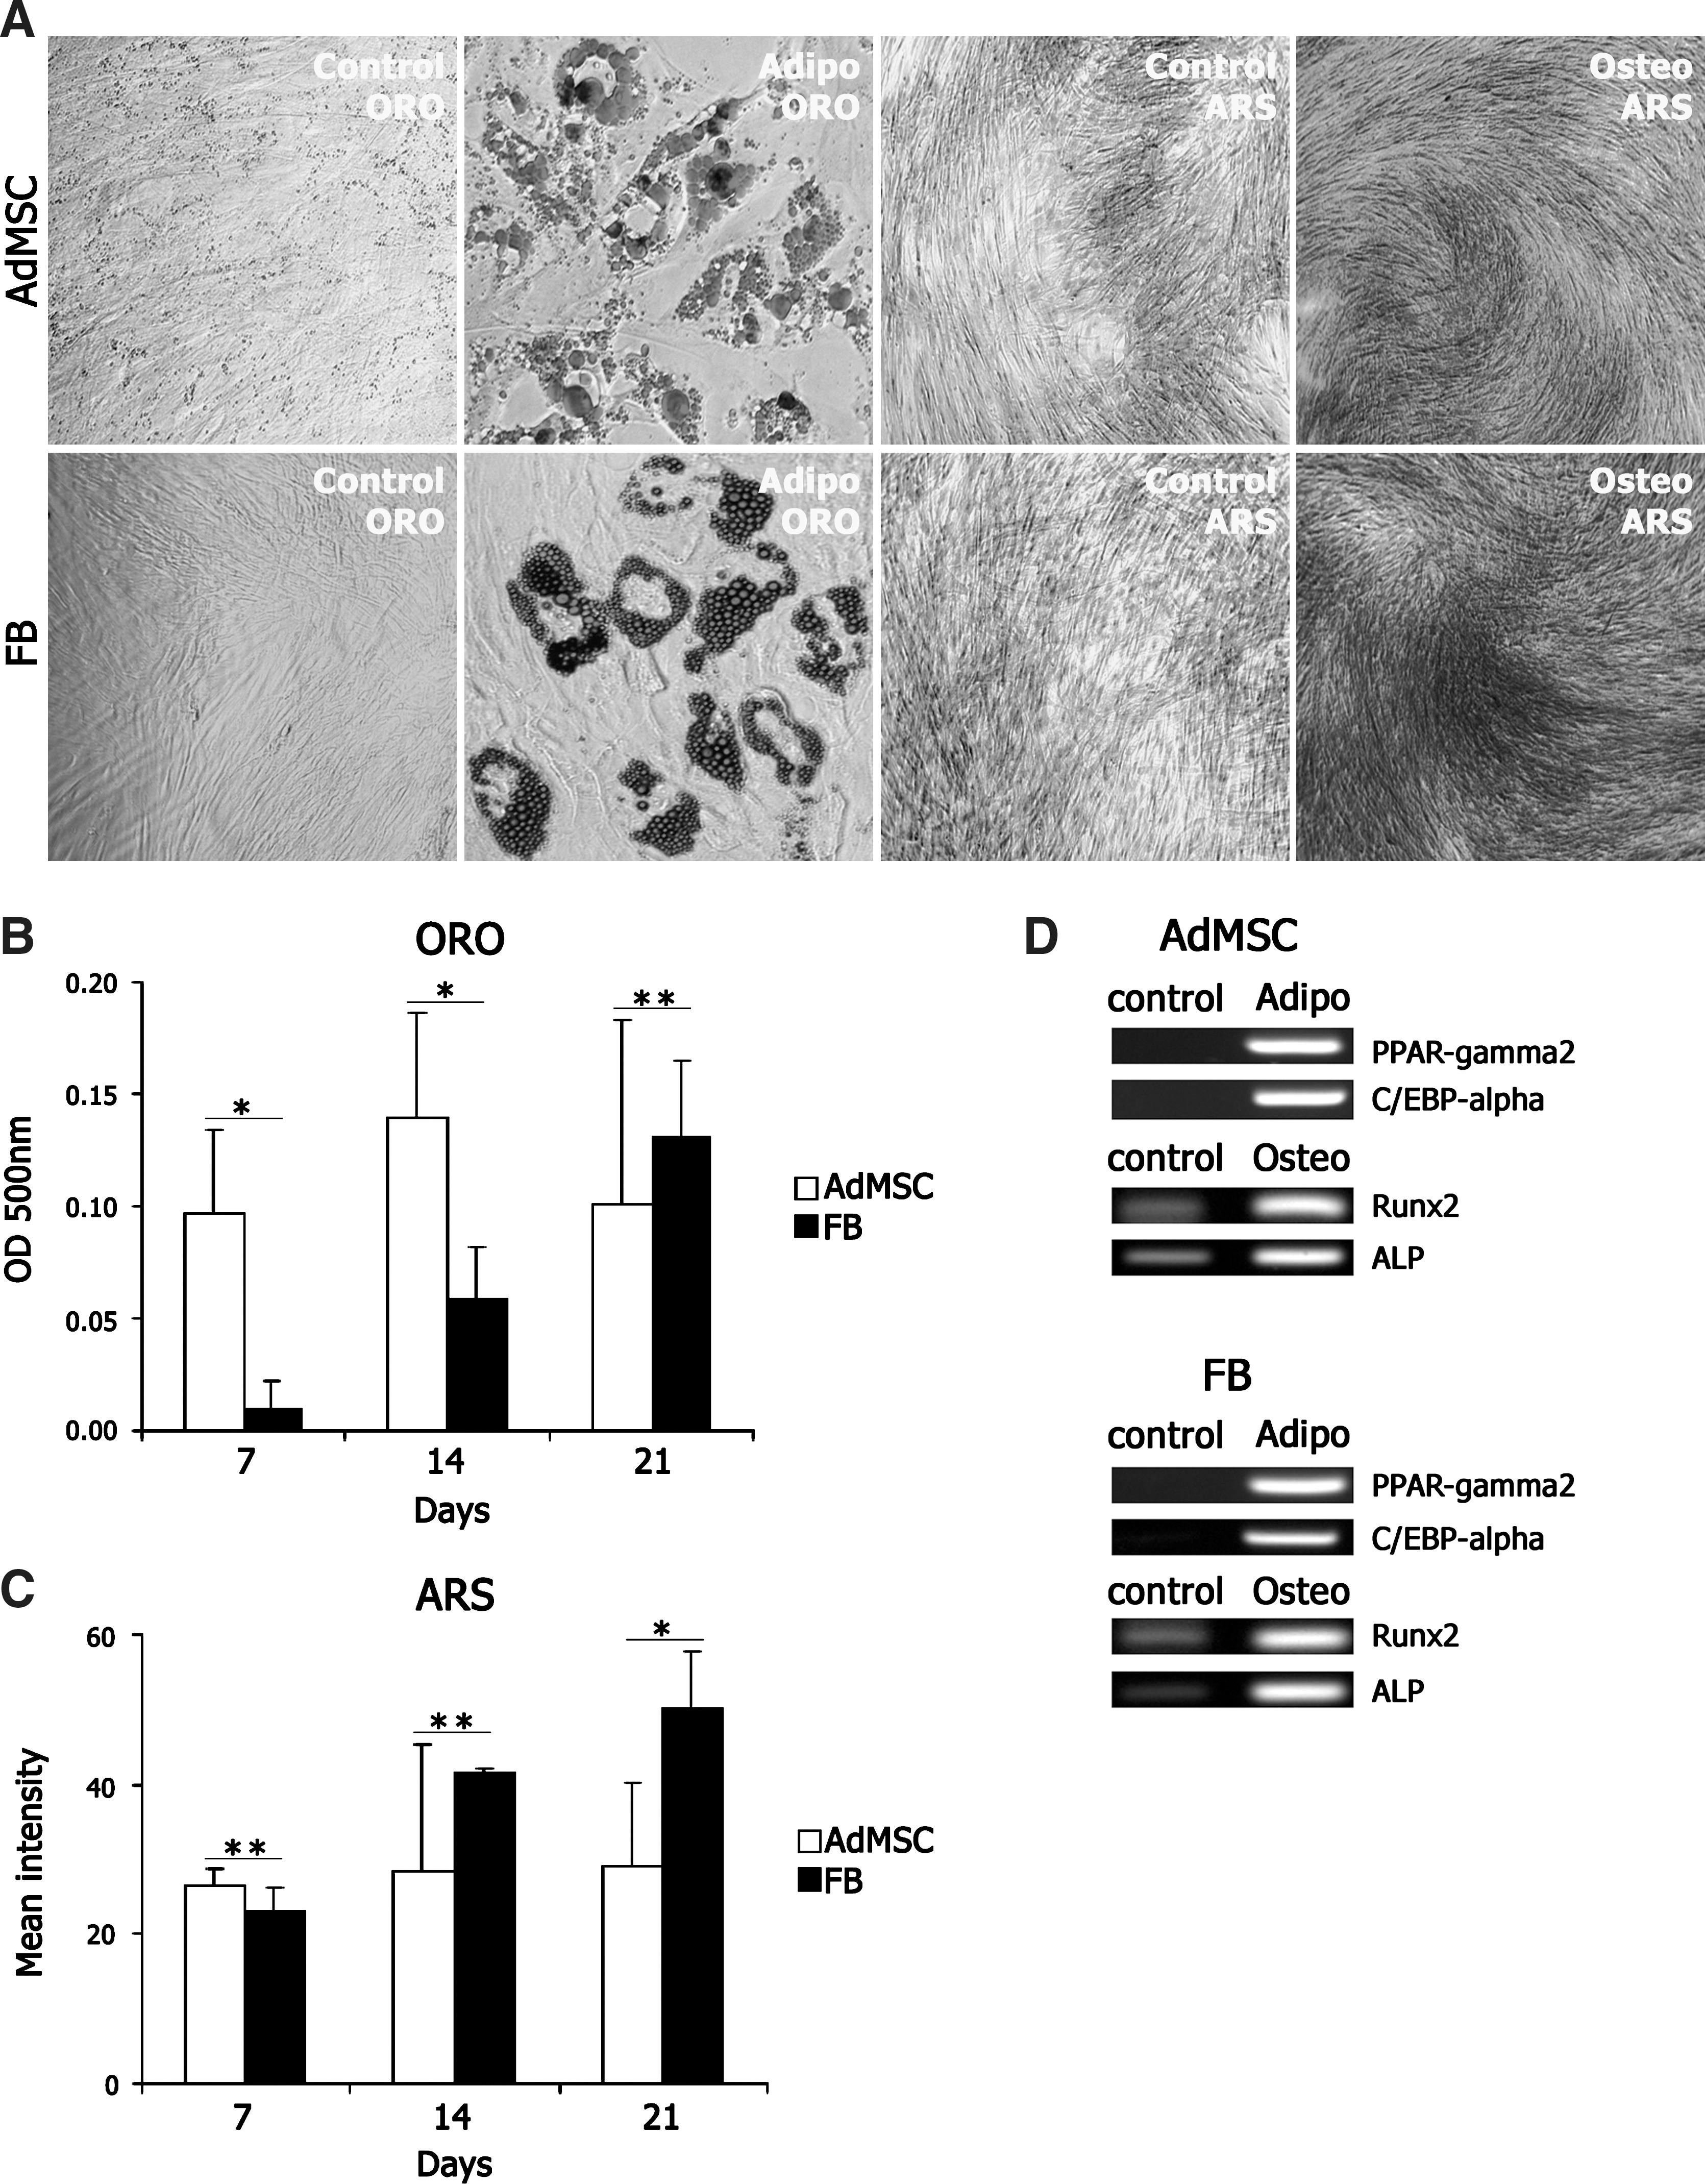
AdMSCs and FBs differentiate into adipocytes and osteoblasts with a delay in adipogenic differentiation of FBs. ORO and ARS staining of unstimulated cultures (control) and adipogenic or osteogenic cultures, respectively, following 21 days of differentiation.
Adipogenesis of dermal FBs is delayed compared with AdMSCs
To explore the differences in adipogenic induction of AdMSCs and FBs, the expression of well-characterized adipogenic transcription factors was studied in both cell types using western blot analysis. Cells were plated at a density of 10,000 cells/cm2 at 3 days prior to adipogenic induction and protein lysates were prepared from both cell types on days 0, 1, 3, 5, and 7 postinduction. Western blot analysis of C/EBPβ, PPARγ, and its target gene adiponectin confirms the onset of differentiation in both AdMSCs and FBs (Fig. 3A). Nearly identical induction of C/EBPβ protein was detected during differentiation of both cell types. In contrast, induction of PPARγ was different in FBs compared with AdMSCs. PPARγ expression was induced within 24 h following the start of differentiation in AdMSCs, whereas induction of PPARγ in FBs was delayed 3 days. The lag in PPARγ protein expression early in adipogenic induction strongly correlates with the delayed formation of lipid vacuoles in FBs during adipogenic differentiation (Fig. 2B).
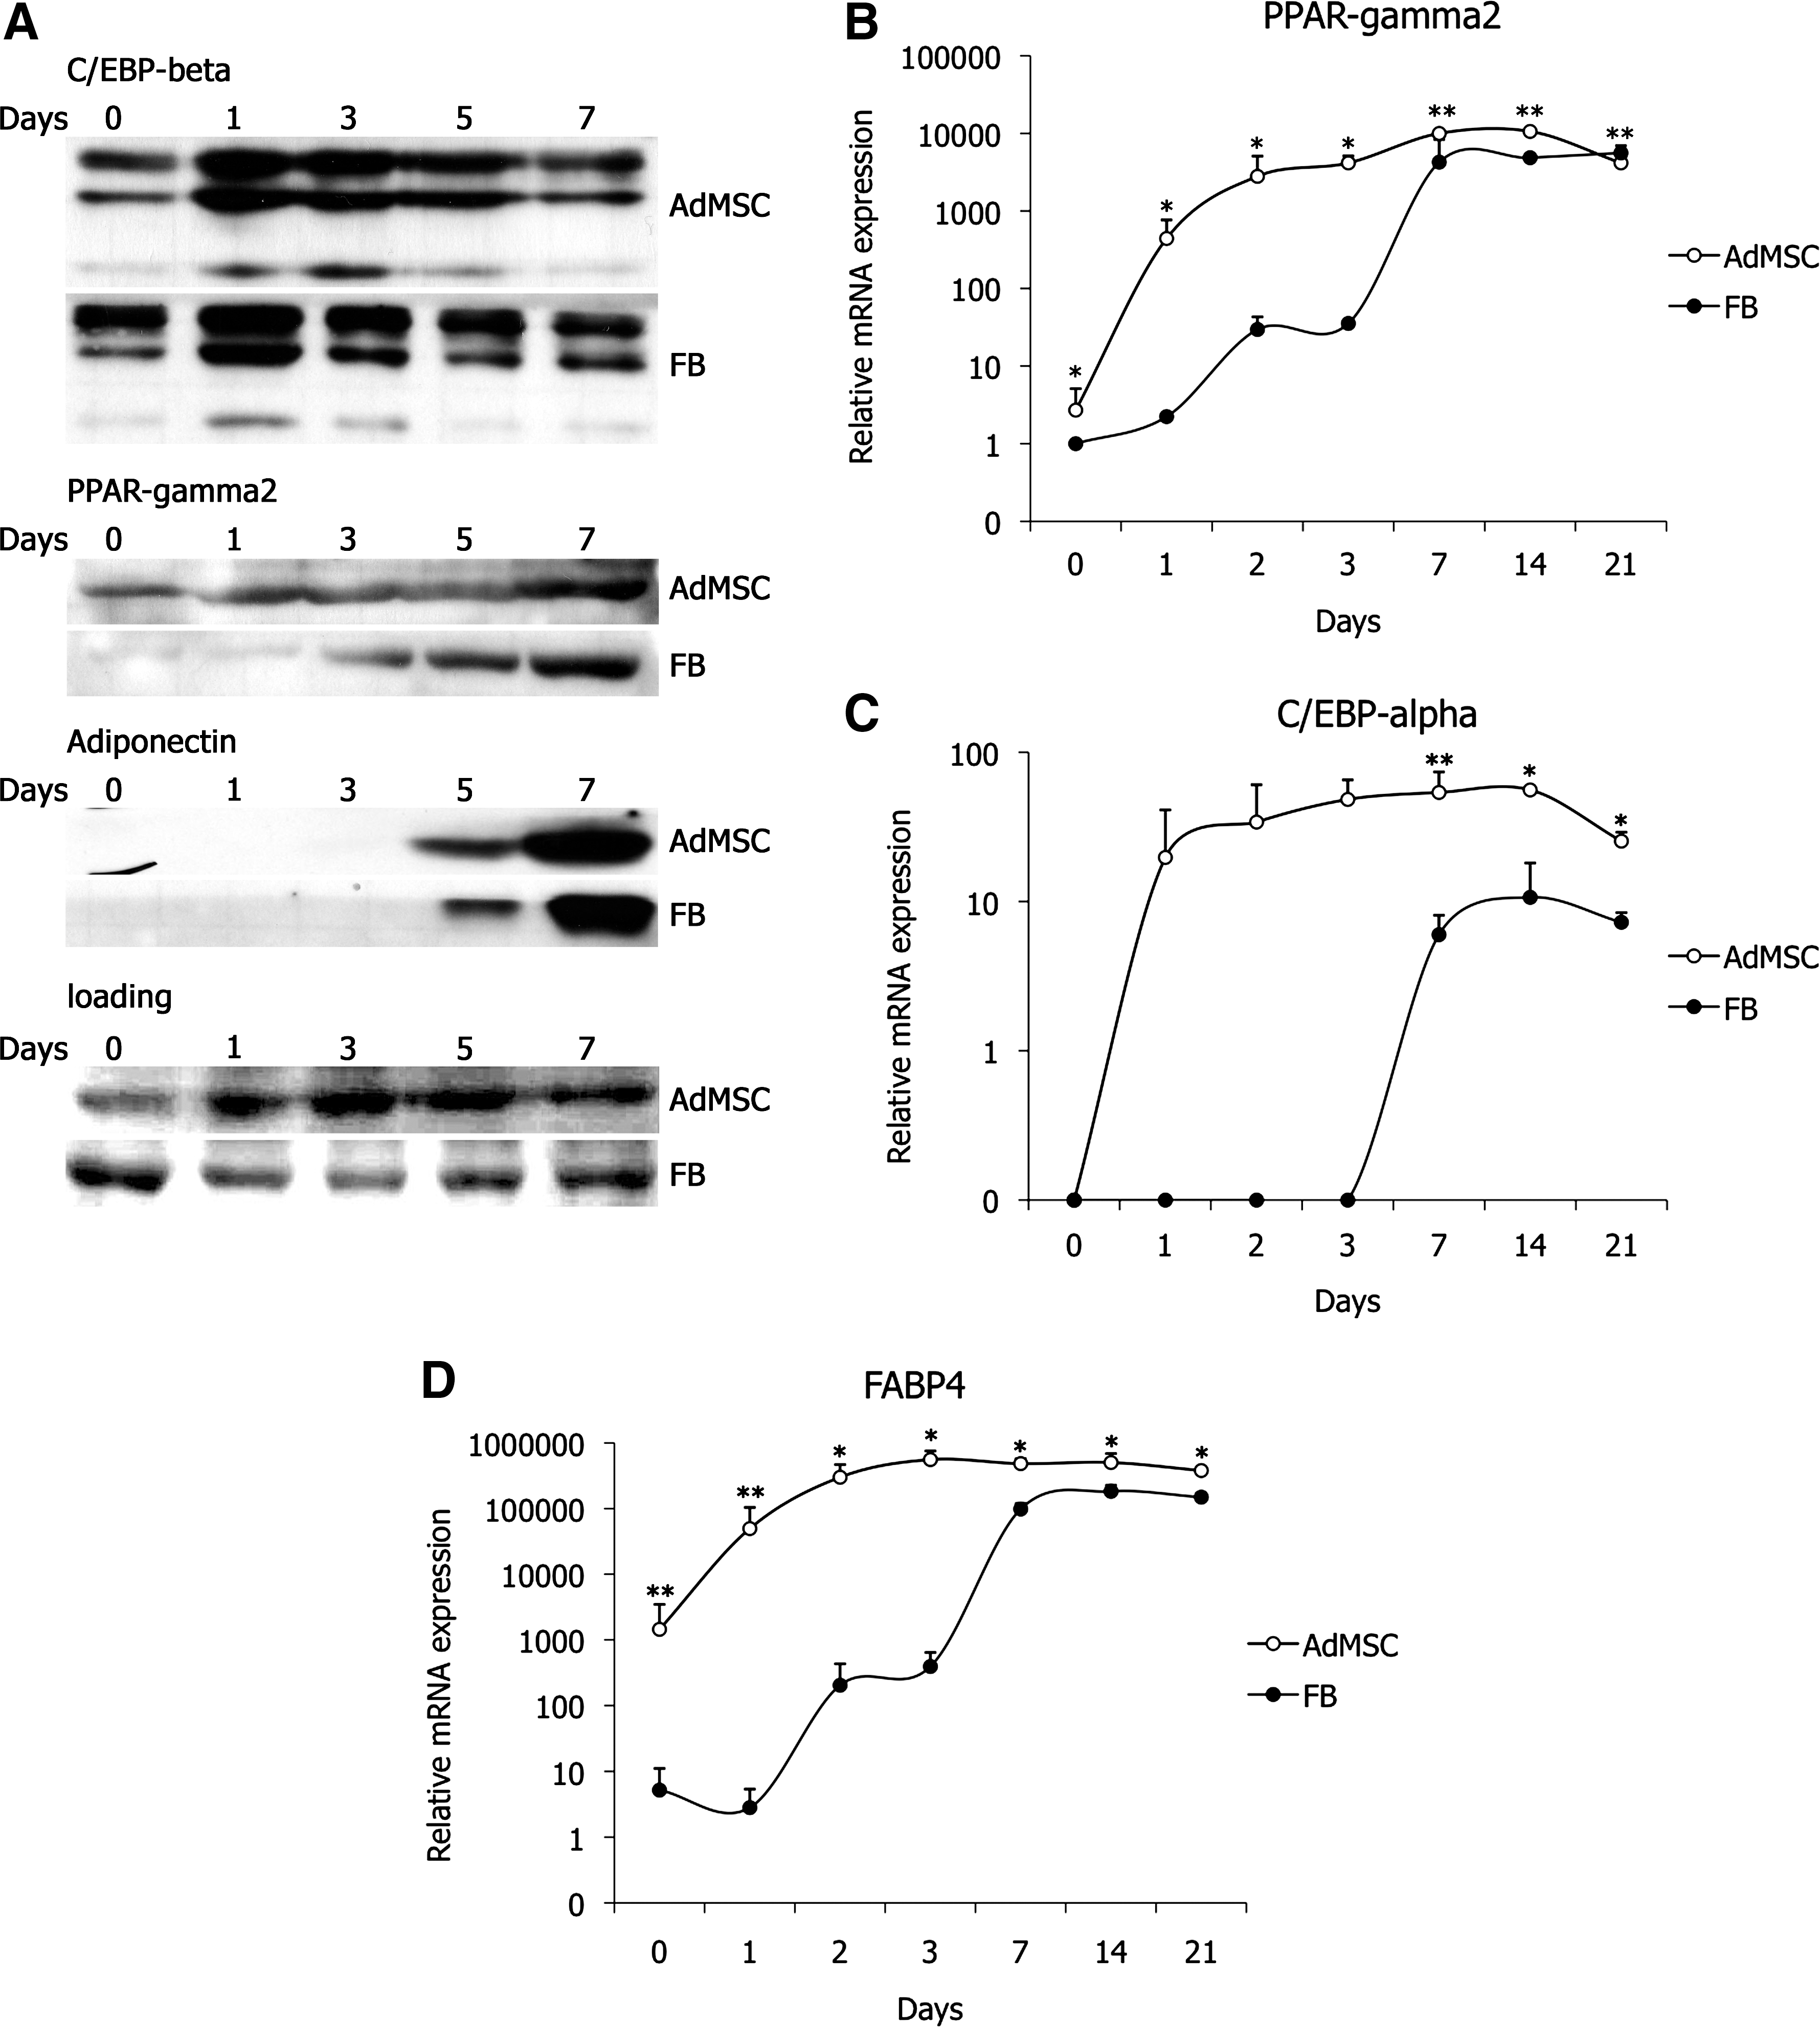
AdMSCs and FBs express adipocyte markers, but the induction of marker expression is delayed in FBs compared with AdMSCs. Western blot analysis of adipogenic proteins at indicated time points in AdMSCs (upper rows) and FBs (lower rows) stimulated with adipogenic medium. Ponceau-stained membrane serves as a loading control
To further elucidate the induction of lineage-specific genes during adipogenesis in AdMSCs and FBs, expression of PPARγ2, C/EBPα, and FABP4 was analyzed using qRT-PCR on days 0, 1, 2, 3, 7, 14, and 21 following induction of differentiation. Rapid induction of mRNA expression of all 3 genes within 1 day upon induction of adipogenesis with further elevation by day 3 (Fig. 3B–D) was observed in AdMSCs. Interestingly, expression of PPARγ2 and FABP4 was only slightly stimulated in FBs (Fig. 3B, D), and no expression of C/EBPα mRNA was detected (Fig. 3C). The expression of PPARγ2, C/EBPα, and FABP4 was induced between 3 and 7 days of adipogenic induction; however, the mRNA level of C/EBPα in FBs never reached the level of that in AdMSCs during the 21-day differentiation assay. Taken together, the mRNA expression of adipocyte-related transcription factors and their target genes in response to adipogenic stimulation occurs much faster in AdMSCs compared with FBs, with a lag period between 3 and 7 days in FBs.
Delayed adipogenesis is not due to inhibition of C/EBPβ activity in FBs
As a master regulator of adipogenesis, C/EBPβ activity is regulated by numerous transcription factors by protein/protein interactions or DNA binding. It has been shown that the transcription factors RORα, SHARP1, and pseudokinase TRB3 suppress the activity of C/EBPβ in several cell types [41 –43]. We studied the expression of RORα, SHARP1, and TRB3 using qRT-PCR in AdMSCs and dermal FBs following adipogenic induction. SHARP1 expression was transiently downregulated following adipogenic induction and upregulated again by day 7 in both AdMSCs and FBs (Fig. 4A). This is consistent with previously published data [42]. RORα and TRB3 showed similar expression patterns (data not shown). Together, our results demonstrate that the expression of the inhibitors of C/EBPβ activity is equally suppressed in AdMSCs and FB upon adipogenic induction, suggesting that the delayed adipogenesis of FBs compared with AdMSCs cannot be explained by the inhibition of C/EBPβ activity by RORα, SHARP1, or TRB3 in FBs.
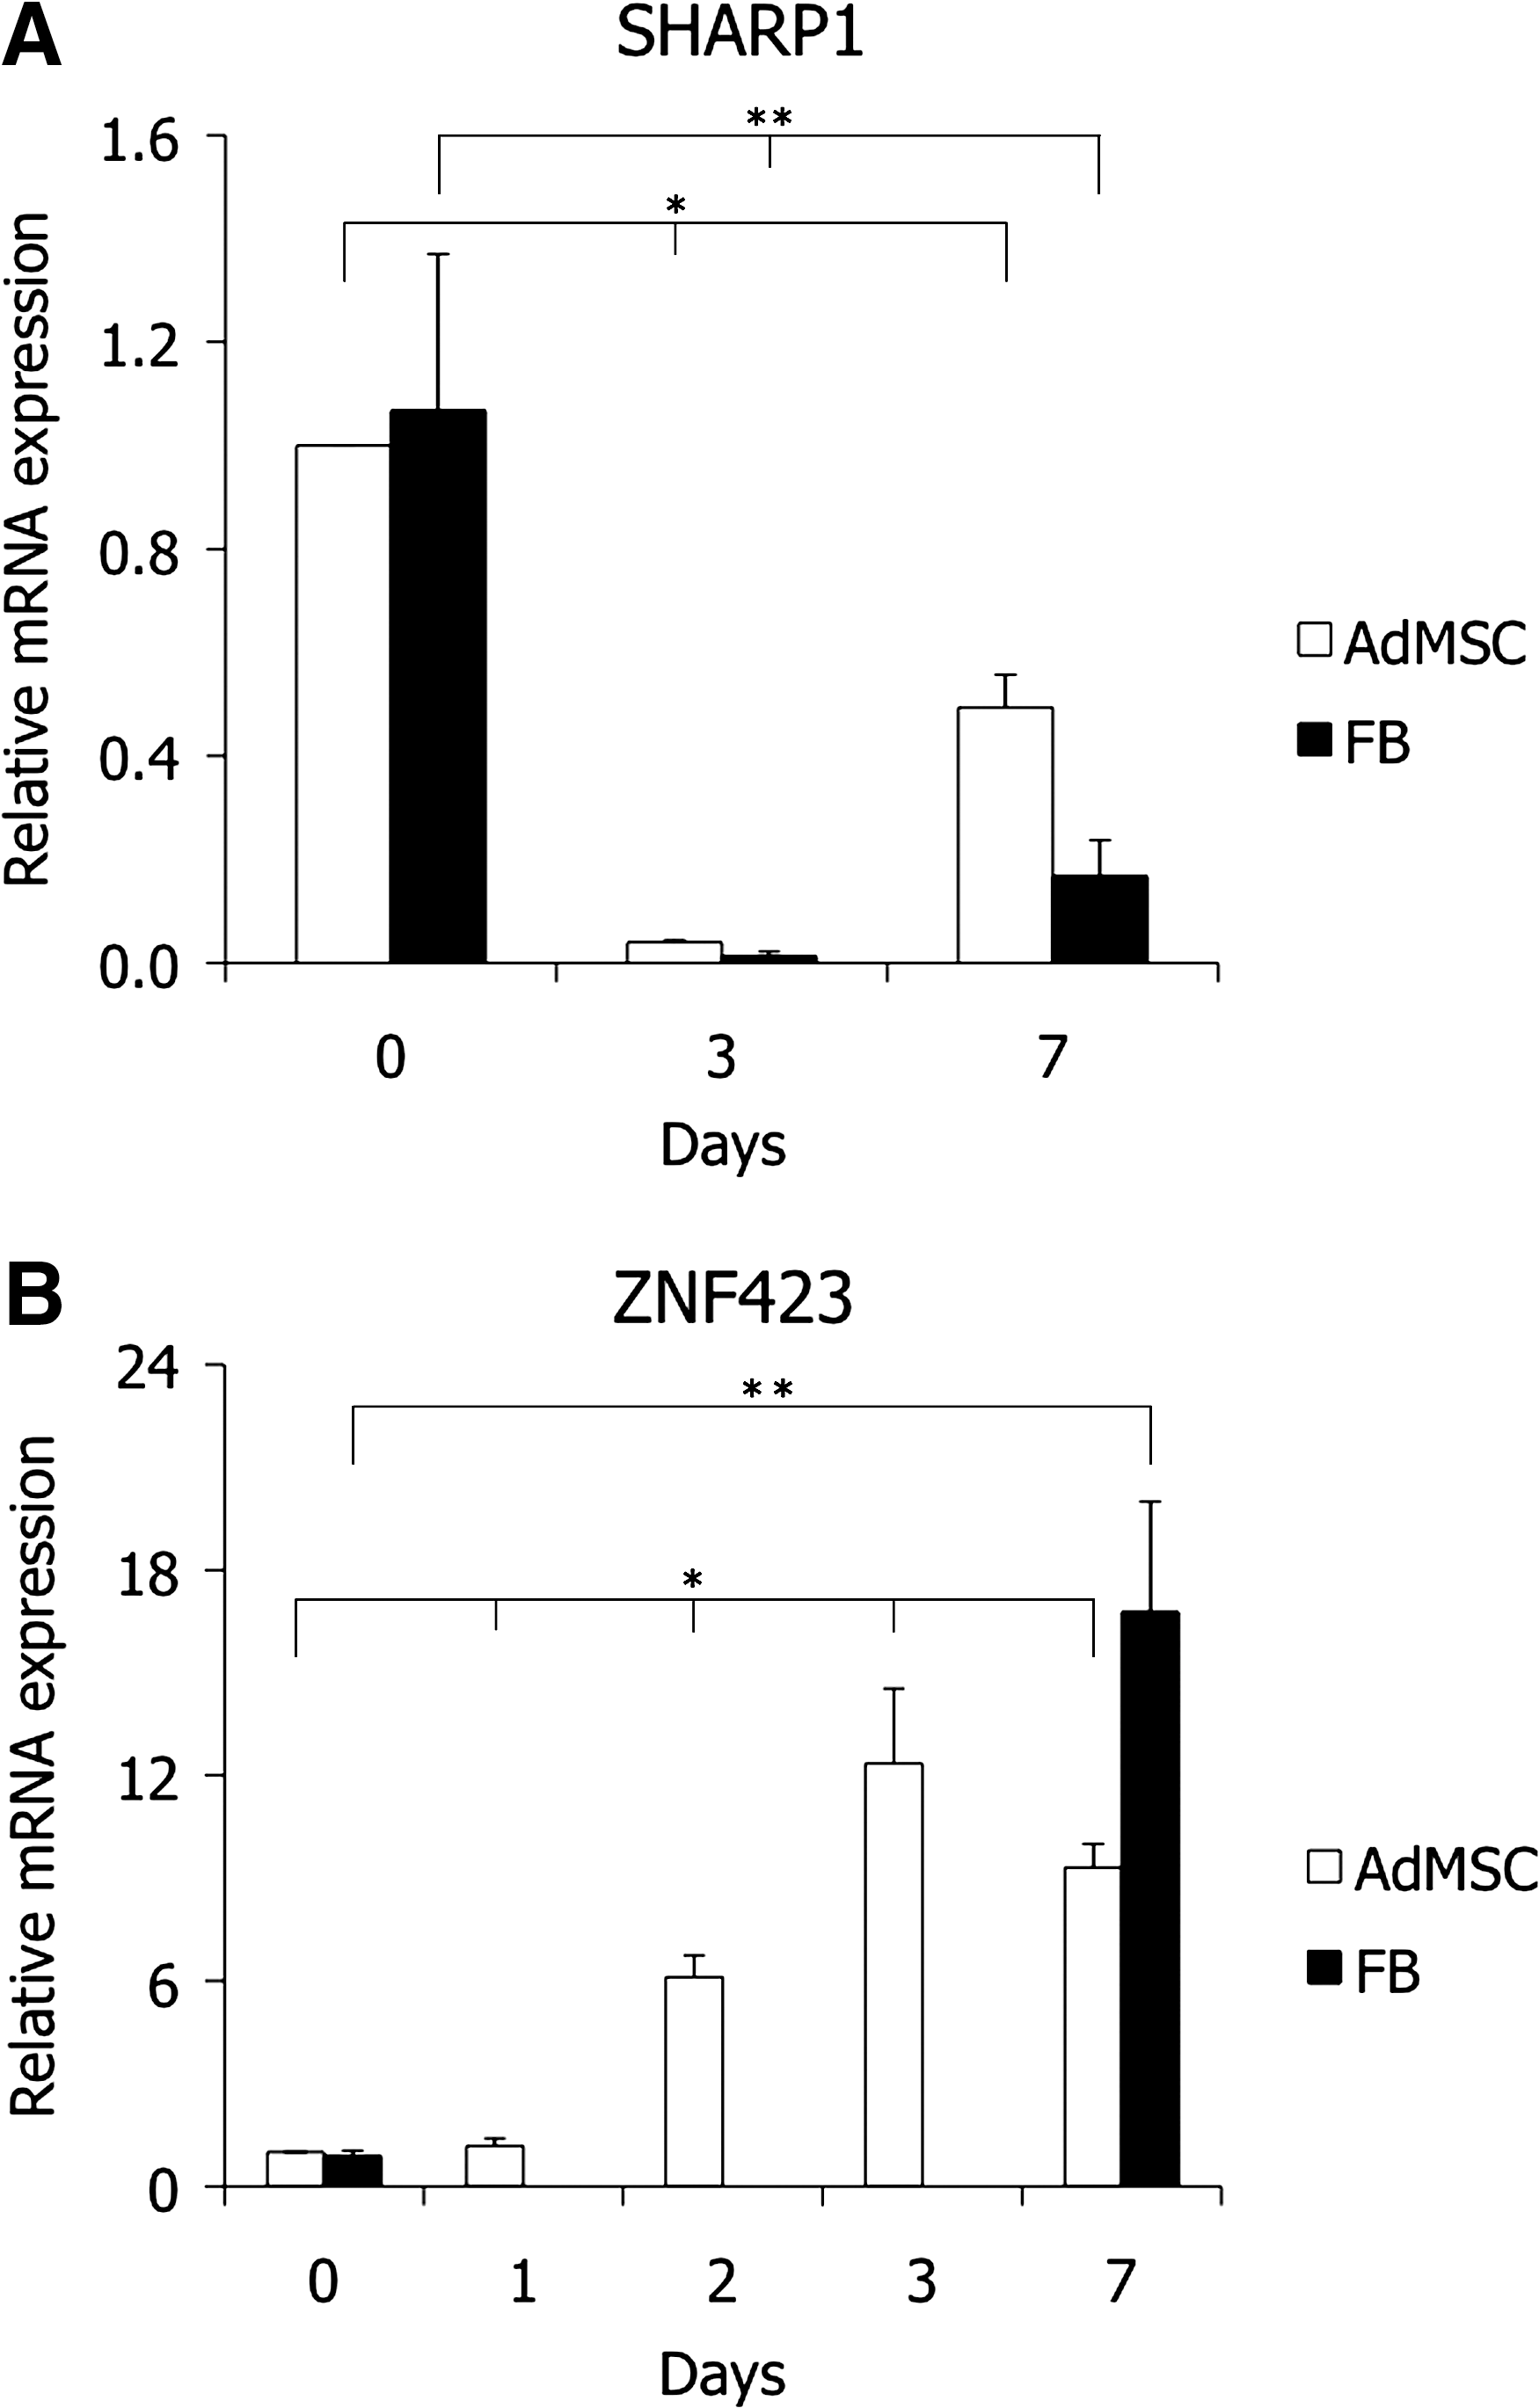
(SHARP1) and ZNF423 expression in AdMSCs and FBs during adipogenic differentiation. Results of qRT–polymerase chain reaction analysis show transient downregulation of SHARP1 mRNA levels in both AdMSCs and FBs
ZNF423, a regulator of PPARγ expression, shows delayed induction in FBs
It has been shown that PPARγ expression can be regulated independently from the C/EBPβ activity. Recently, a zinc-finger protein ZFP423 (ZNF423 in humans) was identified as a critical regulator of PPARγ expression in the preadipocyte state of murine FBs [25]. We analyzed the expression of ZNF423 using qRT-PCR in AdMSCs and FBs following adipogenic induction. Expression of ZNF423 was induced on day 2 postinduction and was further induced by day 3 (Fig. 4B) in treated AdMSCs. In contrast, no induction of ZNF423 expression was observed in FBs until day 7 of adipogenic induction. The results indicate that ZNF423 could regulate PPARγ expression in AdMSCs and FBs, and therefore, its late induction can be involved in the delayed adipogenic differentiation of FBs. The specific differences in the molecular mechanisms of early stages of induced adipogenesis of AdMSCs and FBs remain to be elucidated.
Discussion
Adult MSCs possess stem cell-like properties such as self-renewal and differentiation into a variety of cell types of mesodermal origin. In vitro studies have led to the use of a limited collection of surface molecules expressed by MSCs and differentiation of cells toward mesenchymal lineages such as adipocytes, osteoblasts, and chondrocytes to confirm the MSC-like nature of isolated cells. Several adult tissues have been found to contain MSCs, including subcutaneous adipose tissue that holds a great promise for therapeutic applications as an easily accessible source of MSCs.
FBs are present in many tissues including adipose tissue, bone marrow, skin, synovium, and cord blood [44,45] and they have many characteristics of MSCs. There are no MSC-specific markers or profiles of markers available that clearly distinguish MSCs from FBs (stromal cells). The minimal criteria proposed by the Mesenchymal and Tissue Stem Cell Committee of the International Society for Cellular Therapy, to distinguish MSCs from other cell types, has proven not to be sufficient because all the characteristics described for MSCs are equally possessed by FBs [46]. In this study, we further demonstrate that dermal FBs and AdMSCs express the same set of surface antigens, marking FBs and AdMSCs as phenotypically indistinguishable cell types. Gene expression profiling has uncovered slight differences between MSCs and FBs [21]; however, similar differences also exist between different populations of MSCs [14]. Translation of the variation in gene expression into functional characteristics of these cells, for example, multipotent differentiation capacity, has not been achieved until today, leaving the question about the different identities of MSCs and FBs unanswered.
Assessment of in vitro mesenchymal differentiation is commonly performed by detection of lineage-specific marker expression or cytochemical staining of terminally differentiated cells grown under stimulating conditions for 2–4 weeks. In accordance with previous reports, our work shows that by the end of the long-term differentiation assay, both AdMSCs and FBs have differentiated into adipocytes and osteoblasts, indicating that these cells are developmentally equivalent.
The process of differentiation of multipotent cells into functionally distinct mature cell types requires a sequential expression of genes that determine the phenotype of the differentiated cells. FBs and AdMSCs have similar dynamics of osteogenic differentiation based on the analysis of calcium phosphate deposits using staining with ARS. In contrast, analysis of adipogenic differentiation of AdMSCs and FBs using ORO staining showed significant differences in the dynamics of differentiation between MSCs and FBs. AdMSCs and FBs exhibit different degrees of adipocyte-specific staining early during adipogenic differentiation, whereas this difference was not detectable after 3 weeks of differentiation.
One of the earliest events in adipogenesis is the induction of transcription factor C/EBPβ, which together with C/EBPδ activates the expression of transcription factors PPARγ and C/EBPα which, in turn, orchestrate the expression of full adipogenic differentiation program. Analysis of expression of C/EBPβ transcription factor showed no difference in AdMSCs and FBs during adipogenic differentiation. On the contrary to the induction of C/EBPβ expression, induction of PPARγ expression was significantly delayed in FBs compared with AdMSCs, raising the question of different regulatory mechanisms controlling the early stages of adipogenic differentiation of MSCs and FBs. Analysis of PPARγ, C/EBPα, and FABP4 expression clearly demonstrated delayed induction of these genes in FBs compared with MSCs following induction of adipogenesis. Interestingly, in FBs, the mRNA level of C/EBPα, the second most important transcription factor in adipogenesis, never reached the level of that in AdMSCs. Despite these differences, known markers for adipocytes such as FABP4 and adiponectin showed similar expression levels in FB- and AdMSC-derived adipocytes. This could be explained by previous observations that C/EBPβ and C/EBPδ induce adipogenesis with no stimulation of C/EBPα expression in FBs [24]. Further, it is noteworthy that the mRNA of C/EBPα is undetected until day 7 when PPARγ mRNA level peaks in FBs. This finding is in correlation with the fact that C/EBPβ cannot induce the expression of C/EBPα without PPARγ, which is required to release histone deacetylase 1 (HDAC1) from C/EBPα promoter [47,48].
As C/EBPβ protein was equally induced in AdMSCs and FBs during adipogenic stimulation and the induction of PPARγ expression was delayed in FBs, we analyzed several potential inhibitors of C/EBPβ activity in FBs and AdMSCs following adipogenic induction. The expression of PPARγ depends on the activity of C/EBPβ, which binds PPARγ promoter to activate its transcription. We analyzed whether C/EBPβ activity could be suppressed in FBs by known negative regulators and therefore result in the delayed induction of PPARγ. Analysis of expression of well-known inhibitors of C/EBPβ activity, such as transcription factors SHARP1 and RORα as well as a pseudokinase TRB3, did not reveal any difference in the expression in AdMSCs and FBs following adipogenic induction. Transient downregulation of the expression of these regulators upon adipogenic induction was occurring similarly in both cell types. We concluded that the activity of C/EBPβ protein induced upon adipogenic stimulation in AdMSCs and FBs was not inhibited in FBs for an extended period of time to cause the delayed induction of PPARγ and adipogenic differentiation in these cells. PPARγ expression and adipogenesis are also regulated by Wnt and cell cycle-related regulatory proteins that function independently of C/EBPβ. For example, WNT10b shifts stromal cell development from adipogenesis toward osteoblast differentiation by suppressing the expression of PPARγ and C/EBPα [49,50]. pRB has been reported to associate with PPARγ, together with HDAC3, leading to the inhibition of adipogenesis [51]. The analysis of C/EBPβ-independent factors as potential regulators of delayed adipogenesis of FBs was beyond the scope of the present work.
One of the few factors known to define the adipose-lineage–committed FBs is a zinc finger transcription factor ZFP423, which controls preadipocyte determination of murine FBs [25] by regulating PPARγ expression. Our data show that the expression of ZNF423 was detected 2–3 days following adipogenic induction in AdMSCs, whereas in FBs it became detectable after 7 days of induction. These results indicate that ZNF423 could regulate PPARγ expression in AdMSCs and FBs upon adipogenic induction, and therefore, its late induction can be involved in the delayed adipogenic differentiation of FBs.
Presented data suggest that AdMSCs and FBs may possess different mechanisms for the regulation of the initial stages of adipocyte differentiation that involves distinct regulation of PPARγ expression.
Footnotes
Acknowledgment
The authors thank Sten Linnarsson for useful comments on the manuscript.
Author Disclosure Statement
None of the authors has any disclosure to declare. No competing financial interests exist.