
Abstract
Special features of mesenchymal stem cells (MSCs) have made them a popular tool in cell therapy and tissue engineering. Although mouse animal models and murine MSCs are common tools in this field, our understanding of the effect of in vitro expansion on the behavior of these cells is poor and controversial. In addition, in comparison to human, isolation of MSCs from mouse has been reported to be more difficult and some unexplained features such as heterogeneity and slow growth rate in the culture of these cells have been observed. Here we followed mouse bone marrow MSCs for >1 year after isolation and examined the effect of expansion on changes in morphology, growth kinetics, plasticity, and chromosomal structure during in vitro culture. Shortly after isolation, the growth rate of the cells decreased until they stopped dividing and entered a dormant state. In this state the size of the cells increased and they became multinuclear. These large multinuclear cells then gave origin to small mononuclear cells, which after a while resumed proliferation and could be expanded immortally. The immortal cells had diminished plasticity and were aneuploid but could not form tumors in nude mice. These results suggest that mouse bone marrow MSCs bear several modifications when expanded in vitro, and therefore, the interpretation of the data obtained with these cells should be done more cautiously.
Introduction
M
MSCs isolated from the BM of mouse, the most common laboratory animal in biomedical research, have been used in numerous studies. Some investigators have reported the presence of chromosomal abnormalities and tumorigenic potential of murine BM-MSCs [7 –10], and therefore, despite its common use, the safety of application of these cells after in vitro expansion is a controversial issue. Although several protocols have been developed for isolation of MSCs and these cells have been used extensively, our poor understanding of the true nature of MSCs and the methods to cultivate them is shown by the isolation of different “stromal” populations [11] or specific subpopulations [12] reported by different groups. In addition, some observations during the isolation and expansion of these cells, such as heterogeneity in the culture [13] or slow growth rate [14], remain unexplained, and probably these unidentified phenomena have made isolation of murine MSCs complicated for some laboratories [15 –17].
To further explore the effect of in vitro culture on mouse BM-MSCs, we observed the cells for 1 year after isolation and examined their in vitro growth properties, morphological changes, differentiation potential, chromosomal abnormalities, as well as their tumor formation potential. We found that during in vitro expansion, the cells experience several morphologic and genomic alterations, which are associated with reduced plasticity and chromosomal abnormalities but not tumorigenicity.
Materials and Methods
Animals
Normal 4–6-weeks-old C57BL/6 and BALB/c mice were obtained from Pasteur Institute of Iran (Tehran, Iran). Normal 6–8-week-old male nude mice in BALB/c background were provided by Cancer Institute, Tehran University of Medical Sciences (Tehran, Iran). Animal care and experiments were performed according to the National Institutes of Health Guide for the Care and Use of Laboratory Animals.
Isolation of MSCs
After sacrificing the mice, the ends of tibia and femur bones were clipped to expose the marrow. The bones were inserted into adapted centrifuge tubes as described previously [16,18] and centrifuged for 1 min at 400 g. The cell pellet derived from 2 tibia and 2 femur bones was suspended in Dulbecco's modified Eagle's medium containing 10% fetal bovine serum, penicillin G (100 U/mL), streptomycin (100 μg/mL), as well as 0.25 μg/mL amphotericin B (all from Gibco-BRL) and cultured in a 25-cm2 culture flask. Nonadherent cells were removed after 24 h and the flask was washed several times with phosphate-buffered saline (PBS; Gibco-BRL). The medium was changed regularly every 3 days, and at ∼50% confluence, the cells were detached using trypsin-EDTA (Gibco-BRL) and replated; these cells were considered as passage 1. The cultures were maintained at 37°C and 5% CO2 and passaged when a confluence of about 80% was reached.
Doubling time (DT) was calculated by the following formula: DT = h/[ln(N 2/N 1)/ln(2)] (N 2 indicates the number of cells counted at the time h; N 1 indicates the number of cells seeded). Cumulative population doubling at each passage was determined by adding population doubling per passage.
Multilineage differentiation
To induce osteogenic differentiation, the cells were treated with 10 mM beta-glycerol-phosphate (Merck), 50 μg/mL ascorbic acid bi-phosphate (Sigma), and 100 nM dexamethasone (Sigma) for 3 weeks. Osteogenic differentiation was assessed with Alizarin Red staining. Adipocyte differentiation was achieved in the presence of 250 nM dexamethasone and 0.5 mM 3-isobutyl-1-methylxanthine (Sigma) for 3 weeks. Oil Red O staining was used to determine the accumulation of oil droplets in the cytoplasm. For differentiation to chondrocytes, 2 × 10⁵ cells were centrifuged to form a pelleted micromass and then treated for 3 weeks with 10 ng/mL transforming growth factor-beta, 10 ng/mL basic fibroblast growth factor (both from Peprotech), 50 μg/mL ascorbic acid bi-phosphate, and 100 nM dexamethasone. Chondrocyte differentiation was assessed with Alcian Blue staining performed on 4-μm-thick section.
Surface marker analysis
The expression of surface markers was evaluated using monoclonal antibodies against mouse CD11b, CD24, CD29, CD31, CD34, CD44, CD45, CD90, CD105, and CXCR4 (all from eBioscience). The cells were detached with trypsin/EDTA and incubated with the specific antibodies or isotype control antibodies in 100 μL of 3% bovine serum albumin (Sigma) in PBS for 1 h at 4°C. The cells were then fixed with 1% paraformaldehyde (Sigma) and analyzed with a PAS machine and Flomax software (Partec).
DNA content analysis
After fixing with 70% ethanol for 2 h, the cells were incubated for 30 min on ice in PI/Triton X-100 (Sigma) staining solution with RNase A (Fermentas). The samples were examined with a PAS machine and analyses were performed with FlowJo software (Treestar).
Immunocytochemistry
The cells were fixed with 4% paraformaldehyde for 20 min. After incubation with 5% goat serum in PBS for 45 min, the cells were incubated with anti-mouse CD29 (eBioscience), anti mouse CD44 (eBioscience), anti mouse Lamin A/C (Santa Cruz Biotechnology), or isotype control antibodies overnight at 4°C and then washed with PBS-Tween 0.1% (Sigma) for 3 times. For staining the nuclei, the cells were permeabilized with 0.4% Triton X-100 and then incubated with 4′,6-diamidino-2-phenylindole dihydrochloride (DAPI) (Sigma) for 10 s. The cells were visualized under a UV microscope (TE2000-S; Nikon-Eclipse).
Transmission electron microscopy
The cells were fixed with 3% glutaraldehyde in phosphate buffer (pH: 7.2), and after rinsing in PBS, the cells were incubated in 1% osmium tetroxide for 1 h, dehydrated in graded ethanols, and incubated in acetone/epoxy resin (50/50) for 45 min. The cells were then embedded in epoxy resin and incubated in 60°C for 72 h, and then 50-nm-thick sections were prepared. The sections were mounted on cupper grids and stained with uranyl acetate and lead citrate. The grids were examined using an electron microscope (Zeiss EM 900).
Karyotype analysis
To determine the number and structure of chromosomes, each sample was investigated using a standard GTG banding technique as follows: Mitotic cell division was arrested using 10 μg/mL colcemid (Gibco) solution in a monolayer cell culture, the detached cells were treated with hypotonic solution (0.075 M KCl), and finally the cells were fixed with a fixative solution (3:1 methanol/acetic acid).
Senescence-associated β-galactosidase staining
The senescence β-galactosidase staining kit (Cell Signaling) was used at pH 6 to detect the activity of senescence-associated β-galactosidase. The cells were examined by light microscopy for producing the blue color caused by β-galactosidase activity.
Soft agar transformation assay
In vitro assessment of tumorigenicity was performed using soft agar transformation assay in 6-well plates. Wells were coated with 1 mL of 0.5% low-melting point agarose (Fermentas) and plated with 2,500 cells suspended in 1 mL of 0.35% agarose dissolved in Dulbecco's modified Eagle's medium with 10% fetal bovine serum. Finally, 500 μL culture medium was added and the cells were maintained at 37°C in a humidified atmosphere with 5% CO2. The medium was changed twice a week. After 4 weeks, the plates were examined using an inverted microscope to observe the formation of colonies. In this study, the MKN45 cell line was used as positive control.
Transduction with lentiviral vector
Green fluorescent protein (GFP)–lentiviral vector was made by transfection of pLOX-EWgfp, psPAX2, and pMD2.G plasmids (all from Addgene) to 293T cells as packaging cell line. To transfer the GFP gene into BM-MSCs, the cells were seeded in 4-well plates and were transduced with the virus at a multiplicity of infection of 50 in the presence of 4 μg/mL polybrene. After 5 days, the cells were visualized under an inverted fluorescence microscope (Nikon TE2000).
In vivo tumor formation assay
To study in vivo tumor formation potential, 5 × 10⁶ cells were transplanted into nude mice through subcutaneous injection. MKN45 cells were used as positive control. Mice were grossly examined every week for possible tumor development and illness.
Statistical analysis
Statistical analysis was carried out using the SPSS software (version 11; SPSS, Inc.). Data are presented as mean ± standard deviation. All experiments were repeated at least 3 times.
Results
The lifespan of mouse BM-MSCs is divided into 3 phases based on growth kinetics
Mouse BM-MSCs experience several morphological changes and growth rate alterations during ex vivo expansion. We investigated the growth kinetics of BM-MSCs, independently isolated from 9 C57Bl/6 mice, for over 1 year, determining the cumulative population doubling (Fig. 1). Cultures were also carefully analyzed for morphological changes on a daily basis by phase-contrast microscopy. The results allowed the categorization of the course of in vitro culture of MSCs into 3 phases:
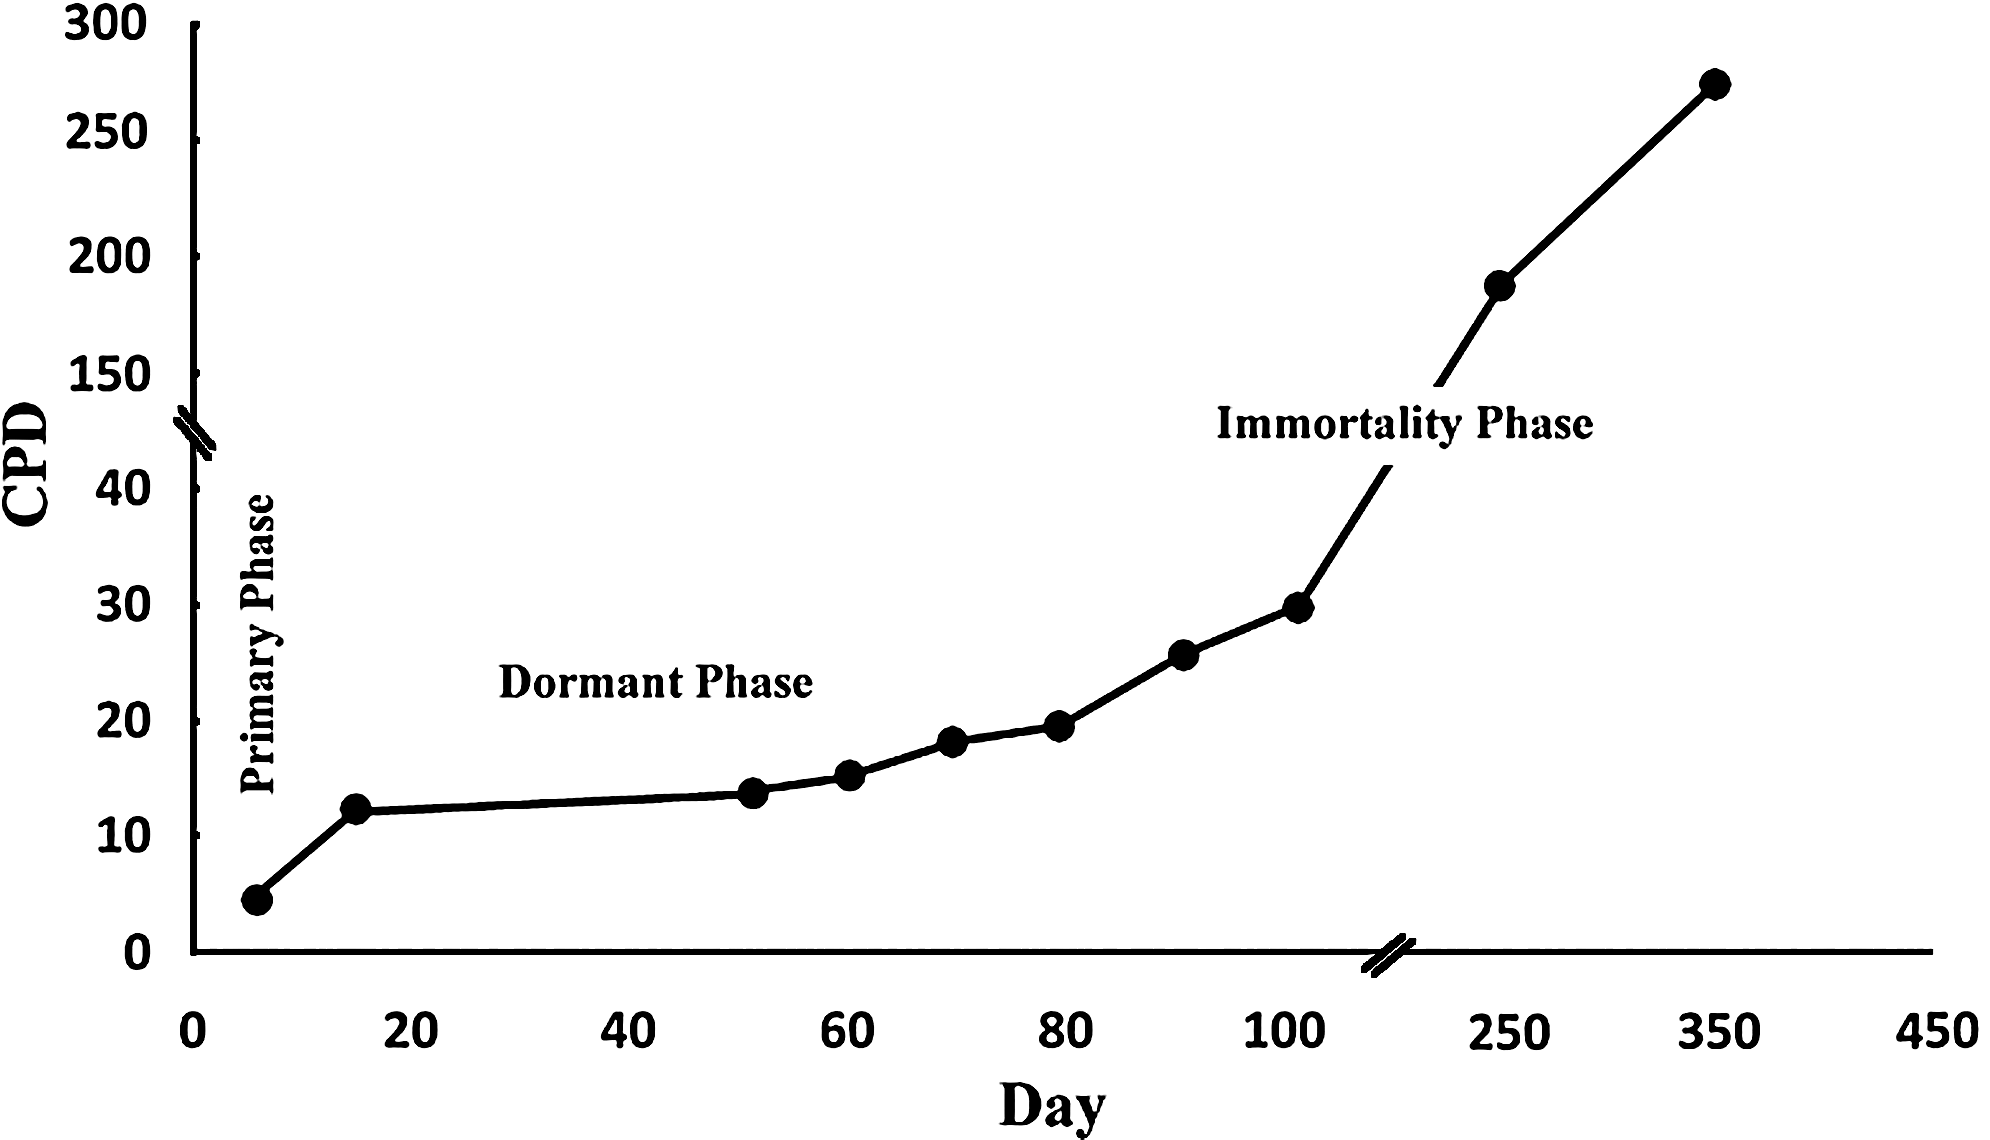
Growth kinetics of mouse BM-MSCs during long-term culture. The kinetics of cell expansion was analyzed for over 1 year in 9 cultures, with determination of cumulative population doubling (CPD). The graph shows the mean CPD of the samples and indicates the presence of 3 phases of cell growth. BM, bone marrow; MSCs, mesenchymal stem cells.
Primary phase (14.7 ± 1.4 days)
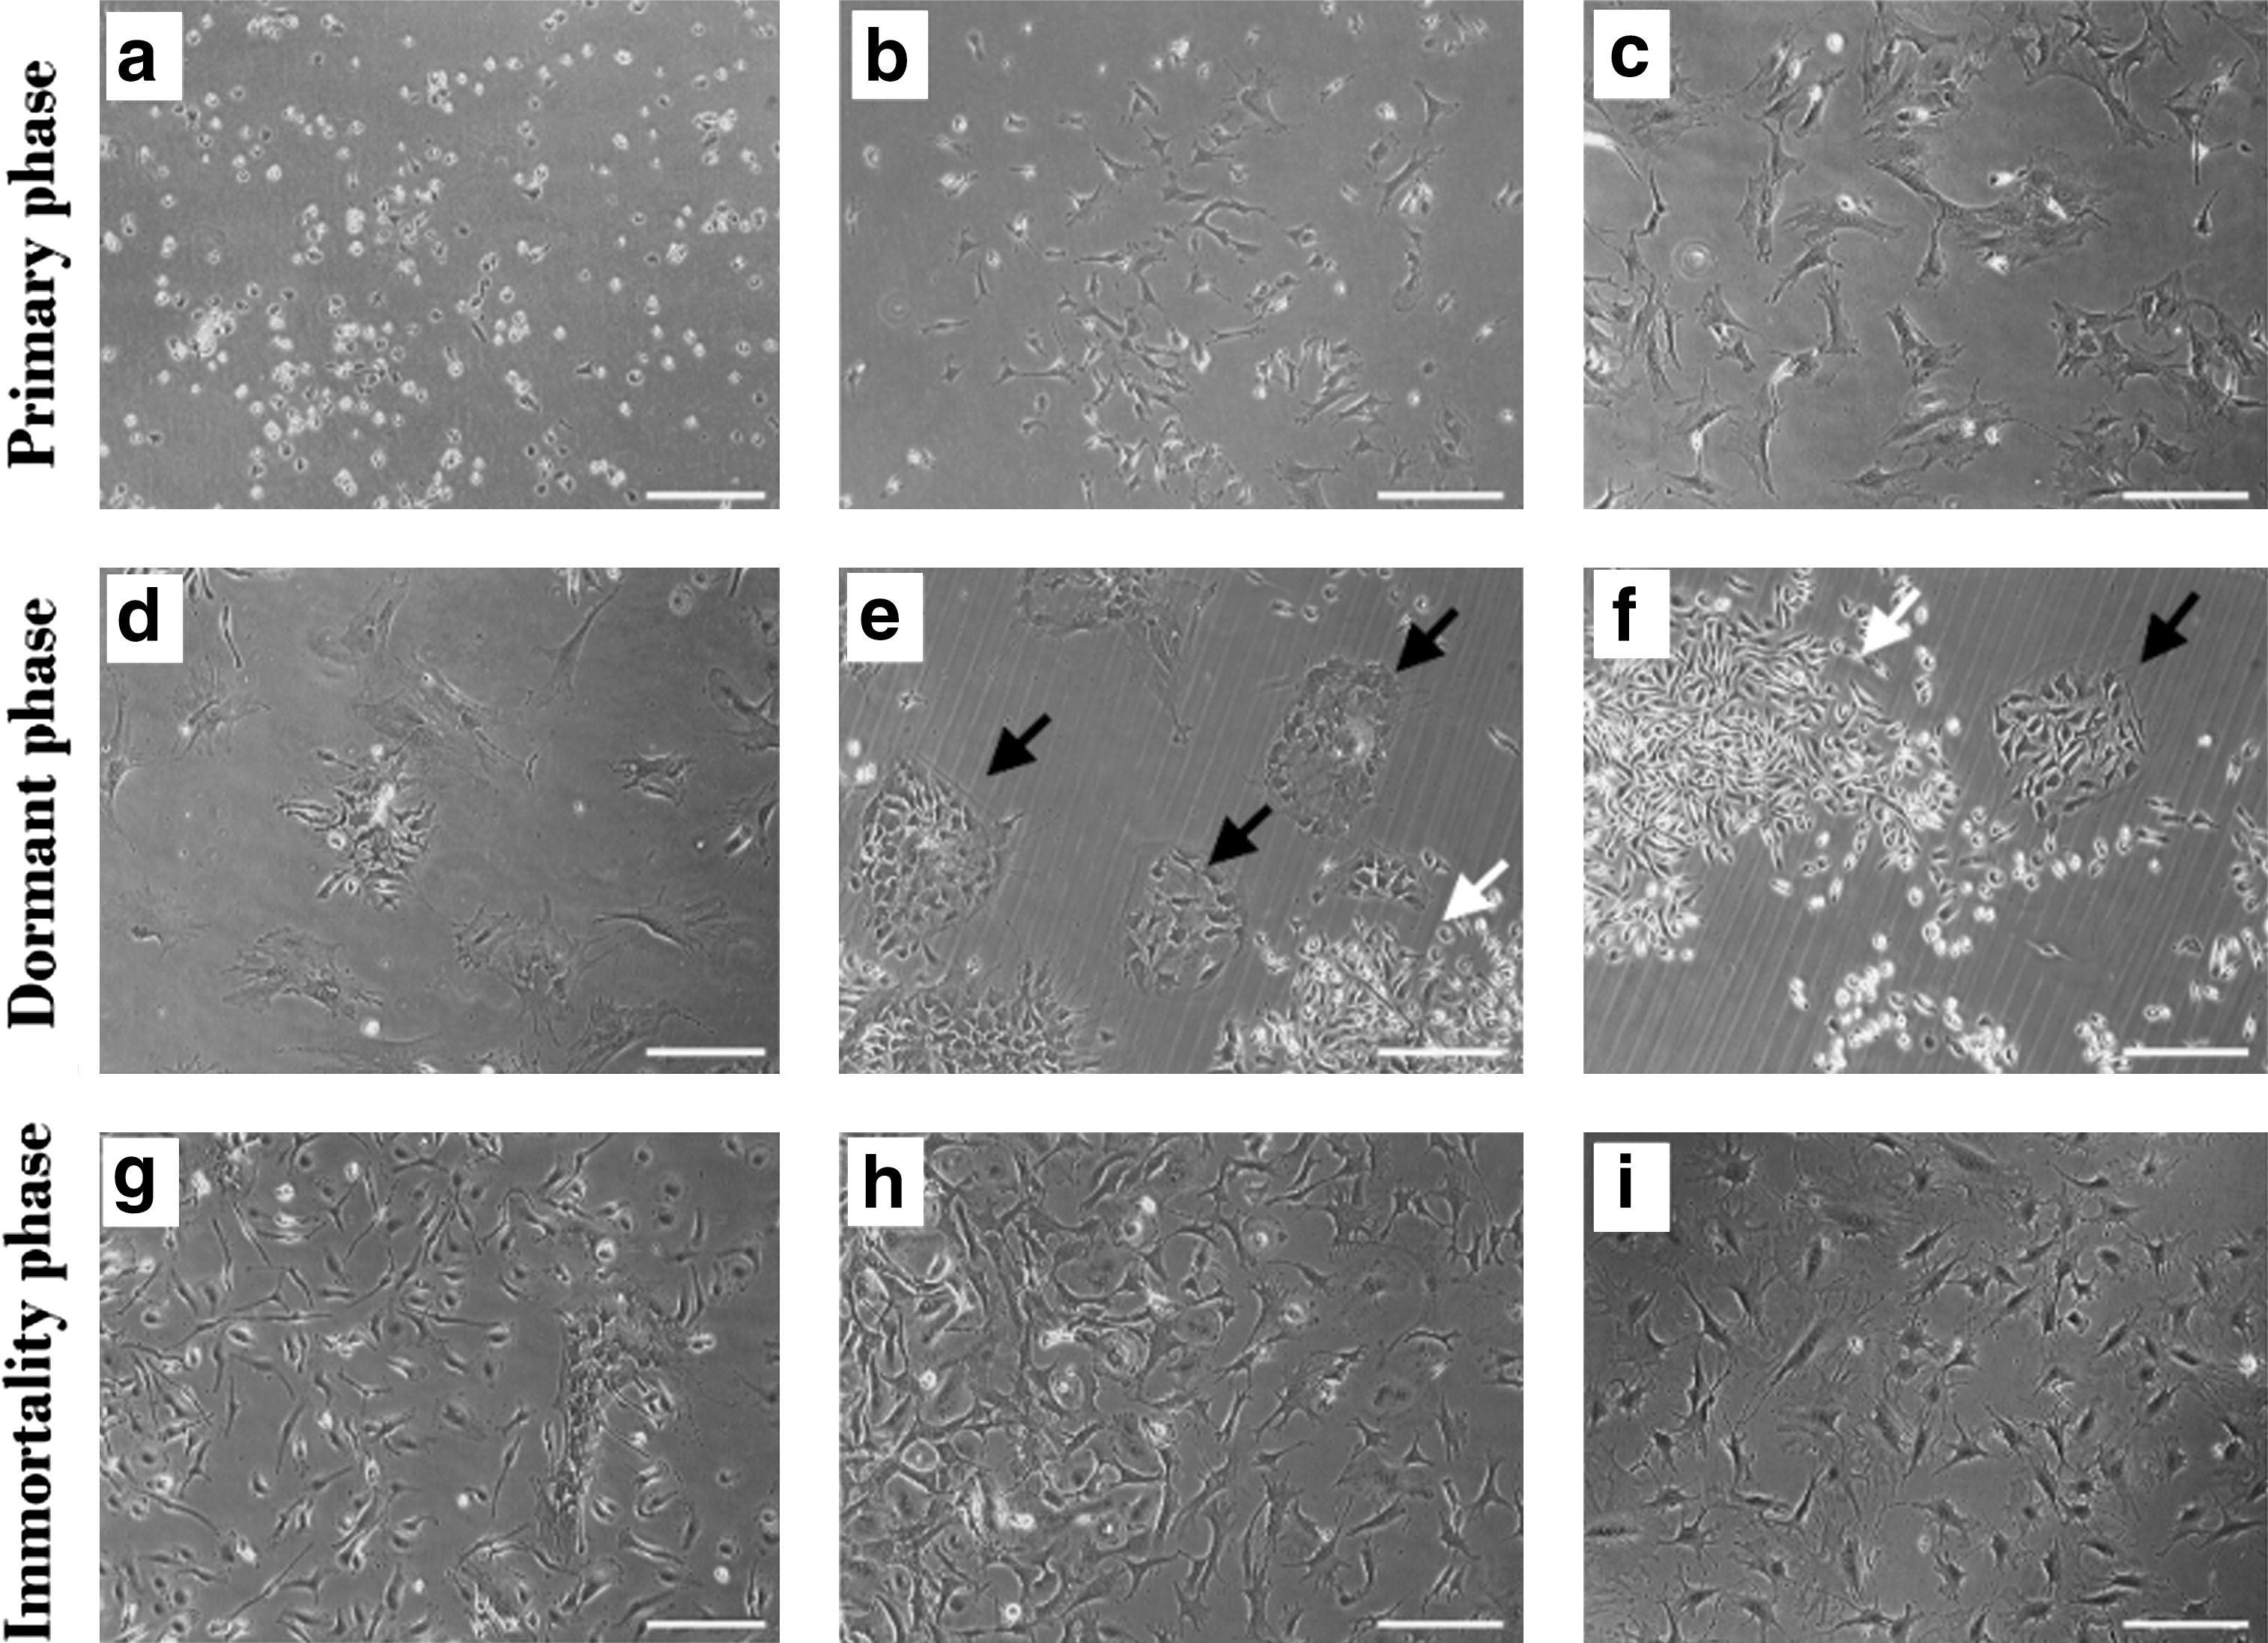
Twenty-four hours after isolation, culture flasks were washed with PBS to remove nonadherent cells and debris. The remaining adherent cells, which were round and small at the beginning, formed colonies and changed to multiangular and larger cells later (Fig. 2a–c). These cells proliferate and can be expanded for 3.1 ± 0.5 passages. During this phase the proliferation rate gradually decreases until the cells stop dividing. We considered this point as the end of the primary phase.
Continuous examination of morphological changes of MSCs categorized in the primary
Dormant phase (45.6 ± 5.2 days)
As the cells stop dividing, they become larger, and interestingly, after some days, we observed the existence of several nuclei in the cells. Each large multinuclear cell (LMC) then converts to several small mononuclear cells, which are called daughter cells (Fig. 2d–f). The daughter cells attach firmly to the surface and are markedly resistant to detachment by trypsin. At the end of the phase, a heterogeneous cell population consisting of LMCs and daughter cells was observed. During the dormant phase, the medium was changed twice a week without passaging or only once.
Immortality phase
About 2 months after isolation, some of the small daughter cells resume proliferation. The proliferation rate increases gradually until it reaches a steady state with a DT of 27.1 ± 1.5 h. The cultures in this phase are homogenous and can be maintained for >1 year without any evidence of replicative senescence (Fig. 2g–i). In the multinucleation state, the cells were positive for senescence-associated β-galactosidase staining, and as the daughter cells resumed proliferation and entered the immortality phase, they became negative for this marker (Supplementary Fig. S1; Supplementary Data are available online at
To verify the derivation of small mononuclear cells from LMCs, we followed an LMC for 19 days and prepared time-lapse images (Fig. 3). These serial pictures show that an LMC produces several small cells during this period.
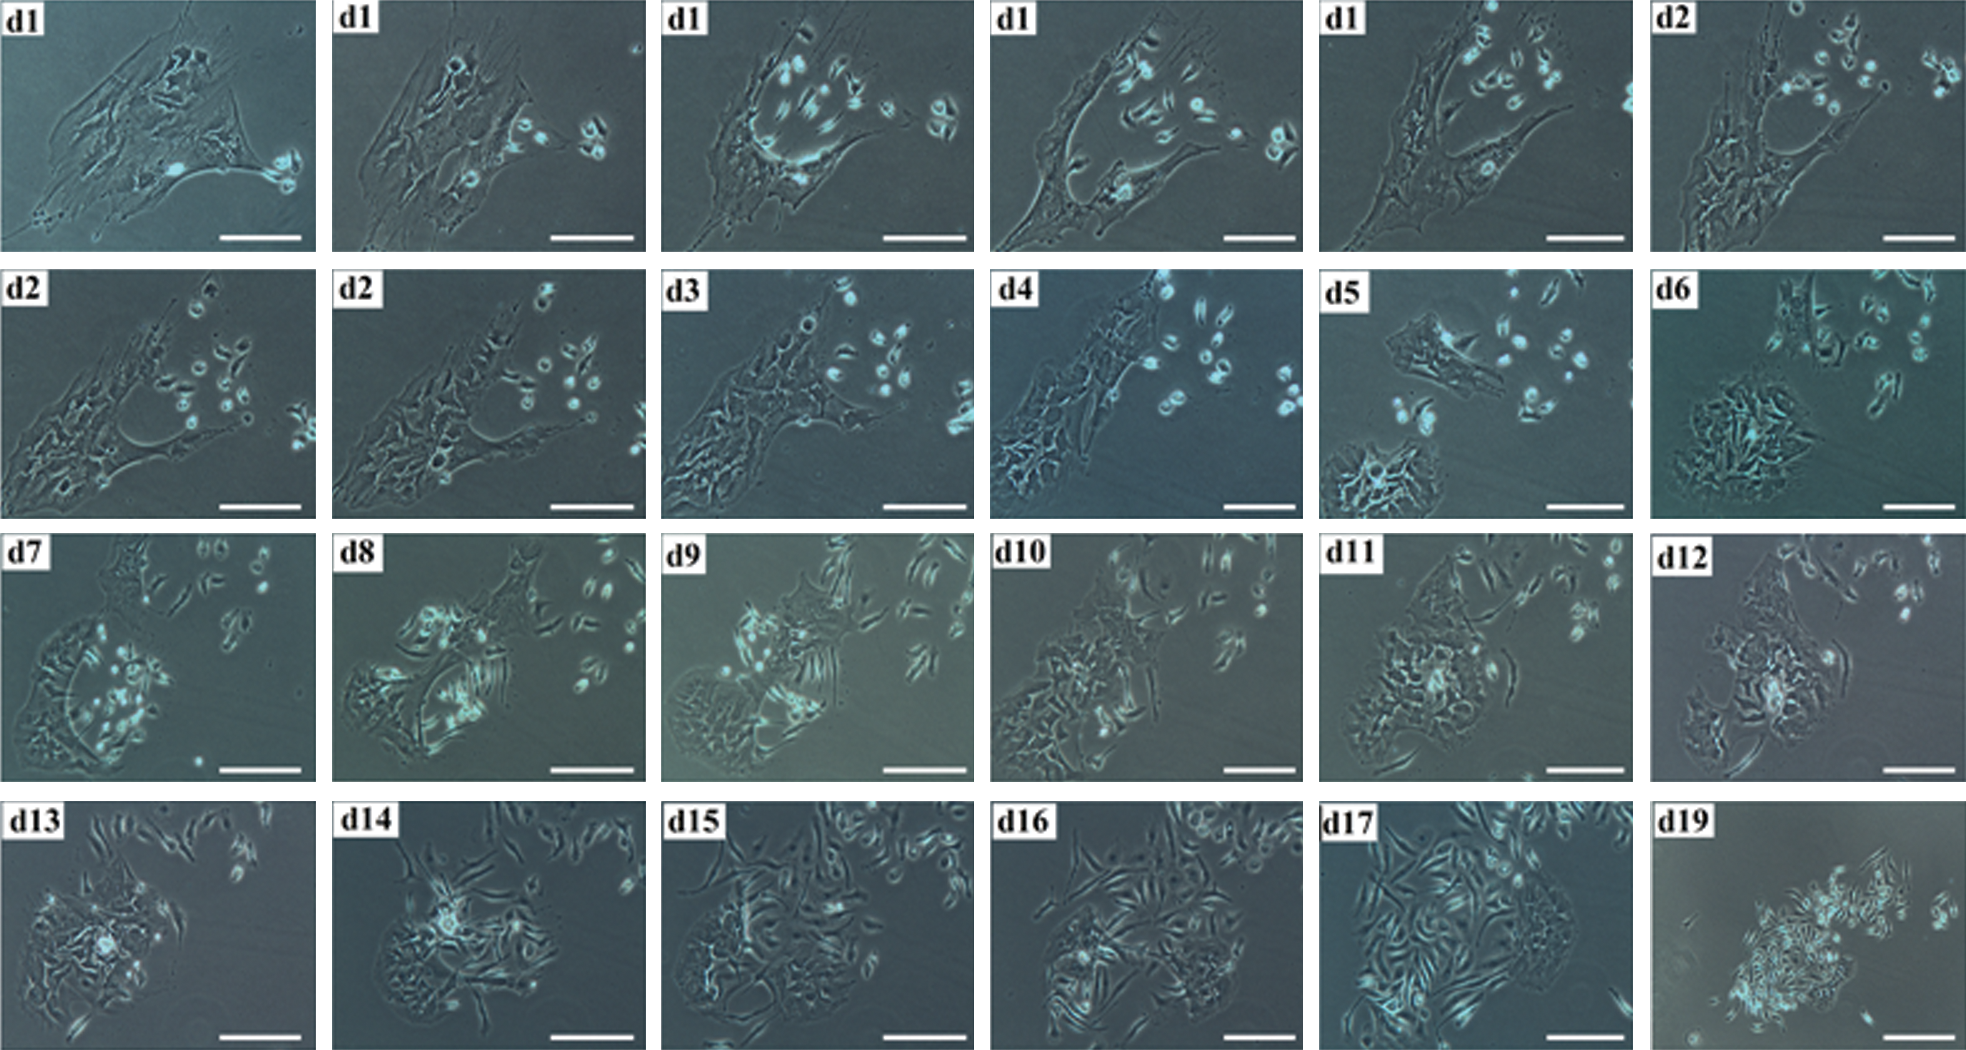
The derivation of several small cells from an LMC is shown in time-lapse images captured during 19 days in the dormant phase. Scale bars: day (d) 1–d17: 100 μm; d19: 200 μm. Color images available online at
Regarding previously reported data that indicate differences between characteristics of mouse BM-MSCs isolated from different strains [16], the experiments were repeated for cells isolated from BALB/c mice. Five independent cultures were analyzed and the same results were also observed in this strain (data not shown).
Mouse BM-MSCs are multinuclear during the dormant phase
To further explore the multinucleation of the cells in the beginning of the dormant phase, they were stained with hematoxylin (Fig. 4a). DAPI staining was also performed, which clearly showed that there were 1 or 2 large central and several small peripheral nuclei in these cells. In addition, to confirm that DAPI signals represent nuclei, immunocytochemistry for nuclear envelope protein, Lamin A/C, was performed, which completely overlapped with DAPI (Fig. 4b–f).
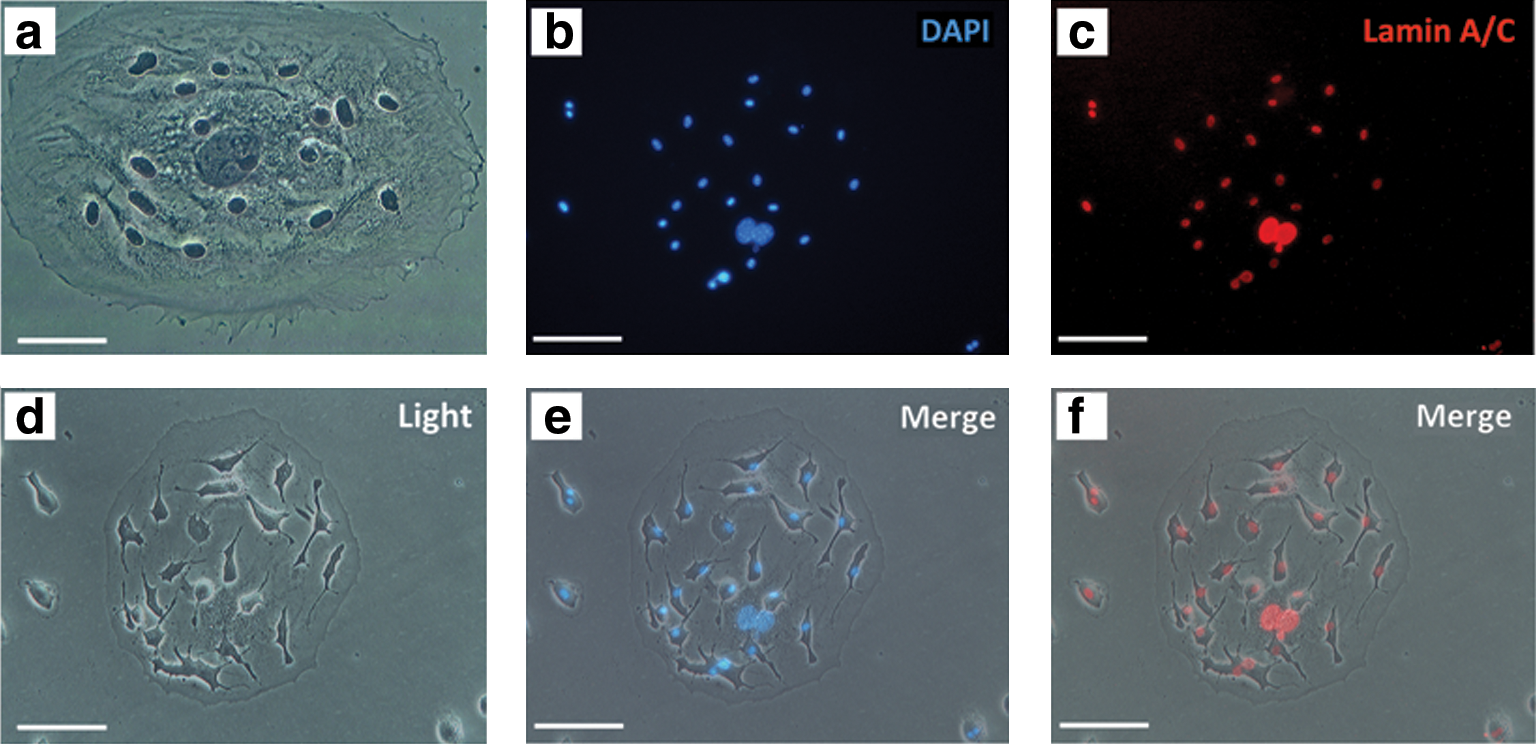
Multinucleation of the cells in the beginning of the dormant phase. The nuclei of an LMC are stained with hematoxylin
To exclude the possibility that our observation of the LMC simply represented a large cell with several small cells adhered to it, 24 h after isolation some of the cells were labeled with GFP using lentiviral vectors, and after 4 days, they were cocultivated with a population of unlabeled cells from the same mouse with a 1:1 ratio. When this mixed population entered the dormant phase, the cells were either completely positive or completely negative for GFP and they were not seen as a mix of fluorescent and nonfluorescent parts (Fig. 5).
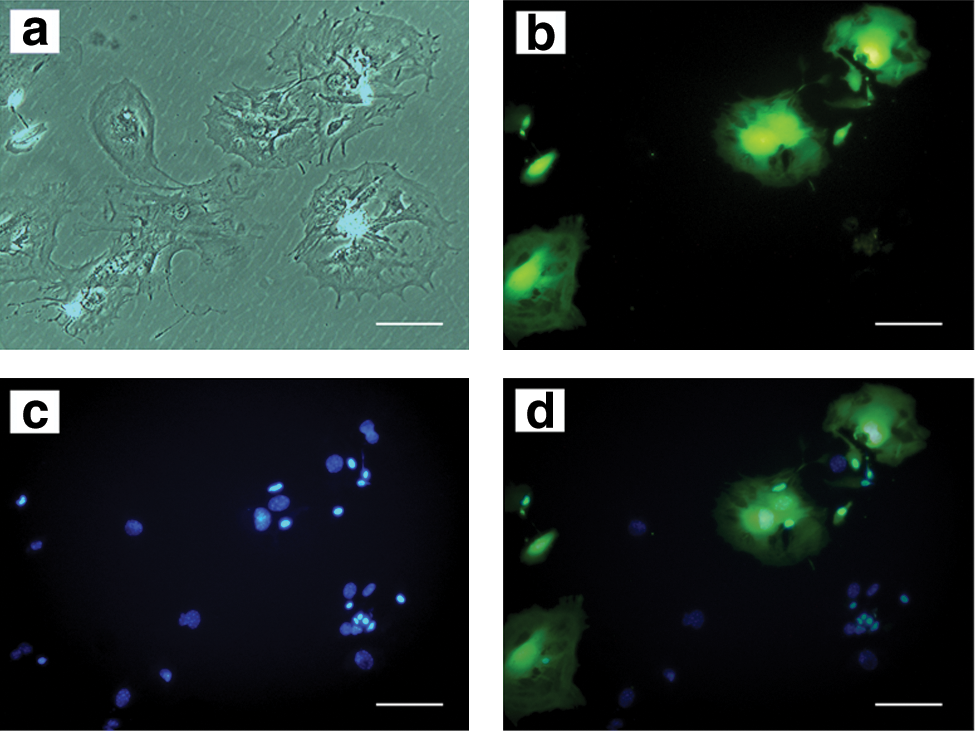
Twenty four hours after isolation, BM cells were stably labeled with green fluorescent protein using a lentiviral vector, and after 4 days they were mixed with nontransduced cells from the same origin. After entering the dormant phase, the cells were inspected with a light microscope
To further confirm the multinucleation of the cells and to study them in more detail, transmission electron microscopy was performed. This investigation revealed that an LMC contains several nuclei and they are inside the cytoplasm, not attached to the cell surface (Fig. 6).
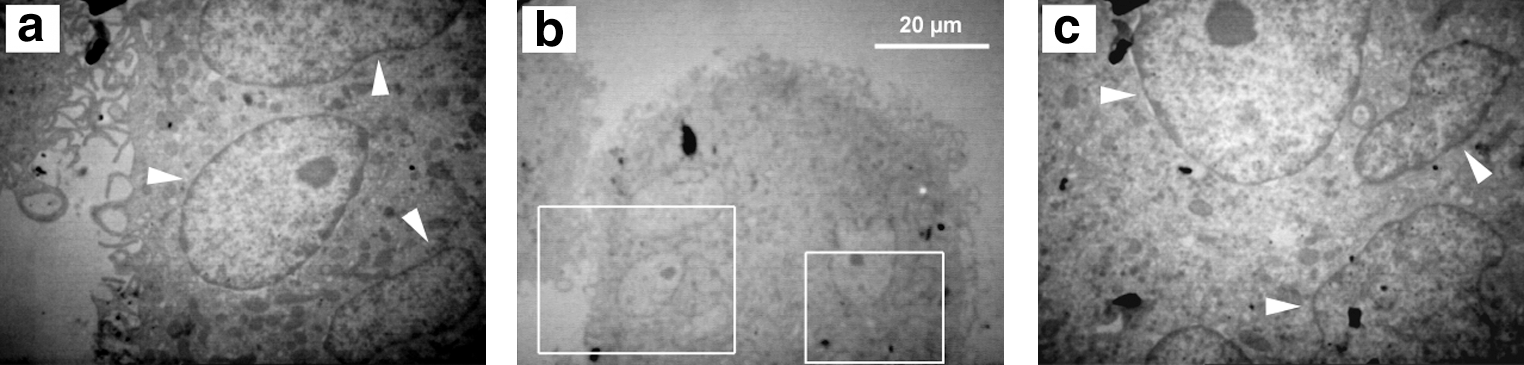
A transmission elec-tron microscopy graph show-ing the existence of several nuclei inside a large cell. The big and small boxes in
Interestingly, LMCs not only produce small mononuclear daughter cells, but also sometimes produce LMCs with smaller size (Fig. 7a, b). Immunocytochemistry analysis was performed at the end of the dormant phase during LMC division, which revealed that both cells were positive for CD29 and CD44 (Fig. 7c, d). Negative controls were included in the analysis, which did not show the fluorescent signal (data not shown).
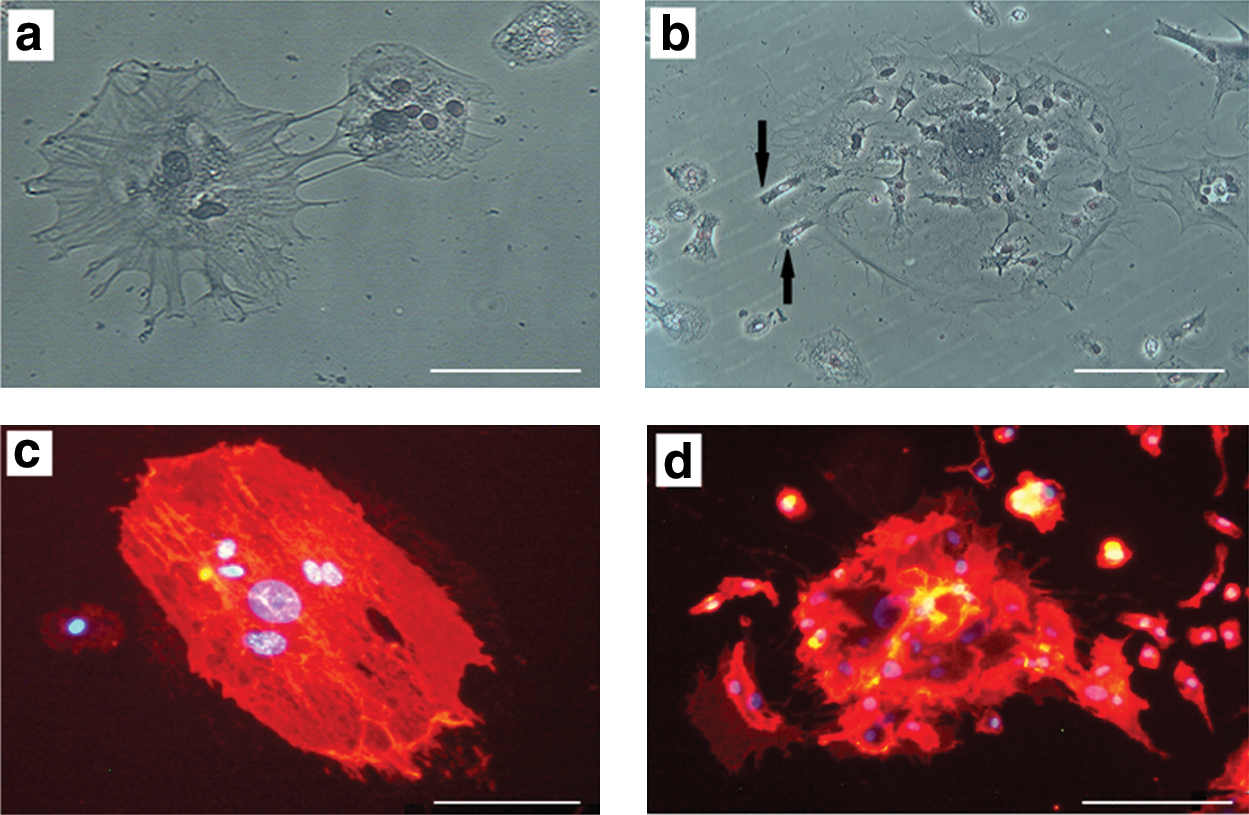
Division of LMCs in dormant phase. LMCs divide into smaller LMCs
To investigate changes in genomic substance of the cells during different phases, DNA content analysis of the cells was assessed by flow cytometry. The percentage of cells with >4N genomic content (super-G2), which represent multinuclear cells, gradually increases as the cells transit from primary phase to dormant phase (Fig. 8). The frequency of super-G2 population in P1, P2, and P3 was 5.3%, 6.8%, and 10.1%, respectively. As the cells entered the immortality phase (P16), the frequency of this population decreased considerably (2.2%). In this experiment, mouse peripheral blood mononuclear cells were examined in parallel with the samples as control, which had an almost undetectable super-G2 population. Notably, the mean fluorescent intensity of G0/G1 and G2/M peaks in the sample of immortality phase (P16) was about 2 times more than other samples (P0–P3) and peripheral blood mononuclear cells, which is in agreement with the abnormal chromosome numbers (near tetraploid) of the cells in the immortality phase (next section).

Cytofluorometric analysis of DNA content of the cells. G1, S, and G2/M peaks are shown with green, brown, and cyan colors. Red areas demonstrate super-G2 population, whose frequency gradually increases from passage 1 to passage 3 (P1: 5.3%; P2: 6.8%; P3: 10.1%) and is at low level in the immortal phase (P16: 2.2%). Mouse peripheral blood mononuclear cells were used as control in this experiment. G1 Mean fluorescent intensity (blue arrow) of P16 sample was about 2 times more than that of peripheral blood mononuclear cells and other samples, which is in accordance to the near tetraploidy of the cells in this phase. Color images available online at
The aneuploidy of mouse BM-MSCs begins from the primary phase
Considering the unusual form of derivation of daughter cells from LMCs and the rapid proliferation rate in the immortality phase, as well as our data on high DNA content of the cells in immortality phase, we were interested to investigate chromosomal abnormalities in more detail. Cytogenetic investigation was carried out on 6 samples in the immortality phase, which in correlation to DNA content analyses showed that these cells have considerable numerical chromosome abnormalities. Structural abnormalities such as balanced and unbalanced translocations, deletions, and chromosomal markers were also evident (Fig. 9).
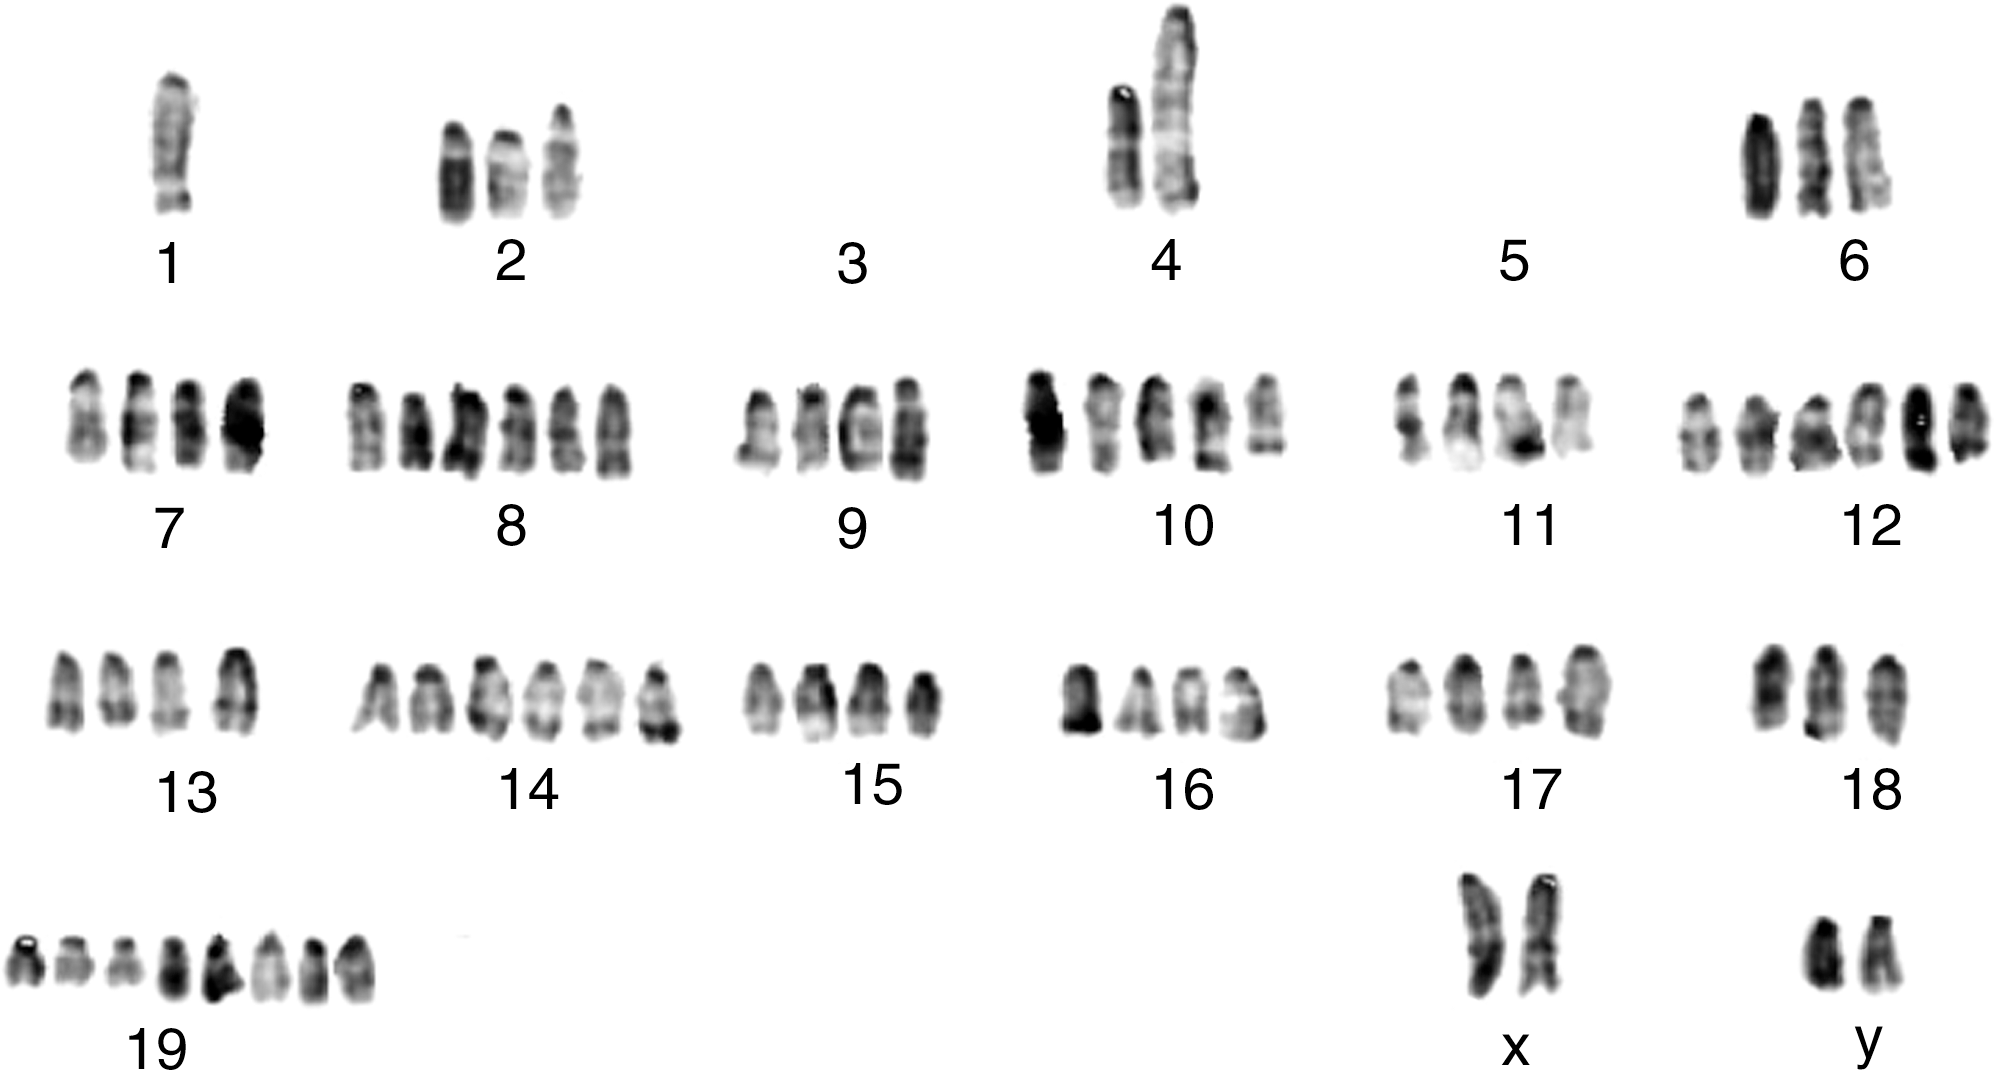
Chromosomal abnormality is a common feature of mouse BM-MSCs. A representative picture of chromosomal studies of the cells in the immortality phase, showing several numerical and structural chromosomal abnormalities and deletion of chromosomes 3 and 5.
We also tried to examine the cells in the dormant phase by chromosomal studies. Although it seems that several nuclear divisions occur inside LMCs, unexpectedly, we could not see any mitosis after several attempts, which could probably be explained by an uncommon way of nucleus division in this phase.
In the primary phase the number of mitotic cells was not enough to perform cytogenetic study on each sample individually, so we made a pool of different isolations at days 5, 10, and 13. At day 5, several mitotic cells were observed. Twenty mitotic cells were randomly examined and all were normal diploid. At day 10, fewer mitotic cells were observed and all of 20 analyzed mitotic cells were normal except 1, which was tetraploid. At the end of this phase (day 13), we could detect very few mitotic cells, which included 5 normal diploid cells, 4 near tetraploid (75, 76, 77, and 80 chromosomes), and 2 cells with 140 and 143 chromosomes (Table 1).
Some of the samples were studied at both weeks 2–5 (early) and weeks 15–20 (late) of the immortality phase.
Mouse BM-MSCs express different surface markers in the primary and immortality phases
To determine the immunophenotype of the replicative cells, a panel of surface markers was analyzed by flow cytometry in 7 independent cultures of mouse BM-MSCs in the immortality phase. The cells were positive for CD29, CD44, and CD24 and negative for CD11b, CD31, CD45, and CD90. In addition, CD34, CXCR4, and CD105 were expressed weakly in these cells (Fig. 10). We performed a similar examination on the cells in the primary phase. Table 2 compares the expression of surface markers in the primary and immortality phases. The expression of some markers such as CD11b, CD24, CD29, CD44, and CD45 is noticeably different between these 2 phases.
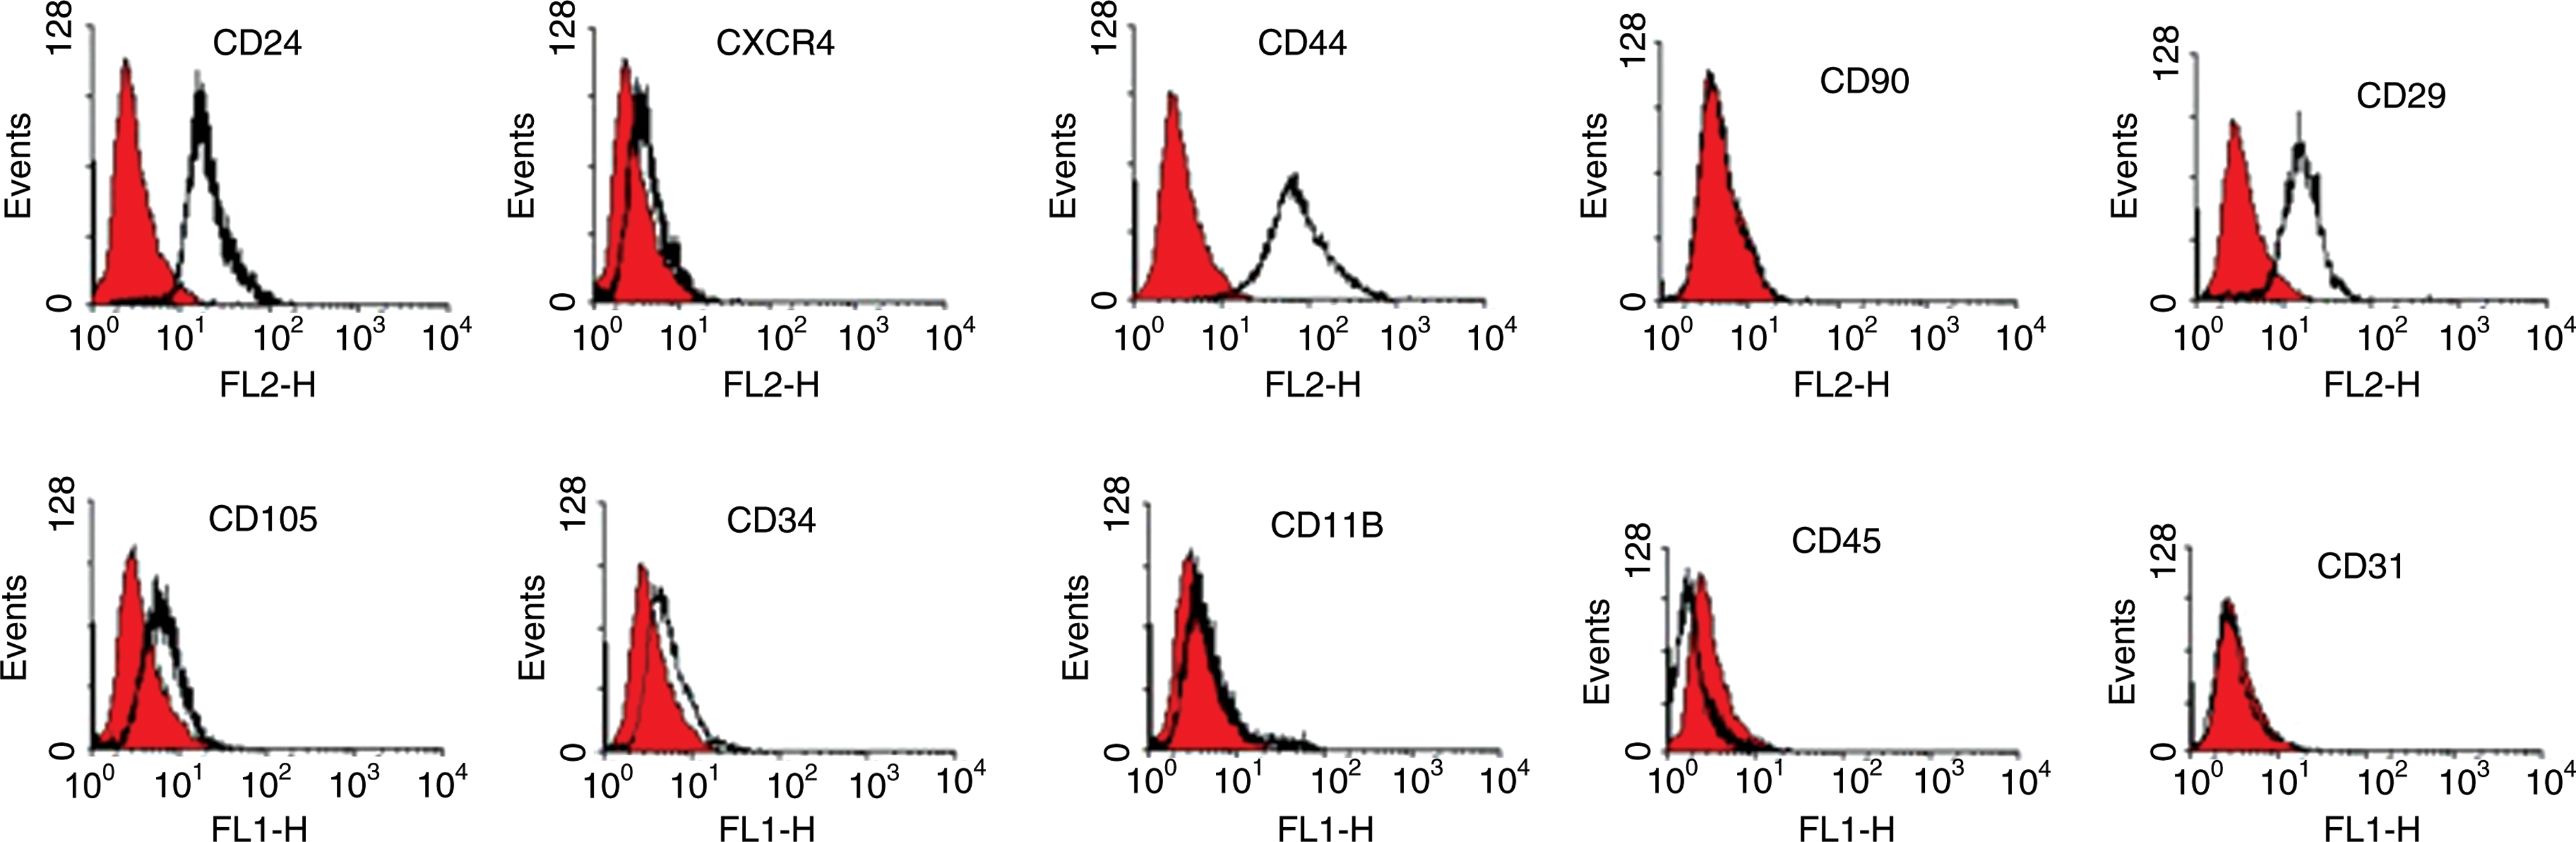
Representative flow cytometry graphs of BM-MSC surface markers in the immortality phase. Color images available online at
Results are presented as percentage of positive cells (mean ± SEM).
The plasticity of mouse BM-MSCs decreases in the immortality phase
In the primary phase, the cells could be differentiated to adipogenic, osteogenic, and chondrogenic lineages in the favorable conditions as shown by Oil Red O, Alizarin Red S, and Alcian Blue staining, respectively (Fig. 11). In the immortality phase, the cells preserved their osteogenic differentiation potential (data not shown) but lost the potential to differentiate into the chondrogenic and adipogenic lineages.

Differentiation potential of the cells in the primary phase. Alizarin Red S staining
Mouse BM-MSCs are not tumorigenic
Soft agar colony formation assay showing the anchorage-independent cell growth is the most reliable in vitro assay of malignant transformation [19,20]. Therefore, we used this assay to examine the in vitro tumor formation potential of BM-MSCs. In the immortality phase, none of the 9 cultures originated colonies in this assay (Fig. 12a). The MKN45 cell line, which was used as positive control, could form several colonies in the same conditions (Fig. 12b).
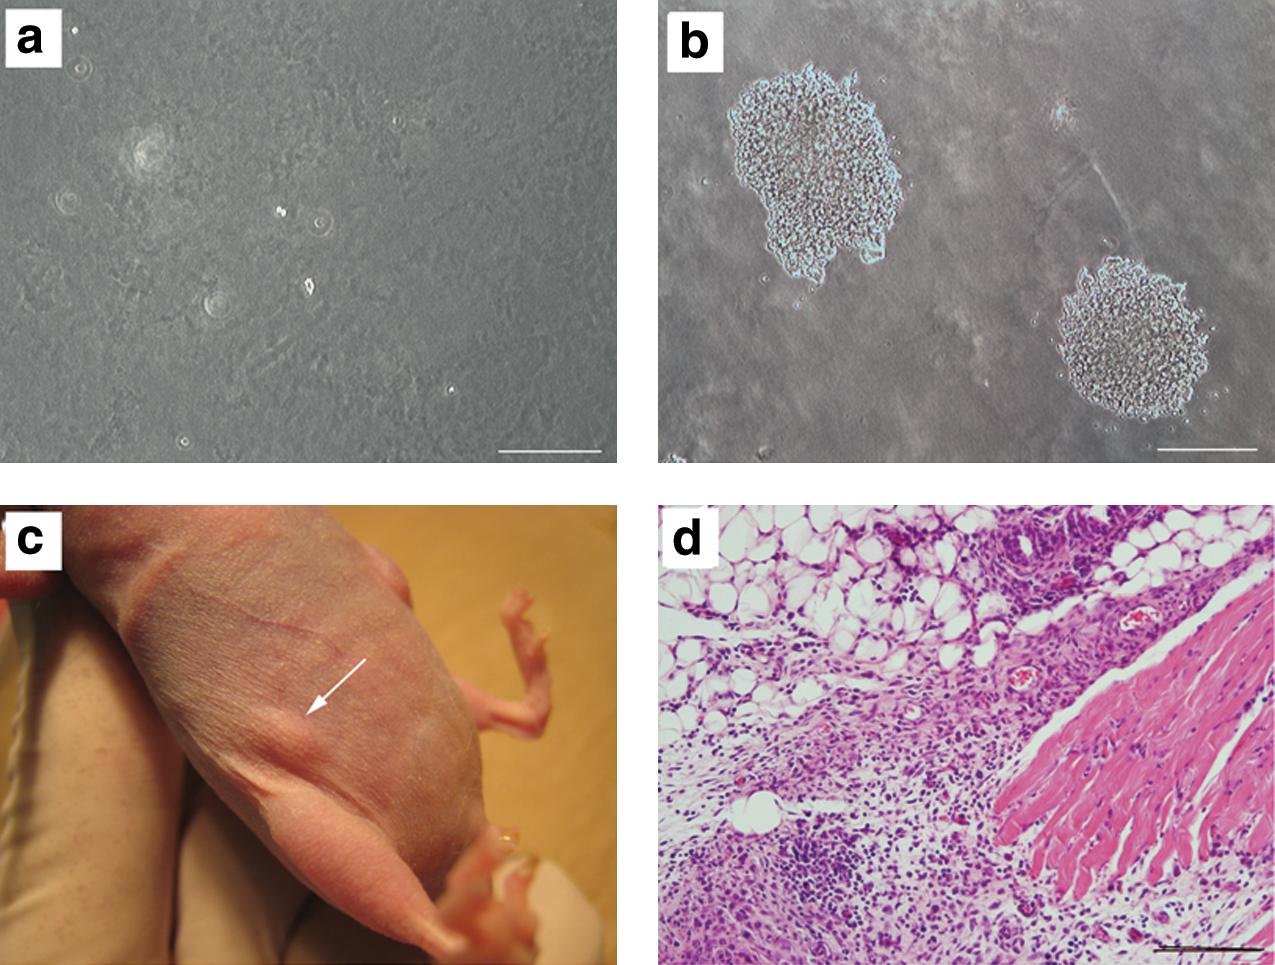
Assessment of in vitro and in vivo tumor formation potential of mouse BM-MSCs. The cells in the immortality phase could not form colonies in soft agar colony formation assay after 4 weeks
To investigate the in vivo tumorigenic potential, 5 × 10⁶ cells in different passages of the immortality phase were transplanted subcutaneously to each nude mouse. The mice were followed for 16 weeks after transplantation. A few days after transplantation, in all mice, a small round nodule (with a maximum diameter of 2 mm on day 5) appeared at the injection site (Fig. 12c), and interestingly, this nodule disappeared after day 8. Histopathological examination of these nodules revealed that it was not composed of malignant cells (Fig. 12d). After 16 weeks of follow-up, no sign of tumor formation or illness was observed in the mice. As positive control, MKN45 cells were transplanted to nude mice. Progressively growing tumors, which were detectable after 3 weeks of transplantation, appeared in these mice (data not shown).
Discussion
In this study, the lifespan of mouse BM-MSCs was studied based on growth kinetics, morphological changes, differentiation potential, genomic instability, and tumorigenicity of the cells during in vitro culture. The results indicate the existence of 3 clearly defined phases. After a short proliferation period, the growth rate of mouse BM-MSCs decreases until they stop dividing and enter a phase of dormancy, which is also associated with expanding cytoplasm size and multinucleation. Several daughter cells then derive from each LMC. After around 2 months, the daughter cells again begin to divide with a considerable speed. These replicative cells proliferate in long-term cultures without signs of senescence and show a considerable level of chromosomal abnormalities. However, they are not tumorigenic as assessed by in vitro and in vivo experiments. Long-term expansion of these cells is also associated with reduced plasticity and alteration in the expression of some surface markers.
Our results can explain some observations described in reports on the isolation of MSCs. For instance, a period of slow growth rate during the culture of mouse BM-MSCs was reported by da Silva Meirelles et al. [14]. In addition, some investigators have found it difficult to isolate BM-MSCs from mice [15 –17]. These findings might be explained by the existence of a dormant phase, which may last for up to 2 months in the course of mouse BM-MSC culture. Our findings support the idea that mouse BM-MSCs may be easily isolated if we simply give the cells enough time to overcome the dormant phase. Moreover, the simultaneous presence of LMCs and small daughter cells, especially in the last days of dormant phase, can explain the prominent heterogeneity in the culture noted by some researchers [13].
Multinucleation of mouse BM-MSCs in the culture, similar to our findings with rabbit BM-MSCs (unpublished data), is one of the interesting findings of this study. Our experiments with mixed populations of GFP-labeled and nonlabeled cells exclude the possibility that these cells correspond to already described blanket cells [21]. Although this is the first report on spontaneous multinucleation of mouse BM-MSCs and the subsequent derivation of mononuclear cells, this phenomenon has been previously recognized in some other cell types, and different nomenclatures have been used to describe it, including nuclear fragmentation [22], sporosis [23] and neosis [24]. In addition, the small mononuclear daughter cells have been variably referred to as karyoplasts [25,26] or Raju cells [24]. Multinucleation has been reported to occur spontaneously in senescent cells [25] or after exposure to radiation [27,28], cisplatin [29], or SV40-induced transformation [30] in different cell types. The resultant mononuclear cells represent usually a population of cells with growth advantage (reviewed in [31]). Interestingly, this type of division is believed to be a method by which malignant cells can escape death and become resistant to anticancer drugs [29,32]. In our observations, we found that some of the daughter cells may change to LMCs and enter a new cycle of polyploidization and subsequent production of mononuclear daughter cells. A similar cycle of transition between mitosis and neosis has been described for cancer cells [33].
As the prospective identification and analysis of MSCs in the organism are not possible, we cannot determine whether the cellular processes observed in the present study represent an artifact of the in vitro culture or are indicative of a mechanism operating in vivo. MSCs have been suggested to play other roles in the organism, besides giving origin to differentiated cells [34]. Further research is necessary to establish if there is a physiological role for multinucleation, which is important in cells such as osteoclasts and giant cells, in MSCs [35].
Taken together, with a reliable experiment design, we have employed different assays to show that, during in vitro expansion, mouse BM-MSCs experience a period of multinucleation, which is followed by derivation of small mononuclear cells. Time-lapse imaging provided more details of morphological changes of LMCs during this process. DAPI and Lamin A/C staining confirmed the identity of nuclei, and electron microscopy showed the existence of nuclei inside the cytoplasm. In addition, mixing fluorescent and nonfluorescent cells before entering the dormant phase and appearance of LMCs that were either completely fluorescent or not further confirmed that each LMC is not composed of several individual cells.
Our data on decreased plasticity of the cells in the immortality phase are in line with some previous reports indicating that the differentiation potential of MSCs isolated from different sources decreases after transformation [6,36]. It has also been reported that the adipogenic differentiation potential of MSCs decreases with the increase of donor age and passage number [37]. So it could be assumed that the in vitro expansion of these cells is probably associated with loss of some functional properties.
Another finding of this study is that chromosomal abnormality is a common feature of mouse BM-MSCs, which is in agreement with some previous reports [7 –9]. Although aneuploidy has been suggested as a normal mechanism for specific types of cells such as neurons [38], chromosomal abnormalities can also negatively affect many functions of the cells by deletion or amplification of important genes.
Our data indicate that, although these cells are immortal and aneuploid, they are not tumorigenic. These observations are corroborated by similar observations in rat [39,40] and rabbit BM-MSCs (our unpublished data). The tumorigenicity of mouse BM-MSCs is a controversial issue in the literature. Some researchers [2,7,41] have shown that these cells form tumors after transplantation to nude mice. Contradictory results have been recently reported by Armesilla-Diaz et al., who showed that MSCs isolated from P53 knockout mice but not normal mice are tumorigenic [42]. The different observations in the tumorigenic potential of BM-MSCs may result from different culture conditions, mice strains, and duration of in vitro expansion.
Our results indicate that, after a short-term culture, mouse BM-MSCs bear several morphologic alterations, which are associated with genomic instabilities and functional imperfection. These modifications probably affect many features of the cells and their properties vary after different culture periods. It could result in variable cell types, as described by different groups (reviewed in [41]). Conclusively, application of these cells in experiments and interpretation and comparison of the findings should be done more cautiously.
Footnotes
Acknowledgment
This work was supported by a grant from Stem Cell Technology Research Center, Tehran, Iran.
Author Disclosure Statement
No competing financial interests exist.
References
Supplementary Material
Please find the following supplemental material available below.
For Open Access articles published under a Creative Commons License, all supplemental material carries the same license as the article it is associated with.
For non-Open Access articles published, all supplemental material carries a non-exclusive license, and permission requests for re-use of supplemental material or any part of supplemental material shall be sent directly to the copyright owner as specified in the copyright notice associated with the article.