
Abstract
In several cell types, a regulated efflux of NAD+ across Connexin 43 hemichannels (Cx43 HC) can occur, and extracellular NAD+ (NAD+ e) affects cell-specific functions. We studied the capability of bone marrow-derived human mesenchymal stem cells (MSC) to release intracellular NAD+ through Cx43 HC. NAD+ efflux, quantified by a sensitive enzymatic cycling assay, was significantly upregulated by low extracellular Ca2+ (5–6-fold), by shear stress (13-fold), and by inflammatory conditions (3.1- and 2.5-fold in cells incubated with lipopolysaccharide (LPS) or at 39°C, respectively), as compared with untreated cells, whereas it was downregulated in Cx43-siRNA-transfected MSC (by 53%) and by cell-to-cell contact (by 45%). Further, we show that NAD+ e activates the purinergic receptor P2Y11 and a cyclic adenosin monophosphate (cAMP)/cyclic ADP-ribose/[Ca2+]i signaling cascade, involving the opening, unique to MSC, of L-type Ca2+ channels. Extracellular NAD+ enhanced nuclear translocation of cAMP/Ca2+-dependent transcription factors. Moreover, NAD+, either extracellularly added or autocrinally released, resulted in stimulation of MSC functions, including proliferation, migration, release of prostaglandin E2 and cytokines, and downregulation of T lymphocyte proliferation compared with controls. No detectable modifications of MSC markers and of adipocyte or osteocyte differentiation were induced by NAD+ e. Controls included Cx43-siRNA transfected and/or NAD+-glycohydrolase-treated MSC (autocrine effects), and NAD+-untreated or P2Y11-siRNA-transfected MSC (exogenous NAD+). These findings suggest a potential beneficial role of NAD+ e in modulating MSC functions relevant to MSC-based cell therapies.
Introduction
H
The clinical benefit of MSC-based cell therapy is mostly attributable to MSC-derived soluble factors endowed with growth-supporting and/or antiapoptotic activities, as demonstrated by studies on preclinical models of disease [4].
We have recently demonstrated that cyclic ADP-ribose (cADPR), a potent intracellular Ca2+ mobilizer [7], behaves as a hemopoietic and mesenchymal growth factor [8,9]. In mammals, cADPR is synthesized from NAD+ by the ADP-ribosyl cyclases (ADPRCs) CD38 and BST1/CD157 [10]. Both ectoenzymes are expressed in MSC [8]. The ectocellular localization of CD38 requires extracellular NAD+ (NAD+ e) to be available for the generation of extracellular cADPR and the consequent stimulation of cell proliferation. Indeed, NAD+ release by the BM stroma allows cADPR production in the BM microenvironment by CD38 and BST1 [11]. In several cell types, a regulated, equilibrative efflux of NAD+ has been reported to occur across Connexin 43 (Cx43) hexameric hemichannels (HC) [12,13]. However, no evidence has been provided as yet on Cx43-mediated efflux of intracellular NAD+ in MSC. ATP has been reported to be released through a hemi-gap junction channel and then to induce [Ca2+]i oscillations in MSC [14].
Besides representing the substrate for ecto-ADPRCs, NAD+ e has been identified as a signal metabolite regulating cell functions through the increase of the [Ca2+]i in astrocytes [13], osteoblasts [15], murine lymphocytes, human granulocytes, and monocytes. In murine lymphocytes, NAD+ e is the substrate of a mono-ADP-ribosyltransferase, which ADP-ribosylates the purinoceptor P2X7, leading to Ca2+ influx and cell death [16]. In human granulocytes, NAD+ e activates the purinergic receptor P2Y11, triggering a cyclic adenosin monophosphate (cAMP)/cADPR/[Ca2+]i signaling pathway, that results in cell activation [17,18]. In gastrointestinal myocytes, NAD+ e activates the purinergic receptor P2Y11, behaving as an inhibitory neurotransmitter [19]. Finally, in human monocytes, NAD+ e activates the purinergic receptor/channels P2X1, P2X4, and P2X7, triggering Ca2+ influx [20].
This study was undertaken to investigate in MSC, both upstream regulation and downstream signaling, and specifically to establish (i) whether NAD+ release across Cx43 HC occurs in MSC and (ii) whether NAD+ e affects specific MSC functions.
Materials and Methods
Drugs
All chemicals were purchased from Sigma (Milan, Italy) unless otherwise stated. NF157 was a kind gift from Dr M.U. Kassack, University of Duesseldorf, Germany. The mimetic peptide Gap26 (VCYDKSFPISHVR; 0.25 mg/mL) and scrambled Gap26 (PSFDSRHCIVKYV; 0.25 mg/mL) were synthesized as described [21].
Cell culture
Bone marrow-derived human MSC were purchased from Lonza (Milan, Italy) and cultured as described [8]. Alternatively, they were purified from BM samples obtained from healthy donors and cultured as described [22]. The immunophenotype of MSC, incubated for 3 and 7 days in the presence or absence of 10 μM NAD+ or 1 mU/mL of NAD+-glycohydrolase (NAD+ase), was evaluated by flow cytometry by using the following monoclonal antibodies: anti CD14PE, CD73PE, CD44FITC, CD45PE-Cy5, and CD105-APC all purchased by BD Biosciences (Milan, Italy). Flow cytometric analyses were performed by a FACS Canto Flow cytometer (BD Bioscences).
Osteogenic and adipogenic differentiation
MSC at the second passage were trypsinized and plated onto 6-well plates at a density of 3 × 10⁴ cells/well, for osteogenic differentiation, or of 2 × 10⁵ cells/well for adipogenic differentiation. Cells were incubated in the absence or presence of 10 μM NAD+, or of 1 mU/mL NAD+ase, or of 5 μM 8-Bromo-cADPR or of 2′,5′-dideoxyadenosine (ddA) for 48 h. Then, the compounds were added daily throughout the differentiation experiment. The osteogenic induction medium consisted of Dulbecco's modified Eagle's medium-F12 with 10% fetal bovine serum (FBS) and 250 μM ascorbic acid, 10 mM β-glycerol phosphate, and 10 nM dexamethasone, which was replaced every 3 days for 1 or 2 weeks. Osteogenic differentiation was assessed after 1 week by quantitative real-time polymerase chain reaction (qPCR) analysis of specific osteocyte differentiation markers [alkaline phosphatase (ALP) and Runx 2 genes] and after 2 weeks by an ALP staining and activity kits (Alkaline Phosphatase Detection Kit and Alkaline Phosphatase Detection kit, fluorescence; Sigma-Aldrich, Milan, Italy). Alternatively, to induce adipogenesis, cells were cultured in Dulbecco's modified Eagle's medium-F12 with 10% FBS and 1 μg/mL human recombinant insulin, 1 μM dexamethasone, 100 μM indomethacin, and 500 μM 3-isobutyl-1-methylxanthine, replacing the medium every 3 days for 1 or 2 weeks. Adipogenic differentiation was assessed after 1 week by qPCR analysis of specific adipogenic differentiation markers (adiponectin, Ap2a, and ppar-γ genes) and after 2 weeks by lipid vacuoles staining with Oil Red O Stain. After incubation, cells were gently washed twice with deionized water and then observed with an optical microscope connected to a photographic device. Oil Red O inclusion into lipid vacuoles was then quantified, after complete solubilization of stained cells with 2-propanol, by measuring the spectrophotometric absorbance at 510 nm.
NAD+ and ATP efflux from MSC
MSC were seeded into complete medium at 1.5 × 10⁵ cells/well on 6-well plates. The day after, cells were washed with Hank's balanced salt solution (HBSS) and incubated at 37°C for 30 and 60 min in 0.7 mL HBSS with or without 1.2 mM CaCl2, 10 ng/mL lipopolysaccharide (LPS), or exposed to a temperature of 39°C. After collection and centrifugation, supernatants were assayed for (i) evaluation of cell death through determination of lactate dehydrogenase release (In Vitro Toxicology Assay Kit, Lactic Dehydrogenase based, Sigma); (ii) evaluation of extracellular ATP levels by a luciferin-luciferase assay (ATP Determination Kit; Molecular Probes, Invitrogen, Milan, Italy), using a luminometer plate reader (Fluostar Optima; BMG Labtechnologies, Offenburg, Germany); and (iii) evaluation of NAD+ e concentration on aliquots additioned with 0.6 M perchloric acid (PCA, final concentration). NAD+ content was measured on the neutralized supernatants through an enzymatic cycling procedure [23]. Protein determination was performed on cell lysates [24].
For determination of nucleotide efflux under shear stress conditions, semi-confluent cell monolayers on poly-
MSC staining of Cx43
Cells were seeded in 4-well chamber slides (Nalge Nunc, Naperville, IL) at 4 × 10⁴ cells/well. The wells were washed with phosphate-buffered saline (PBS), and cells were fixed and stained with 1 μg/mL rabbit anti-Cx43 antibody (Santa Cruz Biotechnology, Santa Cruz, CA) in 5% bovine serum albumin-PBS, followed by 1 μg/mL anti-rabbit Alexa546 secondary antibody (Molecular Probes, Invitrogen). Cover glasses were mounted by using a solution 9:1 glycerol-PBS. Samples were analyzed under a confocal microscope (Leica TCS SL; Leica Microsystems, Milan, Italy) equipped with a HCX PL APO CS 63.0 × 1.4 oil objective. Stacks of 40 sections with a Z-step of 122 nm for a total thickness of 5.5–6 μm were taken for each image. Average projections were calculated using Leica LCS software.
Lucifer Yellow dye uptake
Cx43 HC opening on the plasmamembrane was monitored by uptake of the cell permeant Lucifer Yellow (LY) dye. MSC were seeded in 4-well chamber slides (4 × 10⁴ cells/well) and preincubated with or without 10 μM mimetic peptide Gap26 or scramble peptide for 30 min and then incubated for 2 min at 37°C with 0.4% LY in HBSS with or without 1.2 mM CaCl2. Cells were then washed with HBSS containing CaCl2 to close hemichannels and prevent leakage of dye from cells. The rhodamine-dextran protein (0.5% in HBSS), which is internalized through endocytotic vescicles, was used as control. Samples were immediately analyzed under a confocal microscope (Leica TCS SL). Single plane images were obtained using Leica LCS software.
Western blots
Expression of Cx43 was measured by western blot in untreated MSC, or after transfection with Cx43-siRNA or scramble siRNA. After transfection, 2.5 × 10⁵ cells were seeded onto 60 × 15 mm tissue culture dishes and cultured for 48 or 120 h. Cells were lysed and western blots were performed as described [26]. Cx43 bands were revealed using a rabbit anti-Cx43 antibody (Santa Cruz Biotechnology), 0.2 μg/mL final concentration.
siRNA gene silencing
MSC were transfected with StealthTM RNAi (Invitrogen) against human Cx43 (HSS104122), P2Y11 (NM_002566), or L-type α1C-subunit (HSS101263). Cells were electroporated with 1 μg duplex siRNA with the Amaxa Nucleofector System (Amaxa, Cologne, Germany), using the human MSC Nucleofector Kit (Amaxa), program U-023. As control, MSC were transfected with StealthTM RNAi Negative Control Duplex (Invitrogen). Further experiments were carried out 24, 48, or 120 h after transfection.
qPCR analyses
Total RNA was extracted from MSC (up to 2.5 × 10⁵ cells) using the RNeasy Micro Kit (Qiagen, Milan, Italy). Quality and quantity of RNA were analyzed using a NanoDrop spectrophotometer (Nanodrop Technologies, Wilmington, DE). cDNA was synthesized by using iScript cDNA Synthesis Kit (Bio-Rad Laboratories, Milan, Italy). PCR primers were designed through Beacon Designer 2.0 Software (Bio-Rad) and are listed in Table 1.
qPCR was performed in an MJ Research Chromo4 detector (Bio-Rad) using 2 × iQ Custom Sybr Green Supermix (Bio-Rad). Values were normalized on mRNA expression of GAPDH and TBP (reference genes). Statistical analyses of the qPCR were obtained using iQ5 Optical System Software version 1.0 (Bio-Rad) based on the 2–ΔΔCt method [27,28]. The dissociation curve for each amplification was analyzed to confirm absence of unspecific PCR products. Experiments were repeated 3 times in triplicate.
Ca2+ measurements
For quantitative, fluorimetric Ca2+ measurements, MSC (2 × 10⁴) were seeded onto 20-mm-diameter glass coverslips in the complete medium and allowed to adhere. Analyses of [Ca2+]i variations induced by NAD+ were performed as described [29].
Semiquantitative confocal microscopy analyses were performed on calcium green-loaded MSC to evaluate cell response to NAD+ with or without various inhibitors or in MSC silenced for P2Y11 receptor or for L-type channel α1C-subunit. Untreated or silenced cells (2 × 10⁴) were seeded onto 8-well coverglass chamber slides (Nunc). Cells were then incubated for 90 min with 10 μM calcium green (Invitrogen). [Ca2+]i changes induced by NAD+ in HBSS, preincubated or not with various inhibitors [200 μM ethylenediaminetetraacetic acid (EDTA) for 5 min; 50 μM ddA or 1 μM NF157 for 45 min; 10 μM nifedipine for 5 min], were analyzed, for 10 min, on fields containing 30–50 cells using the Leica TCS SL confocal microscope equipped with a HC PL FLUOTAR 20.0 × 0.50 objective. An energy laser of 10% was applied to the 488 nm line and the scan was performed recording an image every 5 s. Time-lapse fluorescence intensity was then calculated on the acquired data-sets using Leica LCS software.
Determination of [cyclic adenosin monophosphate]i, [cyclic ADP-ribose]i, and [inositol triphosphate]i levels
Cells were seeded in 35 × 10 mm dishes (3.5 × 10⁵ cells). For intracellular cAMP concentration ([cAMP]i) levels, cells were preincubated for 10 min at 37°C with 10 μM cAMP phosphodiesterase inhibitor 4-(3-butoxy-4-methoxybenzil)imidazolidin-2-one (Ro 20-1724) in 0.7 mL HBSS. α-NAD+, β-NAD+, or buffer (control) were added to cells: incubations were stopped after 0, 0.5, and 1 min by removal of HBSS and addition of 0.6 M ice-cold PCA. The [cAMP]i was determined on the neutralized cell extracts by a radioimmunoassay ([3H]cAMP assay system; GE Healthcare Technologies, Milan, Italy). For the [cADPR]i levels, untreated MSC or pretreated with 1 μM NF157 for 45 min were incubated at 37°C for 1, 10, and 30 min with α-NAD+. Cells were washed with HBSS and lysed with PCA (0.6 M). [cADPR]i was determined by an enzymatic cycling assay [23].
For [Inositol trisphosphate (IP3)]i levels, MSC were incubated in HBSS and challenged with β-NAD+. The reaction was stopped at 0, 10, 30, and 60 s, by adding 0.6 M ice-cold PCA. The [IP3]i was determined on the neutralized cell extracts by radioimmunoassay (GE Healthcare Technologies). Experiments were repeated 3 times in duplicate.
Extracellular NAD+ degradation by MSC
Cells were seeded in 35 × 10 mm dishes (2.5 × 10⁵cells/dish). The medium was replaced with 1.2 mL HBSS containing 50 μM β−NAD+. At 0, 30, 60, and 120 min, 250 μL aliquots were withdrawn and trichloroacetic acid-deproteinized. High-performance liquid chromatography analysis of nucleotides in neutralized samples was performed as described [30].
Proliferation assay
For the proliferation assay, cells were plated at 5 × 10³ cells/well in 96-well plates. Then, 1, 10, and 50 μM NAD+ or ATP, 10 μM ADP-ribose, nicotinamide, nicotinamide mononucleotide (NMN), or adenosin monophosphate (AMP), 1 or 5 mU/mL NAD+ase or apyrase were added, in quadruplicate. After 72 h, the thiazol blue tetrazolium bromide (MTT) test was performed as described [31]. For the [3H]-Thymidine incorporation assay, MSC were plated at 5 × 10³ cells/well in 96-well plates. Then, 1, 10, and 50 μM NAD+ or 1 mU/mL NAD+ase were added in triplicate. After 72 h, cells were pulsed with 0.5 μCi of [3H]-thymidine for 8 h (5 Ci/mmole specific activity, GE Healthcare) and then harvested on Multiscreen Harvest Plates (Millipore, Billerica, MA) using a cell Harvester 96 (Tomtec, Handem, CT). Multiscreen Harvest plates were scintillated by Maxilight scintillation liquid (Fisher Chemicals, Leicester, England) and counted with a β-counter (Chameleon TM 425-104 Multilabel Counter, Bioscan, Washington DC).
Apoptosis assay
The rate of apoptosis was assessed by fluorescence-activated cell sorting (FACS) analysis of plasmamembrane phosphatidyl-serine-positive cells. To perform the analysis, MSC (1.5 × 10⁵) were plated onto 35 × 10 mm dishes and incubated with 50 μM NAD+ or 5 mU/mL NAD+ase for 72 h at 37°C. Cells were then washed with ice-cold HBSS and gently detached from the plate. A 100 μL-aliquot of each sample was incubated, for 20 min on ice in the dark, with or without 5 μg/mL anti-phosphatidylserine Alexa-488 conjugate monoclonal antibody (Upstate, Charlottesville, VA). Cells were washed with ice-cold HBSS, centrifuged, and resuspended in 500 μL HBSS and counterstained with propidium iodide (1 μg/mL, final concentration). Analyses were performed with FACS Canto flow cytometer (BD Biosciences) and data were processed by DIVA software. Experiments were repeated 3 times in duplicate.
Chemotaxis and chemokinesis
MSC were resuspended at 7 × 10⁵ cells/mL in McCoy medium with 5% FBS (chemotaxis medium). Chemotaxis and chemokinesis assays were performed as described [8].
Prostaglandin E2 measurement
The prostaglandin E2 (PGE2) concentration was quantified on 10-fold diluted MSC media. Cells (2.5 × 10⁵/determination), pretreated or not with various inhibitors, were incubated for 6 h with increasing concentrations of β-NAD+ and PGE2 release was measured using the PGE2 Monoclonal EIA Kit (Cayman Chemical Company, Ann Arbor, MI). Experiments were repeated 3 times in duplicate.
Immunomodulation by MSC
Peripheral blood mononuclear cells (PBMC) were obtained from heparinized venous blood of healthy donors and isolated by density centrifugation. PBMC were resuspended in RPMI 1640 with 2 mM L-glutamine, penicillin/streptomycin, and 10% fetal calf serum (Gibco- Invitrogen).
PBMC were seeded in 96-well plates (Sarstedt, Numbrect, Germany) at a concentration of 1 × 10⁵/well and stimulated with Anti Human UCHT-1 (2 μg/mL, R&D Systems, Space Import Export, Milan, Italy) and anti-CD28 (1 μg/mL, BD Pharmingen, Milan, Italy) with or without MSC at 4:1 and 20:1 PBMC/MSC ratios for 4 days. Cells were pulsed with 0.5 μCi of [3H] thymidine for 8 h (5 Ci/mmole specific activity; GE Healthcare) and harvested on Multiscreen Harvest Plates (Millipore) using a cell harvester 96 (Tomtec). Multiscreen Harvest plates were scintillated by Maxilight scintillation liquid (Fisher Chemicals) and counted with a β-counter (Chameleon TM 425-104). PBMC, stimulated with anti-UCHT-1 and anti-CD28, with or without MSC, were daily treated with 10 μM NAD+ or with 10 mU/mL NAD+ase. Experiments were performed 3 times in triplicate.
Cytokine array and cAMP/Ca2+-dependent transcription factor array
For the cytokine array, MSC (2.5 × 10⁵) were seeded onto 35 × 15 mm dishes. Cells were incubated for 24 h with or without 10 μM β-NAD+. The cell supernatant was collected and analyzed by using Human Cytokine Antibody Array III (Raybiotech, Norcross, GA). Membranes were treated according to instructions; positive spot detection and densitometry were performed using the Chemi-Doc System (Bio-Rad).
For the cAMP/Ca2+-dependent transcription factor array, 8 × 10⁵ MSC were seeded onto 100 × 20 mm dishes. Cells were incubated for 1 h with or without 10 μM β-NAD+. MSC were lysed and nuclear extracts prepared with the nuclear extraction kit (Panomics, Vignate, Milan, Italy). Nuclear extracts were analyzed with the cAMP/Ca2+ Protein/DNA Array (Panomics). Membranes were treated according to instructions; positive spot detection and densitometry were performed using the Chemi-Doc System (Bio-Rad). Experiments were repeated 3 times.
Statistical analysis
Data are presented as mean ± standard deviation of mean. Student's t-test was used to analyze the difference between 2 groups. A P < 0.05 was considered statistically significant.
Results
NAD+ efflux through Cx43 HCs in human MSC
NAD+ is released by various cell types through Cx43 HC [12,13]. Presence of Cx43 on the plasmamembrane of human MSC was observed by confocal microscopy (Fig. 1A). To investigate whether Cx43-mediated NAD+ release occurred in MSC, cells were incubated in the absence of extracellular Ca2+ (Ca2+ e), a condition known to favour opening of Cx43 HC [32,33], and NAD+ efflux was compared with that measured in cells incubated with Ca2+ e. As shown in Fig. 1B, the time-dependent NAD+ release from cells into the culture medium was significantly increased over controls (5–6-fold) in cells cultured without Ca2+ e. Further, preincubation of MSC with a Cx43-specific mimetic peptide (gap26) impairing HC opening [34] inhibited by 69% ± 10% the NAD+ efflux from cells incubated without Ca2+ e, whereas a scramble, control peptide, was inactive (Fig. 1B, scr).
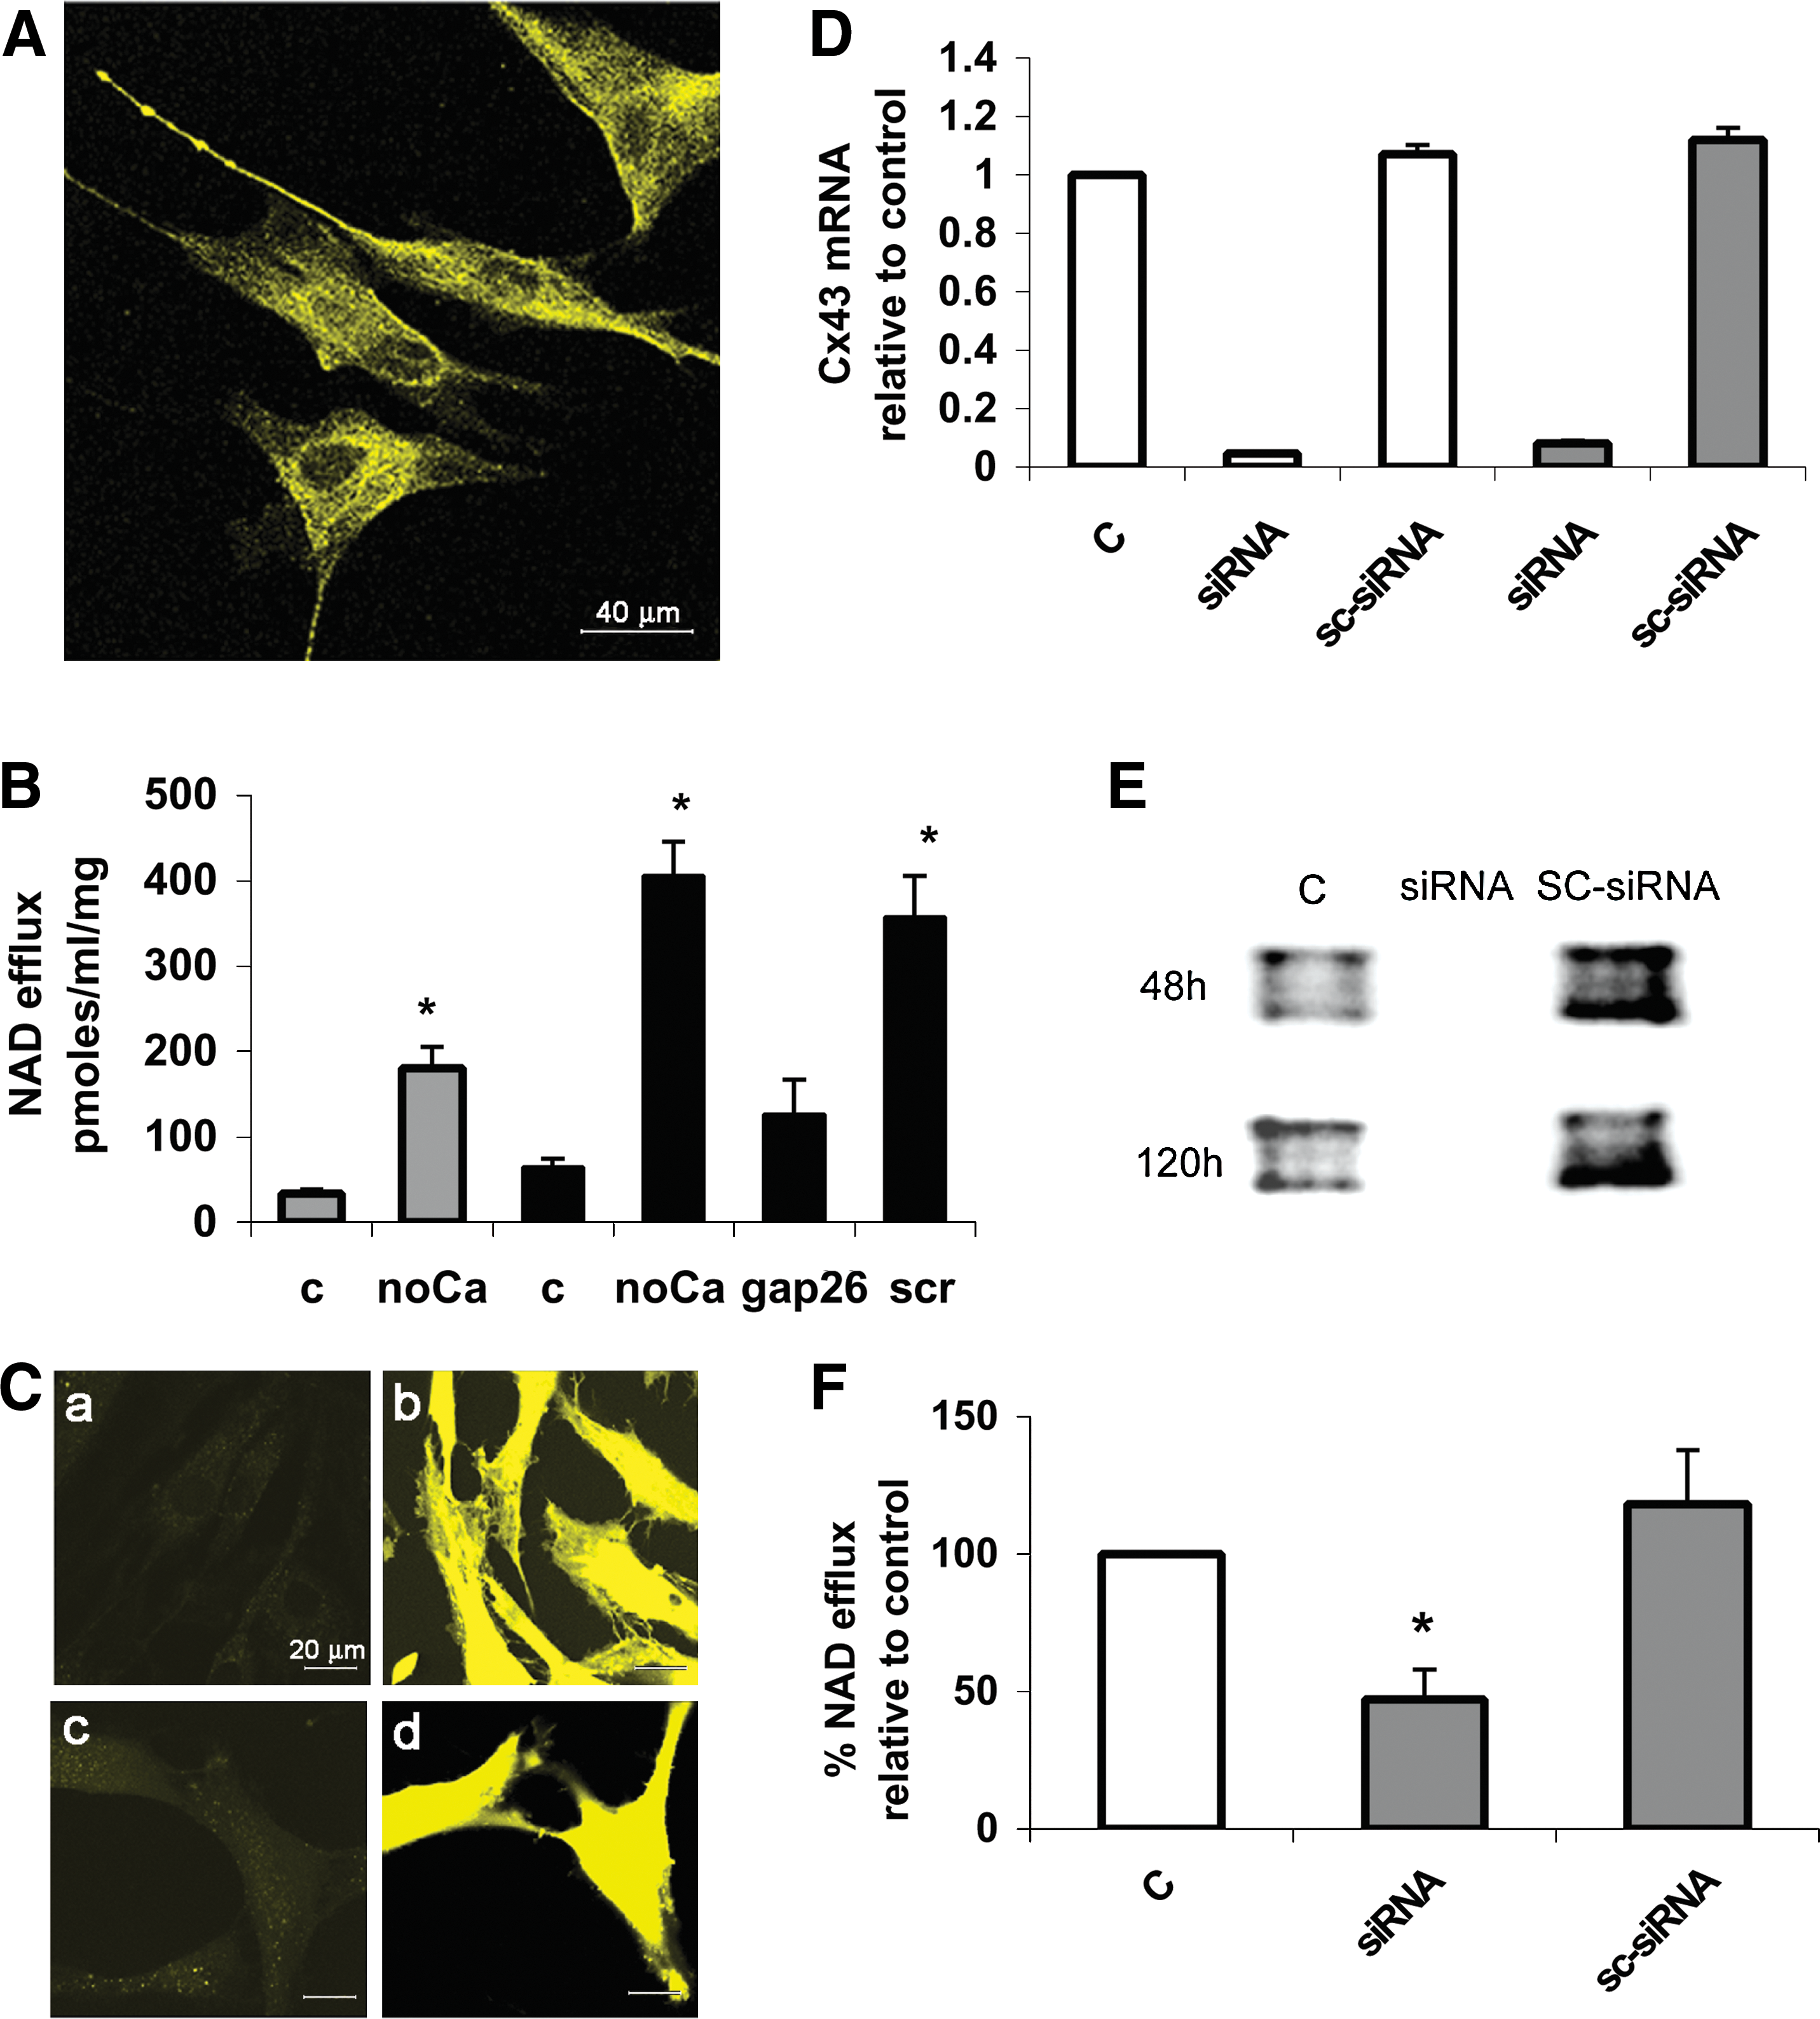
Cx43-mediated NAD+ efflux from human MSC.
Gap junction HC have been reported to mediate ATP release from MSC [14]. Thus, we investigated ATP efflux from MSC under the same experimental conditions used to induce Cx43 opening. ATP release from MSC was significantly enhanced when cells were incubated for 30 and 60 min without Ca2+
e (2.4- and 8.8-fold increase, respectively, as compared with cells cultured with Ca2+
e). Gap26, but not the scramble peptide, strongly inhibited (by 56% ± 9%) ATP release in the absence of Ca2+
e (Supplementary Fig. S1A; Supplementary Data are available online at
To investigate the opening state of Cx43 HC in living cells, the uptake of LY [35], in the absence or presence (control) of Ca2+ e, was monitored by confocal microscopy. As compared with control (Fig. 1C, panel a), dye uptake was increased in cells incubated without Ca2+ e (panel b) and this LY influx was blocked by gap26 (panel c), but not by the scramble peptide (panel d), pointing to the specific involvement of Cx43 HC in LY internalization.
To conclusively demonstrate that NAD+ release from MSC is mediated by Cx43, silencing of Cx43 expression was achieved by transfection with specific siRNAs. At both 48 and 120 h from transfection (Fig. 1D, white and gray bars, respectively), Cx43 mRNA levels were decreased by ∼95% as compared with untreated cells (C) and to cells transfected with a scramble siRNA (SC-siRNA). Extensive downregulation of the Cx43 protein was confirmed by Western blot analysis (Fig. 1E). NAD+ release in the absence of Ca2+ e was significantly inhibited (by 53%) in MSC transfected with Cx43-siRNA, as compared with control cells and to cells transfected with the SC-siRNA (Fig. 1F). ATP release from Cx43-silenced MSCs was reduced to a similar extent (55%) when compared with untreated cells and to cells transfected with the SC-siRNA (Supplementary Fig. S1B).
The opening of Cx43 HC is known to increase in the presence of shear stress, subconfluent culture conditions [36], or inflammatory stimuli [37]. NAD+ release from MSC kept under fluid flow for 30 min (Fig. 2A) significantly increased (13-fold) over values recorded with untreated cells. Conversely, NAD+ released from confluent MSC (2.5 × 10⁵ cells/well) was significantly lower (45%) than that released from subconfluent cells (1 × 10⁵ cells/well) (Fig. 2B). ATP release from MSC under fluid flow was also enhanced (4.5-fold) over no-flow conditions and was reduced by 70% in confluent as compared with subconfluent cells (Supplementary Fig. S1C, D, respectively).
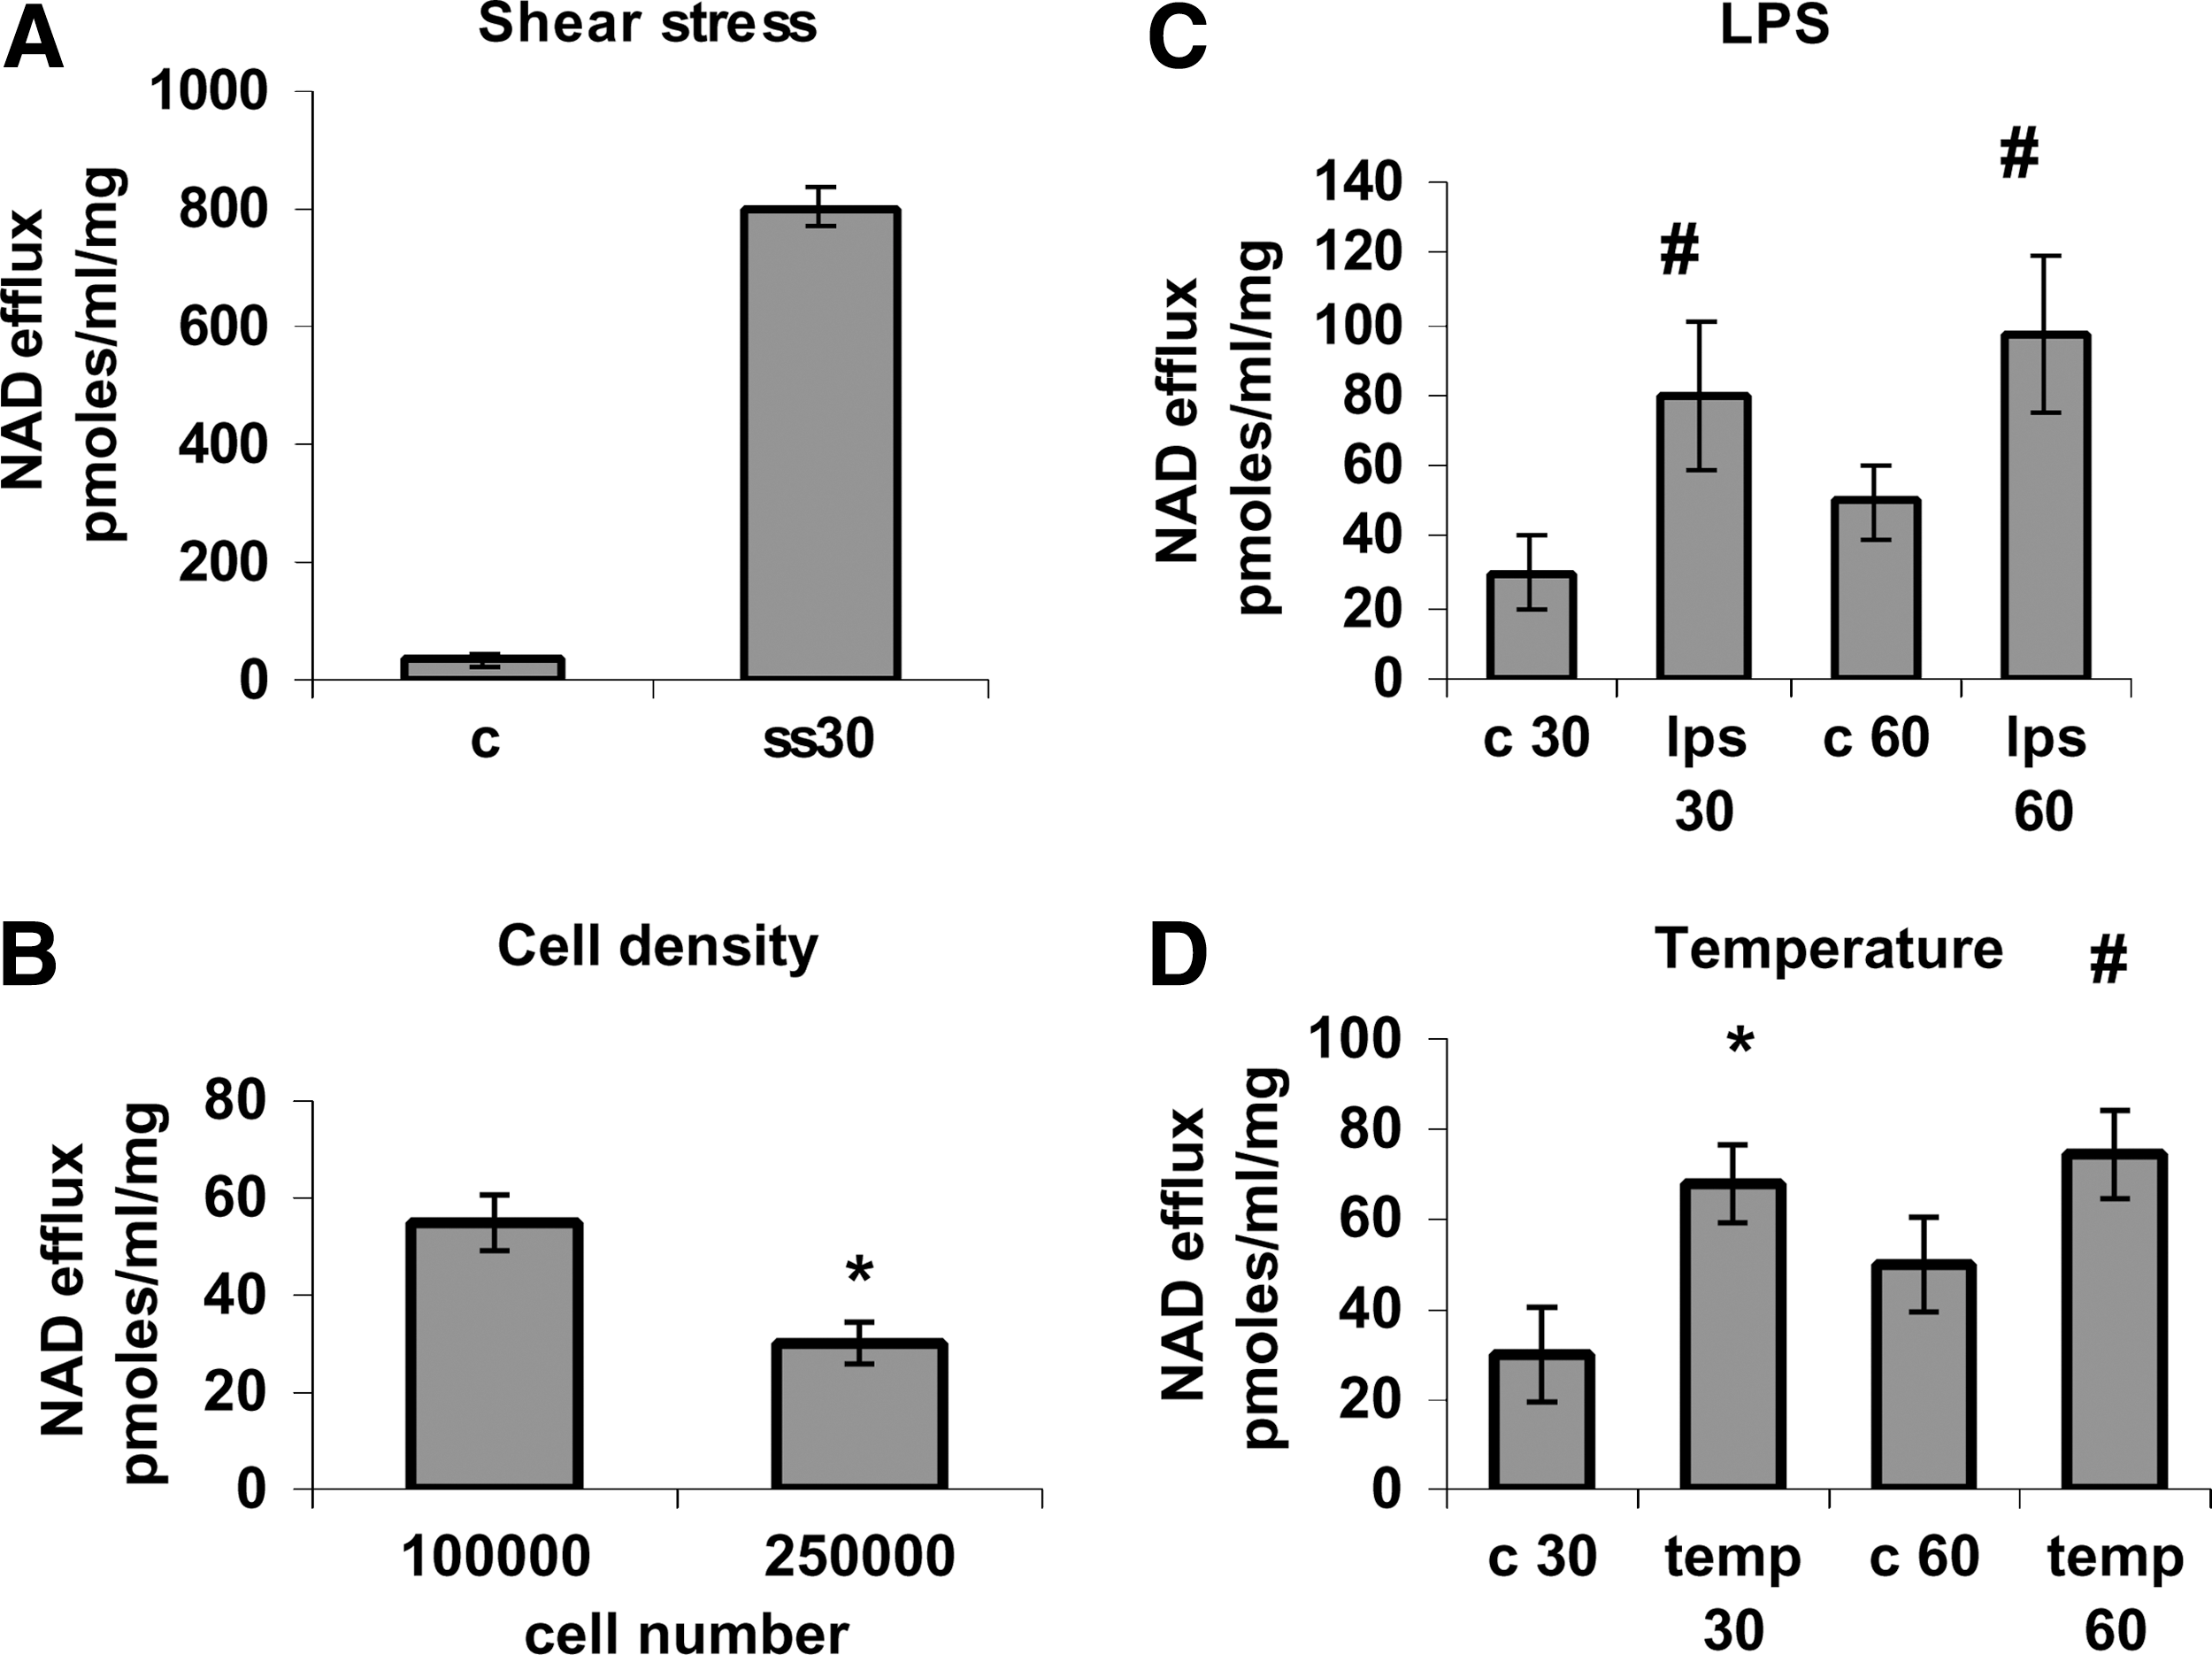
Stimulation of NAD+ release from MSC by physical and chemical stimuli.
Next, the effect of LPS and of fever-like temperatures was investigated. NAD+ release from MSC was significantly enhanced by exposure of the cells to LPS or to 39°C (Fig. 2C, D). Efflux of ATP was also increased 1.7- and 2-fold after cell exposure to LPS or to 39°C, respectively (Supplementary Fig. S1E).
Extracellular NAD+ degradation
Human MSC express several NAD+-degrading ectoenzymes, producing various NAD+ metabolites. In particular, NAD+ is the substrate of CD38 and BST1, which act as NAD+ases, eventually producing ADPR and nicotinamide [38]. MSC also express the ecto-nucleotide pyrophosphatases/phosphodiesterases 1 and 3 (E-NPP1/3), as confirmed by qPCR (not shown), which cleave NAD+ to AMP and NMN. Finally, the ecto-nucleotidase CD73 further hydrolyzes AMP to adenosine, thus favoring the completion of NAD+ cleavage. Together, these enzyme activities were found to account for 5.35 ± 0.8 nmol/min/mg protein of NAD+ e degrading activity, as quantified on 50 μM NAD+ (starting concentration).
P2Y11 involvement in NAD+ e-triggered Ca2+ signaling in human MSC
In several cell types, NAD+ e has been identified as a signal metabolite, regulating different cell functions through [Ca2+]i-dependent mechanisms [15 –19]. Indeed, addition of 10 μM β-NAD+ (Fig. 3A, trace 1) to human MSC, induced in most cells (71.5 + 7.0%) a rapid and transient [Ca2+]i increase (from 46 to 83 ± 10 nM in ∼1 min), followed by a sustained [Ca2+]i rise (up to 87.0 ± 20.5 nM after 10 min). Recently, both α- and β-NAD+ proved to activate the purinergic receptor P2Y11 in human granulocytes. P2Y11 is the only purinergic receptor that couples to both adenylate cyclase (AC) and phospholipase C. Indeed, at micromolar concentrations, α- and β-NAD+ elicit a cAMP-dependent, cADPR-mediated, and sustained [Ca2+]i increase in granulocytes, whereas at millimolar concentrations they also trigger an IP3-mediated transient [Ca2+]i rise [18]. Similarly to what observed in granulocytes, α-NAD+ induced a [Ca2+]i increase in MSC comparable to that observed with β-NAD+ (Fig. 3A, trace 2) and the β-NAD+-induced [Ca2+]i rise was prevented by preincubation of cells with NF157 (Fig. 3A, trace 4), a selective P2Y11 receptor antagonist [39]. To confirm P2Y11 involvement, MSC were transfected with a specific siRNA for P2Y11: after 48 h, P2Y11 mRNA levels were decreased to ∼30% as compared with control cells, whereas MSC transfection with an SC-siRNA did not appreciably modify P2Y11 expression (Fig. 3B, gray bars). As shown in Fig. 3A (trace 5), P2Y11 silencing abolished both the transient and the sustained [Ca2+]i increase induced by β-NAD+ e, whereas transfection with the SC-siRNA was ineffective (trace 3). To exclude a possible role of the P2X7 receptor, known to be indirectly activated by NAD+ in murine lymphocytes [16], MSC were preincubated with 2 P2X7 inhibitors, KN62, and oxidized ATP, and then challenged with NAD+ while monitoring intracellular [Ca2+]i movements: at both conditions no inhibition of NAD+-mediated [Ca2+]i increase was observed (not shown).
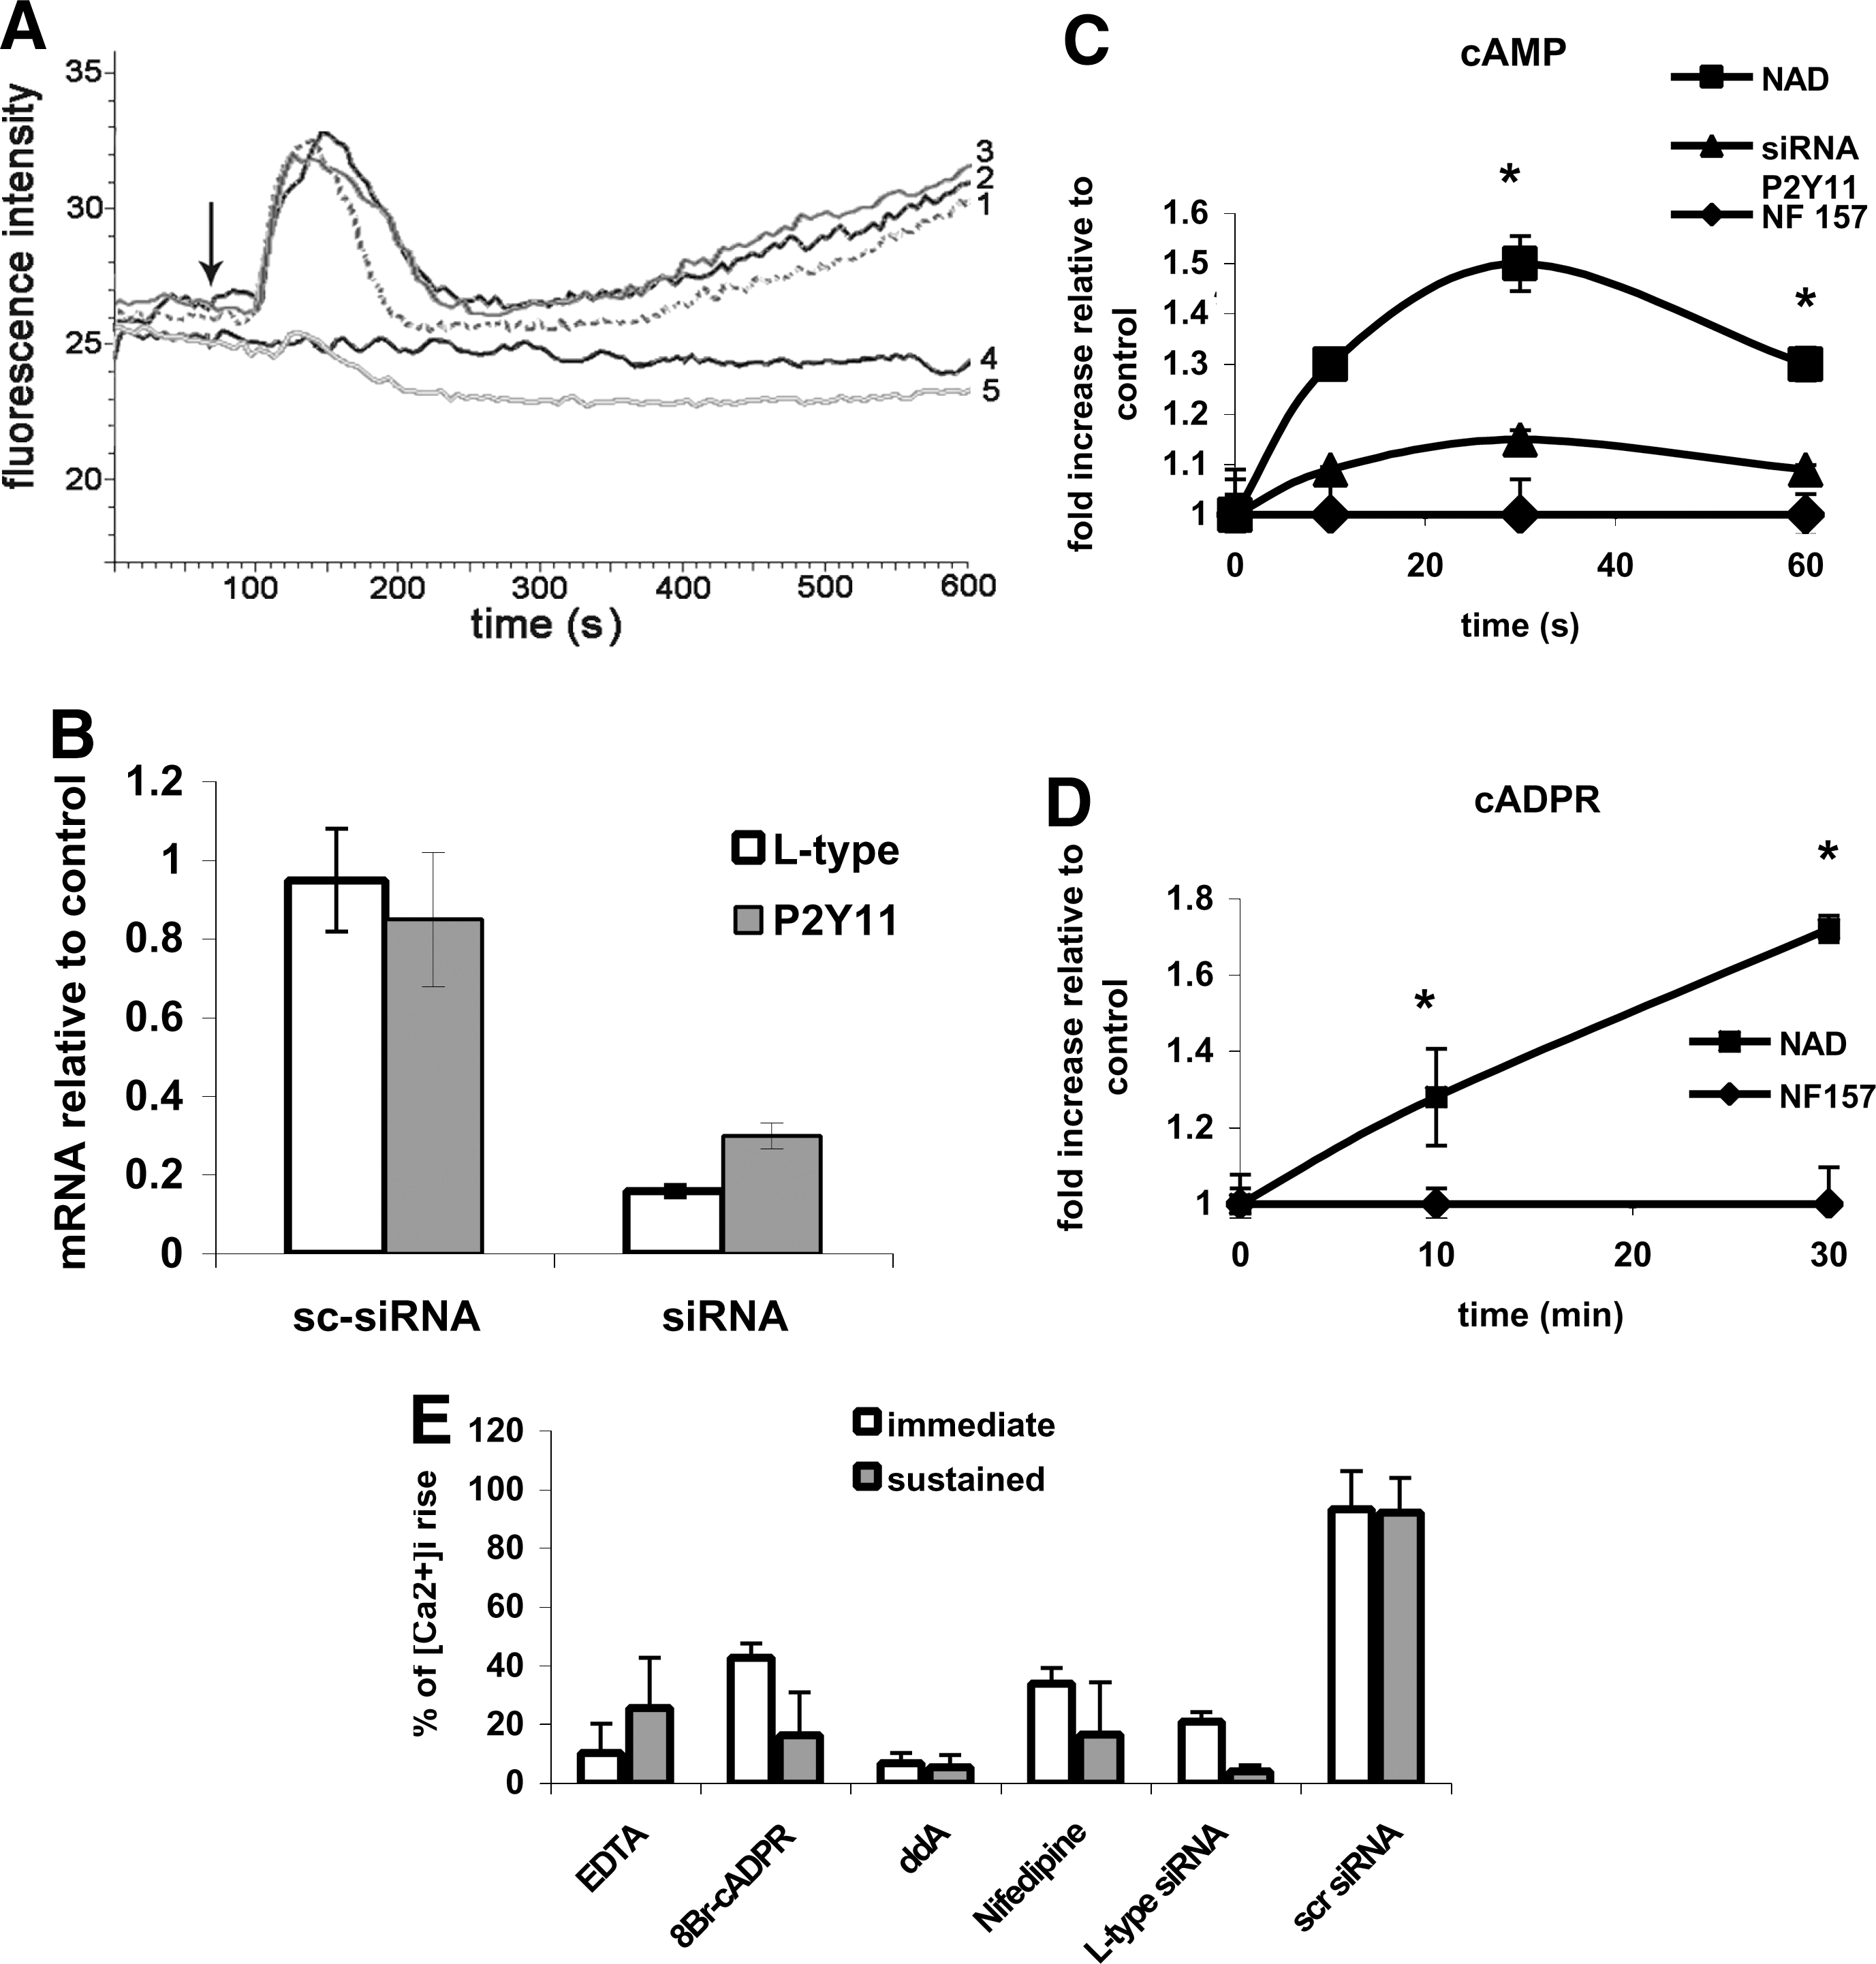
[NAD+]e-induced Ca2+ signaling in MSC.
Second messengers in NAD+ e signaling
Next, the intracellular levels of the second messengers (cAMP, cADPR, and IP3) involved in the P2Y11-mediated signaling cascade triggered by NAD+ e were analyzed in MSC exposed to NAD+. The [cAMP]i in MSC increased from a basal value of 35.9 ± 3.3 pmol/106 cells to 53.9 ± 8.1 pmol/106 cells (n = 7) after a 30-s stimulation with 10 μM β-NAD+ e (Fig. 3C). Similar results were obtained with 10 μM α-NAD+ e (not shown). Preincubation of MSC with NF157 abolished the increase of the [cAMP]i induced by NAD+ e (Fig. 3C). The NAD+-induced increase of the [cAMP]i was also prevented in MSC transfected with the specific P2Y11-siRNA, whereas transfection of cells with an SC-siRNA did not modify the [cAMP]i rise (not shown).
To investigate changes in the [cADPR]i, we stimulated MSC with α-NAD+ e, which is not a substrate of CD38, to avoid interference by extracellular cADPR in the determination of the [cADPR]i. Exposure of MSC to α-NAD+ e resulted in a time-dependent increase of the [cADPR]i, from a basal value of 0.17 ± 0.04 pmol/106 cells (n = 4) to 0.72 ± 0.15 pmol/106 cells after 30 min (Fig. 3D). Preincubation with NF157 prevented the NAD+-induced [cADPR]i increase (Fig. 3D), confirming that intracellular generation of cADPR in NAD+-stimulated MSC lies downstream of P2Y11 activation.
Finally, the [IP3]i was measured in MSC challenged with β-NAD+ e. No significant changes of the [IP3]i were observed upon incubation of MSC with 10 μM β-NAD+ (not shown). This result is in line with data obtained in human granulocytes, where millimolar concentrations of NAD+ were required to induce an increase of the [IP3]i [18].
Next, we addressed the mechanisms underlying the [Ca2+]i increase induced by β-NAD+ in MSC. When 10 μM NAD+ was added to MSC in the presence of 0.2 mM EDTA in Ca2+-free HBSS, the immediate Ca2+ rise was prevented (Fig. 3E, white bar), indicating that it was determined by an influx of Ca2+. The sustained [Ca2+]i increase was also significantly (75%, gray bar), but not completely, inhibited in the presence of 0.2 mM EDTA. These findings suggest that the first transient Ca2+ increase is required to trigger the subsequent slow rise, and that a limited Ca2+ release from intracellular stores underlies the sustained [Ca2+]i increase. Preincubation of cells with the membrane-permeant cADPR antagonist 8-Br-cADPR, inhibiting ryanodine receptor activation on the endoplasmic reticulum [40], partially inhibited (by 60%) the rapid [Ca2+]i increase induced by β-NAD+, whereas the slow, sustained Ca2+ rise was largely impaired (Fig. 3E), indicating that cADPR is involved in the generation of both the transient and the sustained NAD+-induced Ca2+ increase. Similar results were obtained upon preincubation of cells with 50 μM ryanodine, a concentration known to inhibit the ryanodine receptors (not shown). Presence of ddA, an inhibitor of membrane-associated AC, prevented both the rapid and the sustained [Ca2+]i increase induced by 10 μM β-NAD+ (Fig. 3E), indicating that the NAD+-induced Ca2+ responses require cAMP overproduction.
NAD+ e-triggered L-type channel opening
In NG108-15 neuroblastoma-glioma hybrid cells, cADPR infused through patch pipettes induces intracellular Ca2+ release through ryanodine receptors and this activates L-type channels, with subsequent influx of Ca2+ e, which is inhibited by 8-Br-cADPR and ryanodine [41]. In MSC preincubated with the L-type channel antagonist nifedipine, both the rapid and the sustained NAD+ e-induced [Ca2+]i rise were strongly inhibited (by 67 and 83%, respectively, Fig. 3E), indicating involvement of these channels in the generation of both NAD+-induced Ca2+ responses, or, alternatively, requirement of a first L-type channel-mediated [Ca2+]i peak for the second sustained [Ca2+]i increase to occur.
To confirm a role for L-type channels in the Ca2+ influx elicited by NAD+, MSC were transfected with a specific siRNA for the L-type channel α1C-subunit. After 24 h, mRNA levels were decreased to ∼15% as compared with control cells and to SC-siRNA-transfected cells (Fig. 3B, white columns). As shown in Fig. 3E, L-type channel silencing abolished both the transient and the sustained [Ca2+]i increase induced by βNAD+, whereas transfection with the SC-siRNA was without effect.
Finally, the NAD+-induced increase of the [cAMP]i was not modified when MSC were preincubated with nifedipine (not shown), demonstrating that cAMP overproduction occurs upstream of the transient Ca2+ influx in this signaling cascade.
Effect of NAD+ e on MSC expression markers and pluripotency
To explore possible changes in the phenotype, FACS analyses were performed on MSC cultured for 3 and 7 days in the presence or absence of 10 μM NAD+ or 1 mU/mL NAD+ase (both added daily). The surface antigens and their percentage of expression are shown in Table 2. Control MSC stained positive for the typical mesenchymal markers (CD44, CD73, and CD105) and negative for the hematopoietic markers (CD14 and CD45). No changes in expression of the above antigens were observed upon NAD+ or NAD+ase treatment, indicating that the MSC phenotype is unaffected by NAD+ e.
MSC were incubated in the absence (C) or in the presence of 10 μM NAD+ or 1 mU/mL NAD+ase for 3 and 7 days and then the listed surface antigens were analyzed by fluorescence-activated cell sorting as described in Materials and Methods. Results are the mean of 3 experiments, standard deviation ≤5% for all samples.
MSC, mesenchymal stem cell.
To investigate whether NAD+ stimulation, blockade of Ca2+ release, or inhibition of cAMP signaling could affect the pluripotency of MSC, cells were incubated in the presence or absence of 10 μM NAD+, or 1 mU/mL NAD+ase, or 5 μM 8-Br-cADPR or 5 μM ddA for 48 h and then induced to differentiate toward osteocytes and adipocytes under the appropriate stimuli, adding the above-mentioned compounds daily throughout the differentiation experiment. After 1 week under differentiating conditions, qPCR expression analysis of osteogenic and adipogenic markers was performed, and after 2 weeks, the ALP activity was measured to assess osteocyte differentiation while oil red O inclusion in lipid droplets was quantified to evaluate adipocyte maturation. Results are shown in Fig. 4. In differentiated cells, no significant changes in the expression of osteocyte markers (runx2 and ALP, Fig. 4A) and in ALP activity (Fig. 4C) were observed upon treatment with NAD+, NAD+ase, 8-Br-cADPR or ddA; further, no differences in expression of adipocyte expression markers (ppar-gamma, FABP4, and adiponectin, Fig. 4B) and in the accumulation of oil red O into lipid droplets (Fig. 4D) were observed upon treatment of differentiating MSC with either NAD+, NAD+ase, 8-Br-cADPR, or ddA.
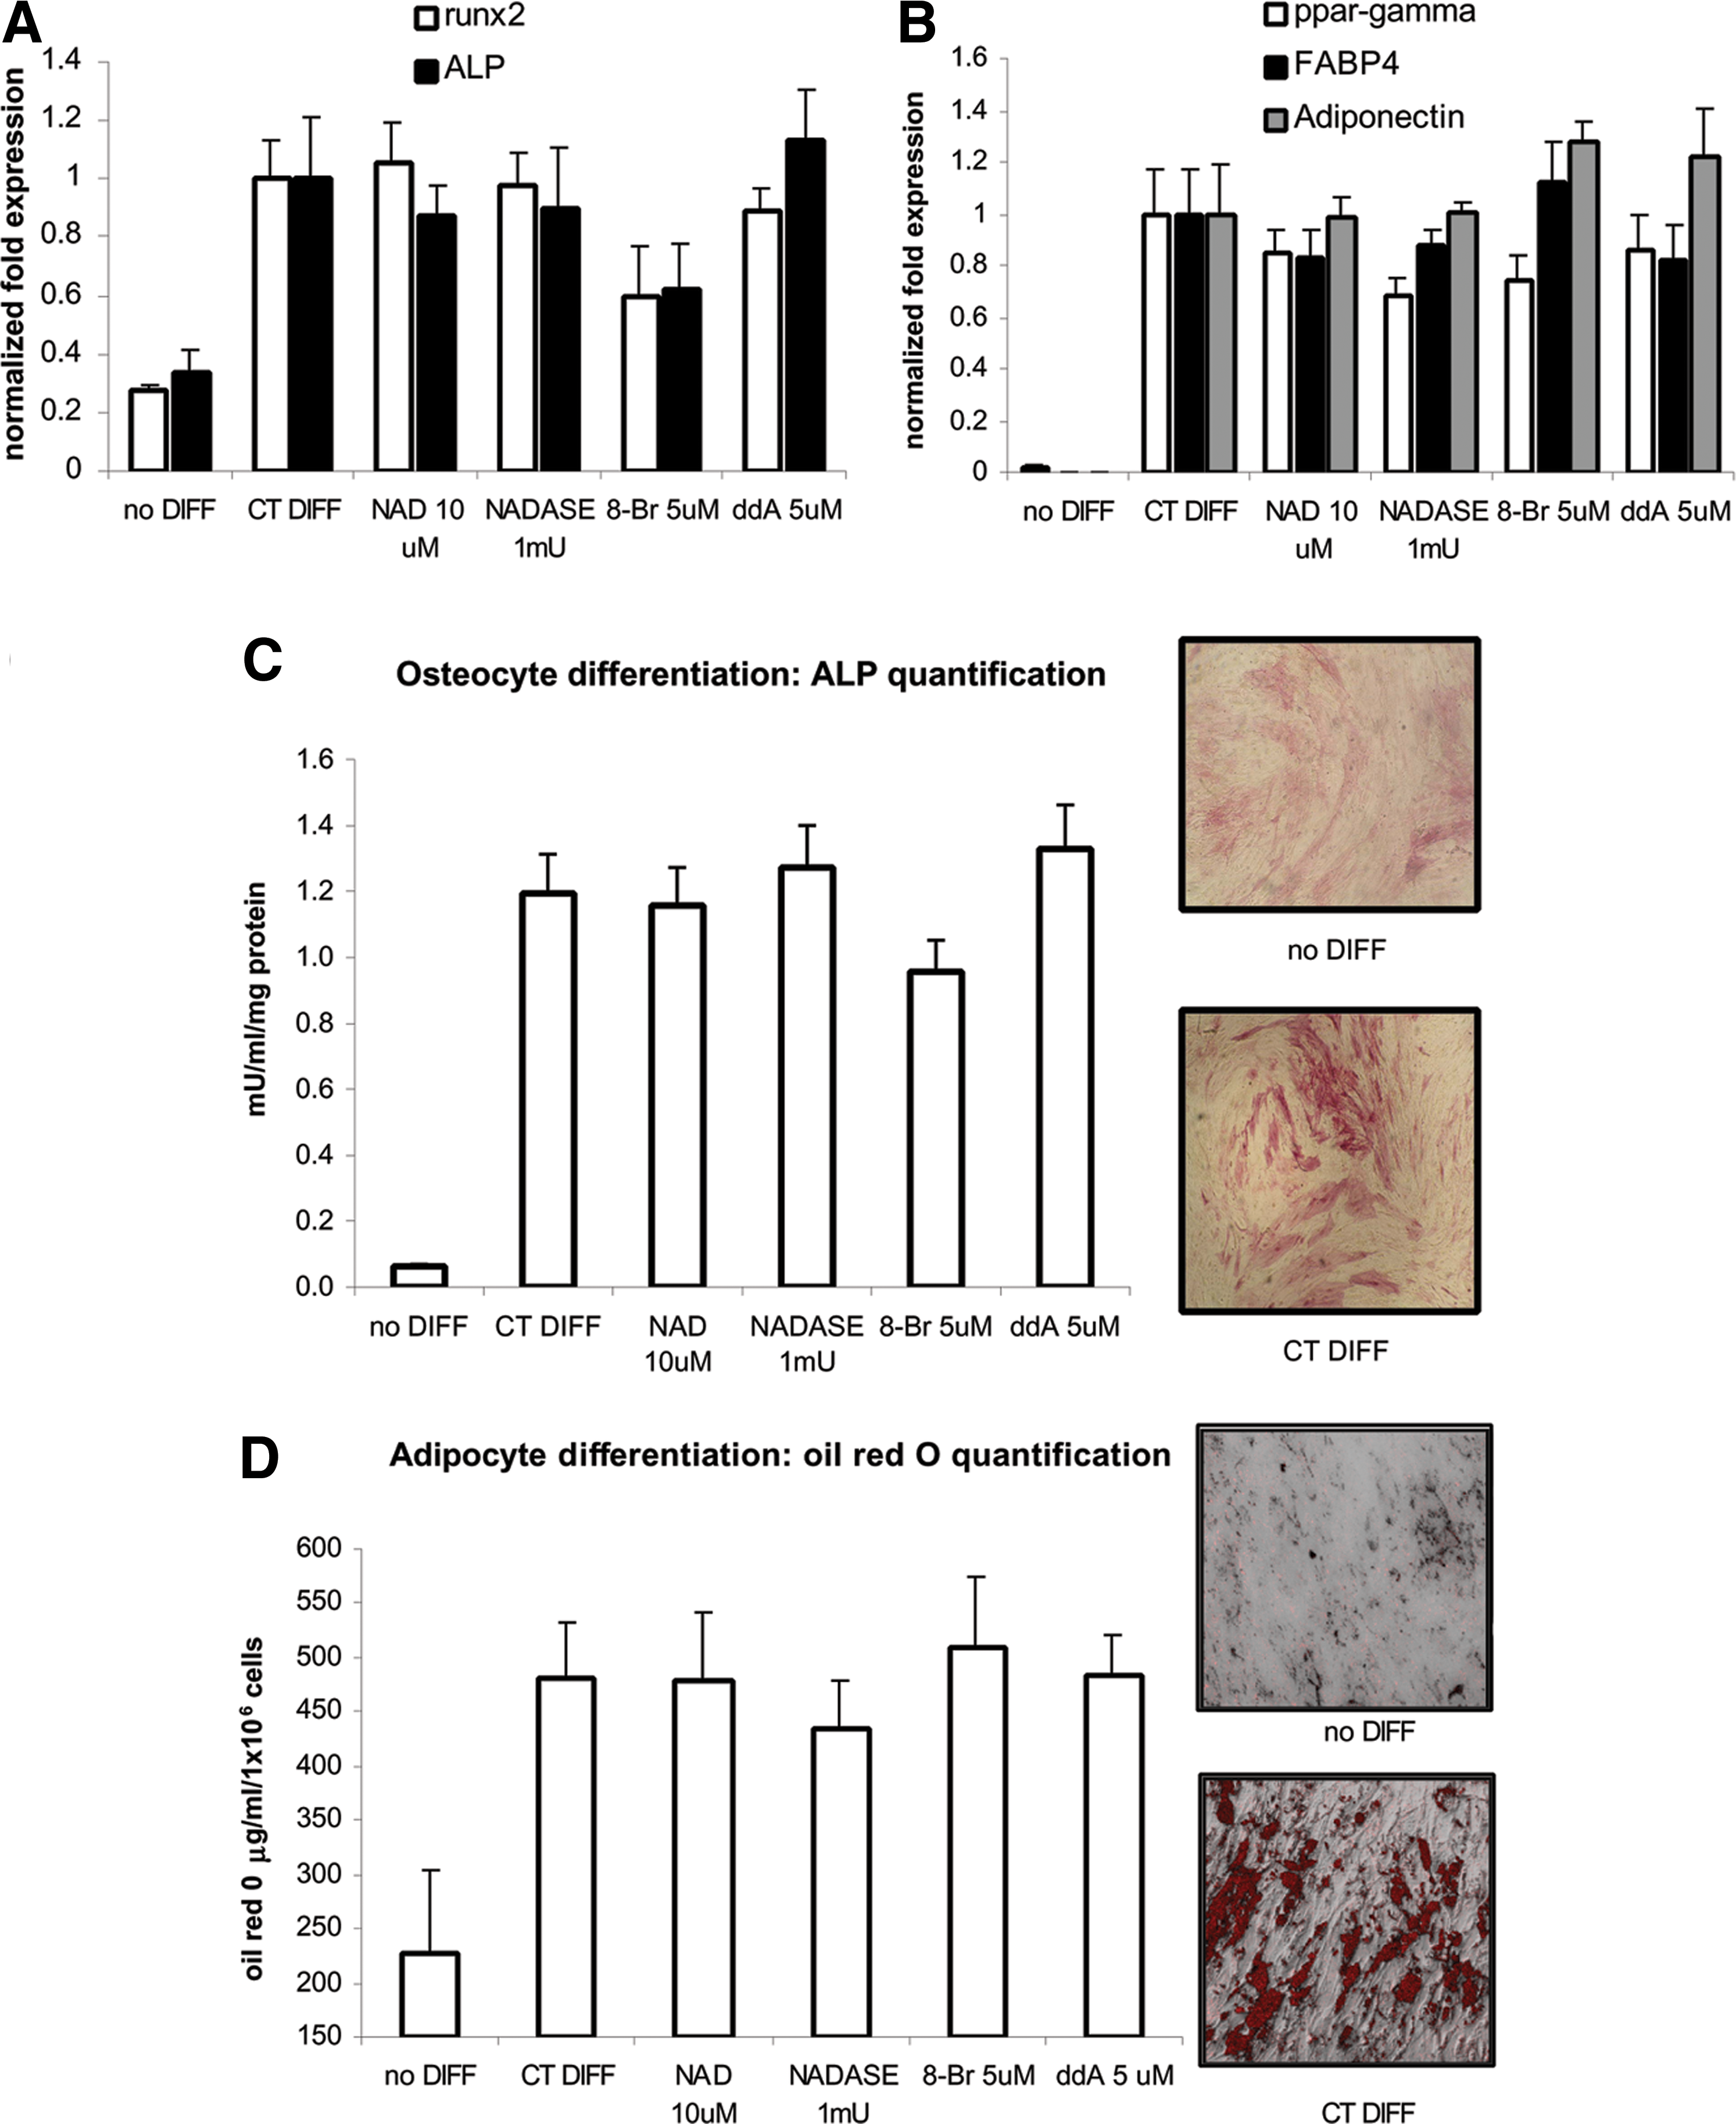
Osteocyte and adipocyte differentiation in the presence or absence of 10 μM NAD+, or 1 mU/mL NAD+ase, or 5 μM 8Br-cADPR or 5 μM ddA.
Effect of NAD+ e on MSC proliferation
cADPR has been shown to stimulate MSC proliferation when exogenously added to cell cultures or when endogenously generated as a second messenger in the abscisic acid signaling pathway [8]. Cx43-mediated NAD+ efflux occurs from MSC (this study), and ectocellular ADPRC activity is expressed on MSC [8]; these prompted us to investigate whether NAD+ e could autocrinally affect MSC proliferation.
Addition of β-NAD+ e slightly, but significantly (P < 0.05), stimulated MSC proliferation, at concentrations ranging between 1 and 50 μM, as measured by MTT assay after 72 h (Fig. 5A). However, under suboptimal culture conditions (0.5% FBS), stimulation of the proliferation in NAD+-treated cells was higher than that observed in 10% FBS: after 72 h culture, the number of MSC was increased by 153.7% ±10.9% and by 157.5% ± 13.2% in the presence of 10 or 50 μM NAD+, respectively, compared with untreated controls (n = 4). Preincubation of cells with 1 μM NF157, 50 μM ddA, or 100 μM 8-Br-cADPR prevented the growth-stimulatory effect of NAD+ e, indicating involvement of the P2Y11/cAMP/cADPR pathway in the NAD+-induced proliferative effect (Fig. 5A).

Proliferation and apoptosis of NAD+ treated MSC.
To investigate whether autocrinally released NAD+ could stimulate MSC growth, cells were also incubated in the presence of 1 or 5 mU/mL of NAD+ase. Indeed, NAD+ase reduced MSC proliferation by ∼20%–25% (Fig. 5A). The [NAD+]e in the cell supernatants decreased in the presence of both NAD+ase concentrations from 35 ± 7 nM to undetectable levels after 72 h treatment with NAD+ase, (n = 3). In the same experiments, the [NAD+]i was also measured, to investigate whether extracellular NAD+ase could affect the [NAD+]i, via equilibrative leakage of NAD+ through Cx43 HC, possibly impairing MSC metabolism and cell growth. In fact, [NAD+]i was unaffected by NAD+ase addition; thus, the reduced proliferation rate was not due to a decrease of the [NAD+]i, which was comparable in cells exposed or not to NAD+ase (7.5 ± 0.8 and 7.1 ± 0.9 nmol/mg protein, respectively, n = 3). The effect of ectocellular ATP on MSC proliferation was also investigated. Neither addition of up to 50 μM extracellular ATP nor degradation of released ATP by addition of apyrase (an enzyme cleaving ATP to AMP and pyrophosphate) modified the MSC proliferation rate (Supplementary Fig. S2A). Incubation of MSC for 72 h in the presence of the NAD+ metabolites ADPR, nicotinamide, NMN, and AMP at 10 μM did not affect cell proliferation (not shown), indicating that the proliferation-enhancing effect on MSC is afforded by NAD+ and not by its degradation products.
The slight but significant growth-stimulating effect of NAD+ on MSC was also confirmed by 3H-thymidine incorporation. After 72 h in the presence or absence (control) of NAD+ e, a significantly higher 3H-thymidine incorporation was observed in NAD+-treated MSC compared with controls; conversely, a 30% lower incorporation was observed in NAD+ase-treated MSC compared with untreated controls (Fig. 5B).
To ascertain whether NAD+ and/or NAD+ase treatment could affect cell growth by modifying the rate of apoptosis, the percentage of MSC staining positive for annexin and/or propidium iodide after 72 h incubation with NAD+ or NAD+ase was evaluated by FACS analysis. In NAD+-treated cells, the percentage of dead cells was comparable to that in untreated cells, whereas the percentage of apoptotic cells decreased to 45% of controls (Fig. 5C). Conversely, in NAD+ase-treated cells, the number of dead cells increased 1.4-fold over controls, whereas apoptotic cells were comparable to controls. Altogether, these results suggest that NAD+ e affects cell growth of MSC, favoring proliferation and reducing apoptosis.
To establish whether NAD+ released through Cx43 HC is indeed involved in the autocrine regulation of MSC proliferation, Cx43 mRNA was silenced in MSC, and Cx43 protein synthesis was inhibited for at least 120 h from transfection (Fig. 1E). As shown in Fig. 5D, at 72 h, the proliferation rate of MSC transfected with Cx43-siRNA was decreased by 20% as compared with both untreated cells and to scramble-transfected controls, thus reproducing the effect of NAD+ase-induced depletion of NAD+ e (Fig. 5A), whereas cell growth could be restored to control levels by addition of 10 μM NAD+. Conversely, transfection with an SC-siRNA did not modify cell proliferation compared with untreated controls, and addition of NAD+ e again slightly stimulated cell expansion (Fig. 5D).
Effect of NAD+ e on MSC migration
NAD+ e behaves as a chemoattractant molecule for human granulocytes [17]. At concentrations ranging from 10 nM to 10 μM, NAD+ e stimulated MSC chemotaxis, with 100 nM being as effective as 10 μM NAD+ (Fig. 6A, gray bars). Untargeted cell movement (chemokinesis) was also stimulated by NAD+ e: MSC preincubated with 1 or 10 μM β-NAD+ for 30 min showed a 2-fold and a 3.5-fold increase, respectively, of the chemokinesis index compared with untreated controls (Fig. 6A, black bars). Conversely, chemokinesis in the presence of NAD+ase (1 mU/mL) was slightly inhibited (by 10%, Fig. 6A).
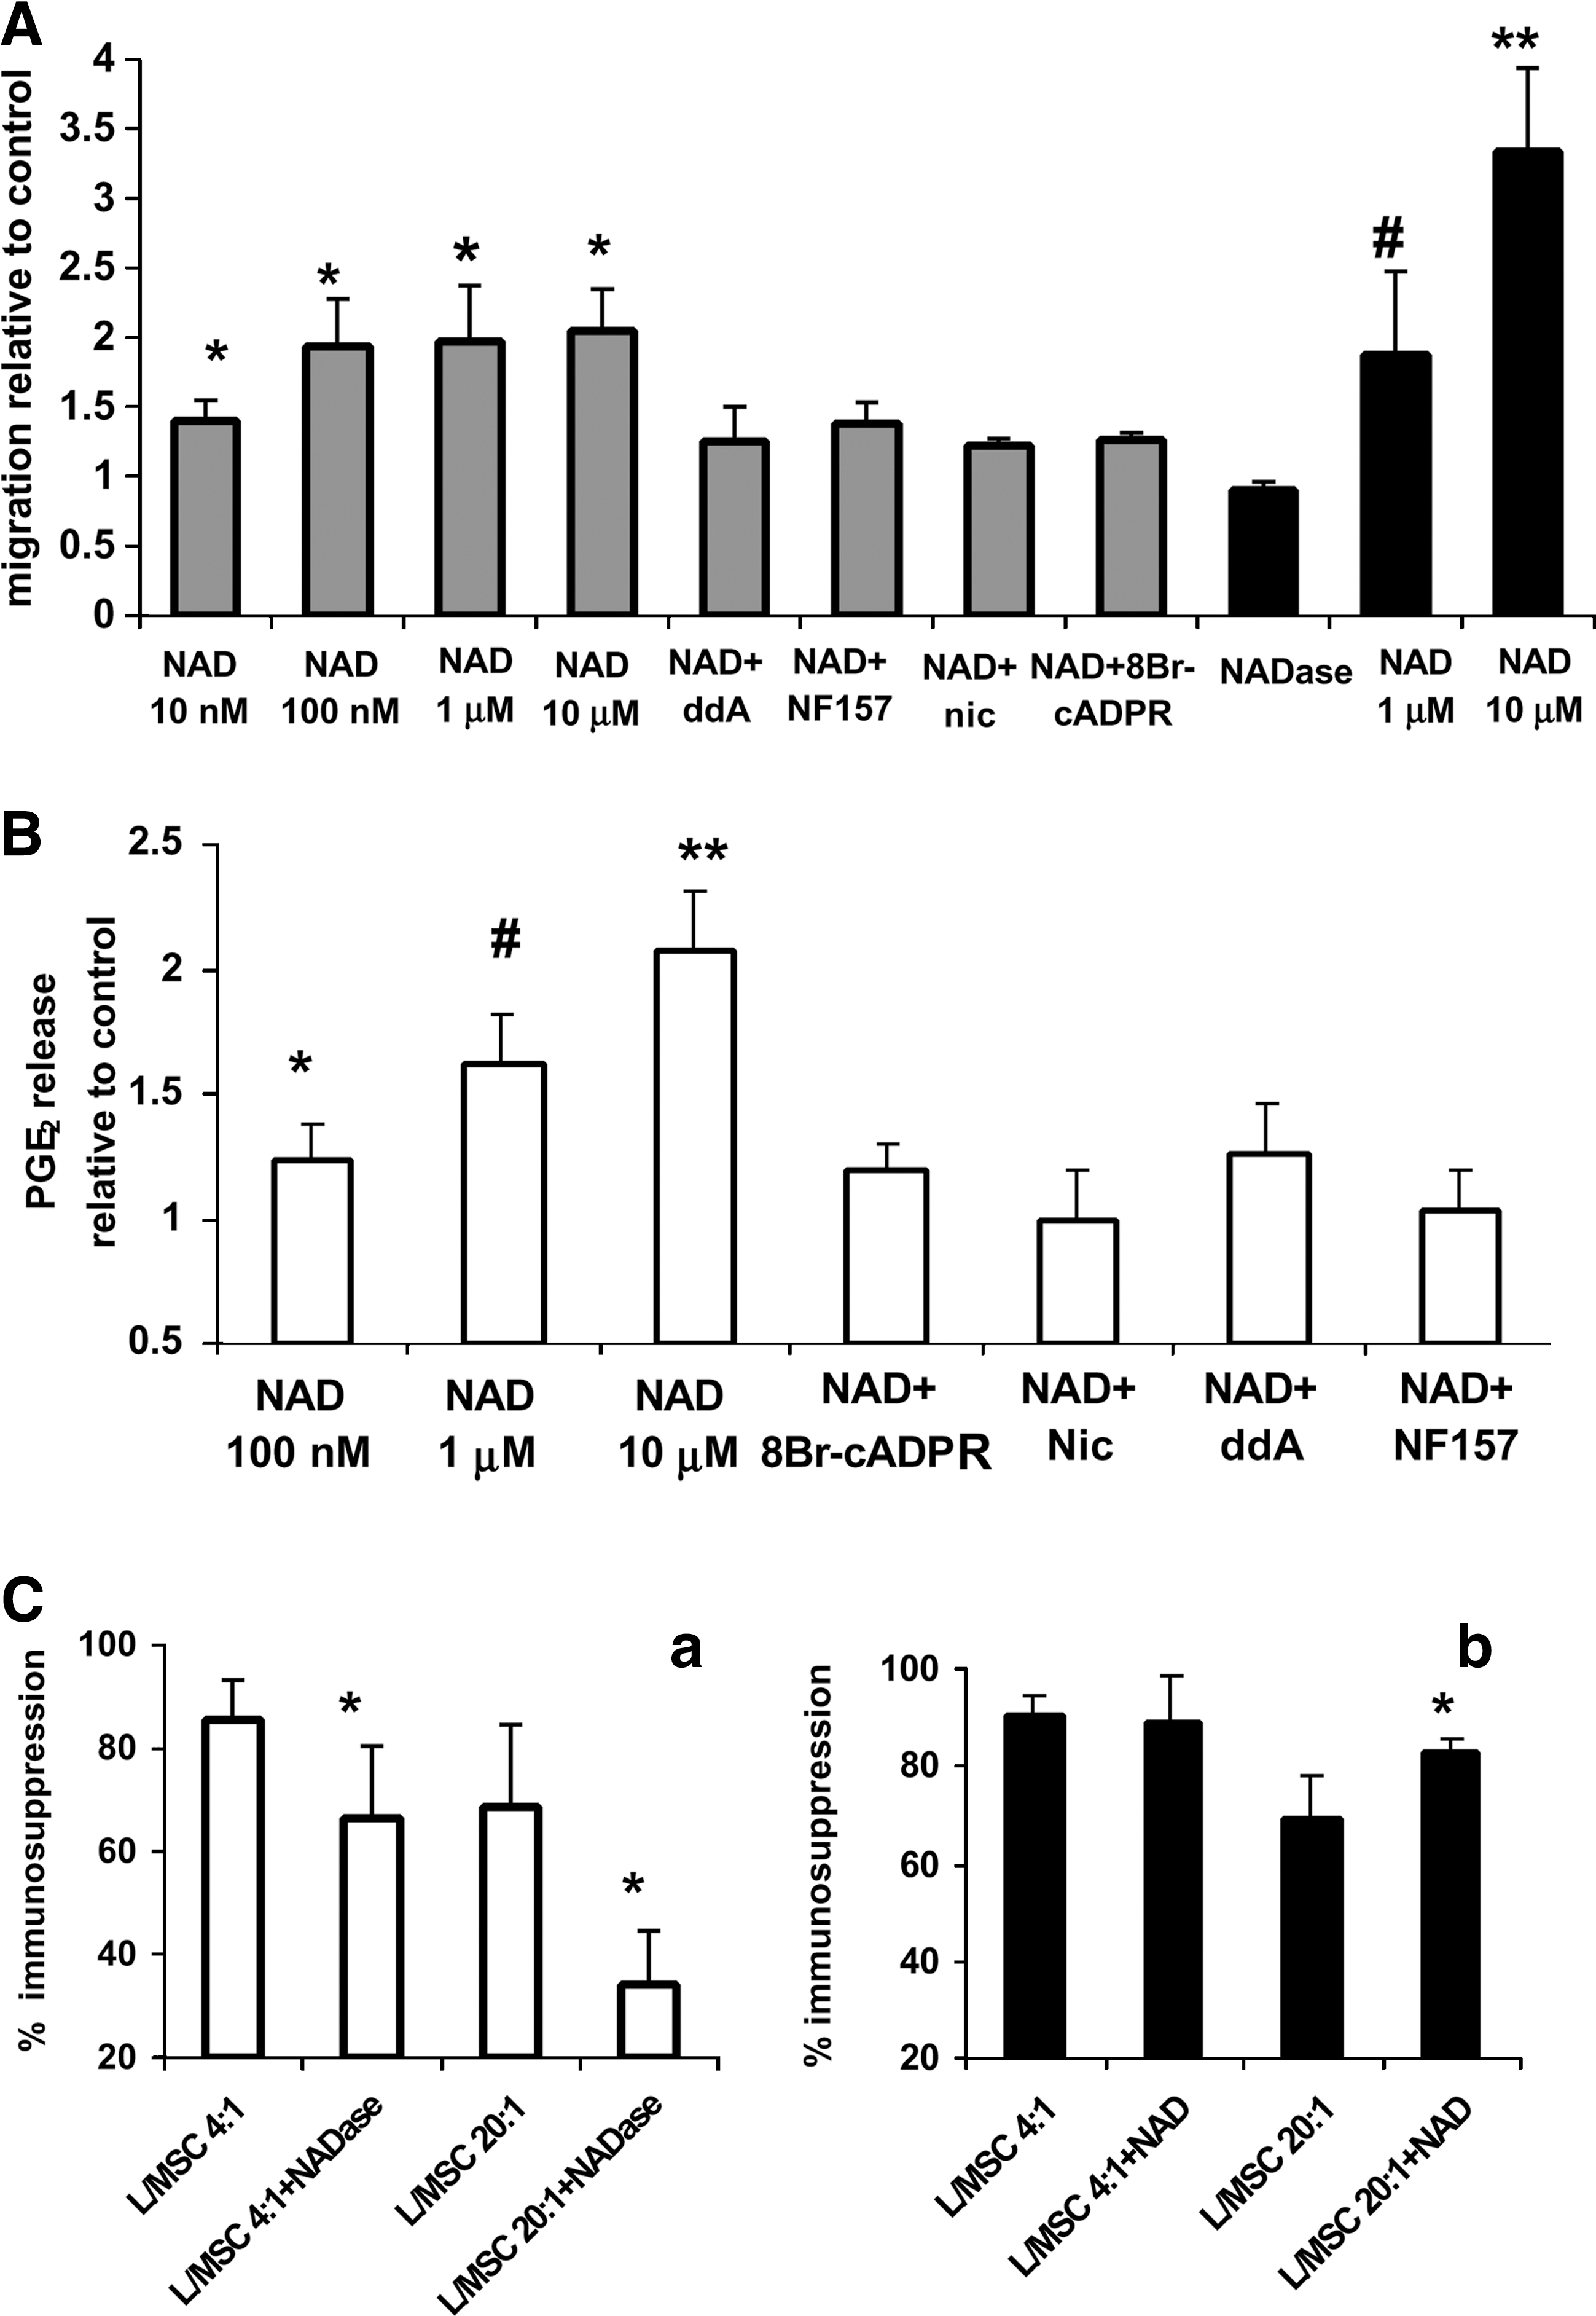
Cell migration, PGE2 production, and immunosuppression in NAD+-treated MSC.
Preincubation of cells with ddA, nicotinamide (an inhibitor of the ADPRC activity of CD38), 8-Br-cADPR, or NF157 strongly inhibited (by 82%, 70%, 80% and 60%, respectively, Fig. 6A) MSC chemotaxis toward 100 nM NAD+. These data indicate that engagement of P2Y11 by NAD+ e and the subsequent cAMP/cADPR/[Ca2+]i signaling cascade are involved in the chemotactic response of MSC to NAD+ e. Cell migration was also tested in the presence of the NAD+ metabolites ADPR, nicotinamide, and AMP (from 10 nM to 10 μM), none of which proved to affect cell migration as compared with untreated cells (not shown). Chemotactic and chemokinetic responses of MSC were also measured in the presence of increasing concentrations of ATP (100 nM to 10 μM). Indeed, ATP was effective in stimulating MSC chemotaxis as well as chemokinesis at concentrations from 1 to 10 μM as compared with control, ATP-untreated cells (chemotaxis: 1.8–2.1-fold increase, chemokinesis: 1.7–3.0-fold increase, respectively; Supplementary Fig. S2B). Conversely, preincubation of cells with apyrase removing extracellular, autocrinally released ATP did not modify significantly spontaneous cell migration.
Effect of NAD+ e on PGE2 and on cytokine release
MSC are known to produce and release PGE2 as well as several cytokines responsible for the trophic and immunomodulatory function of MSC in the BM [3]. PGE2 release was dose dependently enhanced in NAD+-treated MSC as compared with controls (Fig. 6B). Preincubation of cells with ddA, nicotinamide, 8-Br-cADPR, or NF157 strongly inhibited the NAD+-induced increase of PGE2 release (Fig. 6B), similarly to what observed on the NAD+-induced cell migration (Fig. 6A).
To investigate the effect of NAD+ e on cytokine release by MSC, the supernatants from MSC cultured for 24 h in the absence (control) or in the presence of 10 μM β−NAD+ were analyzed by a human cytokine array, detecting 42 inflammation- and proliferation-related cytokines (Table 3). NAD+ e stimulated the release of several interleukins with immunomodulatory and proliferative properties. Specifically, IL-5, IL-7, IL-8, IL-10, and IL-12 were all significantly increased (1.9-, 1.5-, 1.4-, 2.7-, and 2.0-fold respectively, as compared with control). NAD+ e also stimulated the release of several chemokines, including RANTES, MIG, GRO, and MDC (2.2-, 1.9-, 1.4-, and 3.5-fold increase relative to control, respectively). Finally, the hemopoietic growth factors Oncostatin M, GM-CSF, and Thrombopoietin were present at higher concentrations in the medium of NAD+-treated cells as compared with control (3.9-, 3.4-, and 1.9-fold increase, respectively).
MSC were incubated in the absence (control) or in the presence of 10 μM NAD+ for 24 h and cytokine release in the medium was analyzed with a human Cytokine Array.
MSC were incubated without (control) or with 10 μM NAD+ for 1 h. Nuclear extracts were analyzed with a cAMP/Ca2+ Protein/DNA Array.
A semiquantitative analysis of the positive spots detected on the membranes was performed. Results are expressed as mean ± standard deviation of 3 experiments.
Effect of NAD+ e on MSC immunomodulatory capacity
MSC were co-cultured with T cells activated with anti-CD3 or with anti-CD28 antibodies, in the presence or absence of NAD+ase or of NAD+, to investigate the involvement of NAD+ e in the immunomodulatory activity of MSC. As shown in Fig. 6C, panel a, presence of NAD+ase (10 mU/mL added daily for 96 h) significantly inhibited (by 17% and 34%) MSC-mediated immunomodulatory at both lymphocyte-to-MSC ratios investigated (4:1 and 20:1, respectively), compared with control cultures, without the enzyme. Conversely, addition of NAD+ (10 μM added daily for 96 h) significantly increased (by 10%) the immunomodulatory effect of MSC, though only at the lowest lymphocyte to MSC ratio (Fig. 6C, panel b). These results indicate that NAD+ e, either extracellularly added or autocrinally released by MSC, is able to inhibit T cell proliferation.
Activation of transcription factors in NAD+ e-stimulated MSC
Since NAD+ e induced an increase of the [cAMP]i and of the [Ca2+]i in MSC (Fig. 3A, C), and also stimulated the production of several cytokines (Table 3), the nuclear translocation of 20 cAMP/Ca2+-dependent transcription factors (TF) was investigated, using a transcription factor array. As shown in Table 3, several cAMP/Ca2+-dependent TF were indeed significantly increased in nuclear extracts from NAD+ e-treated MSC, as compared with untreated cells. In particular, NFAT and CREB showed the highest increase over controls (5.8- and 2-fold increase, respectively). Other TF consistently, though slightly, increased in NAD+-treated MSC were NF-E1, GATA-4, NF-κb, and Sp1 (the fold-increase relative to controls ranging from 1.3- to 1.7). Conversely, AP-1 and HSE showed a reduced nuclear translocation in NAD+ e-treated cells (∼40% decrease compared with controls).
Discussion
In the wide area of investigation on the roles of NAD+ and NAD+ metabolites in cell signaling, the metabolism and the functions of NAD+ e have been sparking increasing interest. This is also justified by recent attempts at providing exogenous NAD+ for targeted therapies in specific diseases characterized by abnormally low intracellular levels of NAD+, for example, brain injury and degeneration and cardiac hypertrophy [42].
Since human MSC have been reported to undergo cADPR-mediated expansion and stimulation of their trophic, immunomodulatory, and migration properties via an autocrine mechanism (8), the mechanisms of NAD+ release and its effects on MSC functions were addressed in this study.
Ca2+-regulated NAD+ release through Cx43 HC indeed occurs in MSC (Fig. 1), similarly to what previously found in other cell types [11 –13]. Cx43 HC on MSC were also confirmed to be responsible for efflux of ATP [14] as previously demonstrated for activated neutrophils as well [43]. In addition, NAD+ efflux from MSC proved to be upregulated by fluid flow and by inflammatory conditions, while being downregulated by cell confluence (Fig. 2). Modulation of NAD+ (and of ATP) release by physical or chemical stimuli further supports the view that extracellular levels of both nucleotides are dependent on equilibrative transport mechanisms, as those mediated by Cx43, rather than on leakage from dying cells.
We show here that NAD+ e can stimulate several physiological functions of MSC, and that these effects are mediated by its interaction with the P2Y11 purinergic receptor. Downstream of P2Y11 and NAD+ e activates a cAMP/cADPR/[Ca2+]i signaling cascade in MSC, similarly to what already reported in human granulocytes [18]. The low NAD+ e concentrations used in this study led to activation of the AC/cAMP branch of P2Y11 signaling (Fig. 3), while excluding the phospholipase C/IP3 one, which is activated in human granulocytes only at millimolar NAD+ e levels [18].
NAD+ e proved to induce a biphasic [Ca2+]i increase in MSC: an immediate, transient Ca2+ rise, followed by a sustained Ca2+ increase (Fig. 3A). The [Ca2+]i increase induced by NAD+ e in MSC occurs through the mechanisms summarized in Fig. 7. Activation of the P2Y11 receptor is followed by L-type Ca2+ channel opening, as demonstrated by the use of the pharmacological inhibitor nifedipine and by trasfection with the specific siRNA (Fig. 3E). Opening of these channels is caused by overproduction of cAMP, since ddA abrogates the NAD+-induced [Ca2+]i increase (Fig. 3E). The cAMP-mediated activation of L-type channels is partly due to cADPR-dependent intracellular Ca2+ release from RyR, since it is inhibited by 60% by 8-Br-cADPR or ryanodine (Fig. 3E), through a mechanism already described [41]. However, cAMP has also been reported to directly open L-type channels via PKA activation in different cell types [44–45]; this mechanism could help explain the NAD+-stimulated L-type-dependent Ca2+ i rise in MSC because inhibition of cAMP production abrogates the NAD+-evoked first Ca2+ rise, whereas the impairment of the cADPR signaling branch by 8-Br-cADPR only partially inhibits the rapid Ca2+ increase.
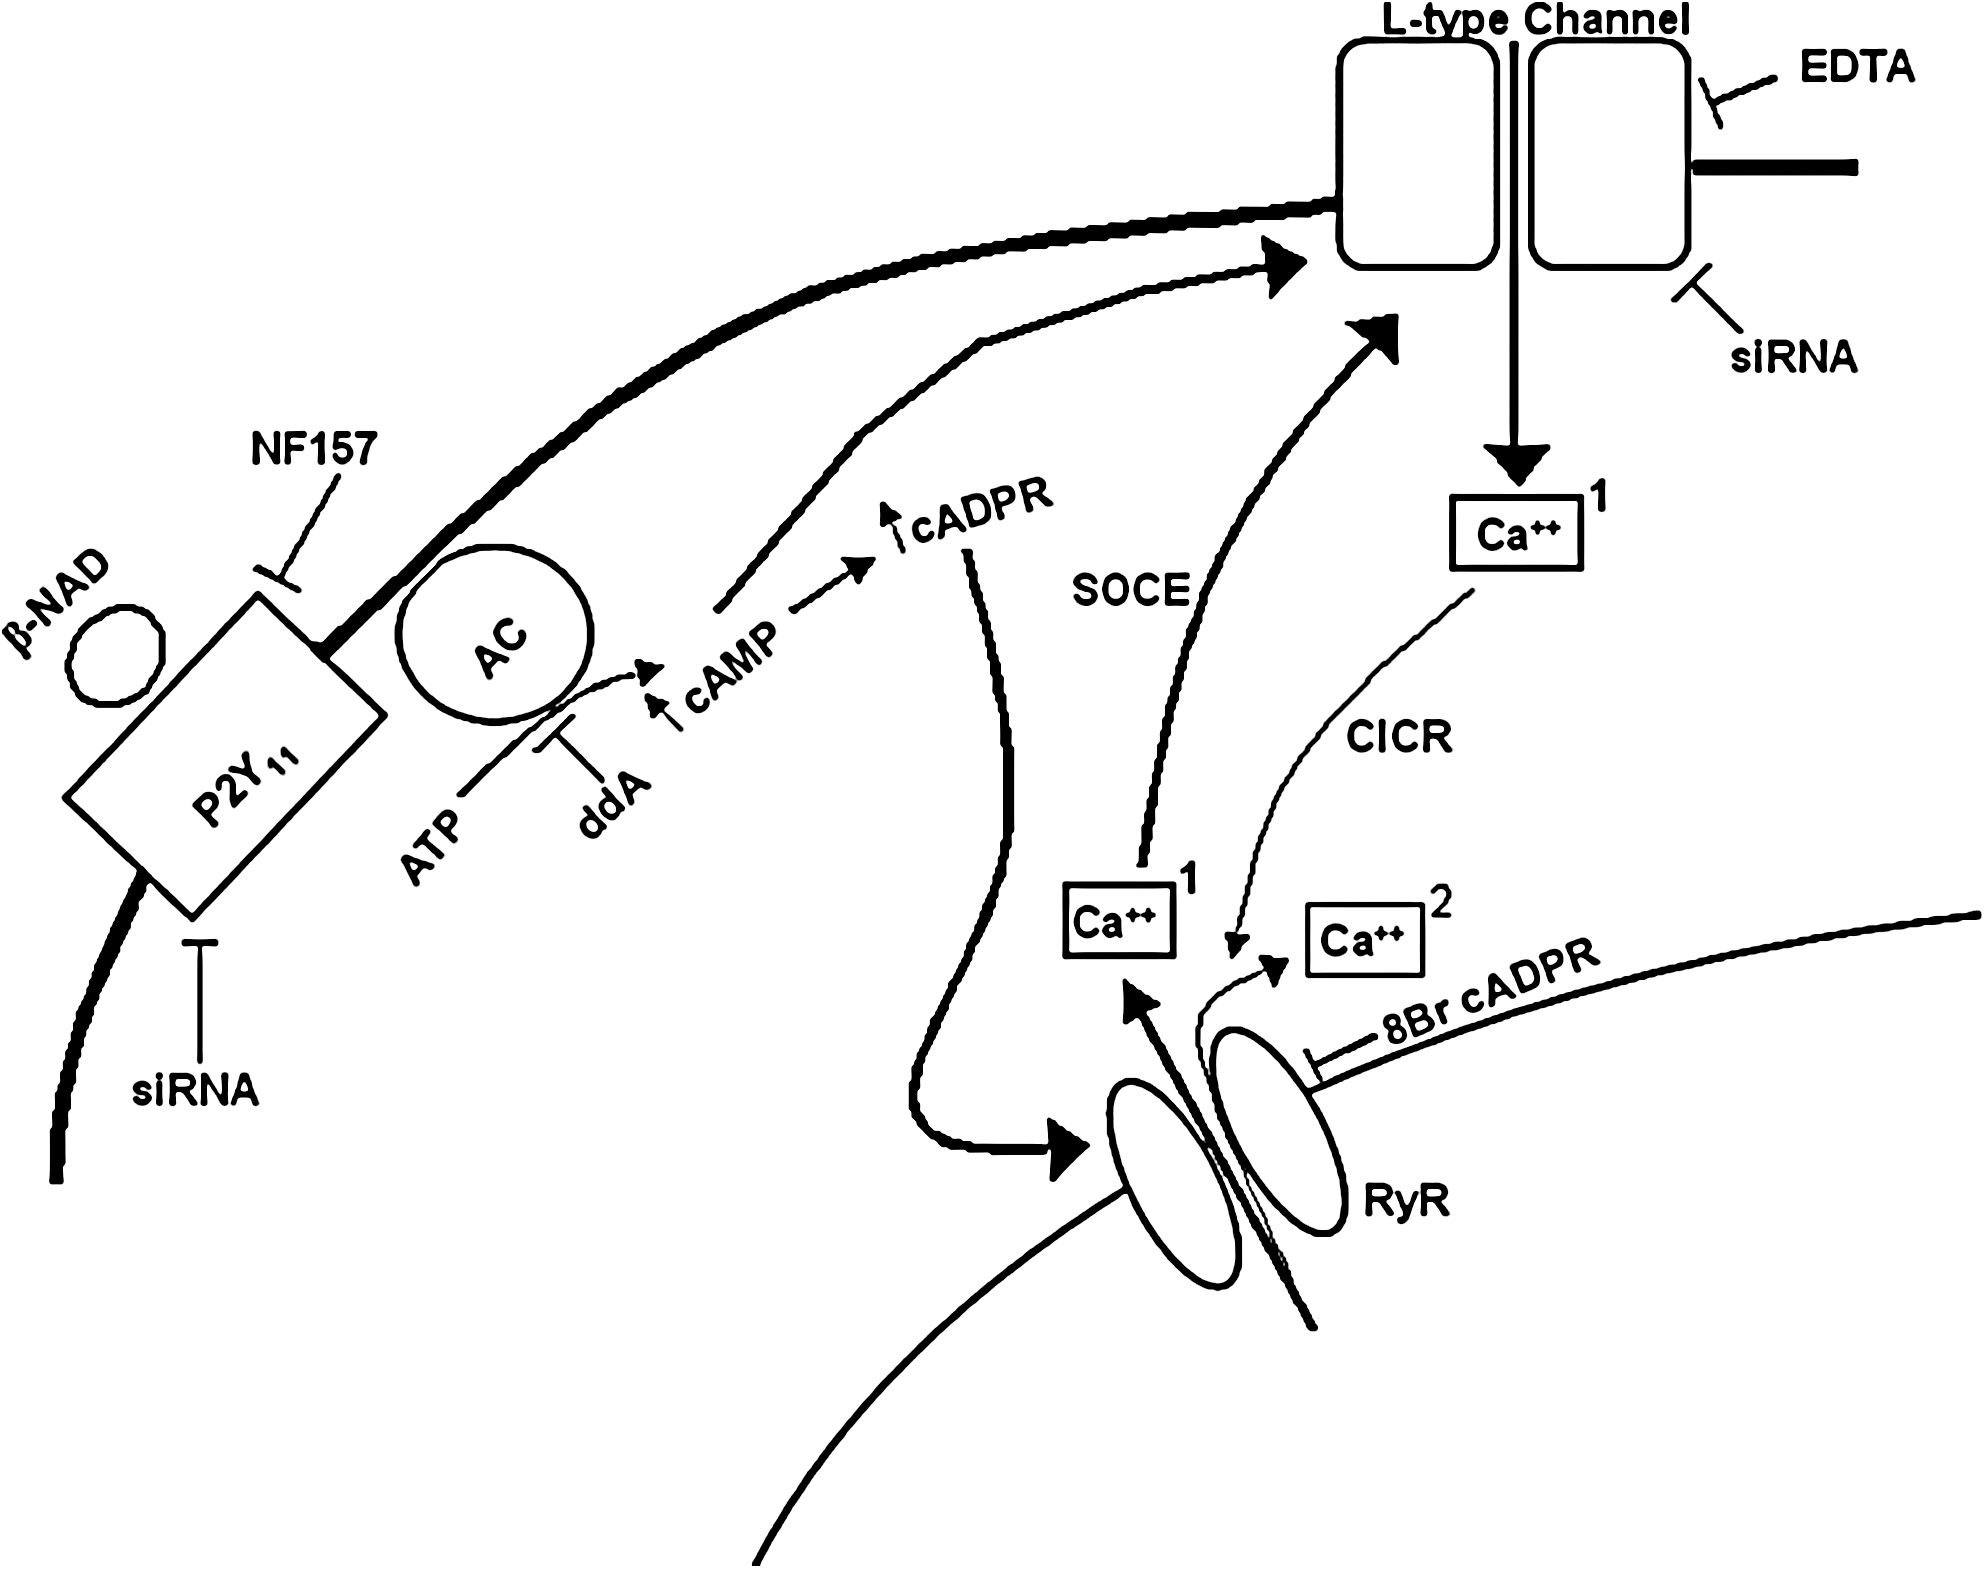
Schematic representation of NAD+ signaling in MSC. Extracellular NAD+ stimulates MSC functions through activation of P2Y11 receptor, increase of the [cAMP]i and consequent increase of the [cADPR]i. cAMP, (i) elicits PKA-mediated opening of L-type Ca2+ channels and (ii) cooperates with a cADPR-mediated SOCE mechanism to the opening of these channels, both effects resulting in a first Ca2+ influx (bold arrows, (Ca++)1). The Ca2+ influx in turn stimulates a further Ca2+ release from intracellular stores through a CICR mechanism, thus generating a second, sustained [Ca2+]i rise (thin arrows, (Ca++)2). siRNA, small interference RNA; AC, adenylate cyclase; SOCE, store-operated Ca2+ entry; CICR, calcium induced calcium release; RyR, ryanodine receptor.
Downstream of the Ca2+ i rise elicited by NAD+ e we observed the nuclear translocation of cAMP/Ca2+-dependent TF with proliferative, anti-apoptotic, and stemness-related properties, such as GATA-4, Sp1, and NF-κb [46 –48], and with pro-inflammatory activities, such as NFAT, CREB, and NF-κb [48 –50]. As a consequence, the NAD+ e-triggered cAMP/cADPR/[Ca2+]i signaling cascade, without affecting MSC phenotype (Table 2) or its differentiation capacity (Fig. 4), stimulated several responses in these cells: (i) proliferation (Fig. 5), (ii) migration (Fig. 6A), (iii) generation and release of PGE2 (Fig. 6B), and (iv) inhibition of T cell proliferation (Fig. 6C). The release of several cytokines, chemokines, and growth factors (Table 3) was also observed, the presence of which, in turn, is known to stimulate the paracrine functions of MSC, including (i) the support of hemopoiesis, through the secretion of growth factors essential to HSC proliferation and differentiation [3] and (ii) the immunomodulatory activity, through the production of PGE2 and of cytokines downregulating the immune response [51].
Remarkably, an autocrine function of NAD+ e, relevant to MSC physiology, was also demonstrated. Indeed, the presence of exogenously added NAD+ase determined a significant downregulation of several physiological activities of MSC (proliferation, Fig. 5; cell migration, Fig. 6A; immunomodulation, Fig. 6C). Further, NAD+ efflux from BM-derived stroma has already been demonstrated to be responsible for the ectocellular generation of cADPR by CD38 expressed on the HP: cADPR in turn acts as a hemopoietic growth factor, stimulating the expansion of both the committed and the uncommitted HP [11]. Taken together, these data indicate a role for NAD+ e in the BM environment as a paracrine signal stimulating the proliferation of HP and the immunomodulatory activity of MSC.
The concentration of NAD+ e in human plasma ranges between 10 and 50 nM [38] and is the result of opposite processes of dinucleotide release from cells and degradation by a variety of ectoenzyme activities [this study and ref. 43]. However, NAD+ e levels occurring in specific tissue districts may be several logs higher than those measured in plasma, particularly under conditions of inflammation [52–53]. NAD+ e could then stimulate MSC functions (migration, proliferation, and cytokine release) relevant to the physiologic functions of MSC and also to MSC-based cell therapy.
Footnotes
Acknowledgments
This work was supported by grants from Regione Liguria (CIPE Project, Stem Cells Area), from the Italian Ministry of Education, University and Scientific Research (MIUR PRIN 2005, MIUR FIRB RBAUO19A3C, MIUR FIRB RBNE01ERXR, MIUR FIRB RBLAD39LSF, MIUR FIRB RBIP06LSS2, and MIUR FIRB RBPR05RSM2), from the Italian Ministry of Health (RF-LIG-2007-647513), from the University of Genova, from Fondazione CARIGE, from Fondazione Compagnia di San Paolo, and from FISM (Progetto speciale Cellule Staminali). We thank Mrs. Maitè Vuscovich for the informatic support during the preparation of the article.
Author Disclosure Statement
The authors indicate no potential conflicts of interest.
References
Supplementary Material
Please find the following supplemental material available below.
For Open Access articles published under a Creative Commons License, all supplemental material carries the same license as the article it is associated with.
For non-Open Access articles published, all supplemental material carries a non-exclusive license, and permission requests for re-use of supplemental material or any part of supplemental material shall be sent directly to the copyright owner as specified in the copyright notice associated with the article.