
Abstract
We describe a novel role for CD271 in the differentiation of mesenchymal stem cells (MSCs), including deciduous dental pulp stem cells (DDPSCs) and murine multipotent MSCs (C3H10T1/2 cells). The CD271+ subpopulation of deciduous dental pulp cells (CD271+/DDPSCs) and the forced expression of CD271 in C3H10T1/2 (10T271) were analyzed by fluorescence-activated cell sorting. CD271 expression was detected in DDPSCs that expressed both CD44 and CD90, simultaneously, and the clonogenic capacity of the CD271+/DDPSCs was higher than that of the CD271−/DDPSCs that expressed both CD44 and CD90. Further, the differentiation of CD271+/DDPSCs into osteoblasts and adipocytes was inhibited although CD271−/DDPSCs were capable of differentiating into osteoblasts and adipocytes. CD271 was overexpressed in C3H10T1/2 cells, which have the potential to differentiate into osteoblasts, adipocytes, chondrocytes, and myocytes. CD271 inhibited the differentiation of C3H10T1/2 cells into any of these lineages. These results indicate a role for CD271 in inhibiting the differentiation of MSCs.
Introduction
T
The accurate identification of stem cells in vivo remains a major obstacle to understanding the mechanism of differentiation. Gene expression markers that distinguish stem cells based on a unique underlying process are urgently required. However, stem cell-specific molecular markers have not been identified in most tissues, with the exception of hematopoietic stem cells. Multipotent mesenchymal stem cells (MSCs) have been identified in many adult mesenchymal tissues, such as bone marrow, adipose tissue, and dental pulp. Several MSC markers have been identified that can be used for the isolation of MSCs. MSCs express a suite of key markers, including CD29 (β1-integrin), CD44 (H-CAM), CD73 (ecto-5′-nucleotidase; SH3, SH4) [23], CD90 (Thy-1), CD105 (endoglin; SH2) [24], and STRO-1 [25]. In contrast to hematopoietic stem cells, MSCs are negative for CD45 and CD133, which are markers that can be used to enrich for the MSC population. Recently, CD271 (NGFR) was described as the optimal selective marker for the purification and phenotypic characterization of bone marrow-derived MSCs (BMMSCs) [26 –29]. CD271 is also a useful marker for the isolation of adipose tissue-derived stem cells in mice [30]. However, the molecular functions of CD271 in MSCs are not understood.
Multipotent MSCs are found in human deciduous teeth. MSCs derived from the remnant dental pulp have been identified as being highly proliferative, clonogenic cells that are capable of differentiating into a variety of cell types, including neural cells, adipocytes, and odontoblasts [31]. Dental pulp cells maintain the homeostasis of mineralized dental tissues. Most pulp cells are in the postmitotic stage, although some of the cells continue to divide and give rise to new pulp cells, and are able to differentiate into odontoblasts and to form new dentin [32]. To date, only a few markers, that is, STRO-1, c-kit, and CD34, have been used for the isolation of dental pulp stem cells from human deciduous dental pulp tissues [31,33,34]. These expression profiles are commonly found among MSC populations. In contrast to BMMSCs, there is little information on the molecular functions, for example, surface markers, of deciduous dental pulp stem cells (DDPSCs). In particular, there have been no reports regarding the expression of CD271 in DDPSCs.
In the present study, we attempted to define CD271 expression in deciduous dental pulp cells and to elucidate the functions of CD271 in MSCs. We show that the cells that migrate from the deciduous dental pulp tissues exhibit surface expression of CD271, and that the CD271+/CD90+/CD44+/CD45− cell population inhibits osteogenic and adipogenic differentiation in vitro. Using an overexpression experimental model and the murine MSC line C3H10T1/2, we also examined whether CD271 directly or indirectly suppresses differentiation. C3H10T1/2 cells are used widely to investigate modulation of lineage determination, for example, the ability to differentiate into osteogenic, adipogenic, chondrogenic, and myogenic cells [35], and they do not express CD271. The function of the CD271 was determined by assessing the responses to various differentiation conditions in terms of differentiation into multipotent cell types. Consistent with the finding for DDPSCs, the overexpression of CD271 in C310T1/2 cells prevented adipogenic, osteogenic, chondrogenic, and myogenic differentiation. Taken together, the present findings demonstrate that CD271 acts as a key regulator of the maintenance of the undifferentiated status of MSCs by contributing to multiple differentiation.
Materials and Methods
This study was approved by the Ethics Committee of Nihon University School of Dentistry.
Preparation of deciduous dental pulp cells
Dental pulp samples were harvested from the deciduous teeth of 3 healthy donors (age range, 7 to 10 years) at the Nihon University Dental Hospital, with informed consent from the donors. The surfaces of the teeth were first cleaned with phosphate-buffered saline (PBS), and a groove of 0.5–1.0 mm in depth was cut around the circumference of each tooth using a sterile, hand-held, high-speed drill. The dental pulp was exposed by splitting the tooth with a chisel along the groove. The pulp tissue from the tooth crown was then extracted using an endodontic file. After digestion with collagenase type I (2 mg/mL; Wako) for 5 min at 37°C, the extracted pulp tissues were cultured at 37°C in 5% CO2 in α-modified Eagle's medium (Invitrogen, Life Technologies) that contained 20% fetal bovine serum (FBS; Japan Bioserum) and 2% (v/v) penicillin–streptomycin solution (100 U/mL penicillin and 100 mg/mL streptomycin). The medium was exchanged every 2 days, and optimal cell harvesting was at 80% confluence.
Multipotent C3H10T1/2 cells were obtained from the Riken Cell Bank. The cells were maintained in Dulbecco's modified Eagle's medium (DMEM; Invitrogen) that contained 10% (v/v) FBS and 1% (v/v) penicillin–streptomycin solution (50 U/mL penicillin and 50 mg/mL streptomycin). The cells were grown at 37°C in a humidified atmosphere of 95% air and 5% CO2.
Forced expression of CD271
C3H10T1/2 cells were seeded at a density of 5 × 10⁵ cells/well in a 6-well plate, and allowed to grow under normal culture conditions for 18 h. Subsequently, the cells were incubated in 2 mL of DMEM that contained 6.25 μL Lipofectamine LTX (Invitrogen) together with 2 μg of the CD271 expression vector (FCC117C02; Toyobo) and 0.5 μg of the selection vector pcDNA3.1 (linearized by digestion with ApalI and KpnI), which expresses the neomycin resistance gene, or with linearized pcDNA3.1 alone as a control (10TMk cells). After transfection, cells with stable DNA integration were selected by culturing with 2 mg/mL G418 (Sigma Chemical Company). Cells that expressed CD271 (10T271 cells) were confirmed by fluorescence-activated cell sorting (FACS) analysis (BD Immunocytometry System) with the PE-conjugated human CD271 antibody.
Staining of cells for FACS
Standard flow cytometry (FCM) techniques were used to assay for typical cell surface markers, including CD10, CD14, CD29, CD34, CD44, CD45, CD73, CD90, and CD271. In brief, adherent dental pulp cells at first passage were harvested by trypsinization and rinsing twice with PBS, followed by incubation for 30 min on ice with 1% mouse bovine serum albumin (BSA) in PBS. The cells were the incubated on ice for 30 min with the following primary antibodies (all from BD Biosciences): PE-conjugated anti-CD10; FITC-conjugated anti-CD29 (integrin-β1); APC-conjugated anti-CD34; FITC-conjugated anti-CD44; Alexa Fluor-conjugated anti-CD45; PE-conjugated anti-CD73; APC-conjugated anti-CD90 (Thy-1); APC-conjugated anti-CD133-1 (Prominin-1, AC133); and PE-conjugated anti-CD271 (NGFR, p75NTR). After antibody staining, the cells were washed with PBS, and then resuspended in buffer solution for FACS analysis. Dead cells, which were identified by staining with propidium iodide (1 μg/mL; Sigma) before the FACS analysis, were excluded from the surface epitope analysis. The BD FACS Aria (BD Immunocytometry System) was used for all multicolor FACS analyses and cell sorting. FCM standard data were analyzed using the FlowJo software (Treestar).
Cell sorting
The extracted pulp tissues were cultured for 6 days, and then cells derived from the pulp tissues (DDPSCs at first passage) were sorted using multicolor FACS. C3H10T1/2 cells were also sorted by FACS. CD44-, CD90-, and CD271-co-expressing DDPSCs (CD271+/DDPSCs) and DDPSCs that were double-positive for CD44 and CD90, but not for CD271 (CD271−/DDPSCs), were isolated from subcultured deciduous dental pulp cells by FACS. Cells that expressed CD271 (10T271 cells) and CD271-negative cells (10TMk cells) were selected from the CD271 expression vector-transfected cell cultures by FACS with the PE-conjugated anti-human CD271 antibody.
In vitro colony-forming fibroblast unit assay
The colony-forming fibroblast unit (CFU-F) assay was performed by plating the cells (5 × 10² per well) into a 6-well plate. The number of colonies in the 6-well plate was determined after 14 days of culture. A CFU-F is defined as a colony that contains >50 cells within each well. CFU-F colonies were macroscopically scored. Further, single-cell sorting was performed in one well of a 96-well plate using FACS. The wells that contained growing cells were counted in the 96-well plates after 14 days of subculture.
Cell proliferation
Subcultured cells were seeded into 12-well plates for the DDPSCs (500 cells/well) or 100-mm culture dishes for the C3H10T1/2 cells (10T271 and 10TMk; 1 × 10⁴ cells/dish), and cultured for the indicated periods in the growth medium. The cells were harvested by trypsinization and resuspended in the growth medium, and the cells were counted using a microscope counting chamber (hemocytometer).
Percentages of cells at metaphase or anaphase
DDPSCs (CD271+/DDPSCs and CD271−/DDPSCs) and C3H10T1/2 cells (10T271 and 10TMk) cells were seeded at a concentration of 1 × 10⁴ cells/dish in 10-mm culture dishes and cultured for 4 days in the growth medium. Thereafter, the cells were fixed with 4% paraformaldehyde for 15 min, washed with PBS, and then incubated with 4,6-diamidino-2-phenylindole (DAPI) (1 μg/mL) for 5 min. After washing with PBS, random cells were counted until 3000 cells had been reached, and the cell nuclear morphologies were assessed under fluorescence microscopy, so as to calculate the percentages of cells at metaphase and anaphase.
Immunofluorescence staining
The 10T271 cells were fixed in 4% paraformaldehyde in PBS for 15 min at room temperature, permeabilized in 0.5% NP-40 in PBS for 15 min at room temperature, rinsed 3 times with 0.5% BSA in PBS, and incubated for 1 h at 37°C with the PE-conjugated anti-CD271 antibody (BD). The cells were then washed with PBS, and the chromosomes and nuclei were counterstained with DAPI. The cells were observed by fluorescence microscopy.
Cell cycle analysis
Cells were grown to 80% confluence in 100-mm tissue culture dishes in the growth medium. After culture, cell cycle analysis was performed using the Click-iT™ EdU Flow Cytometry Assay Kit (Invitrogen) according to the manufacturer's instructions. In brief, cultured cells were treated with 10 μM 5-ethynyl-2′-deoxyuridine (EdU) for 1 h. EdU is a nucleoside analog of thymidine and is incorporated into DNA during active DNA synthesis. EdU-incorporated cells were fixed with paraformaldehyde for 15 min, washed once with BSA/PBS buffer, and permeabilized with a saponin-based buffer for 30 min. Cells were then washed once, treated with the click–reaction mixture containing Alexa Fluor 488 azide for 30 min, washed once, and then resuspended in PBS buffer. Next, to measure DNA content, cells were stained with CellCycle 488-red in 1% BSA/PBS for 30 min. After staining, cells were washed twice with PBS and then cell cycle analysis was performed using an EPICS XL flow cytometer (Beckman Coulter).
Differentiation assay
A differentiation assay for both DDPSCs and C3H10T1/2 cells was performed as described previously [30,36,37]. For differentiation of DDPSCs, we cultured FACS sorted DDPCs (CD271+/DDPSCs and CD271−/DDPSCs) for the indicated periods of time in either adipocyte differentiation medium (PT-8000; Lonza) or osteoblast differentiation medium consisting of 10% FBS, 50 μg/mL L-ascorbate phosphate (Sigma), 10 mM β-glycerophosphate (Sigma), and 100 ng/mL human recombinant bone morphogenetic protein (hrBMP-2; R&D Systems). Expanded DDPSCs were seeded at 1 × 10⁴ cells/cm2 in a 6-well plate and cultured for 11 days in the growth medium until confluence was achieved. The growth medium was subsequently replaced with a specific medium that promotes either adipogenic or osteogenic differentiation. Confluently growing DDPSCs were cultured in adipocyte differentiation medium for 21 days or in osteogenic differentiation medium for 14 days. In each case, the culture medium was replaced every 3 days.
The 10T271 and 10TMk cells were precultured to confluence in DMEM that contained 10% FBS, 100 U/mL penicillin, and 100 μg/mL streptomycin. Subsequently, the cells were cultured for the indicated periods of time in each induction medium. The osteogenic induction medium contained 10% FBS, 50 μg/mL L-ascorbate phosphate (Sigma), 10 mM β-glycerophosphate (Sigma), and 100 ng/mL hrBMP-2 (R&D Systems). The adipogenic induction medim contained indomethacin, IBMX, insulin, dexamethasone, GA-1000, MCGS, and L-glutamine (Lonza). The chondrogenic induction medium contained 1% FBS, 10 μg/mL human insulin (Sigma), 3 × 10⁻⁸ M sodium selenite (Sigma), 10 μg/mL human transferrin (Sigma), 10−8 M dexamethasone, and 100 ng/mL rhBMP-2. The myogenic induction medium contained 10% FBS and 10 mM 5-azacitidine (Sigma). The myogenic maintenance medium contained 2% FBS and 10−8 M dexamethasone. Each culture medium was changed every 2 days (for the cell counting assay) or 3 days (for the other assays).
Analysis of mRNA expression
Real-time reverse transcriptase–polymerase chain reaction (RT-PCR) was performed as described previously [38]. In brief, total RNA was isolated by using RNAiso plus (Takara Bio) according to the manufacturer's instructions. First-stranded cDNA was synthesized from 1 μg of total RNA in 20 μL of a solution containing 1 × first-strand buffer, 50 ng random primers, 10 mM dNTP mixture, 1 mM DTT, and 0.5 units SuperScript III RNase H− reverse transcriptase (Invitrogen) at 50°C for 1 h. The cDNA was then diluted 5-fold in sterile distilled water and a 2 μL aliquot of the diluted cDNA was subjected to real-time RT-PCR using SYBR Green I dye (Takara Bio). Real-time RT-PCR was performed in a 25 μL solution containing 1 × PCR buffer, 1.5 mM dNTP mixture, 1 × SYBR Green I, 15 mM Mg2+ solution, 0.25 units Ex Taq R-PCR (Takara Bio), and 20 μM primers (sense and anti-sense). Assays were performed on a Smart Cycler (Cepheid) and analyzed with the accompanying Smart Cycler software (Ver. 1.2 d). The cycling conditions were 40 cycles of 95°C for 3 s and 68°C for 20 s, and measurements commenced at the end of the annealing step (68°C). The primer sets used for real-time RT-PCR were described in Supplementary Table S1 (Supplementary Data are available online at
Cytochemical analyses
The cultures were washed twice with PBS, fixed with 4% paraformaldehyde in 0.1 M cacodylate buffer (pH 7.2) for 15 min, washed twice with buffer, and stained with Oil Red O or alkaline phosphatase (ALP) staining solution (pH 9.5) (NBT/BCIP Ready-to-Use Tablets; Roche Diagnostics). The cultures were washed, and examined under a light microscope or using an EPSON scanner (GT-X800 model). For Alcian blue staining, the cultures were fixed in 95% methanol and stained overnight with 0.1% Alcian blue 8GS (Wako) in 0.1 M HCl. To test for desmin, the cells were fixed for 15 min with 4% formaldehyde at room temperature. To remove endogenous peroxidase, the fixed cells were incubated with 1% H2O2 in PBS for 30 min. After this incubation, the cells were incubated for 1 h with anti-desmin antibody (ab152001; Abcam) diluted in PBS. After incubation with the primary antibody, the cells were washed with PBS, and then incubated for 1 h with the biotinylated secondary antibody (Zymed Laboratories) diluted in PBS. The cultures were incubated with peroxidase-conjugated streptavidin (Zymed Laboratories) for 20 min. For the observation of immunoreactive proteins, the cells were incubated with diaminobenzidine in PBS that contained 0.01% H2O2 until optimal staining was achieved. The cells were washed in cold running water for 10 min, and then examined by light microscopy.
Ca2+ release assay
Cells were cultured in 12-well plates under the indicated conditions. After removal of the supernatant, the cells were washed with 10 mM Tris–HCl (pH 7.2), and 1 N HCl was added to each well, followed by incubation until the cells were dry. Distilled water (20 μL) was then added to each well, and the amount of Ca2+ was determined using the Calcium E-test (Wako) according to the manufacturer's instructions.
Statistical analysis
The results are presented as the mean ± standard deviation of triplicate cultures. Differences were assessed using the Student's t-test. Statistically significant differences (P < 0.05) are indicated in the figures.
Results
Immunophenotyping of deciduous dental pulp-derived cells
The phenotypes of the expanded deciduous dental pulp cells were determined by FCM with antibodies against specific MSC and hematopoietic markers. These cells were positive for CD10, CD34, CD44, CD73, CD90, and CD271, which, when present simultaneously, are markers specific for MSCs. By comparison, these cells were negative for CD14, CD29, and CD45, which are markers specific for hematopoietic cell lineages, thus indicating that these cells were a nonhematopoietic lineage (Fig. 1A). The mean percentage of triple-positive cells (CD271+/CD90+/CD44+) in the total deciduous dental pulp cell population was 2.4% (range, 1.42% to 4.51%) (Fig. 1B).

Fluorescence-activated cell sorting analysis of DDPSCs.
Next, we FACS sorted the CD44+/CD90+/CD271+ (CD271+/DDPSCs) and CD44+CD90+CD271− (CD271−/DDPSCs) subpopulations from the deciduous dental pulp for use in subsequent experiments. Both the positive and negative cell fractions had fibroblast-like morphology as determined by light microscopy analysis until they reached confluence (Fig. 2A). To confirm the CD271 expression observed by FACS analysis, we analyzed the mRNA expression levels by real-time RT-PCR. The CD271 mRNA expression level in CD271+/DDPSCs was ∼40-fold higher than that in the CD271−/DDPSCs (Fig. 2B).

Isolation of CD271+/DDPSCs and CD271−/DDPSCs.
Clonogenic capacity of DDPSCs
To determine the clonogenic potential of the DDPSCs, cells were sorted into CD271+/DDPSCs and CD271−/DDPSCs subsets by FACS. The CD271+/DDPSCs gave rise to 2-fold higher CFU-F values than did the CD271−/DDPSCs.
Further, the clonogenic capacities of individual CD271+/DDPSCs and CD271−/DDPSCs were determined by sorting single cells into 96-well culture plates and culturing them in the growth medium until macroscopically visible colonies appeared. The cloning efficiencies of the sorted CD271+DDPSCs and CD271−/DDPSCs were 23/192 ± 2.4 and 11/192 ± 2.8, respectively.
Proliferation of CD271+/DDPSCs and CD271−/DDPSCs
To investigate the proliferation capacity of CD271+/DDPSCs and CD271−/DDPSCs, the cells were subcultured for the indicated number of days in growth media and the cell numbers were then estimated. The numbers of CD271+/DDPSC cells increased more rapidly from day 6 to 14 than did the number of CD271−/DDPSC cells (Fig. 3A). It took 14 days for the CD271+/DDPSC cultures to reach confluency (Fig. 3A). However, an additional 6 days of culture (a total of 20 days) were needed for the CD271−/DDPSC cultures to reach confluency (Fig. 3A). Further, we observed a morphologic difference between the CD271+/DDPSC and CD271−/DDPSC cultures once they had reached confluency. Most of the CD271+/DDPSC cells appeared to have directivity in their configuration (Fig. 3B), whereas directivity was not observed for the CD271−/DDPSC cells (Fig. 3B). We also examined cell cycle progression. Cells in the logarithmic growth phase were stained with DAPI, and the percentages of cells in metaphase and anaphase were calculated. The percentages of cells in metaphase and anaphase were higher in the CD271+/DDPSC cultures than in the CD271−/DDPSC cultures (Fig. 3C).
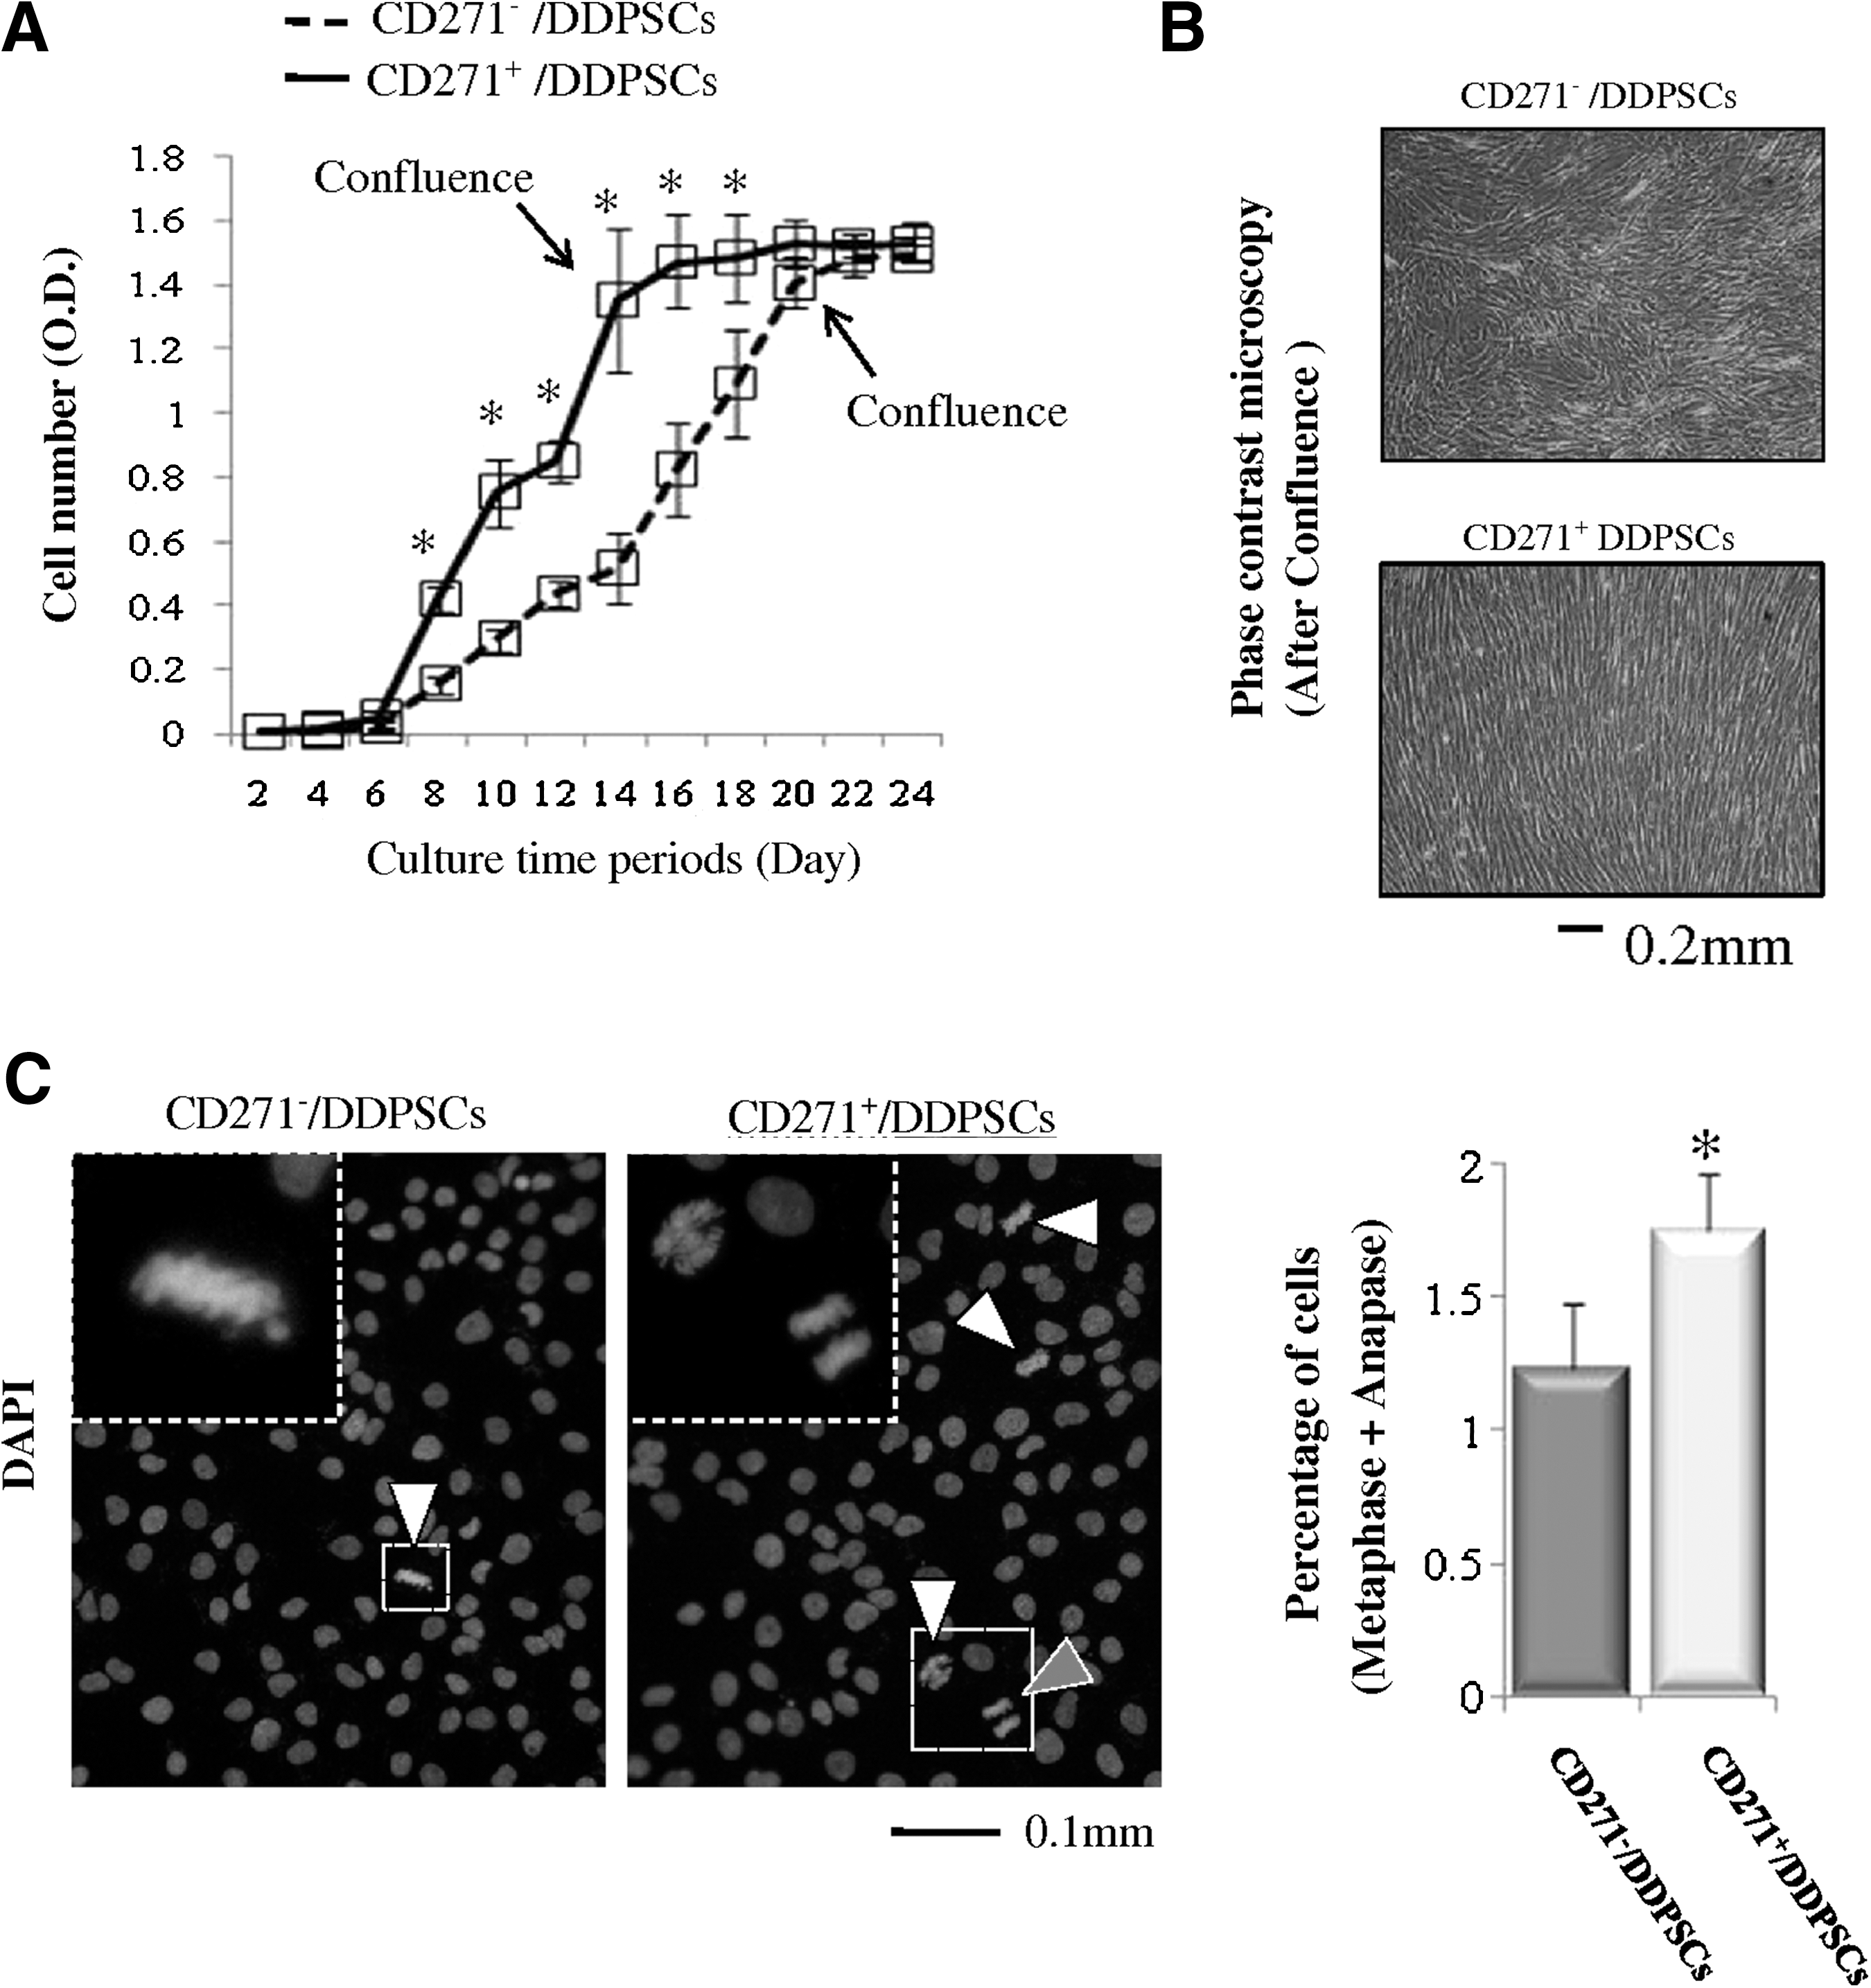
Proliferation rates of CD271+/DDPSCs and CD271−/DDPSCs.
Multipotent differentiation potentials of the CD271+/DDPSCs and CD271−/DDPSCs
To determine whether the CD271+/DDPSCs and CD271−/DDPSCs could differentiate into cells of the mesenchymal lineage using selective culture media, we first examined the potential of these cells to differentiate into osteoblast- and adipocyte-like cells. First, we examined whether the CD271+/DDPSCs and CD271−/DDPSCs were capable of differentiating into the osteogenic lineage. Culturing of CD271−/DDPSCs in osteogenic differentiation medium resulted in the predominance of ALP-positive cells (Fig. 4A). In contrast, the CD271+/DDPSC cultures contained few ALP-positive cells. Similarly, the Ca2+ levels were lower in the CD271+/DDPSC cultures than in the CD271−/DDPSC cultures (Fig. 4B). Real-time RT-PCR analysis of osteogenic/odontogenic marker expression showed downregulation of bone sialoprotein (BSP) expression in the CD271+/DDPSCs when compared with the expression in CD271−/DDPSCs (Fig. 4C). However, no differences in the expression levels of Runx2, osterix (OSX), osteocalcin, and nestin were noted between the CD271+/DDPSCs and CD271−/DDPSCs (Fig. 4C). DMP-1 and DSPP expression were not detected in either cell type (Fig. 4C).
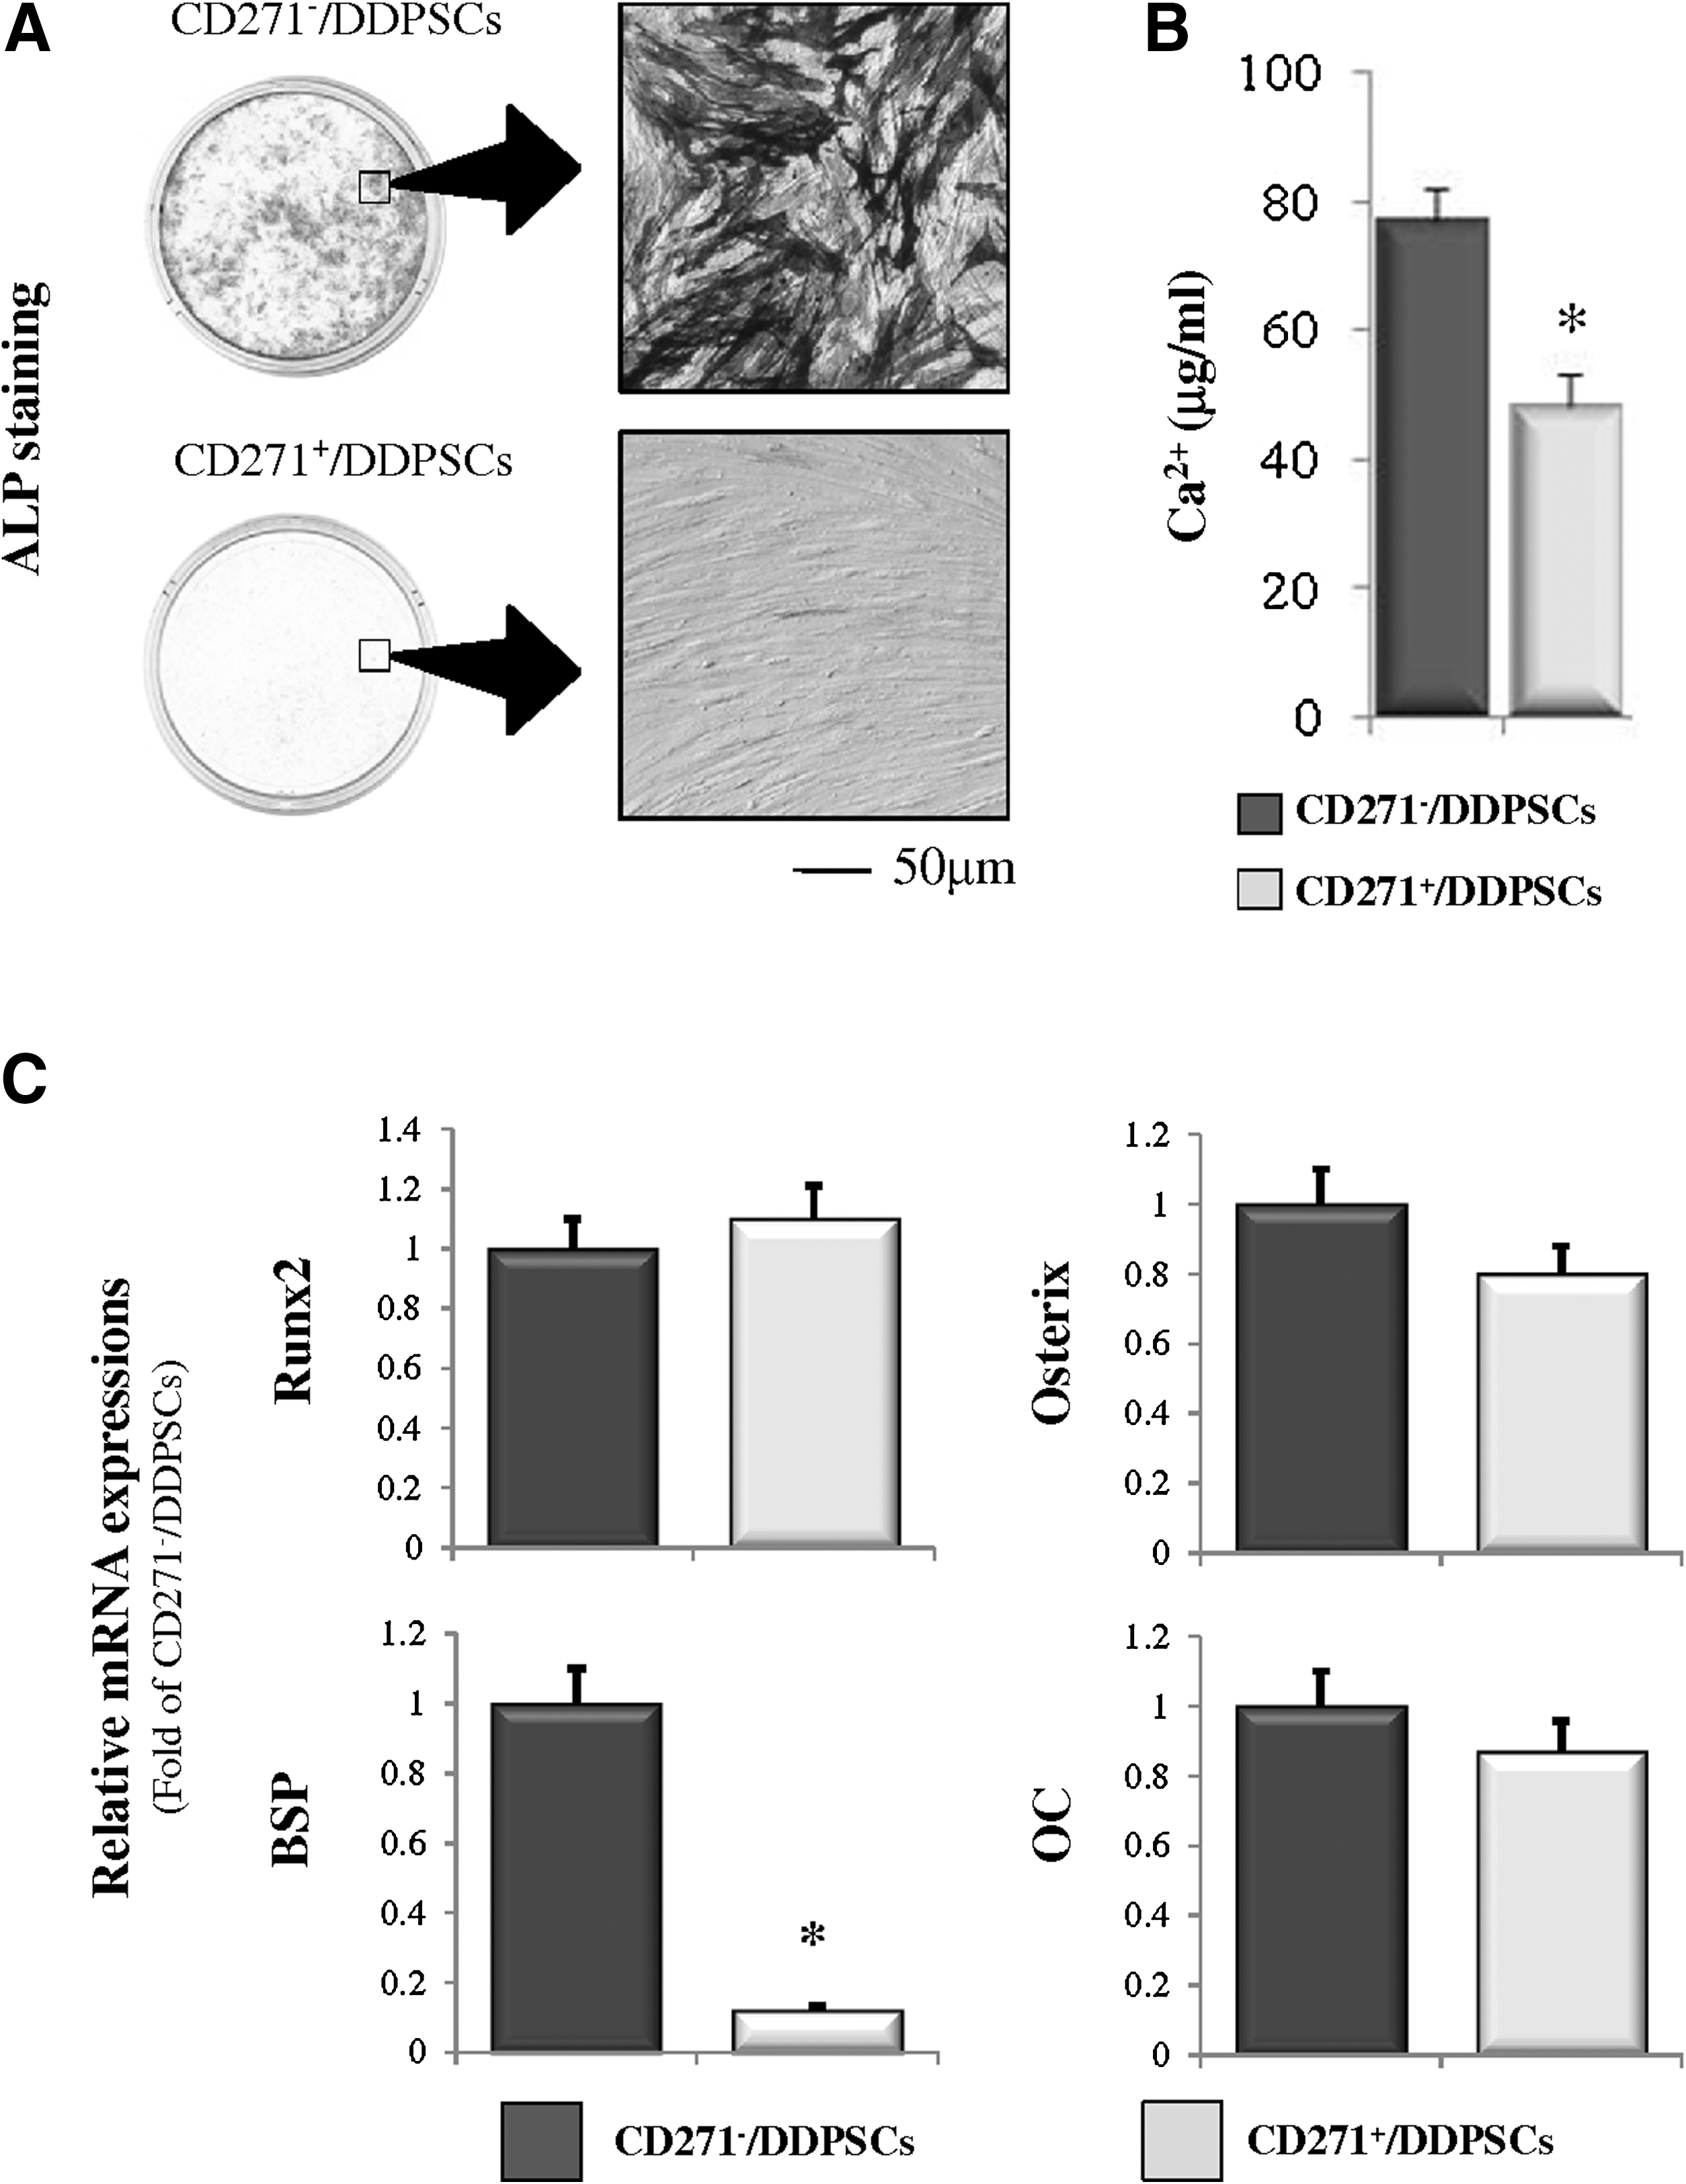
Osteogenic differentiation of CD271+/DDPSCs and CD271−/DDPSCs.
Second, we tested whether the CD271+/DDPSCs and CD271−/DDPSCs could differentiate into adipocyte-like cells. After 3 weeks of culture in the adipogenic induction medium, the differentiated (but not the undifferentiated) CD271−/DDPSCs showed small oil droplets in the cytoplasm (Oil Red O staining). By comparison, there were no lipid droplets in the CD271+/DDPSCs (Fig. 5A). Moreover, real-time RT-PCR analysis of adipogenic marker expression revealed downregulation of adipocyte determination- and differentiation-dependent factor 1 (ADD1), peroxisome proliferator activated receptor γ2 (PPARγ2), adipocyte fatty acid binding protein 2 (aP2), and adiponectin in the CD271+/DDPSCs compared with their expression levels in CD271−/DDPSCs (Fig. 5B).

Adipogenic differentiation of CD271+/DDPSCs and CD271−/DDPSCs.
Forced expression of CD271 in murine C3H10T1/2 MSCs
Murine multipotent MSCs (C3H10T1/2 cells) have been used widely as a model to investigate modulation of lineage determination [35,39,40]. Our preliminary investigations revealed that C3H10T1/2 MSCs do not express CD271 (data not shown). This result suggests that C3H10T1/2 cells are suitable for assessment of the effect CD271 on universal mesenchymal differentiation. The C3H10T1/2 cells were genetically engineered to constitutively express exogenous CD271. These cells, named 10T271 cells, were used in subsequent experiments. The expression of CD271 in 10T271 cells and mock transformants (10TMk cells) was confirmed by FACS analysis using the human anti-CD271 antibody and real-time RT-PCR. Both protein and mRNA expression for CD271 were detected in the 10T271 cells, but not in the 10TMk cells (Fig. 6A, B). The expression of mRNA for endogenous CD271 in C3H10T1/2 cells was not detected by real-time RT-PCR using the mouse CD271-specific primers (data not shown). In addition, immunofluorescence staining with the anti-CD271 antibody localized the exogenously expressed CD271 to the cell membrane of 10T271 cells (Fig. 6C). However, no morphological differences were observed between the 10T271 and 10TMk cells under the light microscope (Fig. 6D).
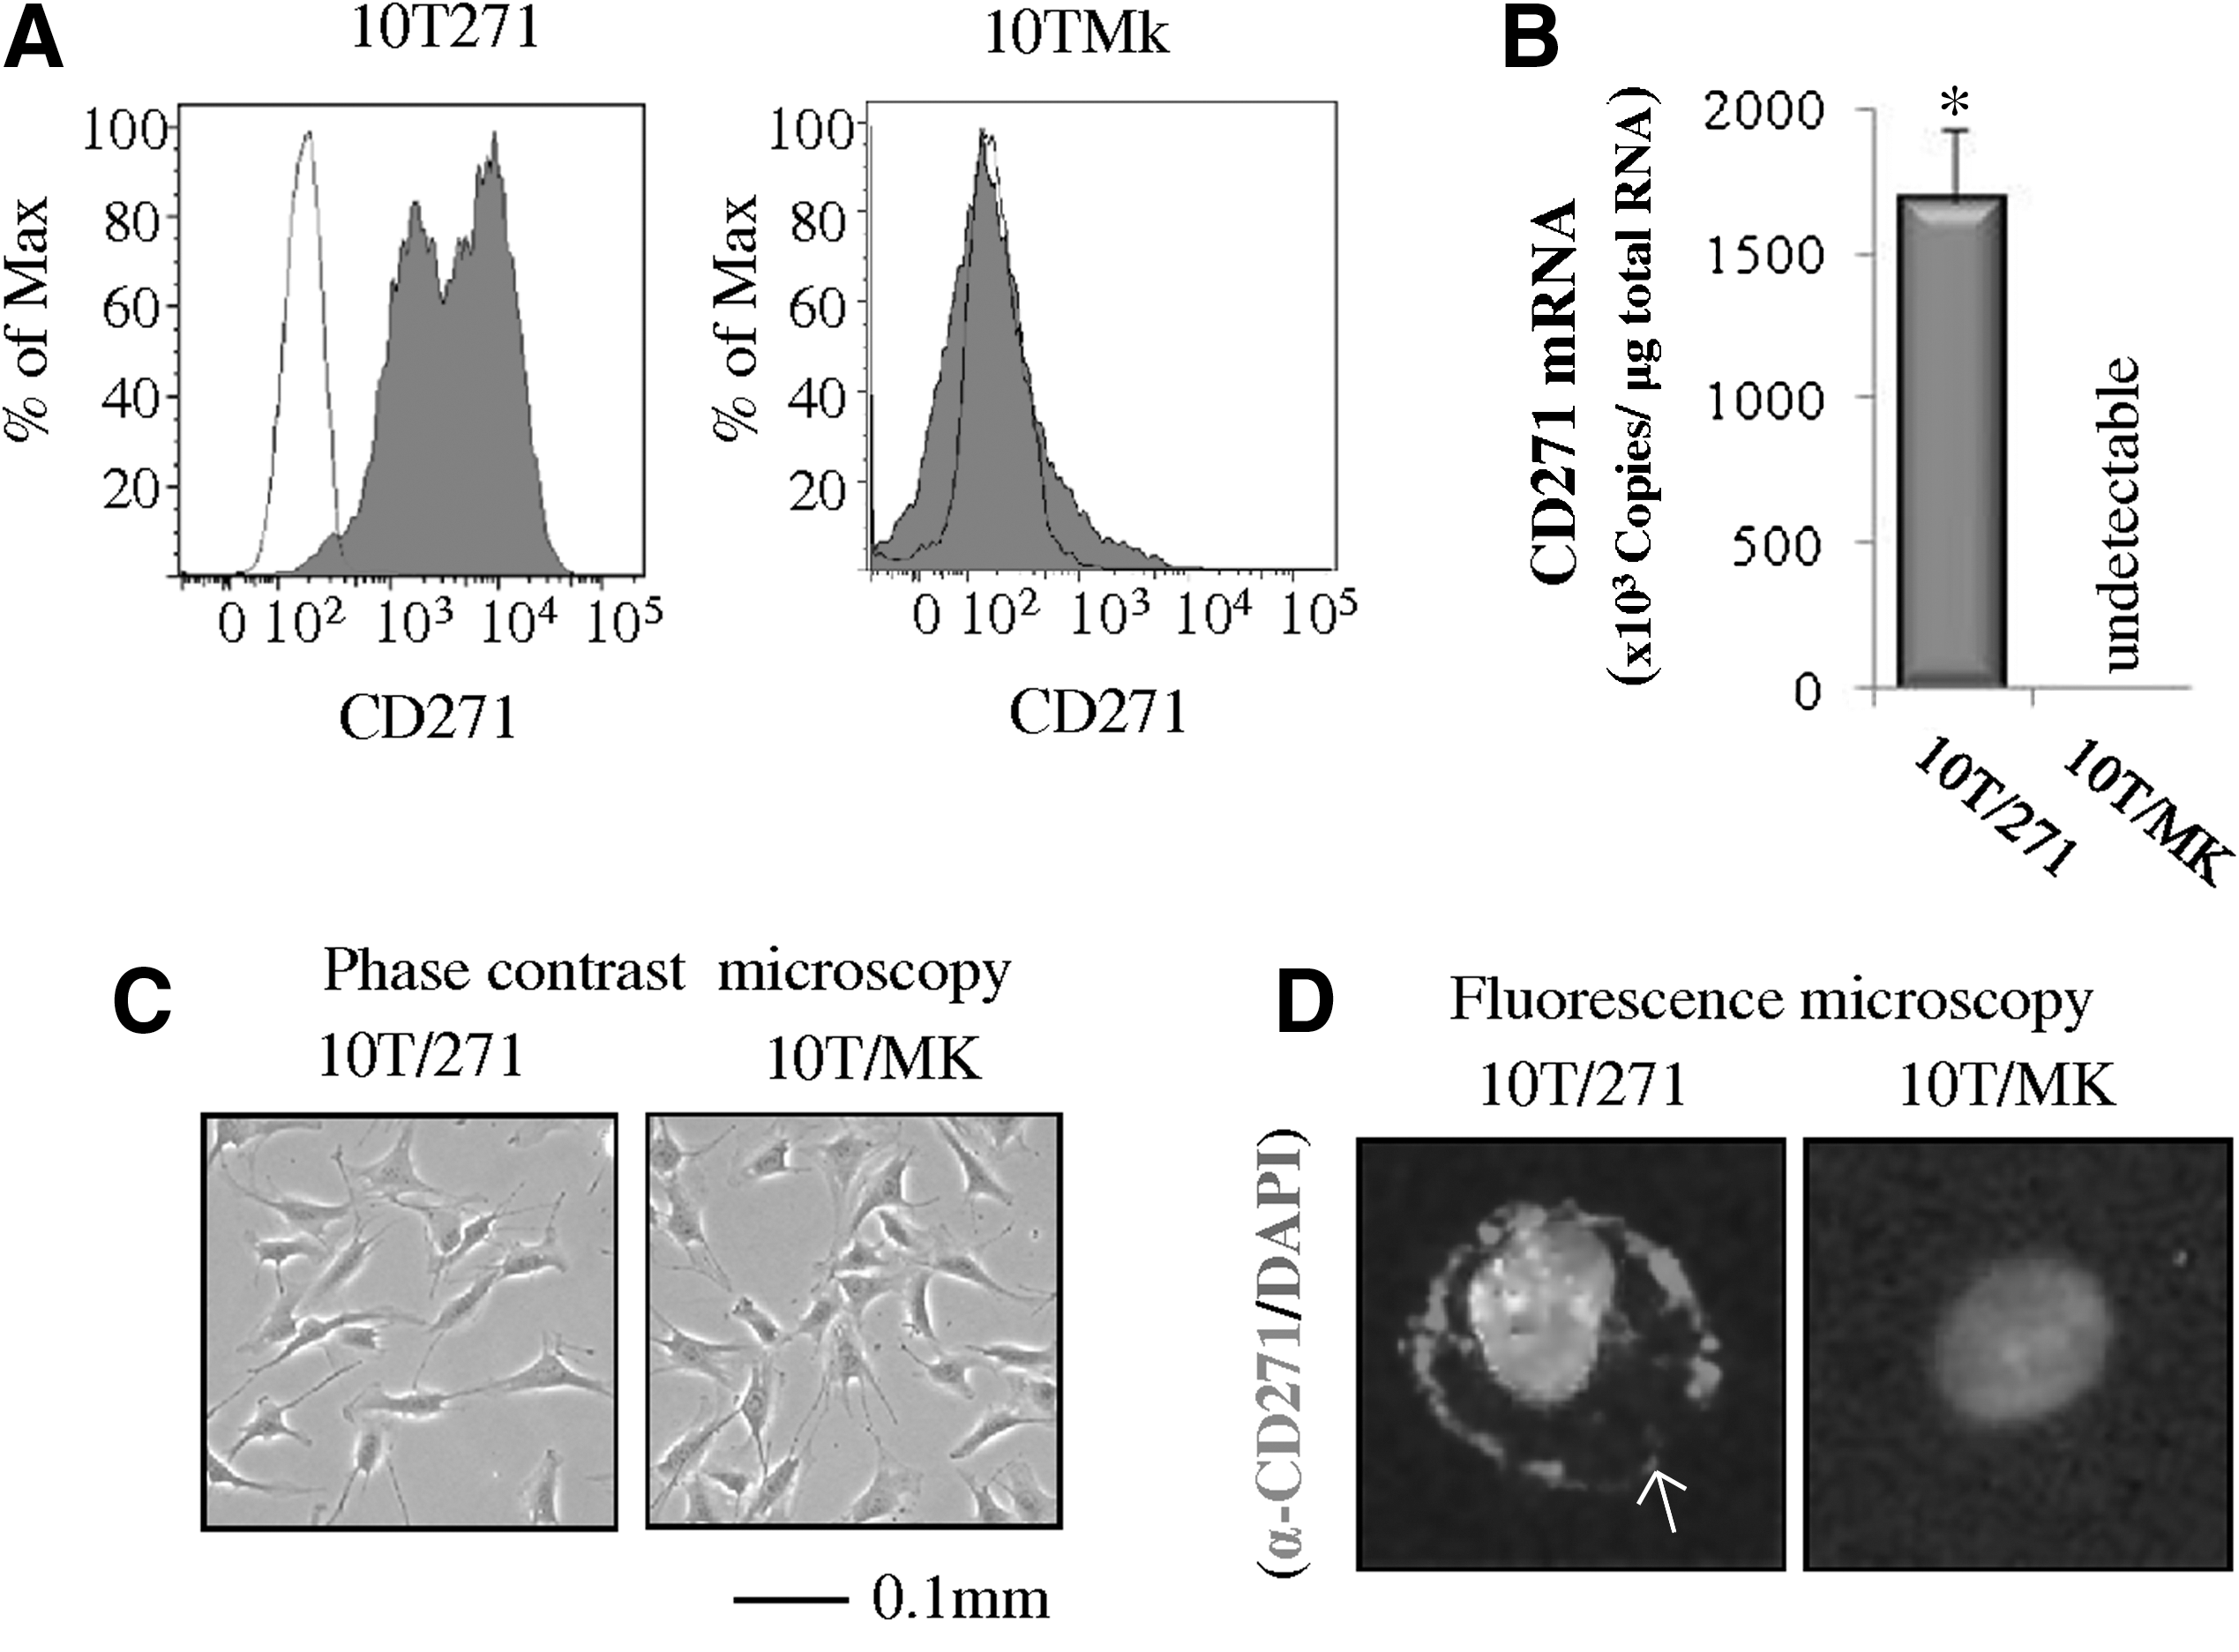
Forced expression of CD271 in C3H10T1/2 cells.
Effect of CD271 on cell proliferation and cell cycle progression of C3H10T1/2 cells
To investigate the effect of CD271 on the proliferation of C3H10T1/2 cells, 10T271 and 10TMk cells were cultured for the indicated number of days in growth media, and the cell numbers were counted at each time-point. The number of 10T271 cells increased more rapidly from day 4 to 6 than did the number of 10TMk cells (Fig. 7A). Cells in the logarithmic growth phase were stained with DAPI and the percentages of cells in metaphase or anaphase were assessed. The percentages of cells in metaphase and anaphase were higher in the 10T271 cultures than in the 10TMk cultures (Fig. 7B).

Effect of CD271 on the proliferation and cell cycle progression of C3H10T1/2 cells.
Cell cycle progression was then analyzed in 10T271 and 10TMk cells. Cultures of 10T271 cells showed a slight increase in the percentage of cells in S phase (Upper panel) and G2/M phase (Lower right panel) of the cell cycle when compared to the cultures of 10TMk cells (Fig. 7C). On the other hand, the percentage of cells in G1 phase (Lower left panel) was lower in 10T271 cultures than in 10TMk cultures (Fig. 7C).
Effect of CD271 on the osteogenic, adipogenic, chondrogenic, and myogenic differentiation of C3H10T1/2 cells
To determine whether CD271 inhibits the multilineage differentiation capacity of C3H10T1/2 cells, 10T271 and 10TMk cells were cultured under the respective culture conditions for osteogenic, adipogenic, chondrogenic, and myogenic differentiation.
After osteogenic induction, the 10TMk cells showed markedly increased ALP levels compared with those in 10T271 cells (Fig. 8A). The 10T271 cells exhibited remarkably low levels of ALP (Fig. 8A). Real-time RT-PCR analysis of osteogenic marker expression showed that the level of BSP expression was significantly decreased in 10T271 cells compared with that in 10TMk cells (Fig. 8B). The expression levels of Runx2 and OSX were slightly lower in 10T271 cells than in 10TMk cells (Fig. 8B). However, we observed no difference in the level of osteocalcin expression between the 10T271 and 10TMk cells (Fig. 8B). Taken together, these results indicate that CD271 might play an important role in the regulation of osteoblastic differentiation of mesenchymal C3H10T1/2 cells.

Effect of CD271 on the osteogenic, adipogenic, chondrogenic, and myogenic differentiation of C3H10T1/2 cells.
The culture of cells in adipocyte differentiation medium resulted in a lower number of cells with lipid droplets in the 10T271 cultures than in the 10TMk cultures (Fig. 8A). Real-time RT-PCR analysis showed that the overexpression of CD271 resulted in decreased expression of adipogenic markers, including ADD1, PPARγ2, aP2, and adiponectin, in the C3H10T1/2 cells (Fig. 8B).
Chondrogenic induction resulted in the appearance of acidic mucopolysaccharides in the 10TMk cultures, as evidenced by Alcian blue staining (Fig. 8A). In contrast, the level of Alcian blue staining was significantly lower in the 10T271 cells than in the 10TMk cells. Real-time RT-PCR analysis showed that the chondrogenic markers Sox9, collagen type II, collagen type X, and aggrecan were expressed at lower levels in the 10T271 cells than in the 10TMk cells (Fig. 8B).
Myogenic differentiation of 10TMk cells resulted in the appearance of myotubes (Fig. 8A). However, no myotubes were observed in the 10T271 cells under the same conditions (Fig. 8A). Analysis of the levels of mRNA expression of myogenic markers revealed that myogenin expression was lower in the 10T271 cells than in the 10TMk cells (Fig. 8B). Myf5 expression was not detected in either the 10T271 or 10TMk cells. We observed no difference in MyoD expression between the 10T271 and 10TMk cells (Fig. 8B).
Discussion
In the present study, we indicate the possibility that CD271 (NGFR, p75NTR) has a new role as a pivotal regulator of the differentiation of MSCs into osteogenic, adipogenic, chondrogenic, and myogenic lineages. The identification of CD271 as a specific marker and the availability of an anti-CD271 antibody have been exploited to generate near-homogeneous MSC populations from BMMSCs [26,27] and adipo-tissue-derived MSCs [30] through the use of FACS. However, the function of CD271 in MSCs remains unknown. As an initial study to determine whether CD271 is commonly expressed in MSCs, we examined the expression levels of CD271 in DDPSCs [31]. We showed that these cells express CD10, CD34, CD44, CD73, CD90, and CD271. This pattern of expression is commonly found in MSCs. Moreover, this is the first report showing that human DDPSCs express CD271. The average percentage of triple-positive cells (CD44, CD90, and CD271) was ∼2% for the DDPSCs, whereas that for BMMSCs has been reported variously as 0.5% [41].
We also examined the stem cell phenotypes in 2 isolated progenitor/stem clonal cell populations: CD271+/DDPSCs (CD44+CD90+CD271+) and CD271−/DDPSCs (CD44+/CD90+/CD271−). The CD271+/DDPSCs showed high rates of CFU-F formation and proliferation. Interestingly, the cloning efficiency of the CD271+/DDPSCs was 2-fold higher than that of the CD271−/DDPSCs. From these results, we conclude that cells derived from human deciduous dental pulp possess high self-renewal capacity as one of their stem cell characteristics. Next, we examined the potential for multiple differentiation of 2 types of DDPSCs, since multiple differentiation potential is a key feature of MSCs [42]. As differentiation toward the osteogenic lineage proceeded, ALP staining of the CD271+/DDPSCs weakened, whereas ALP staining of the CD271−/DDPSCs remained strong over the same period and under the same culture conditions. Further, BSP expression in the CD271+/DDPSCs was strongly inhibited compared with that in the CD271−/DDPSCs. By comparison, expression of the transcription factors Runx2 and OSX was only slightly inhibited by CD271 in CD271+/DDPSCs although there was no statistical significance. During adipogenic differentiation, the CD271+/DDPSCs were not stained with Oil-red O, whereas the CD271−/DDPSCs showed positive staining with Oil-red O. Further, the level of expression of the transcription factors ADD1, PPARγ2, aP2, and adiponectin was strongly inhibited in the CD271+/DDPSCs compared with their level of expression in the CD271−/DDPSCs. These results suggest that the differentiation of CD271+/DDPSCs into both the osteogenic and adipogenic cell lineages was inhibited. Interestingly, when CD271+/DDPSCs were subcultured for several days, CD271 expression gradually disappeared. The CD271+/DDPSCs in which CD271 expression was lost stained strongly with ALP (Supplementary Fig. S1). In contrast, a previous study showed that the levels of CD271 were negligible in undifferentiated tibial periosteal cells [43], in infrapatellar fat pad-derived stem cells [44], and in the MSCs from normal bovine synovial fluid [45]. These previous results are in line with our data on undifferentiated dental pulp stem cells, since the CD271−/DDPSCs showed strong potential for multiple differentiation and the CD271−/DDPSCs expressed CD44 and CD90. Taken together, these results suggest that CD271 is a marker of the undifferentiated precursors of dental pulp stem cells.
We investigated whether the CD271-mediated inhibition of transcription factors had a direct or indirect effect on the differentiation capacity of MSCs. In vitro investigations of the differentiation of MSCs represent a considerable challenge because the experiments require consistent and homogenous research material for repetitive data collection and continuous cell lines retaining multipotent differentiation features. Thus, to conduct such experiments we engineered C3H10T1/2 cells to express the human CD271 protein. C3H10T1/2 cells have the potential to differentiate into osteoblasts, adipocytes, chondrocytes, and myocytes. Our results suggested a novel role for CD271 in directly inhibiting the differentiation of MSCs into these multiple cell types; however, it is not clear which ligands are involved.
Our examination of the transcription factors involved in multiple differentiation of 10T271 cells revealed that the expression of Runx2 and OSX was slightly inhibited, whereas ALP activity and BSP expression were strongly inhibited. Runx2 [46,47] and OSX [48,49] are essential factors in osteoblast differentiation. Thus, we speculated that CD271 might inhibit an alternative pathway of osteogenesis. Examination of adipogenic, chondrogenic, and myogenic differentiation revealed that CD271-expressing cells had reduced levels of the adipogenesis markers PPARγ2 and ADD1 [50], the chondrogenesis marker Sox9 [51], and the myogenic markers Myf5 and myogenin. In chondrogenesis, Sox9 regulates the transcription of cartilage-specific extracellular matrix molecules, such as collagen types II [52], IX [53], and XI [54], and aggrecan [55]. During normal skeletal muscle development, Myf5 is involved in myoblast specification, whereas myogenin controls the terminal differentiation of myoblasts into myotubes [56,57]. Although we found that various transcription factors were involved in multiple differentiation pathways along with CD271, further studies are needed to elucidate the complex signaling pathways leading to osteogenesis, adipogenesis, cartilage, and muscle development.
Our results raise the question how CD271 controls the expression of genes regulating differentiation into different cell types. A signaling relationship between CD271 and trk receptors is well documented in the nervous system [58 –60]. However, real-time RT-PCR analyses failed to detect the expression of 3 trk receptors (trkA, B, C) in 10T271 and 10TMk cells (data not shown). This finding suggests that trk-signaling does not play a critical role in CD271-mediated inhibition of cell differentiation. To further clarify the role of trk-signaling, we conducted a pharmacological study using K252a, an inhibitor of trk tyrosine kinase and found that K252a had no effect on CD271-mediated inhibition of osteoblast differentiation (Supplementary Fig. S2). We also showed that NGF and brain-derived neurotrophic factor, ligands for trk, have no effect on CD271-mediated inhibition of osteoblast differentiation (Supplementary Fig. S2). In addition, we were unable to detect NGF in the culture media (Mikami et al., unpublished data). These results suggest that CD271 inhibits cell differentiations, at least, in a trk-independent manner. On the other hand, CD271 acts in combination with other receptors, such as the Nogo receptor, NgR [1,61,62]. The activation of the NgR-CD271 complex leads to activation of RhoA and the RhoA kinase pathway, which may result in the CD271-mediated cell differentiation [63 –65]. These results suggest that CD271 inhibits cell differentiations, at least, in a trk-independent manner.
The mechanisms underlying the maintenance of the undifferentiated status of MSCs are largely unknown. By comparison, several factors have been identified as critical for the induction of differentiation [51,66]. Based on our present findings, we hypothesize that multipotent stem cells require signaling that is mediated by CD271 for the maintenance of their stem cell potential.
Footnotes
Acknowledgments
This work was supported in part by grants from the Japanese Ministry of Education, Culture, Sports, Science and Technology [Kakenhi (822791778) to YM; (21390528 and 20659305) to MH], and from the Dental Research Center and Sato Fund, Nihon University School of Dentistry.
Author Disclosure Statement
All of the authors state that they have no conflicts of interest.
References
Supplementary Material
Please find the following supplemental material available below.
For Open Access articles published under a Creative Commons License, all supplemental material carries the same license as the article it is associated with.
For non-Open Access articles published, all supplemental material carries a non-exclusive license, and permission requests for re-use of supplemental material or any part of supplemental material shall be sent directly to the copyright owner as specified in the copyright notice associated with the article.