
Abstract
Mesenchymal stromal cells (MSC) can be isolated from different tissues. They are capable of differentiating in vitro, for example, to osteoblasts, chondrocytes, or adipocytes. In contrast to CD34 for hematopoietic stem cells, a distinct MSC-defining antibody is not available. Further, for hematopoietic cells lineage-defining antigens such as CD3 or CD20 are known. In contrast, for MSC-derived cells lineage-associated cell surface markers are far from being established. We therefore investigated expression of cell surface antigens on human term placenta-derived MSC (pMSC) in more detail and correlated expression pattern to the osteogenic differentiation capacity of the MSC. We report that pMSC expressed the typical cell surface antigens at levels comparable to bone marrow-derived MSC (bmMSC), including CD73, CD90, and CD105, but did not express CD11b, CD34, and CD45. Further, CD164, TNAP, and the W5C5 antigens were detected on pMSC, whereas CD349 was not observed. Some pMSC expressed CD146 at low or moderate levels, and their osteogenic differentiation potential was weak. In contrast, bmMSC expressed CD146 at high levels, expression of alkaline phosphatase was significantly higher, and they presented a pronounced osteogenic differentiation potential. We conclude that MSC from different sources differ in their expression of distinct markers, and that this may correlate in part with their lineage determination. Thus, a higher percentage of bmMSC expressed CD146 at prominent levels and such cells may be better suited for bone repair. In contrast, many pMSC expressed CD146 at low or moderate levels. They, therefore, may be suitable for applications in which osteogenic differentiation is undesirable.
Introduction
M
Detailed analyses of the MSC isolated from bone marrow and other tissues described a variety of additional cell surface proteins, including CD10, CD29, CD49, CD56, CD63, CD106, CD146, and CD164 [2,12 –19]. Expression of some of these cell surface antigens (eg, CD10, CD49, and CD318) may differ on bmMSC compared with pMSC [12,17]. Comparably, expression of CD14 was reported on human adipose tissue-derived MSC (atMSC) [20,21], but expression of CD14 is regarded as an exclusion criteria for bmMSC [9]. Moreover, expression of cell surface antigens may vary on MSC isolated from the same sources but from different donors (eg, CD106 and CD146) [16]. In some cases the differences in expression of cell surface antigens on MSC was correlated with a functional difference. Expression of CD146, for instance, defined the population of cells that generated a hematopoietic niche, whereas CD146neg cells failed to do so [22]. Some antigens, including the epitopes stained by monoclonal antibody (mAB) W8B2 (also referred to as TNAP or MSCA-1) or mAB W5C5, clearly define subsets within the bmMSC [12,13], but functional differences between the W8B2high or W5C5high MSC and the corresponding W8B2low or W5C5low cells were not yet investigated. In contrast, a significant chondrogenic potential was confined to the MSC positive for both CD271 and CD56 (stained with mAB clone 39D5) [15]. Moreover, expression of CD29, CD44, CD166, CD271, and other antigens on MSC may change during expansion in vitro [20,23], or may depend on the growth media employed. Further, the differentiation potential or proliferative capacity of MSC depends considerably on the time of in vitro culture and growth conditions [24,25].
When analyzing the osteogenic differentiation potential of bmMSC in more detail, contaminating OB from the bone marrow preparation may be a concern. We therefore investigated the osteogenic differentiation potential not only in bmMSC, but also in MSC from human term placenta. On the basis of their mesenchymal differentiation capacities and expression of typical cell surface antigens, NG-2+ pericytes were considered to represent MSC in fetal skeletal muscle tissue, pancreas, adipose tissue, and in the placenta [26,27]. We therefore utilized pMSC for investigation of the differentiation potential of MSC as well.
To our astonishment, mineralization of the extracellular matrix as depicted by von Kossa staining was weak after 4 weeks of osteogenic differentiation of pMSC compared with that of bmMSC, but the detriment in osteogenic differentiation capacities observed in pMSC may yield advantages if osteogenesis is an unfavorable side effect or risk. Therefore, we determined if this distinct osteogenic differentiation potential correlated with expression of a known MSC marker gene.
Here we report that the osteogenic differentiation capacity is higher in bmMSC than in pMSC. The bmMSC expressed significantly more alkaline phosphatase (AP) and all bmMSC preparations expressed high levels of CD146, whereas many pMSC expressed CD146 at lower levels.
Materials and Methods
Immunhistochemistry
Samples from different areas of the placenta were prepared, soaked in Tissue Tek (Sakura Finetek, Alphen aan den Rijn, The Netherlands), shock-frozen in liquid nitrogen, and stored in air-tight tubes for later use at −70°C. Cryosections were prepared (7 mm, −15°C) and the samples were mounted on SuperFrost slides (Menzel, Braunschweig, Germany) fixed with cold acetone (−20°C), air-dried, and stained. The samples were washed twice with phosphate-buffered saline (PBS), and preincubated with 1% bovine serum albumin (BSA) in PBS. Fluorescein isothiocyanate (FITC)- or phycoerythrin (PE)-labeled mABs were diluted as recommended by the supplier to detect cells expressing CD73, CD271 (BD Pharmingen, San Diego, CA), CD90, CD146 (R&D Systems, Abingdong, United Kingdom), CD105 (BioLegend, San Diego, CA), and NG-2 (Santa Cruz Biotechnology, Santa Cruz, CA). After incubation, unbound primary antibodies were rinsed away and the samples were incubated for 30 min in BSA/PBS enriched with 1 μg/mL 4′-6-diamidino-2-phenylindole to observe the nuclei. FITC- or PE-conjugated goat-anti-mouse immunoglobulin G (IgG; Jackson ImmunoResearch, Newmarket, Suffolk, United Kingdom) diluted 1:100 in 1% BSA/PBS served as control. The slides were covered, sealed with nail polish, evaluated, and recorded by a microscope (Zeiss, LSM, Oberkochen, Germany) utilizing the AxioVision and Zen software (Zeiss).
Isolation of MSC from bone marrow and placenta
Bone marrow aspirates were obtained from the BG Center for Traumatology and from the Department of Orthopedic Surgery at UKT from femur shafts of patients undergoing total hip replacement after informed consent (n = 20, 10 women and 10 men; average age 64 ± 9.9 years). The mononuclear cells were enriched by density gradient centrifugation and the bmMSC were expanded as described recently [28]. Human term placenta (n > 20 donors) was obtained from the Department of Gynecology and Obstetrics at UKT and the pMSC were isolated as described recently [12,15]. Compendiously, the fetal and the maternal (endometrial) part of the placenta were cut apart and processed individually. Both parts were sliced individually in small pieces, washed by Hank's balanced solution (PAA, Pasching, Austria), carefully homogenized by grinding the pieces through a metal sieves, and proteolytically digested at 37°C for 1 h (750 U/mL collagenase type XI; Sigma-Aldrich, Taufkirchen, Germany; 250 μg/mL, Dispase II; Roche, Mannheim, Germany). Mononuclear cells were enriched from the homogenates by filtration through a sieve followed by density gradient centrifugation (Ficoll Paque, ρ = 1.077; GE Healthcare, Munich, Germany). The bmMSC and pMSC were expanded from the individual donors separately and in animal-serum-free human fresh frozen plasma plus platelet extract (FFPP) medium as described recently [29,30]. Synovial fibroblasts and OB served as controls and were isolated and expanded as described recently [31,32]. Expansion of MSC in vitro was computed as population doublings of in vitro culture: PD = [log10(Ni) − log10(Nh)]/log10(2), where N i is the number of cells at inoculation and N h at cell harvest [33]. This study was approved by the Ethics Committee of the University of Tübingen.
Cell culture and in vitro differentiation of MSC
MSC from the individual donors were expanded in animal-serum-free FFPP medium as described recently [30]. This FFPP medium is composed of low-glucose Dulbecco's modified Eagle's medium (DMEM; Lonza, Basle, Switzerland) supplemented with 5% FFP, 5% platelet concentrate (108 platelets/mL medium, University of Tübingen Blood Donor Center), 2 mM glutamine (Lonza), 1,000 IU heparin sodium (Roth, Karlsruhe, Germany), 100 U/mL penicillin, and 100 μg/mL streptomycin (Invitrogen, Karlsruhe, Germany). The FFPP medium (= MSC expansion medium) was changed twice a week. When MSC reached 80% of confluence, the cells were detached with Accutase (PAA), washed, counted, and seeded at an inoculation density of 3 × 10³ cells/cm2 in new flasks.
For adipogenic differentiation MSC were seeded at an inoculation density of 5 × 10⁴ cells/well in 6-well plates (Greiner Bio One, Essen, Germany) and cultured in adipogenic induction medium (DMEM high glucose [Invitrogen], 10% fetal calf serum [FCS; Biochrom, Berlin, Germany], 100 IU/mL penicillin and 100 μg/mL streptomycin [Invitrogen], 0.2 mM indomethacine [Calbiochem, San Diego, CA], 0.01 mg/mL insulin, 1 μM dexamethasone, and 0.5 mM 3-isobutylxanthine [both Sigma-Aldrich]). After 28 days of incubation in adipogenic induction medium, the medium was aspirated and the cells were washed with cold PBS. The monolayer cultures were incubated with Oil Red O solution (0.033% vol/vol in isopropanol; Sigma-Aldrich) for 30 min at ambient temperature. Then, the staining solution was removed, the cells were washed 3 times with PBS, and examined by microscopy.
For osteogenic differentiation MSC were seeded at an inoculation density of 5 × 10⁴ cells/well in 6-well plates and cultured in osteogenic induction medium (DMEM high glucose, 10% FCS, 100 IU/mL penicillin, 100 μg/mL streptomycin, 10 mM β-glycerophosphate [Merck], 1 μM dexamethasone, and 0.17 mM ascorbic acid 2-phosphate [Sigma-Aldrich]). After 28 days in osteogenic induction medium, mineral deposits were observed by Alizarin Red staining or von Kossa staining. For Alizarin Red staining, the cells were fixed with ice-cold methanol for 5 min. The methanol was removed, and cells were washed twice with water. Then, the cells were incubated with Alizarin Red S staining solution (1.4%, pH 4.0; Sigma-Aldrich) for 20 min at ambient temperature. The staining solution was aspirated, and the cells were washed with water several times and examined by microscopy. For von Kossa staining [34], cells were fixed with ice-cold ethanol, rinsed with water, and incubated in 5% silver nitrate solution (1 h at ambient temperature in the dark) to stain the mineralized matrix. The unreacted silver was rinsed off twice by water, followed by 2 min of incubation in sodium carbonate (5% solution in 8.5% formaldehyde), and silver was reduced by 5% sodium thiosulfate. The samples were examined by microscopy.
The enzymatic activity of AP was determined cytochemically in MSC, and OB served as controls (LAP kit # 85L1; Sigma-Aldrich). The cells were fixed (2 vol. citrate-buffered surfactant solution, pH 3.6 + 3 vol acetone), rinsed, and incubated in a naphthol-AS-MX solution mixed with an alkaline diazonium solution, and processed further as described by the supplier (LAP kit; Sigma-Aldrich). The precipitates indicating phosphatase activity were observed by microscopy.
For chondrogenic differentiation micromass cultures were employed. To generate micromasses, 4 × 10⁵ MSC were seeded in 20 μL of incomplete chondrogenic induction medium (DMEM high glucose, 0.17 mM ascorbic acid 2-phosphate, 100 IU/mL penicillin, 100 μg/mL streptomycin, 0.1 μM dexamethasone, 1 × ITS+1 supplement [Sigma-Aldrich], and 0.35 mM L-proline [Sigma-Aldrich]) in round-bottom wells of a 96-well plate (Greiner Bio One). After 2 h, 200 μL of complete chondrogenic induction medium was added (= incomplete chondrogenic induction medium enriched with 10 ng/mL transforming growth factor-β3; R&D Systems) to the adherent cells. After 28 days of incubation, the micromasses were harvested and imbedded in Tissue Tek to generate cryosections as described above. Chondrogenic differentiation was observed by Alcian Blue staining (1% solution, in acetic acid, pH 2.5; Sigma-Aldrich) [28] and examined by microscopy.
Flow cytometry
Expression of CD146, CD90, and CD11b (antibodies from R&D Systems), CD164, CD105, CD73, CD45, CD34, and CD14 (from BD Pharmingen), CD349, CD271, TNAP (MSCA-1, clone W8B2), and mAB clone W5C5 (from Dr. Bühring, Tübingen [14]) on MSC was investigated by flow cytometry (FCM). The MSC were gently detached using Accutase (PAA). Unspecific binding of antibodies was blocked with Gamunex (Talecris Biotherapeutics, Frankfurt, Germany; 1:20 in PFEA [= PBS, 2% FCS, 2 mM EDTA, and 0.01% sodium acid], 20 min, 4°C) [35]. Then, the MSC were washed with cold PFEA buffer, and incubated for 20 min at 4°C with biotinylated, FITC-, PE-, or allophycocyanin-conjugated primary mAB as recommended by the suppliers. Unbound primary antibodies were washed away with PFEA buffer. Binding of unlabeled mABs was detected by counterstaining of the cells with FITC- or PE-conjugated detection antibodies (goat-anti-mouse IgG, 1:100; Jackson ImmunoResearch). Biotinylated primary mABs were observed by allophycocyanin-labeled streptavidin (1:100; BioLegend). The samples were analyzed on an LSRII cytometer equipped with 3 lasers (405, 588, 633 nm) utilizing the excitation and emission default settings as recommended by the manufacture (BD Biosciences). Debris and dead cells were excluded by gating on cells according to the forward and side scatters, and by staining the chromatin with 7-AAD [36]. Unstained cells and cells reacted with detection reagents only were utilized as negative controls. In addition, for each experiment mouse or hamster/rat κ-chain Comp Beads (BD Biosciences) were stained with the corresponding fluorochrome-labeled antibodies and incubated for 20 min at ambient temperature in the dark. After washing with PFEA, the beads were re-suspended in 200 μL PFEA for automatic compensation with the BD FACS Diva v6.1.1 acquisition software. The FCM data were processed and analyzed using FACS Diva and FlowJo (v7.2.2, Treestar Inc., Ashland, OR) following recently updated guidelines [37]. The FCM data were computed as geometrical means of fluorescence intensity (MFI).
Detection of AP activity
To determine the activity of AP in supernatants of bmMSC and pMSC, primary culture cells were seeded in second passage (2ndP; corresponding to 3.35 population doublings between 1stP and 2ndP of in vitro culture) in triplicate samples at an inoculation density of 2 × 103 cm−2, expanded for 7 days and incubated for additional 4 days in fresh FFPP medium. Then, supernatants from 2ndP MSC were aspirated and precleared by centrifugation (20 min, 15,000 rpm, 4°C), and aliquots of 100 μL were added to 100 μL AP Liquid Substrate containing p-nitrophenylphostate as recommended by the supplier (Sigma-Aldrich). After 10 min of incubation at ambient temperature in a covered hood, the hydrolysis of p-nitrophenylphostate by AP was stopped by addition of 50 μL 3 N NaOH. The AP activity was determined by spectrophotometry at λ = 405 nm. Reading the optical density at λ = 620 nm of each sample served to exclude scattering of the beam or other artifacts. FFPP medium and PBS served to determine background activity and to set the blank in the microplate reader (EL × 800; BioTek, Winooski, VT). Serial dilutions of AP with known enzymatic activity (1–0.0001 U/well; New England BioLabs, Ipswich, MA) were utilized to normalize each assay and served as controls.
Analysis of gene expression by quantitative reverse transcription-polymerase chain reaction
For isolation of RNA, cells were gently harvested (Accutase; PAA) and immediately washed with cold PBS, and RNA was isolated from 5 × 10⁵ cells by aid of the RNeasy Kit (Qiagen, Hilden, Germany) according to the manufacturer's protocol. For RNA extraction from micromasses, pellets were resuspended in β-mercaptoethanol solution (Sigma-Aldrich) and homogenized by a plastic pestle before application of the extracts to the RNeasy system. Reverse transcription into cDNA was performed on 1 μg total RNA (oligo-[dT] n -priming, Advantage RT for PCR Kit; Clontech, Mountain View, CA). Gene-specific cDNA was enumerated by quantitative RT-polymerase chain reaction (PCR) (qRT-PCR, LightCycler®; Roche, Mannheim, Germany) [38] utilizing commercially available primer pairs for the chondrogenic marker cartilage-derived retinoic acid-sensitive protein (CD-RAP), the osteogenic marker osteocalcin (OC), the adopogenic marker peroxisome proliferator-activated receptor gamma-2 (PPARγ2), or AP (all from SearchLC, Heidelberg, Germany). Quantification of transcripts encoding glyceraldehyde 3-phosphate dehydrogenase and serial dilutions of a recombinant DNA standard served as references in each PCR. Expression of the target genes CD-RAP, OC, or PPARγ2 was normalized to expression of glyceraldehyde 3-phosphate dehydrogenase, and amplifications were evaluated by the FitPoint (ΔΔCt-) method [38].
Statistical analysis
The mean values of sets of individual experiments, the corresponding standard deviations and the statistical significance between groups of data were assessed with a 2-sided paired Student's t-tests. Probability values (P) equal to or less than 0.05 (*), 0.01 (**), or 0.001 (***) were considered to be statistically significant and marked in the figures accordingly.
Results
Localization in human term placenta
Frozen sections of human term placenta were analyzed for cells expressing NG-2 and CD146, 2 antigens characteristic for pericytes [26]. In addition, expression of CD73, CD90, CD105, and CD271, 4 cell surface proteins found on MSC [9,14], was investigated. Cells positive for these antigens were found around vessels, corroborating the perivascular localization of MSC described previously [26] (Fig. 1).
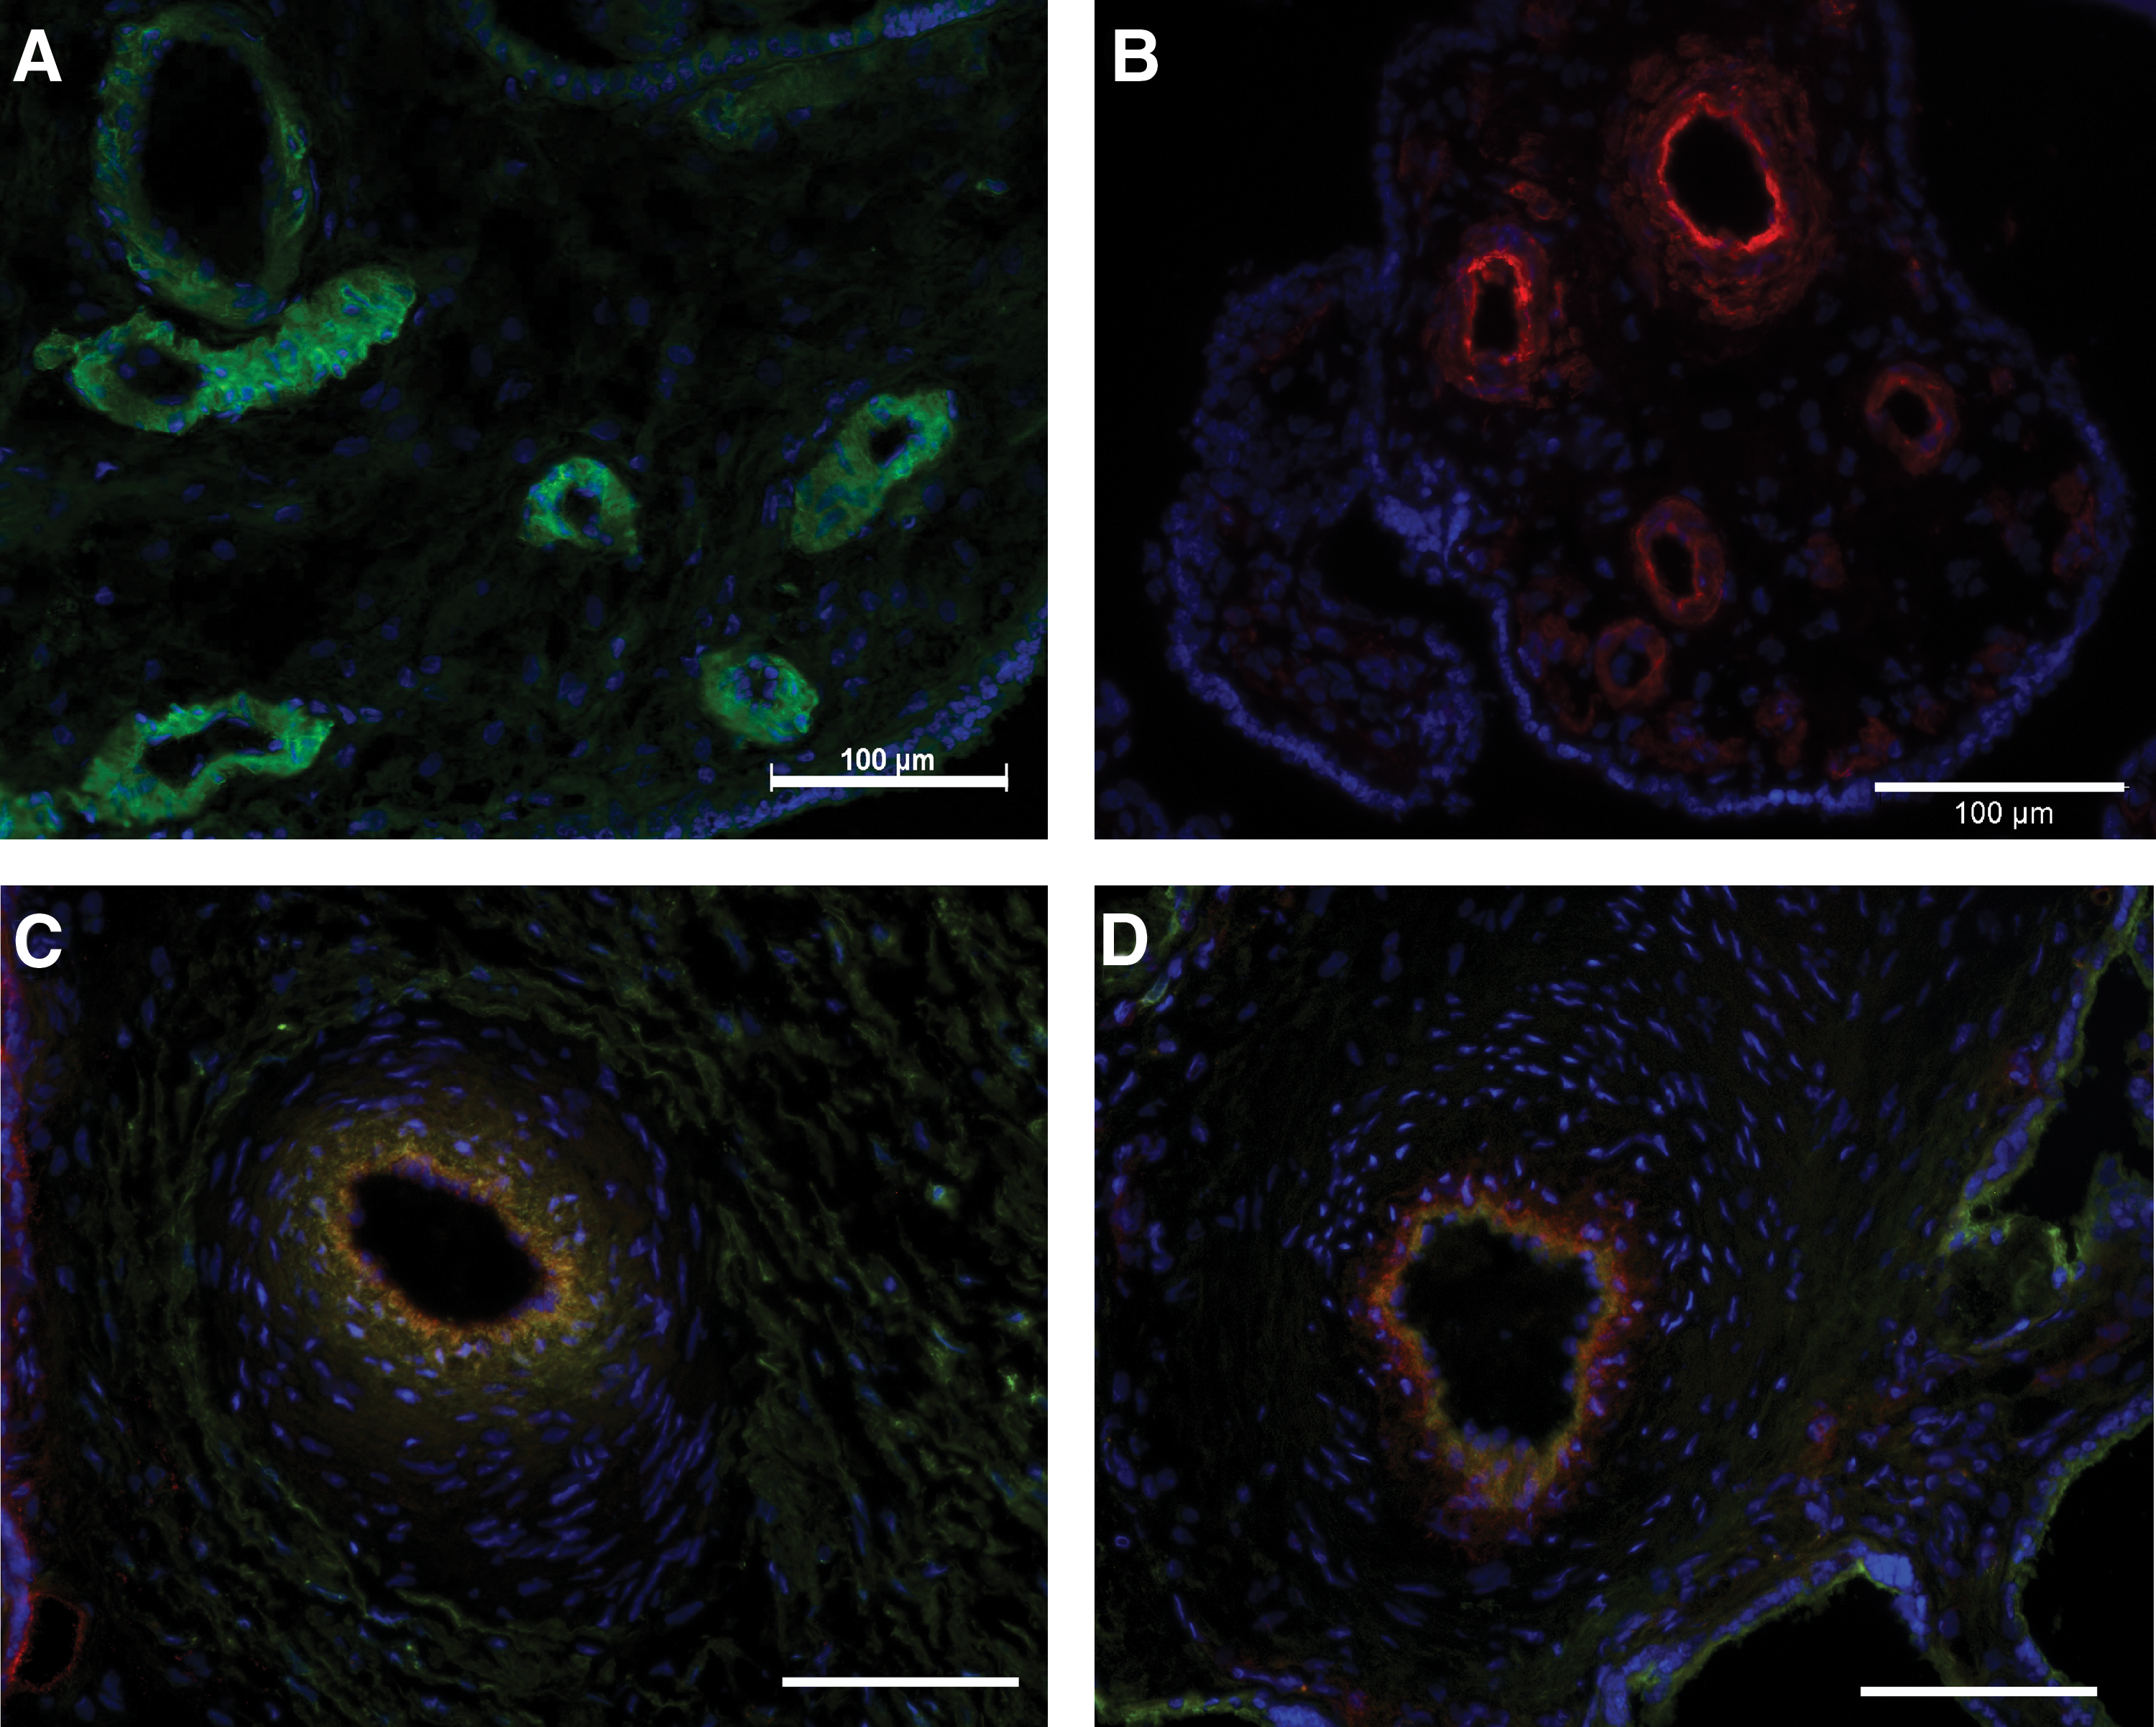
Detection of pericytes and MSC in human term placenta. Tissue sections were reacted with FITC-labeled antibody NG-2
Characterization of pMSC in vitro
pMSC attach to cell culture plastic flasks and grow as spindle-shaped fibroblast-like cells (Fig. 2A). Occasionally, clusters of more flat cells were observed (Fig. 2B) and sometimes multinucleated syncytiotrophoblasts (Fig. 2C) were detected in primary cultures of term placenta cells, but in consecutive passages the fibroblast-like cells overgrew the others to yield cultures enriched for MSC (Fig. 2D).

Expansion of placenta-derived cells in vitro. The majority of the placenta-derived cells evolve in primary culture as adherent fibroblast-like cells proliferating in clusters
Expression of characteristic cell surface antigens was investigated in 2ndP pMSC (Fig. 3). The pMSC expressed the antigens typical for MSC, including CD73, CD90, and CD105. Expression of CD11b, a marker for monocytes, and the markers for hematopoietic stem cells (CD34) or leukocytes (CD45) were not observed (Fig. 3). Staining of CD14, CD271, and CD349 were dim, and only a few 2ndP pMSC expressed some CD271. In contrast, expression of CD164 was bright. Signals derived from mAB TNAP (clone W8B2) on 2ndP pMSC were dim and mAB W5C5 discriminated 2 populations with somewhat different signal intensities (Fig. 3). A remarkable difference in expression of CD11b, CD34, CD45, CD73, CD90, and CD105 on pMSC compared with bmMSC [28] was not observed.
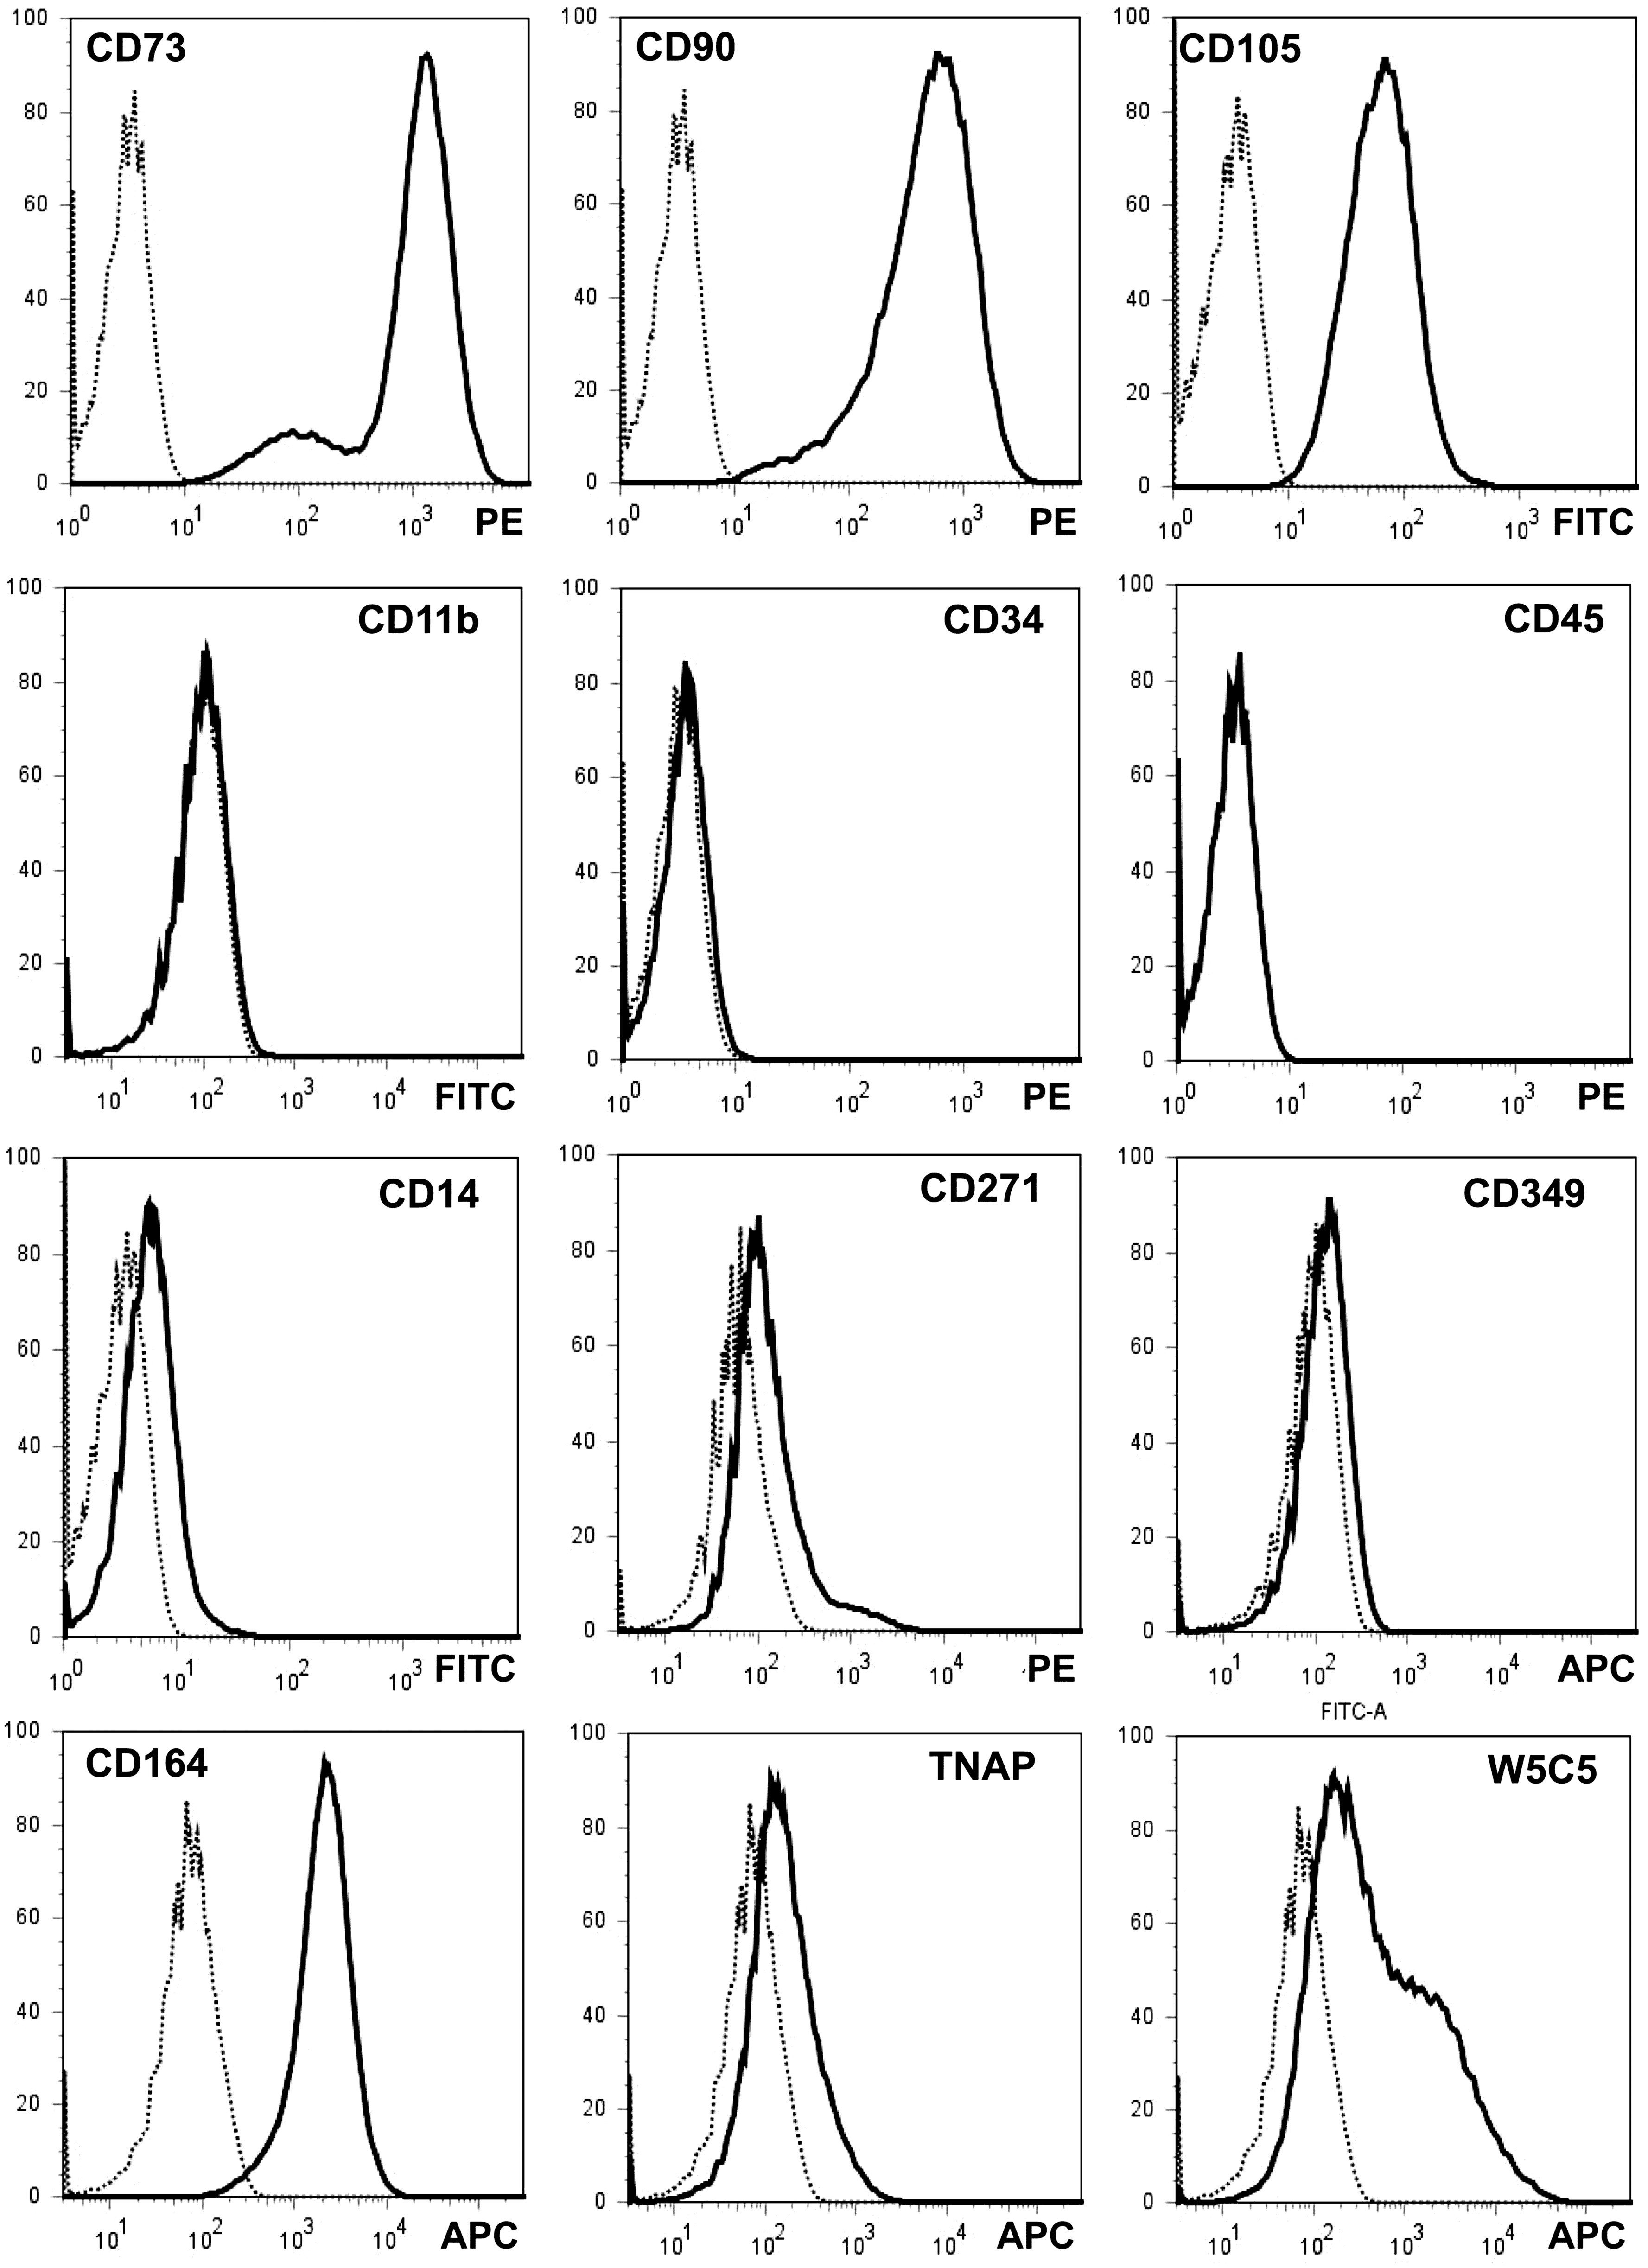
Phenotypic analysis of the pMSC. Expression of cell surface antigens defining MSC [9], including CD73, CD90, CD105, CD11b, CD14, CD34, and CD45, was investigated in 2ndP pMSC after ∼7 population doublings of in vitro culture. In addition, expression of CD271, CD349, CD164, and TNAP was analyzed on pMSC. Further the pMSC were stained with the monoclonal antibody clone W5C5 that reacts with an unknown antigen on MSC [14]. The flow cytometry analyses are presented in the histogram mode (y-axes, % of max; x-axes, signal intensities). Bold histograms display the staining with the antibodies as indicated; dotted histograms, the controls. The antigens stained and fluorescence dyes utilized are marked in each histogram. The pMSC display expression patterns typical for MSC. pMSC, placenta-derived MSC.
Analysis of the differentiation potential of pMSC
The differentiation of MSC to generate adipocytic, osteogenic, and chondrogenic cells is a hallmark of these cells. We therefore incubated the pMSC in the respective differentiation media and investigated if adipocytes, OB, or chondrocytes were generated in vitro. MSC proliferated in the complete medium containing 0.1% FFP and 0.1% plasma served as controls (Fig. 4A). Success of adipogenic differentiation of pMSC was detected by staining the intracellular lipid vesicles by Oil Red O (Fig. 4B). The osteogenic differentiation of pMSC was observed by Alizarin Red staining of the mineralized extracellular matrix (Fig. 4C), and the chondrogenic differentiation of pMSC was confirmed by Alcian Blue staining (Fig. 4D). An elevated mRNA expression of PPARγ2, OC, and CD-RAP confirmed the differentiation of pMSC in vitro (Fig. 4E). However, the overall osteogenic differentiation of pMSC (6/6) was rather weak compared with staining patterns observed in bmMSC (6/6, see below).
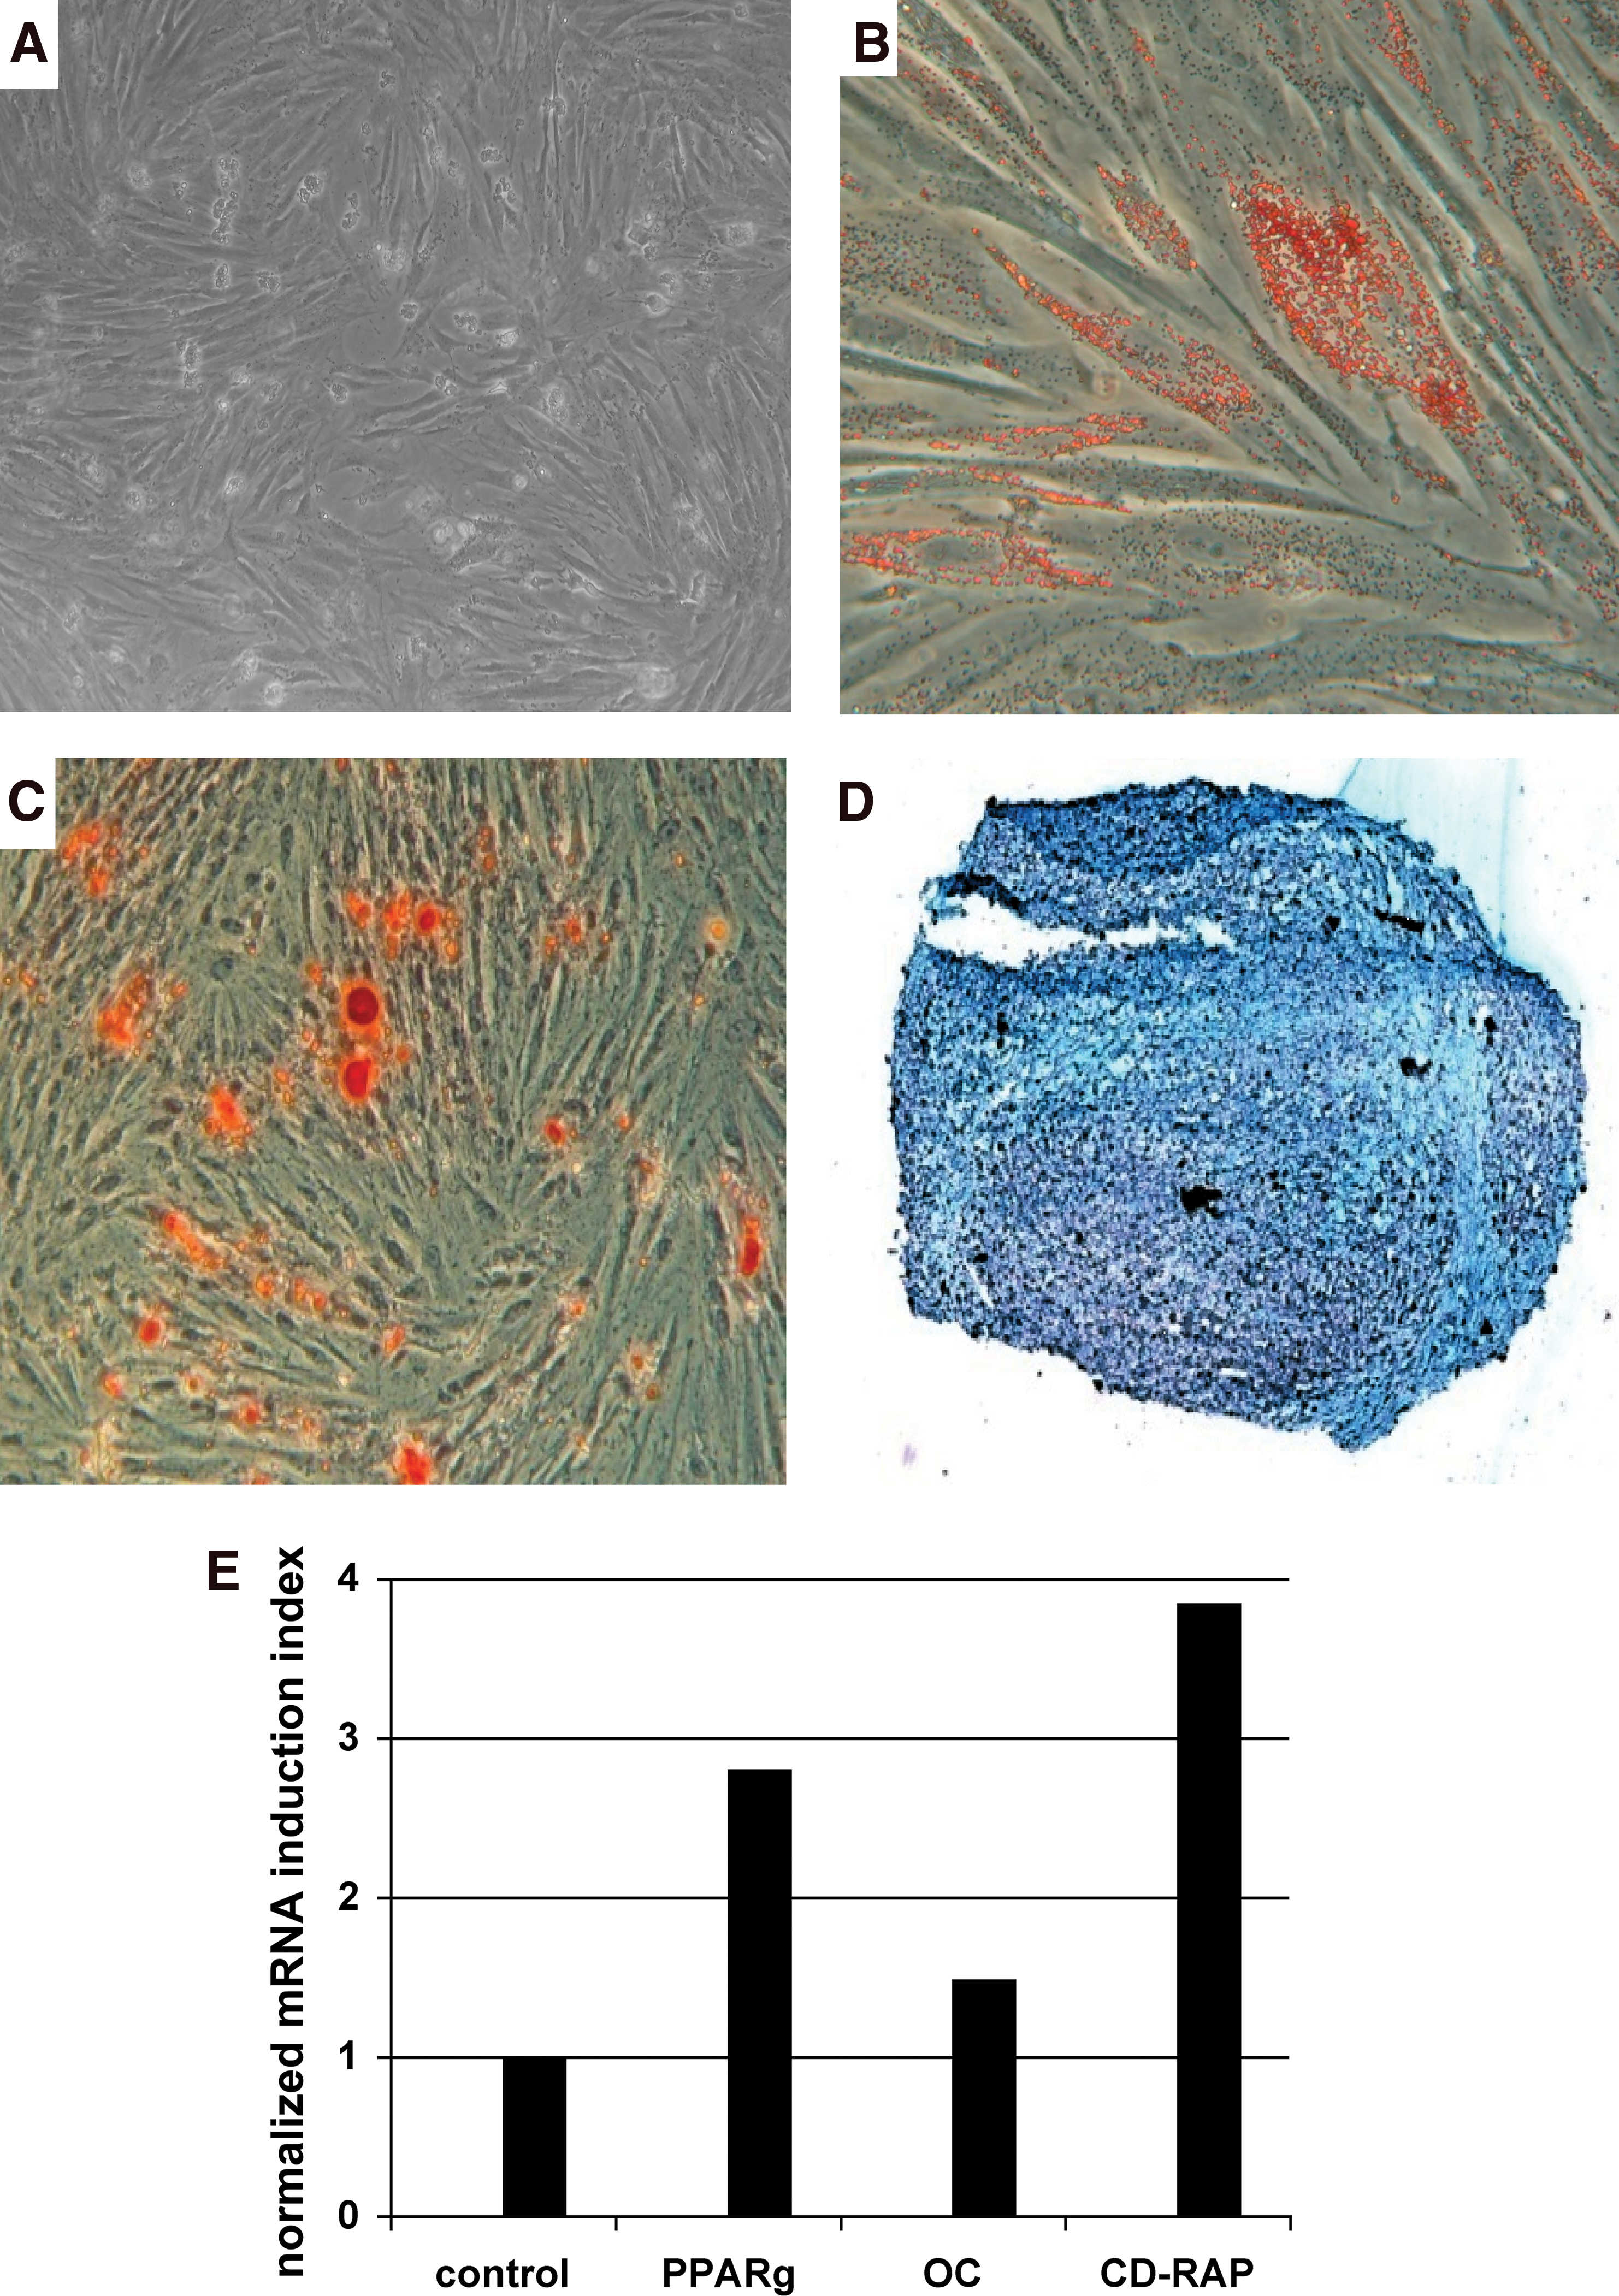
Analysis of the differentiation capacity of pMSC. The pMSC were expanded in human fresh frozen plasma plus platelet extract medium
Expression of CD146 on bmMSC, pMSC, OB, and fibroblasts
After osteogenic stimulation of bmMSC, a prominent von Kossa staining confirmed success of osteogenic differentiation (Fig. 5A). In contrast, incubation of placenta-derived maternal MSC (pmMSC, Fig. 5B) or placenta-derived fetal MSC (pfMSC, Fig. 5C) under identical osteogenic conditions yielded no or much less extracellular precipitates as detectable by von Kossa cytochemistry. This indicated a lower osteogenic potential of pMSC compared with bmMSC (n ≥ 6 each, Fig. 5A–C). We therefore analyzed expression of typical antigens found on MSC to investigate if expression of one or several cell surface antigens correlated with this different osteogenic potential. Among all cell surface antigens investigated thus far, bright expression CD146 on bmMSC seemed to correlate with their higher osteogenic differentiation potential: expression of CD146 was rather bright on most bmMSC preparations (5 out of 6 donors; Fig. 5D, G). The pmMSC or pfMSC expressed CD146 typically at somewhat lower levels (Fig. 5E, F). In some pMSC samples a rather low CD146 signal intensity was observed (Fig. 5H), whereas in other pMSC preparations even 2 subsets of pMSC with distinct CD146 expression levels were observed (Fig. 5I). In general, such low expression of CD146 or distinct CD146 subsets was not observed in bmMSC, although bmMSC of one preparation expressed CD146 only at moderate levels (Fig. 5K). However, the cause for these differences in patterns of CD146 expression must await further investigations.
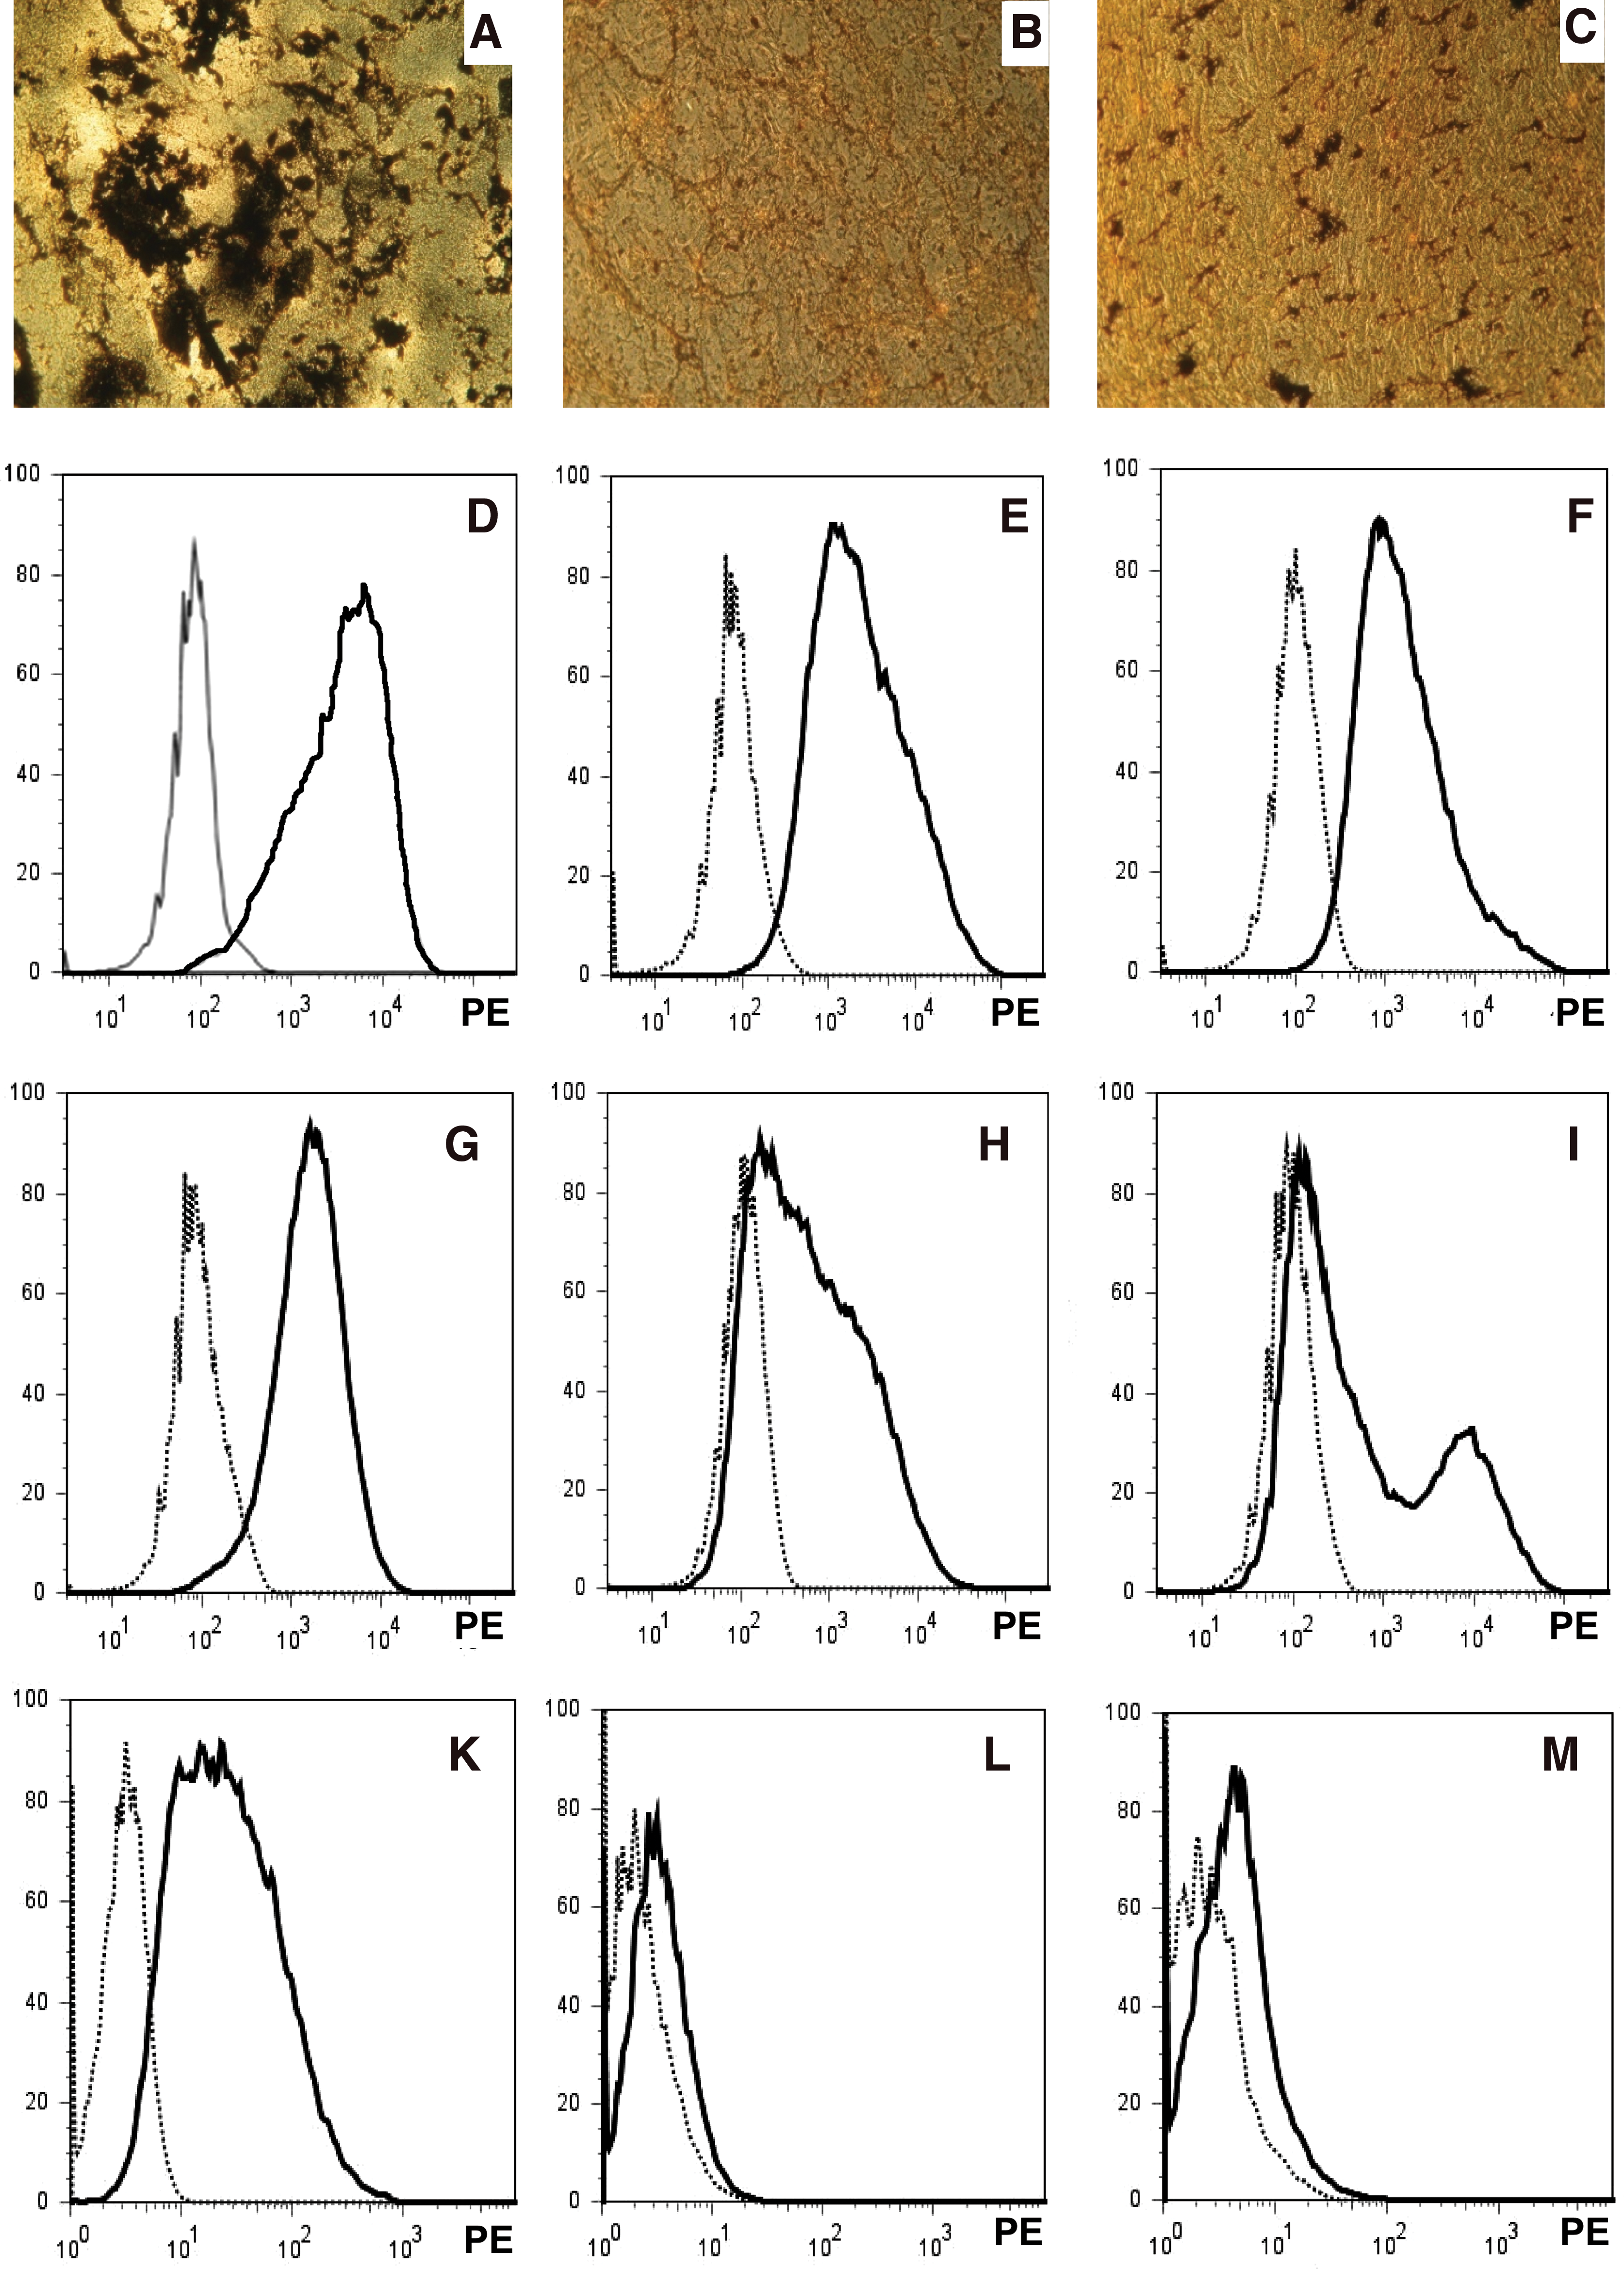
The osteogenic differentiation of bmMSC and pMSC and expression of CD146 MSC were isolated from bone marrow, maternal, and fetal part of term placenta. Osteogenic differentiation was induced in the 2ndP cells, and after 4 weeks of osteogenic induction mineralization indicated success of osteogenic differentiation
To exclude that OB had contaminated our bmMSC preparations, causing the prominent von Kossa staining, or that OB were simply enriched during the osteogenic differentiation process, human OB were stained with anti-CD146 mAB (Fig. 5L). Human synovial fibroblasts served as additional controls (Fig. 5M). Both populations of mature OB and fibroblasts did not express CD146. We conclude that the elevated osteogenic potential of bmMSC is not caused by OB found in our bmMSC preparation.
Expression of AP in MSC before osteogenic differentiation
A possible explanation for the facilitated osteogenic differentiation of bmMSC as determined by more intense von Kossa staining could be that elevated expression of AP in bmMSC a priori. This would promote the deposition of a mineralized extracellular matrix. Therefore, we investigated mRNA expression of AP in bmMSC, pfMSC, and pmMSC in the 2ndP of in vitro culture (Fig. 6A) and found that significantly higher expression of AP encoding transcripts was measured bmMSC (n = 8) compared with pfMSC (37.2-fold, P < 0.001, n = 10) and pmMSC (74.9-fold, P < 0.001, n = 10, from the same placenta). The enzymatic activity of intracellular AP was detected by a substrate precipitation assay (Fig. 6B). The 2ndP bmMSC enriched the dye, whereas 2ndP pfMSC remained pale, and only a few 2ndP pmMSC were stained. OB served as controls (Fig. 6B). Further, release of AP by bmMSC, pfMSC, and pmMSC was determined in supernatants of cells in second passage of in vitro culture (Fig. 6C). Significant differences of AP activity were not measured, indicating that this enzyme was not released but associated with the cellular surface or localized in the cytoplasm of the MSC.
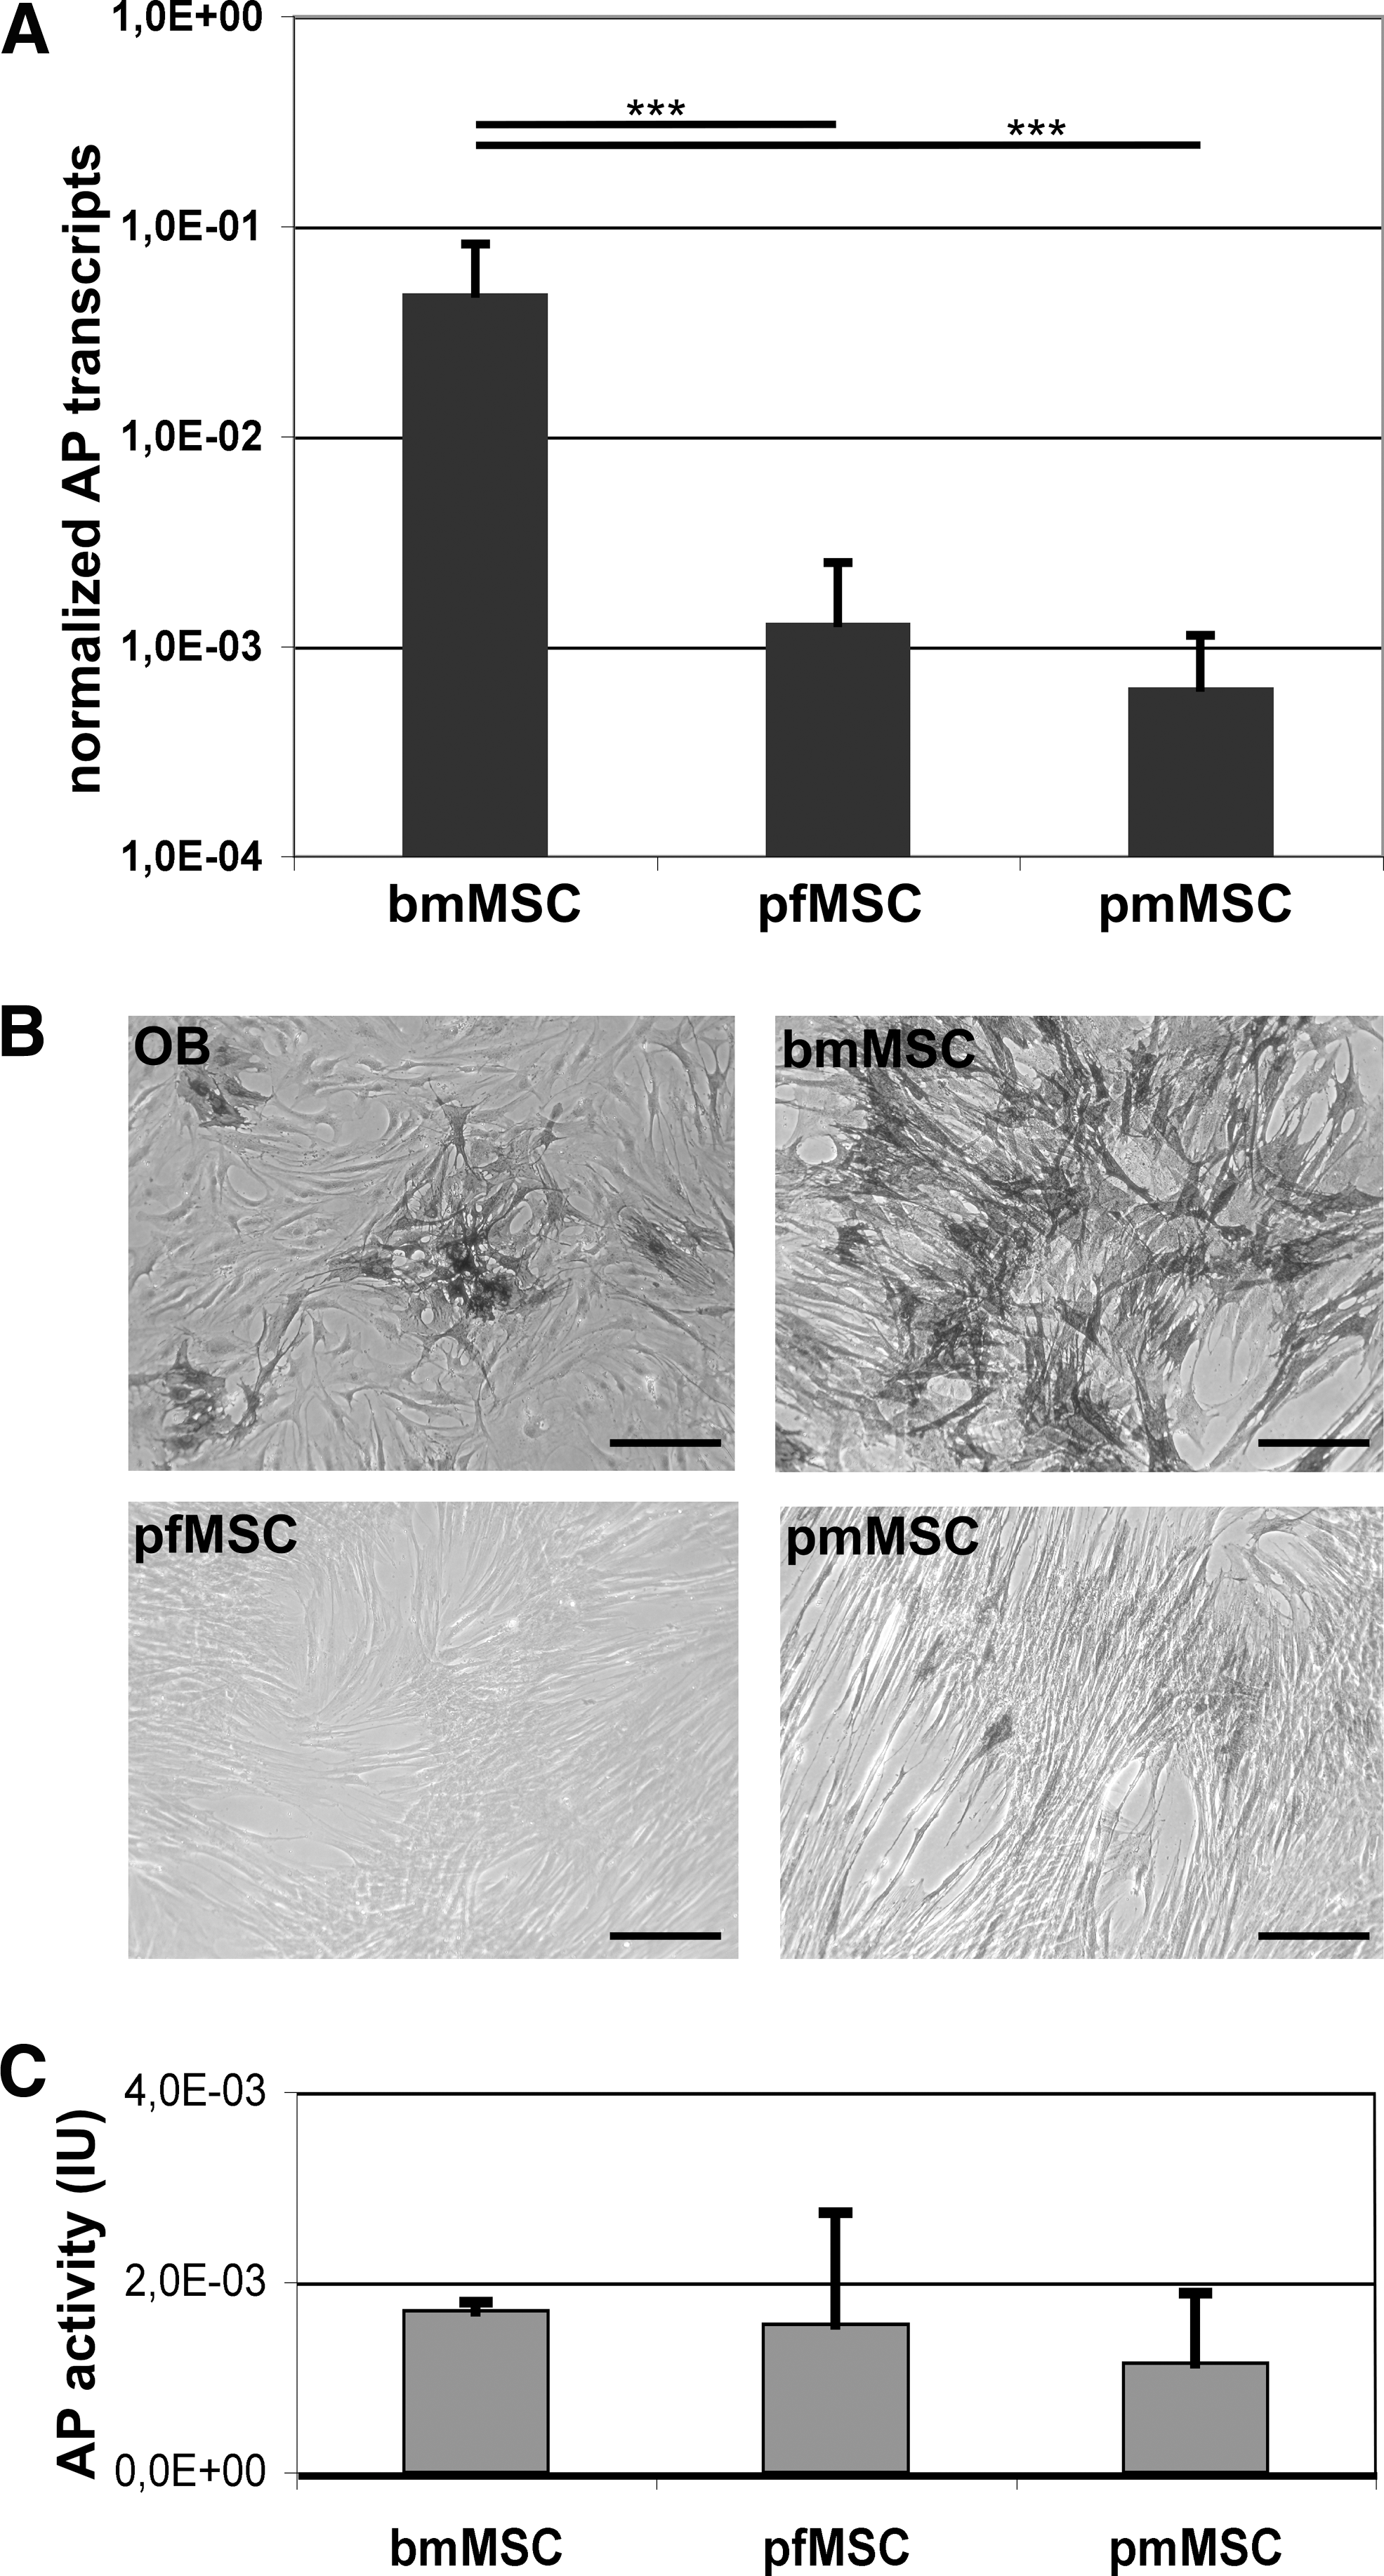
Expression of AP in bmMSC, pfMSC, and pmMSC. MSC were expanded in human fresh frozen plasma plus platelet extract medium, and transcript amounts encoding AP were enumerated by quantitative RT-polymerase chain reaction in 2ndP bmMSC, pfMSC, and pmMSC
In summary, expression of CD146 is typically bright, and expression of AP is significantly higher in bmMSC than in pMSC. This correlated with the improved osteogenic differentiation capacity of bmMSC. Expression of CD146 may therefore be considered as a marker to investigate the osteogenic differentiation potential of MSC.
Discussion
MSC represent a heterogeneous population of cells that share some characteristics [9], but may considerably differ phenotypically and functionally. The pMSC differ from bmMSC not only in their expression of CD10, CD49, CD318, or FZD9 [12,17], but in addition, differ in expression of CD146 and AP, and functionally in their osteogenic differentiation potential. Further, among the pMSC, the osteogenic potential of endometrial, maternal MSC seems to be even lower than that of MSC isolated from the fetal site of placenta.
At present we have no evidence that elevated expression of CD146 on bmMSC is modulated in vitro by the composition of the growth media or cell culture conditions. We expanded bmMSC under exactly identical conditions as pMSC [28]. Variable expression of CD146 (43%–93%) was reported on bmMSC from different donors incubated in medium containing 10% FCS and after enrichment with the D7-Fib antibody [16]. Functional differences were observed between CD146+ and CD146− bmMSC expanded in medium enriched with FCS [22]. We conclude that MSC may differ in their expression patterns of distinct cell surface proteins such as CD146 independent of the growth conditions or media employed. Distinct differences in expression of homeobox genes in MSC isolated from femoral bone marrow compared with MSC from inner organs suggested that functional differences may occur between MSC isolated from different sites of the mammalian body [39].
Although expression of CD146 on MSC seems to be imprinted in the respective environment or niche, the differences in numbers of CD146high MSC observed in cells in early culture passage could have been influenced by the initial yield of MSC isolated from placenta versus bone marrow or the composition of the population. Expression of CD146 was observed on pericytes in placenta [5,26], yet in vitro pMSC were not enriched for CD146high cells, although these cells displayed expression of all typical cell surface antigens associated with MSC [18,19]. The staining of CD146 close to vessels in placenta may also be associated with the vascular endothelium as these cells do express CD146 [40,41]. We therefore cannot exclude that the CD146 signals detected in placenta may be partially associated with endothelial cells, and not only with pericytes. Flat cells resembling endothelial cells rather than spindle-shaped mesenchymal cells were occasionally observed in primary cultures, but the same could be claimed for bmMSC, as endothelial cells were detected in bone marrow as well [42], and endothelial cells modulate the osteogenic differentiation of MSC [43]. However, we did not detect CD34+ cells in any of our passaged bmMSC (n > 20 isolations in 2008–2010) or pMSC (n > 30 isolations in 2008–2010). We therefore conclude that the CD146+ cells described here do not represent endothelial contaminants but represent MSC as defined by the consensus conference [9].
Further, differences in expression of CD146 in bmMSC compared with pMSC could possibly be caused by the fact that the immediate yield of plastic-adherent cells from bone marrow was always considerably lower compared with the yield of cells isolated from term placenta. Therefore, a higher number of population doublings is required to generate sufficient numbers of bmMSC before the experiments. This may influence expression of cell surface antigens and the osteogenic potential of MSC, which increases in time of in vitro expansion [24]. However, for atMSC, a considerable decrease in expression of CD146 with consecutive passages was reported [20], making it very unlikely that bmMSC gained expression of CD146 over time.
Among individual pMSC preparations, different MFI and histograms of CD146 expression were found. In most cases pfMSC and pmMSC displayed a peak profile with an MFI close to 103 and clearly below 5 × 10³, whereas the MFI of CD146 on most bmMSC was about 10-fold higher. The atMSC share this rather low expression of CD146 with pMSC, and in atMSC CD146high and CD146low subsets were recorded [7]. In our study, some pMSC displayed histograms indicating a wide range of expression of CD146. In samples from other donors even 2 discrete subsets, CD146low and CD146high MSC, were observed. Differences in expression of CD146 on bmMSC of individual donors have been reported [16], but the regulatory mechanisms controlling it have not yet been explored. An in-depth investigation of the regulation of CD146 in MSC is beyond the scope of this study.
It seems that expression of CD146 on MSC is inherited at least in part from the tissue of origin, and not an artifact generated by our techniques for isolation of the cells and their expansion in vitro. The latter is supported by the finding that primary culture and early passage bmMSC expressed considerably more transcripts encoding AP compared with pMSC and AP activity was considerably higher in bmMSC compared with pMSC. Comparably, expression of AP as detected by the mAB TNAP was higher in bmMSC ex vivo than in pMSC ex vivo [12,13,23].
In summary, we report that pMSC differ considerably from bmMSC in their expression of CD146 and AP and this correlates with a reduced osteogenic differentiation potential of pMSC. We conclude that pMSC are less suited for bone regeneration compared with bmMSC, but pMSC may serve as alternative or even superior cellular basis for other applications, including cardiomyogenic, myogenic, hepatic, pancreatic, or immunological exertions [44].
Footnotes
Acknowledgments
We thank Tanja Abbruzzese, Elisabeth Kienzle, and Stephanie Zug for their excellent technical support; Kai Nehr for preparing the artwork; and Melanie L. Hart, Ph.D., for her invaluable support in writing this article. This project was supported in part by grants to W.K.A. (BMBF #313755, Baden-Württemberg-Stiftung) and in part by institutional funding.
Author Disclosure Statement
The authors declare that there are no actual or potential conflicts of interest to be disclosed for any of the authors of this investigation.