
Abstract
Thioredoxin (TRX) is a ubiquitous redox protein that is involved in numerous biological functions, including the first unique step in DNA synthesis. TRX provides control over a number of transcription factors affecting cell proliferation and death through a mechanism referred to as redox regulation. In mammals, there are at least 3 members of the TRX family: TRX1, TRX2, and sperm TRX. To investigate the role of TRX1 and TRX2 in human adipose tissue-derived mesenchymal stem cells (hADSC), we modulated TRX1 and TRX2 expressions in hADSC using a lentiviral gene transfer system and small interfering RNA technique. Reverse transcription-polymerase chain reaction analysis confirmed the changes in expression of TRX1 and TRX2 in lentivirus-transduced or small interfering RNA-transfected cells. Although overexpression of TRX1 and TRX2 did not affect the differentiation of hADSC into adipogenic and osteogenic lineages, it increased the proliferation of hADSC compared with control lentivirus-transduced cells, decreased reactive oxygen species production, and inhibited oxidant-induced cell death. Downregulation of TRX1 and TRX2 inhibited cell proliferation. The treatment of U0126 blocked TRX-induced increase in cell proliferation. Overexpression of TRX1 and TRX2 increased ERK1/2 phosphorylation, nuclear factor-kappaB activation, and β-catenin/Tcf promoter activities and inhibited lucine zipper tumor suppressor 2 expression. On the contrary, downregulation of TRX1 and TRX2 expression induced inhibition of ERK1/2 phosphorylation, nuclear factor-kappaB activation, and β-catenin/Tcf promoter activities and increased lucine zipper tumor suppressor 2 expression. Activation of Wnt signal increased ERK1/2 activities in hADSC. These results indicated that TRX1 and TRX2 regulate the proliferation and survival of hADSC; these processes are mediated by the activation of ERK1/2.
Introduction
T
Mitochondria are the major source of reactive oxygen species (ROS) generated during physiological respiration and under pathological conditions, such as inflammation, in response to cytokines [13,14]. Therefore, TRX2 plays a crucial role in protection against oxidative stress and in regulating the mitochondrial apoptosis signaling pathway [15 –17].
Mesenchymal stem cells (MSCs) differentiate not only into cells of the same mesenchymal lineage, such as osteocytes, cartilage, and adipocytes, but also into cells of other lineages, such as neuronal cells and liver cells [18 –21]. MSC are present in virtually all tissues, including bone marrow, adipose tissue, and muscle [22]. Therefore, MSCs have been considered ideal for cell therapy. Human adipose tissue-derived mesenchymal stem cells (hADSC) share many of the characteristics of their counterparts in the bone marrow, including their extensive proliferative potential and the ability to differentiate toward adipogenic, osteogenic, chondrogenic, and myogenic lineages [23 –25]. The role of TRXs in MSC has not been determined. Therefore, in this study, we investigated the role of TRX1 and TRX2 in proliferation and differentiation of hADSC and their signaling pathways.
Materials and Methods
Cell culture
All protocols involving human subjects were approved by the institutional review board of the Pusan National University. hADSC were cultured as described by Lee et al. [26]. We obtained adipose tissues from 3 different patients (a 50-year-old man, a 44-year-old man, and a 56-year-old woman) who had undergone abdominoplasty, with informed consent. Briefly, adipose tissues were digested at 37°C for 30 min with 0.075% type I collagenase. The enzyme activity was neutralized with α-modified Eagle's medium containing 10% fetal bovine serum, and the mixture was centrifuged at 1,200 g for 10 min to obtain a pellet. The pellet was incubated overnight at 37°C/5% CO2 in a control medium (α-modified Eagle's medium, 10% fetal bovine serum, 100 U/mL penicillin, and 100 μg/mL streptomycin). After incubation, the tissue culture plates were washed to remove any residual nonadherent cells and were maintained at 37°C/5% CO2 in the control medium.
Lentiviral vector construction and transduction
The cDNA for human TRX1 and TRX2 was generated with RNA from hADSC by using the reverse transcription–polymerase chain reaction (RT-PCR) method (TRX1 5′-CGCGGATCCATGGTGAAGCAGATCG-3′, 5′-CCGCTCGAGTTAGACTAATTCATTA-3′, TRX2 5′-CGCGGATCCATGGCTCAGCGACTTC-3′, 5′-CCGCTCGAGTCAGCCAATCAGCTTC-3′). The human TRX1 and TRX2 were cloned by using the pENTR1A (Invitrogen), according to the manufacturer's guidelines. The TRX1 and TRX2 of pENTR1A-TRX1 and TRX2 were recombined into pLenti6/V5 using LR clonase (Invitrogen), resulting in the pLenti6/V5-TRX1 and TRX2 plasmids. The plasmids were sequenced with the primer to verify the sequence of the constructed plasmid. Replication-defective lentiviruses were produced by transient transfection of 293T cells using Lipofectamine Plus (Invitrogen), lentivirus vectors, and packaging mix (Invitrogen). Two samples of viruses were harvested at 48 and 72 h after transfection, filtered through Millex-HV 0.45 μm PVDF filter (Millipore), and kept at −80°C until use. hADSC were transduced by exposing the cells for 6 h to dilutions of viral supernatant in the presence of polybrene (5 μg/mL). The stable transductants were selected by culture in blasticidin (10 ng/mL; Invitrogen).
RT-PCR analysis
The total cellular RNA was isolated from the hADSC and reverse-transcribed using conventional protocols. PCR amplification was performed using the following primer sets: GAPDH 5′-TCCATGACAACTTTGGTATCG-3′, 5′-TGTAGCCAAATTCGTTGTCA-3′, TRX1 5′-CGCGGATCCATGGTGAAGCAGATCG-3′, 5′-CCGCTCGAGTTAGACTAATTCATTA-3′, TRX2 5′-CGCGGATCCATGGCTCAGCGACTTC-3′, 5′-CCGCTCGAGTCAGCCAATCAGCTTC-3′, lucine zipper tumor suppressor 2 (LZTS2) 5′-CTGTGTCCTGGAAGGAAAGC-3′, 5′-CTCCCACTTGGTCTCCTCAA-3′. wnt3 5′-CTTTGCAGTGACACGCTCAT-3′, 5′-GTGCTTCTCCACCACCATCT-3′. All of the primer sequences were determined using established GenBank sequences. PCR amplifications were performed in duplicate. GAPDH was used as control to assess PCR efficiency. Quantitative analysis of transcript abundance was assessed relative to GAPDH expression using image analysis software (Image Gauge version 3.0).
Induction of differentiation
Adipogenic and osteogenic differentiation was performed as previously described [26].
Cell proliferation assay
For the proliferation assay, native hADSC, LV, LV-TRX1, and LV-TRX2 or siControl (nontargeting duplex oligo), siTRX1, and siTRX2 cells were harvested and plated in a 6-well plate at a density of 1 × 10⁴ cells/well. The total cell number and the proportion of dead cells were measured with a hemocytometer by direct counting at 2, 4, and 6 days after plating. For colony-forming unit assay, 60 cells were transferred to a 100-mm plate. The number of cells in each colony was counted.
Cell viability
The lentivirus-transduced hADSC were plated at a density of 5 × 10⁴ cells/well in 6-well plates, and cells were incubated for 24 h in serum conditions with H2O2 (0–1 mM). Cell viability was measured by 4% trypan blue exclusion. The number of viable and nonviable cells was counted using a hemocytometer under light microscopy. Cells failing to exclude the dye were considered nonviable.
Measurement of ROS
The intracellular generation of ROS was measured using 2′,7′-dichlorofluorescein diacetate (DCF-DA). The nonfluorescent ester penetrates into the cells and is hydrolyzed to DCF by the cellular esterases. The probe (DCF) is rapidly oxidized to the highly fluorescent compound 2′,7′-dichlorofluorescein (DCF) in the presence of cellular peroxidase and ROS such as hydrogen peroxide or fatty acid peroxides. Cells were plated at a density of 5 × 10⁴ cells/well in 6-well plates, and preincubated in serum-free medium with 30 μM DCF-DA for 1 hour at 37°C. DCF fluorescence intensities of cells were assayed using FASCan Becton Dickinson Flow Cytometer (Becton-Dickinson Bioscience, San Jose, CA, USA), and data were analyzed with CELLQuest software.
Small interfering RNA
Small interfering RNA (siRNA) duplex oligo (on-TARGET plus SMART pool; Dharmacon) targeting gene (TRX1, TRX2, and β-catenin) mRNA or nontargeting duplex oligo (on-TARGET plus siCONTROL; Dharmacon) as a negative control was transfected using DharmaFECT Transfection Reagent.
Reporter gene assay
All transient transfections were performed with Lipofectamine Plus Reagent (Invitrogen). The transient transfections were performed using pTOP-Flash (containing triple TCF/LEF1 binding sites, the basic thymidine kinase promoter, and firefly luciferase reporter gene), pNF-κB-Luc [containing the nuclear factor-kappaB (NF-κB) binding promoter], and pCMV-β-Gal plasmid vector (for β-galactosidase expression). The cells were lysed in lysis buffer at 48 h after transfection (containing 0.25 M Tris, 2 mM dithiothreitol (DTT), 2 mM 1,2-diaminocyclohexane-N,N,N′,N′-tetraacetic acid, 10% glycerol, and 1% Triton X-100). Subsequently, luciferase activity was measured by the Luciferase Assay System (Promega). β-Galactosidase activity was determined using the β-galactosidase Enzyme Assay System (Promega). Luciferase activity was normalized by β-galactosidase activity. Transfections were conducted in duplicate, and all experiments were repeated 4 times.
Western blot analysis
The cells were lysed in total cell lysis buffer (containing 210 mM mannitol, 70 mM sucrose, 5 mM Tris, pH 7.5, and 1 mM ethylenediaminetetraacetic acid), and their protein content was determined with a protein assay kit (Bio-Rad Laboratories). Proteins were loaded on 10% sodium dodecyl sulfate-polyacrylamide gel, electrotransferred to nitrocellulose membranes (Hybond-ECL; Amersham Pharmacia Biotech), and probed with monoclonal antibodies [GAPDH, TRX1, IκB-α (C-15), total p44/42 Map kinase (Erk1/Erk2), antiphospho-ERK (Thr202/204); Cell Signaling Technology; TRX2; Abcam; β-catenin; BD Biosciences]. Immunoreactive bands were detected using anti-mouse and anti-rabbit peroxidase-conjugated secondary antibody (Amersham Pharmacia Biotech) and visualized by enhanced chemiluminescence (ECL detection kit; Amersham Pharmacia Biotech).
Statistical analysis
All results are presented as means ± standard error of the mean. Comparisons between groups were analyzed via t tests (2-sided) or analysis of variance for experiments with >2 subgroups. Post-hoc range tests and pairwise multiple comparisons were conducted using the t test (2-sided) with Bonferroni adjustments. Probability values of P < 0.05 were considered statistically significant.
Results
Overexpression of TRX1 and TRX2 on the differentiation and proliferation of hADSC
To investigate the role of TRX1 and TRX2 in hADSC, we overexpressed TRX1 and TRX2 in hADSC using a human immunodeficiency virus-derived lentiviral gene transfer system. Transduced cells were selected by treatment with blasticidin and analyzed for expression of the transgene TRX1 and TRX2 with RT-PCR analysis. We observed significantly higher TRX1 and TRX2 expressions in lentivirus-transduced TRX1 and TRX2 cells (LV-TRX1 and LV-TRX2) than in the control lentivirus-transduced cells (LV hADSC) (Fig. 1B). The overexpression of TRX1 and TRX2 at protein levels was confirmed by western blot using the specific antibodies (Fig. 1C). RT-PCR and western blot analysis showed that TRX1 overexpression increased TRX2 expression and vice versa (Fig. 1B, C). Overexpression of TRX1 and TRX2 did not affect cell morphology (Fig. 1A).
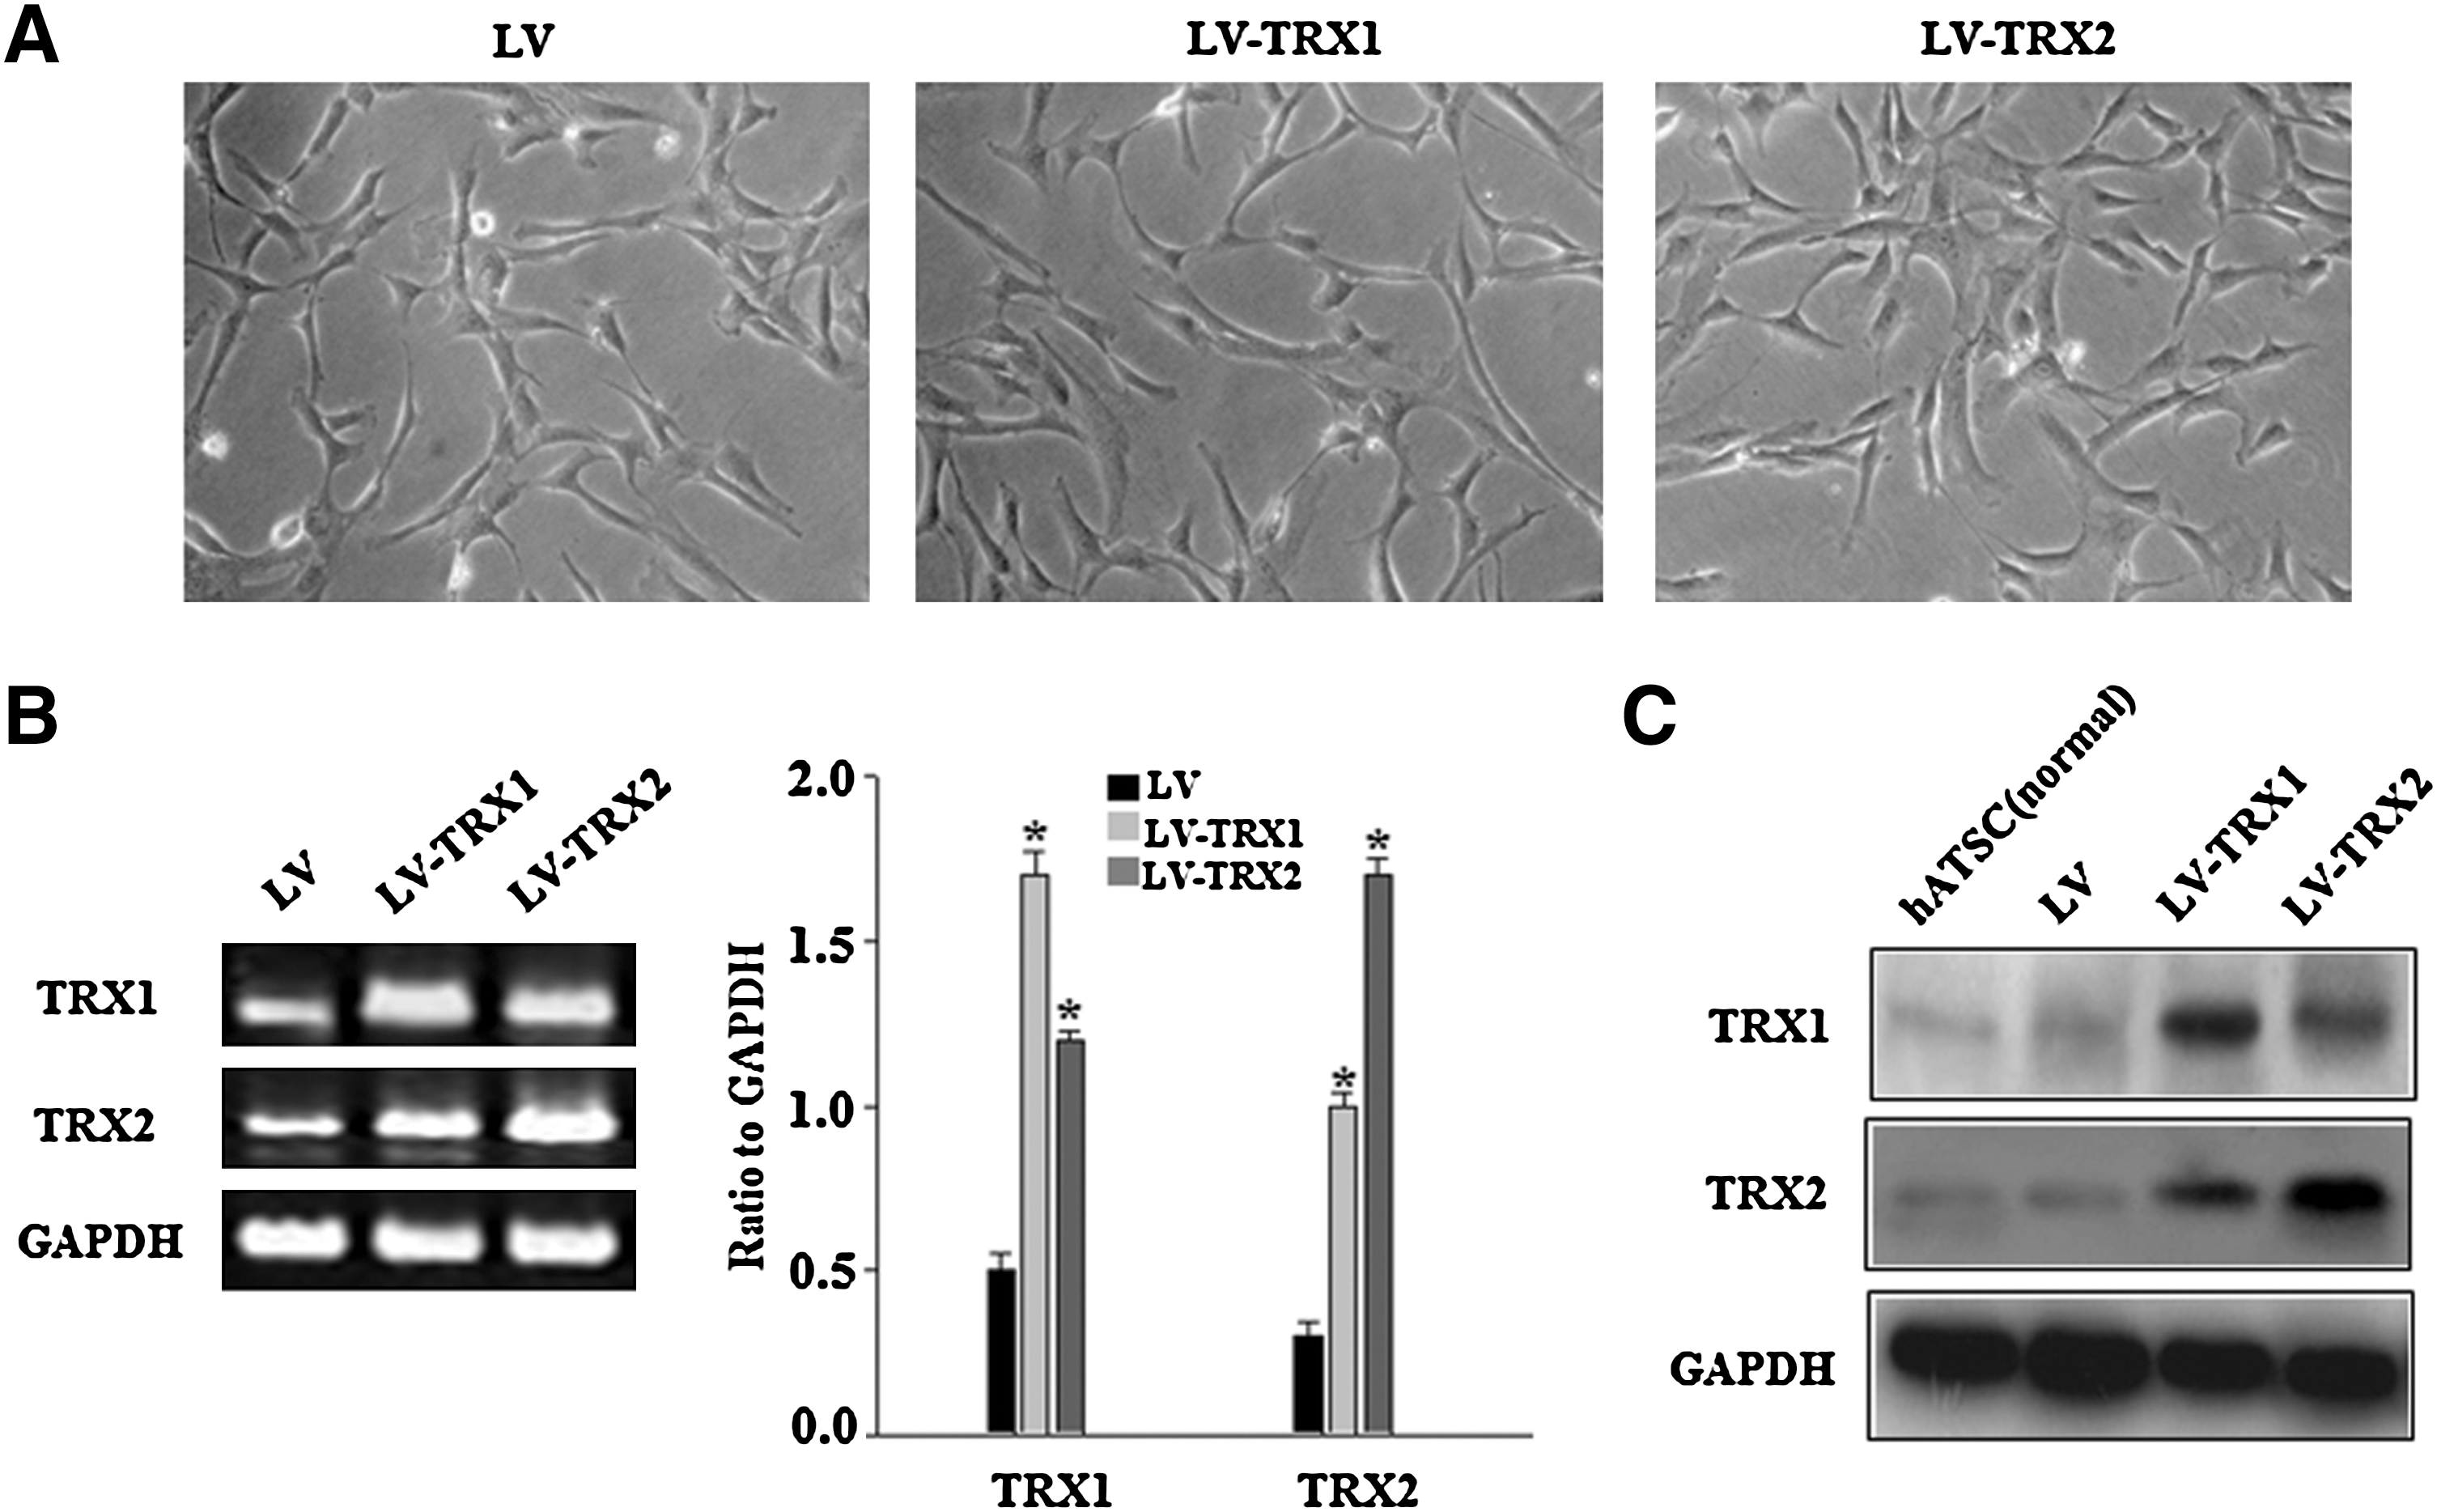
Overexpression of thioredoxin 1 (TRX1) and TRX2 on human adipose tissue-derived mesenchymal stem cells (hADSC).
To determine the effect of overexpression of TRX1 and TRX2 on differentiation of hADSC, transduced hADSC were differentiated into adipogenic and osteogenic lineages. Both adipogenesis and osteogenesis were not affected in lentivirus-transduced TRX-overexpressing cells (Fig. 2A, B). We next examined the effect of overexpression of TRX1 and TRX2 on proliferation of hADSC by colony-forming unit assay. Higher numbers of cells per colony were observed for LV-TRX1 and LV-TRX2 cells compared with LV hADSC. We also determined the effect of overexpression of TRX1 and TRX2 on hADSC proliferation by total cell counting. We observed higher numbers of LV-TRX1 and LV-TRX2 cells than LV-hADSC (Fig. 3A, B).

Effect of TRX1 and TRX2 overexpression on differentiation of hADSC. Lentivirus-transduced hADSC were grown to confluence and then induced to osteogenic or adipogenic differentiation in differentiation media.
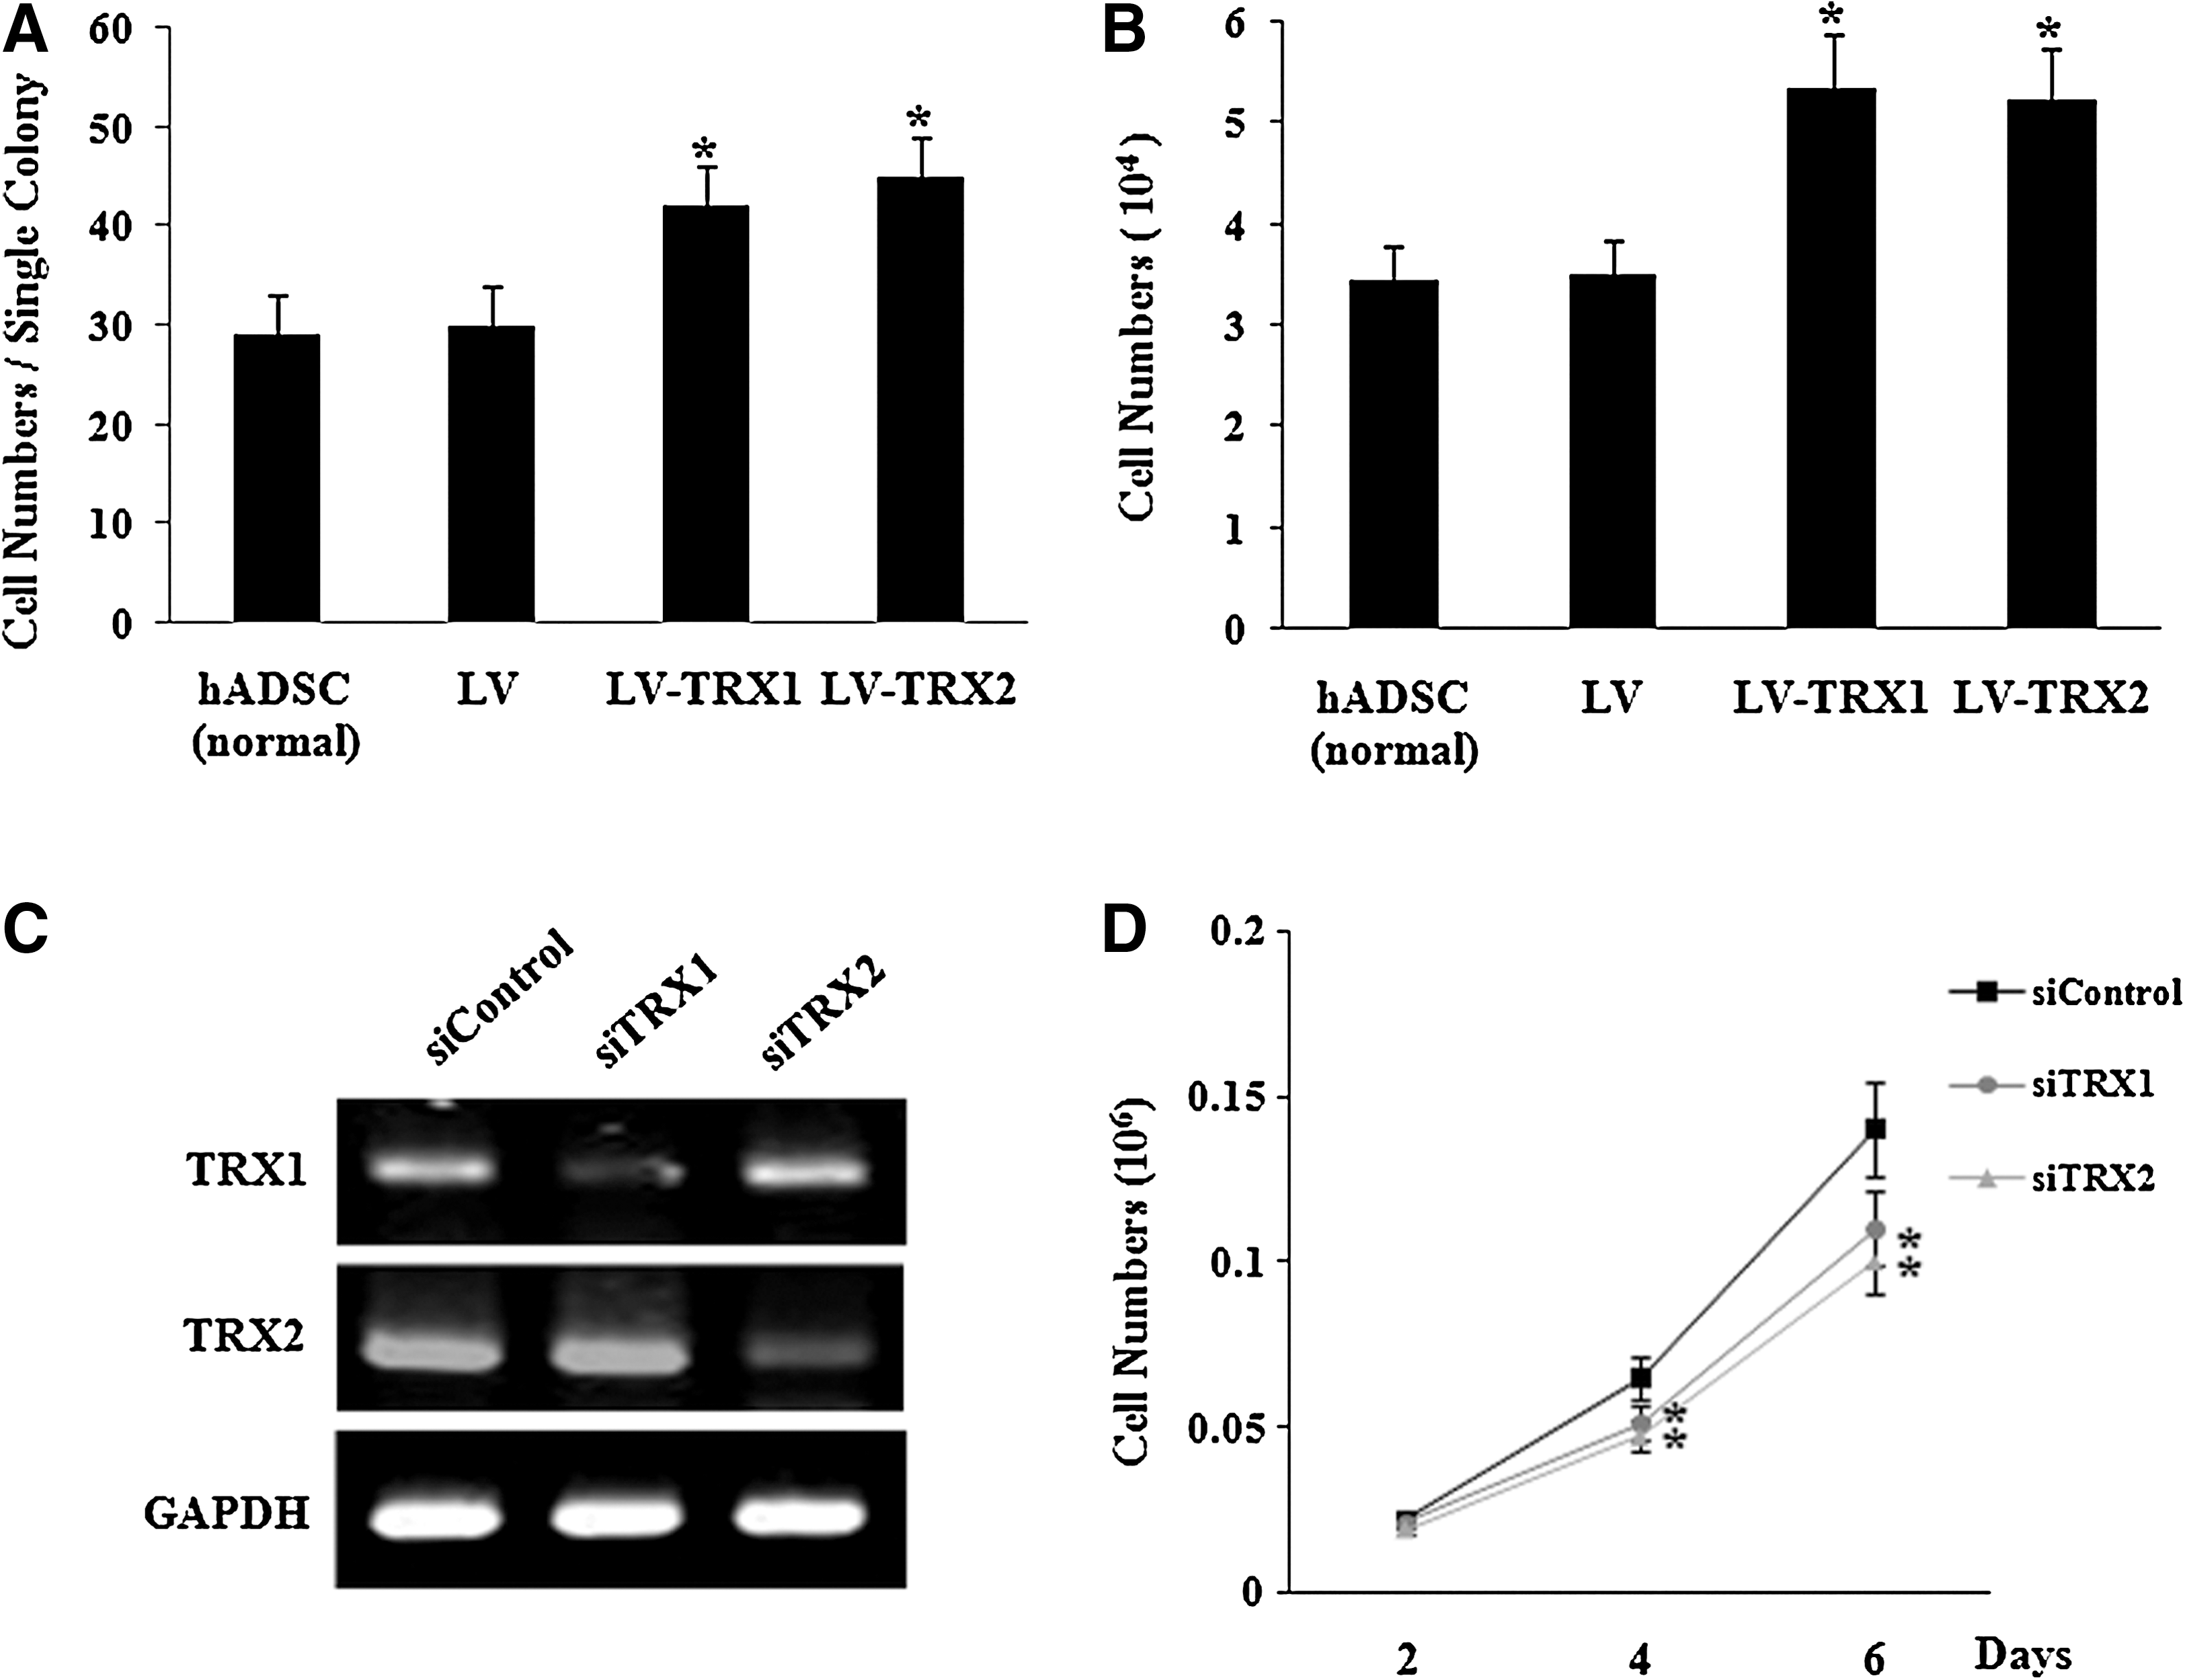
Effect of TRX1 and TRX2 overexpression on proliferation of hADSC.
To further confirm the role of TRXs in the proliferation of hADSC, we determined the effect of TRX1 and TRX2 downregulation by the interference technique using siRNA transfection. RT-PCR analysis showed that introduction of TRX1 and TRX2 siRNA oligonucleotides effectively inhibited the expression of TRX1 and TRX2 in hADSC (Fig. 3C). In a proliferation assay, TRX1 and TRX2 siRNA-transfected hADSC displayed lower cell numbers than did control oligonucleotide-transfected hADSC at 2, 4, and 6 days after plating 104 cells/well (Fig. 3D).
ROS generation and survival against oxidative damage in TRX1- and TRX2-overexpressed hADSC
TRXs have been reported to play a crucial role in protection against oxidative stress [15 –17]. Therefore, we determined the effect of overexpression of TRX1 and TRX2 on ROS generation in hADSC. Basal ROS production was inhibited in LV-TRX1 and LV-TRX2 cells compared with LV-hADSC (Fig. 4A, B). To determine the effect of overexpression of TRX1 and TRX2 on the survival of hADSC under oxidative stress, LV-TRX1 and LV-TRX2 cells were incubated for 24 h in serum conditions with various concentrations of H2O2 (0–1 mM). Overexpression of TRX1 and TRX2 exhibited greater protection against oxidative stress compared with control cells (Fig. 4C).
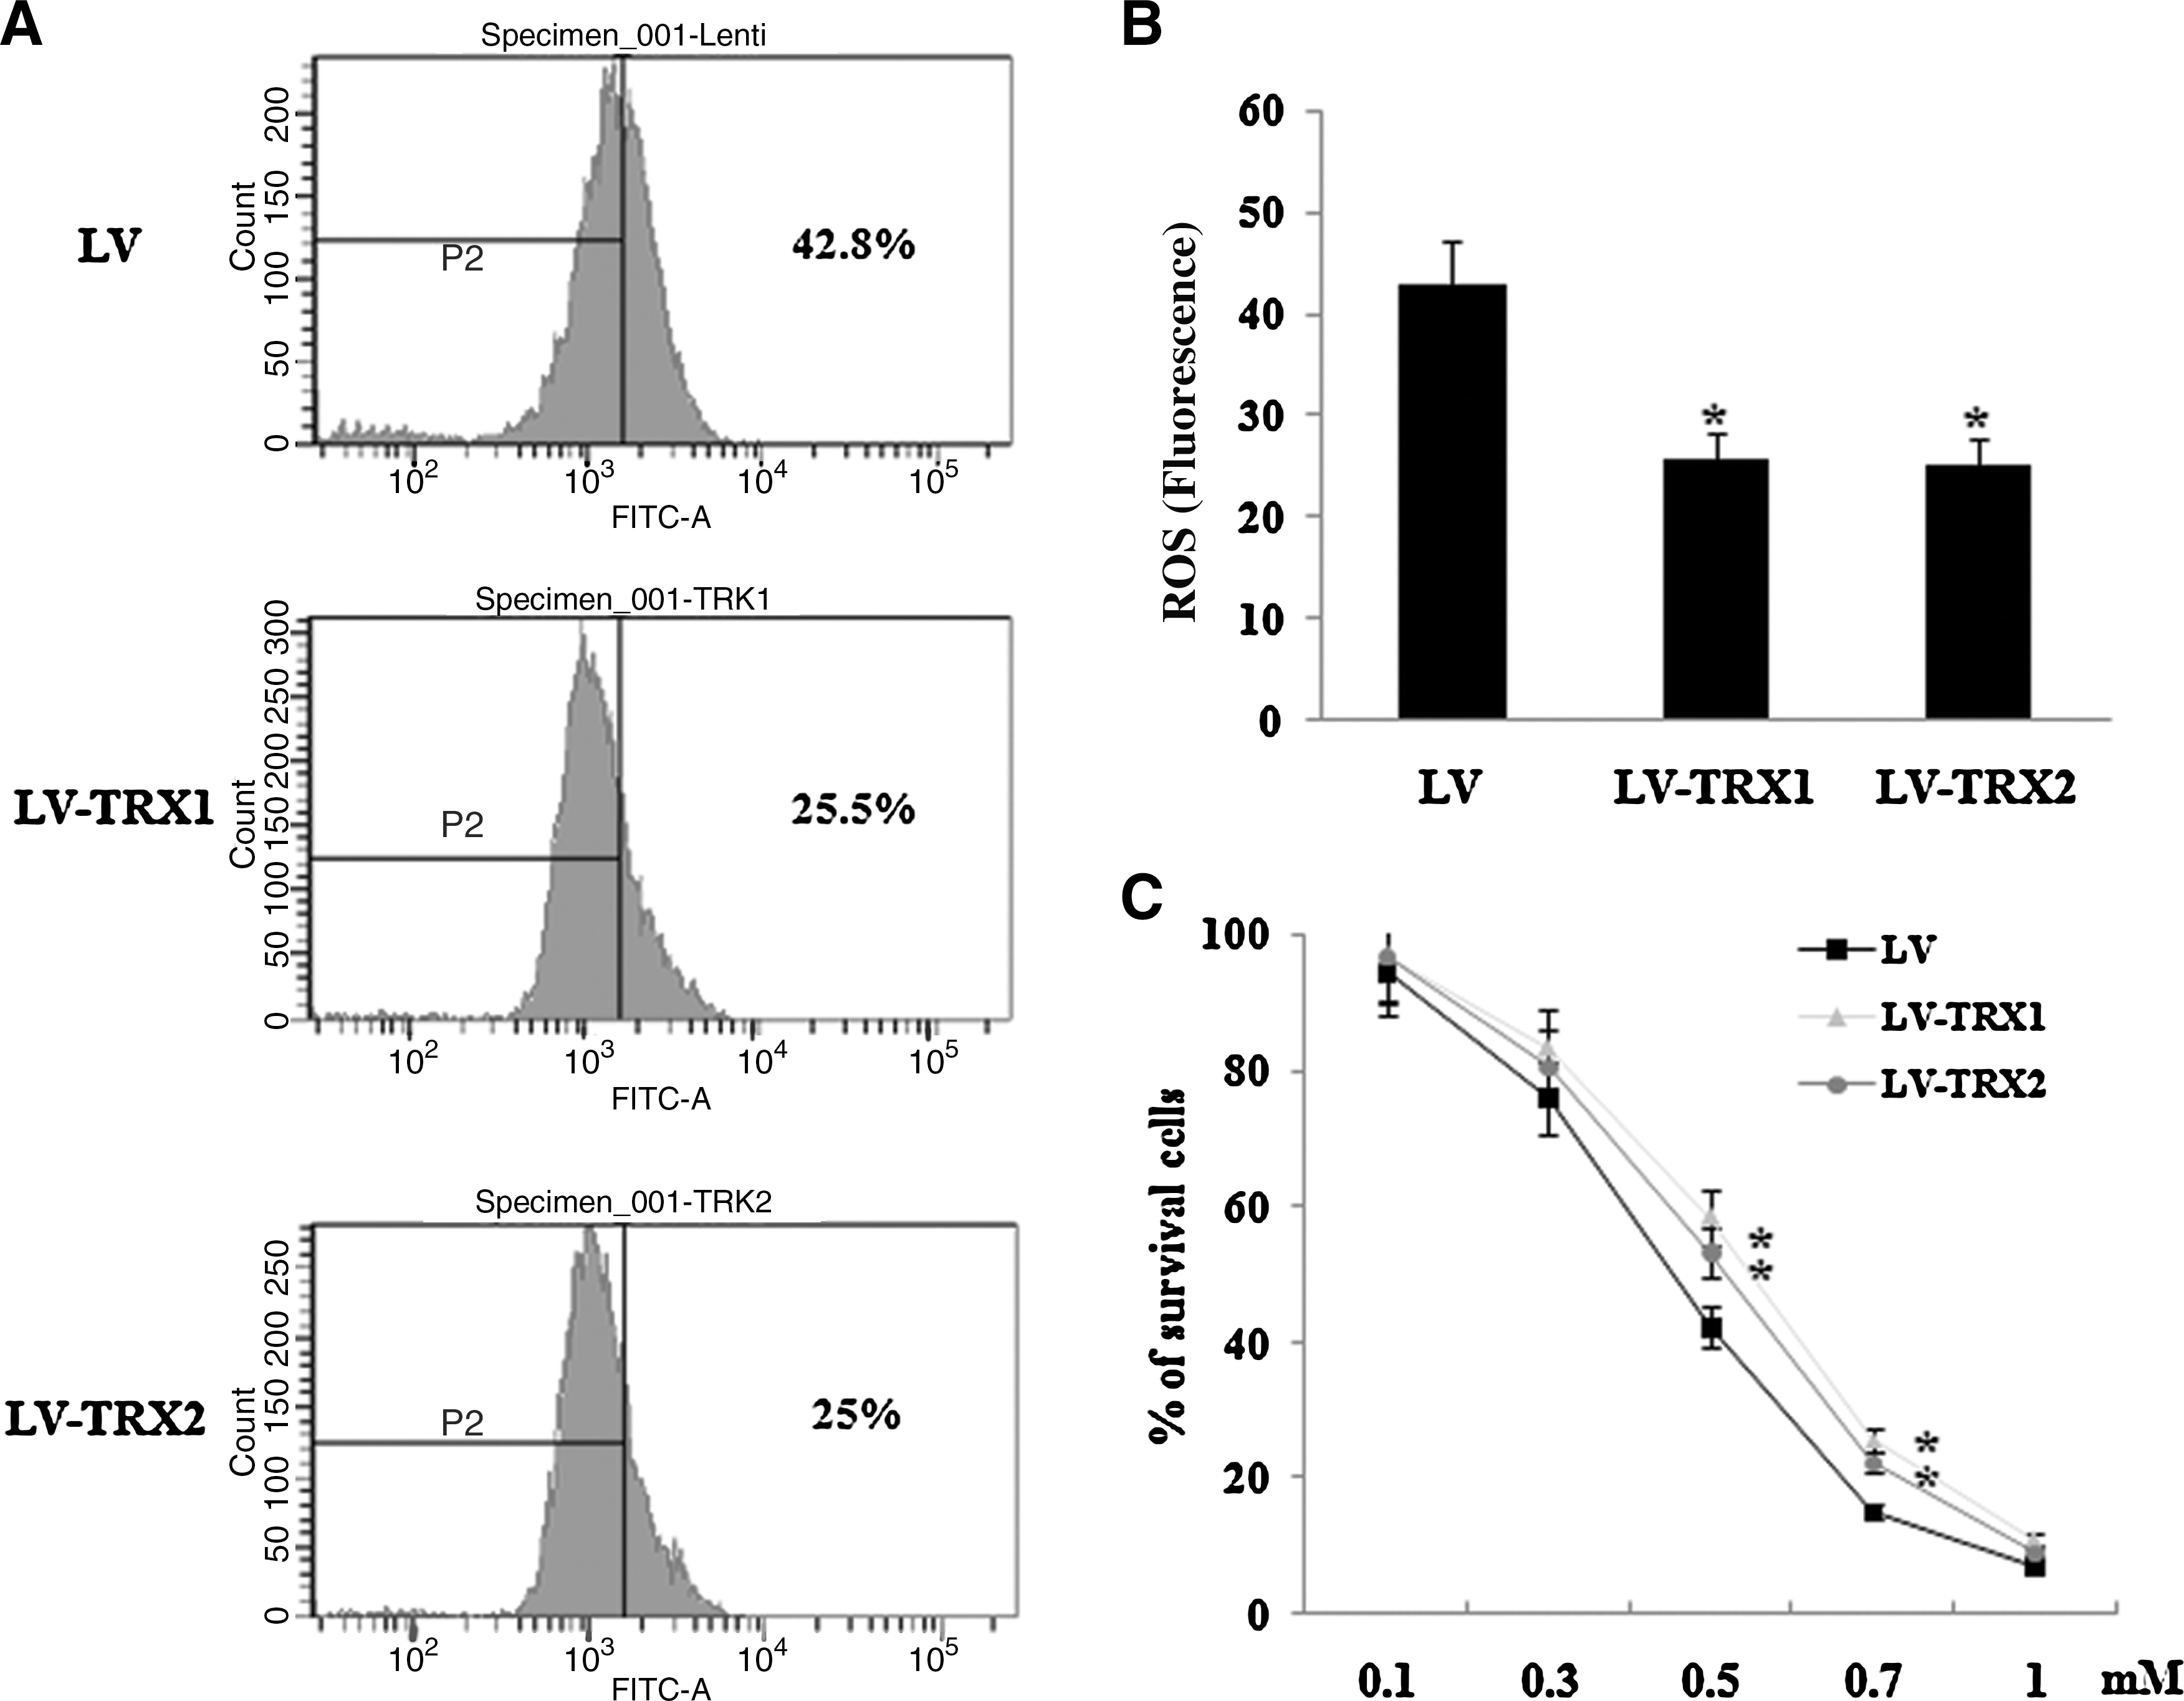
Reactive oxygen species (ROS) generation and survival against oxidative damage in TRX1- and TRX2-overexpressed hADSC.
Role of ERK activation on TRX1- and TRX2-induced proliferation of hADSC
We demonstrated that the modulation of TRX1 and TRX2 affects the proliferation of hADSC. To understand the signaling mechanisms, we determined whether TRX1 and TRX2 activated the ERK1/2 pathway. Basal ERK1/2 phosphorylation was increased in TRX1- or TRX2-overexpressed cells (Fig. 5A) and was decreased by siRNA-induced downregulation of TRX1 and TRX2 (Fig. 5B). Then, we examined the effect of U0126, an inhibitor of ERK signaling, on the proliferation of TRXs-overexpressed hADSC. Treatment with 10 μM U0126 (an ERK inhibitor) blocked TRX1- and TRK2-induced increase in hADSC proliferation (Fig. 5C).
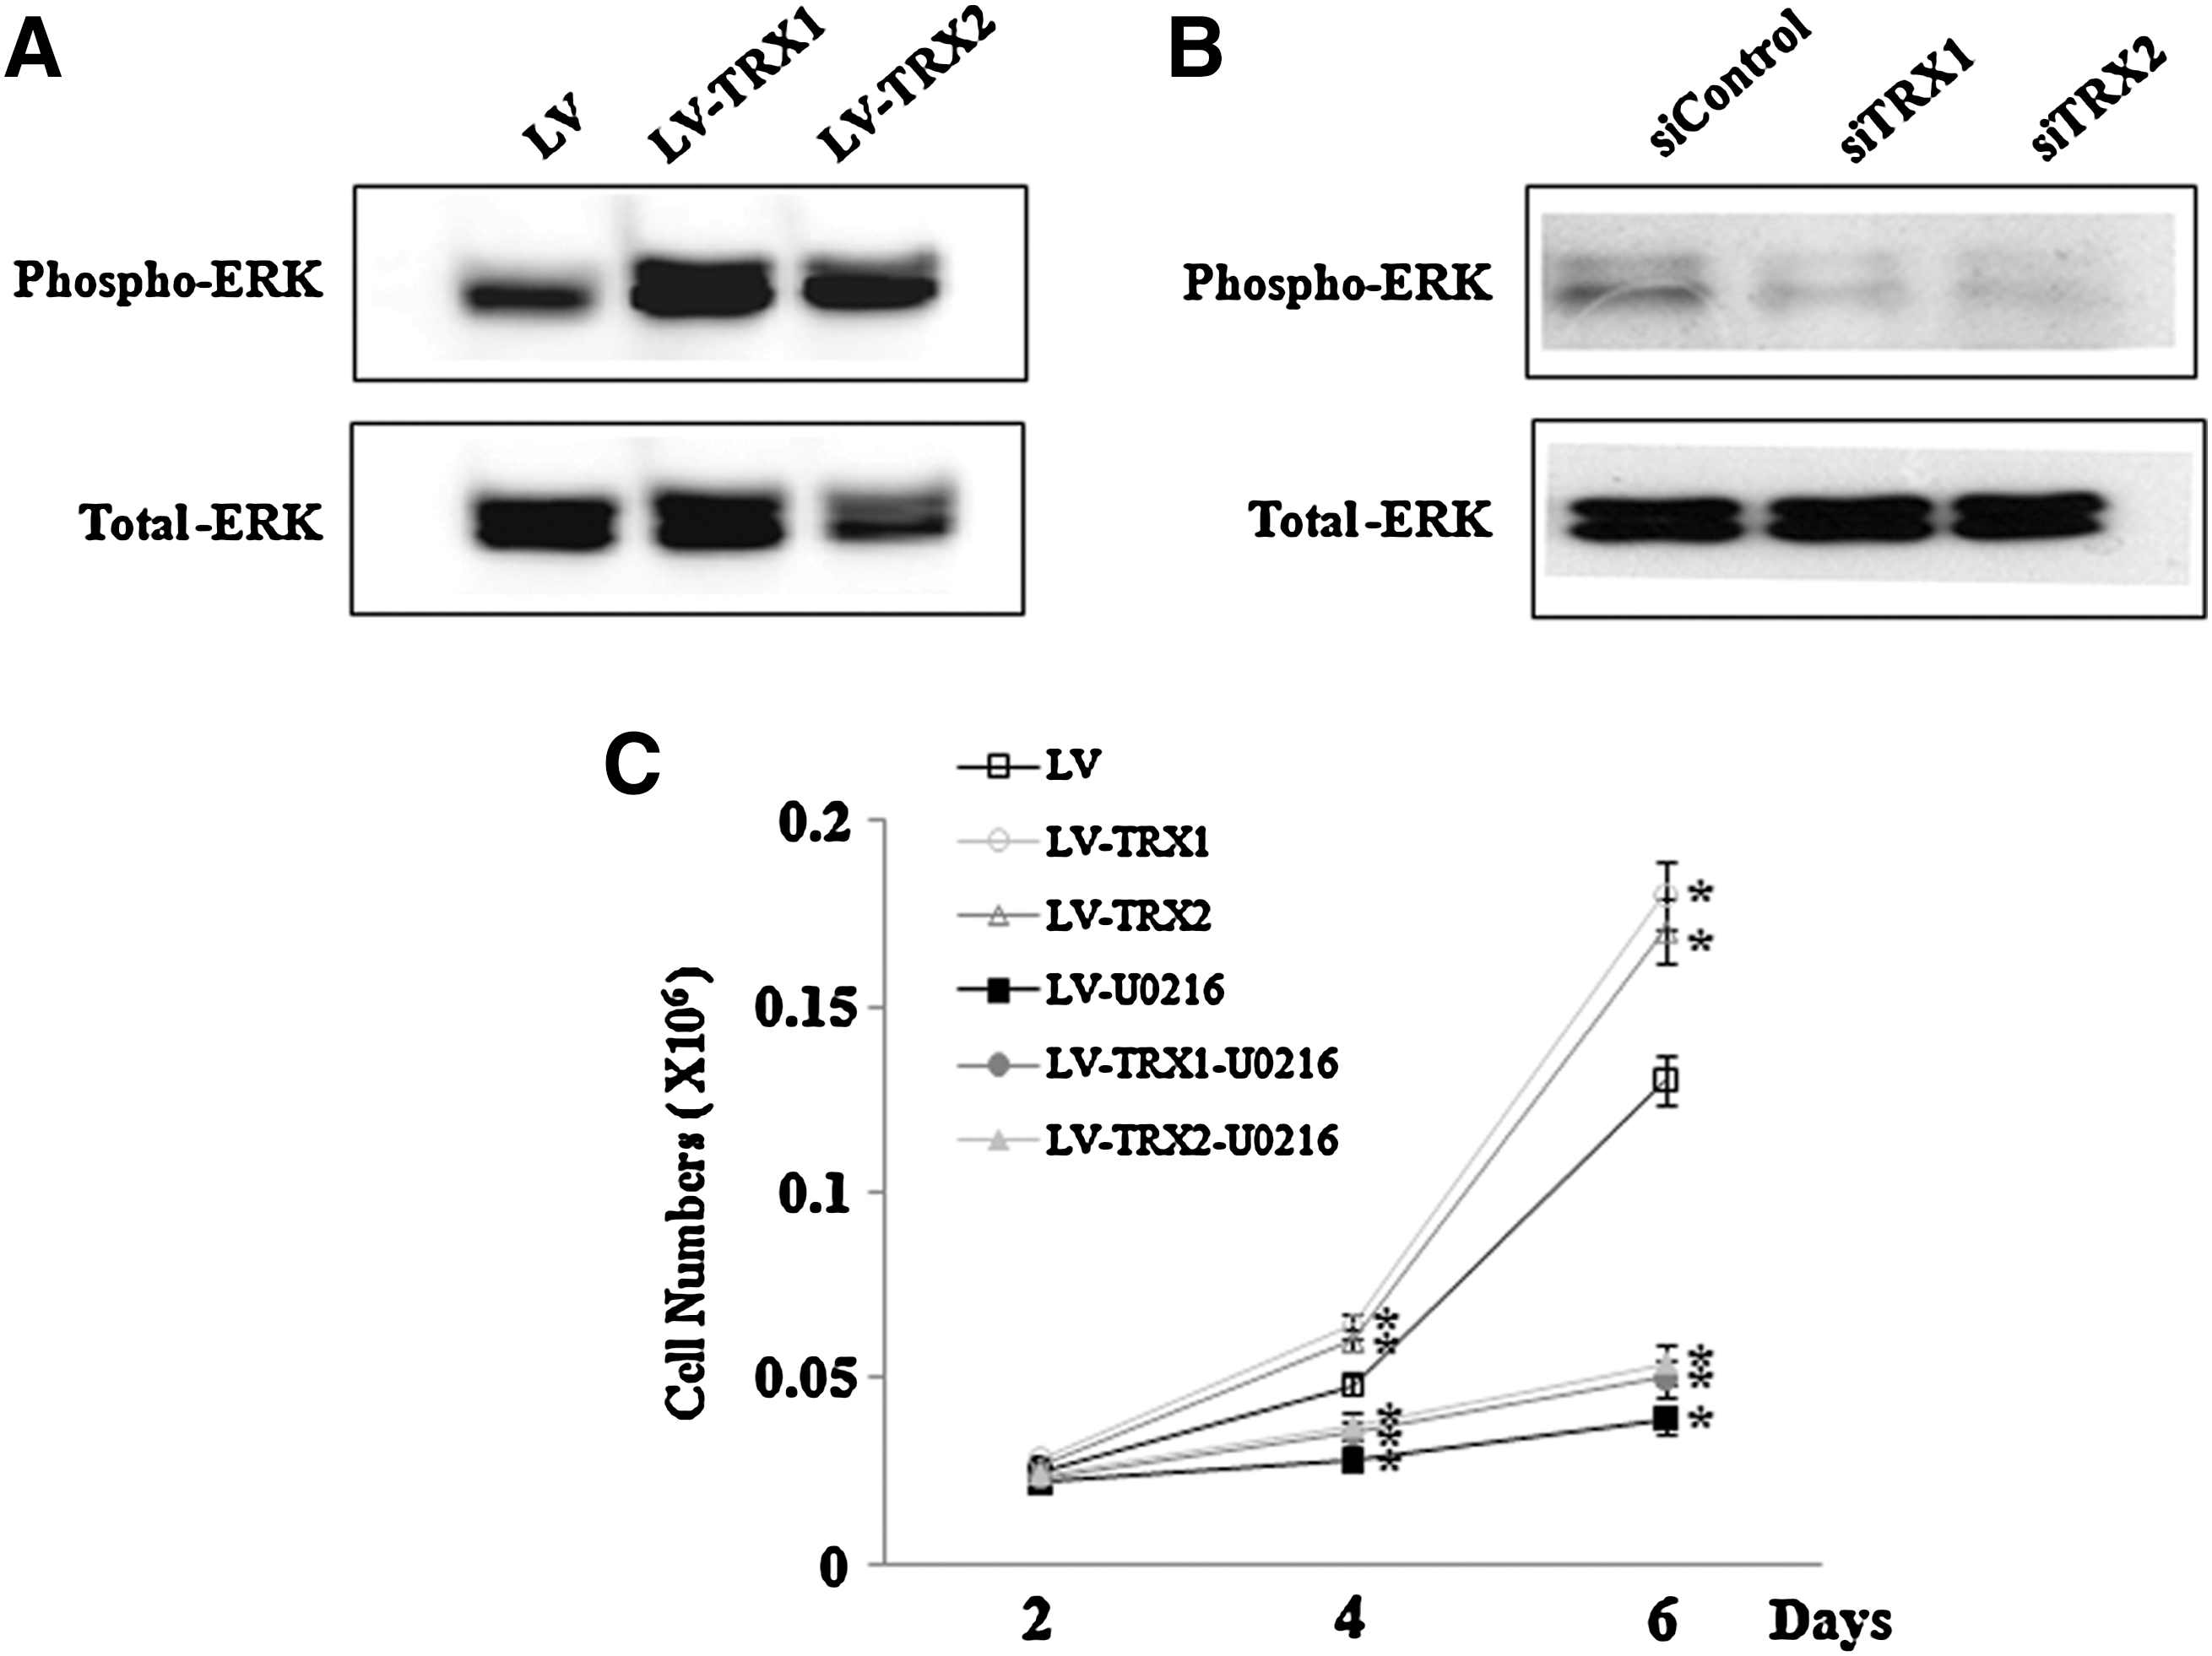
Effect of ERK inhibition on TRX1- and TRX2-induced proliferation of hADSC.
Effects of modulation of TRX1 and TRX2 expression on NF-κB and β-catenin/Tcf signaling in hADSC
TRX has been reported to activate NF-κB pathway [27,28], which can contribute to cell proliferation. We also demonstrated the interaction between NF-κB and β-catenin/Tcf pathway in hADSC [29]. We examined the effects of overexpression of TRX1 and TRX2 on NF-κB and the β-catenin/Tcf signaling pathway. Luciferase assay showed that overexpression of TRX-1 and TRX-2 induced NF-κB and β-catenin/Tcf activation (Fig. 6A, B). Western blot analysis showed that overexpression of TRX1 and TRX-2 reduced IκB levels and increased β-catenin levels (Fig. 6C). In contrast, the downregulation of TRX1 and TRX2 expression by the transfection of TRX1 and TRX2 siRNA decreased TCF promoter activity (Fig. 6D) and NF-κB activity in hADSC (Fig. 6E). Western blot analysis showed that downregulation of TRX1 and TRX2 decreased β-catenin expression and increased IκB (Fig. 6F).
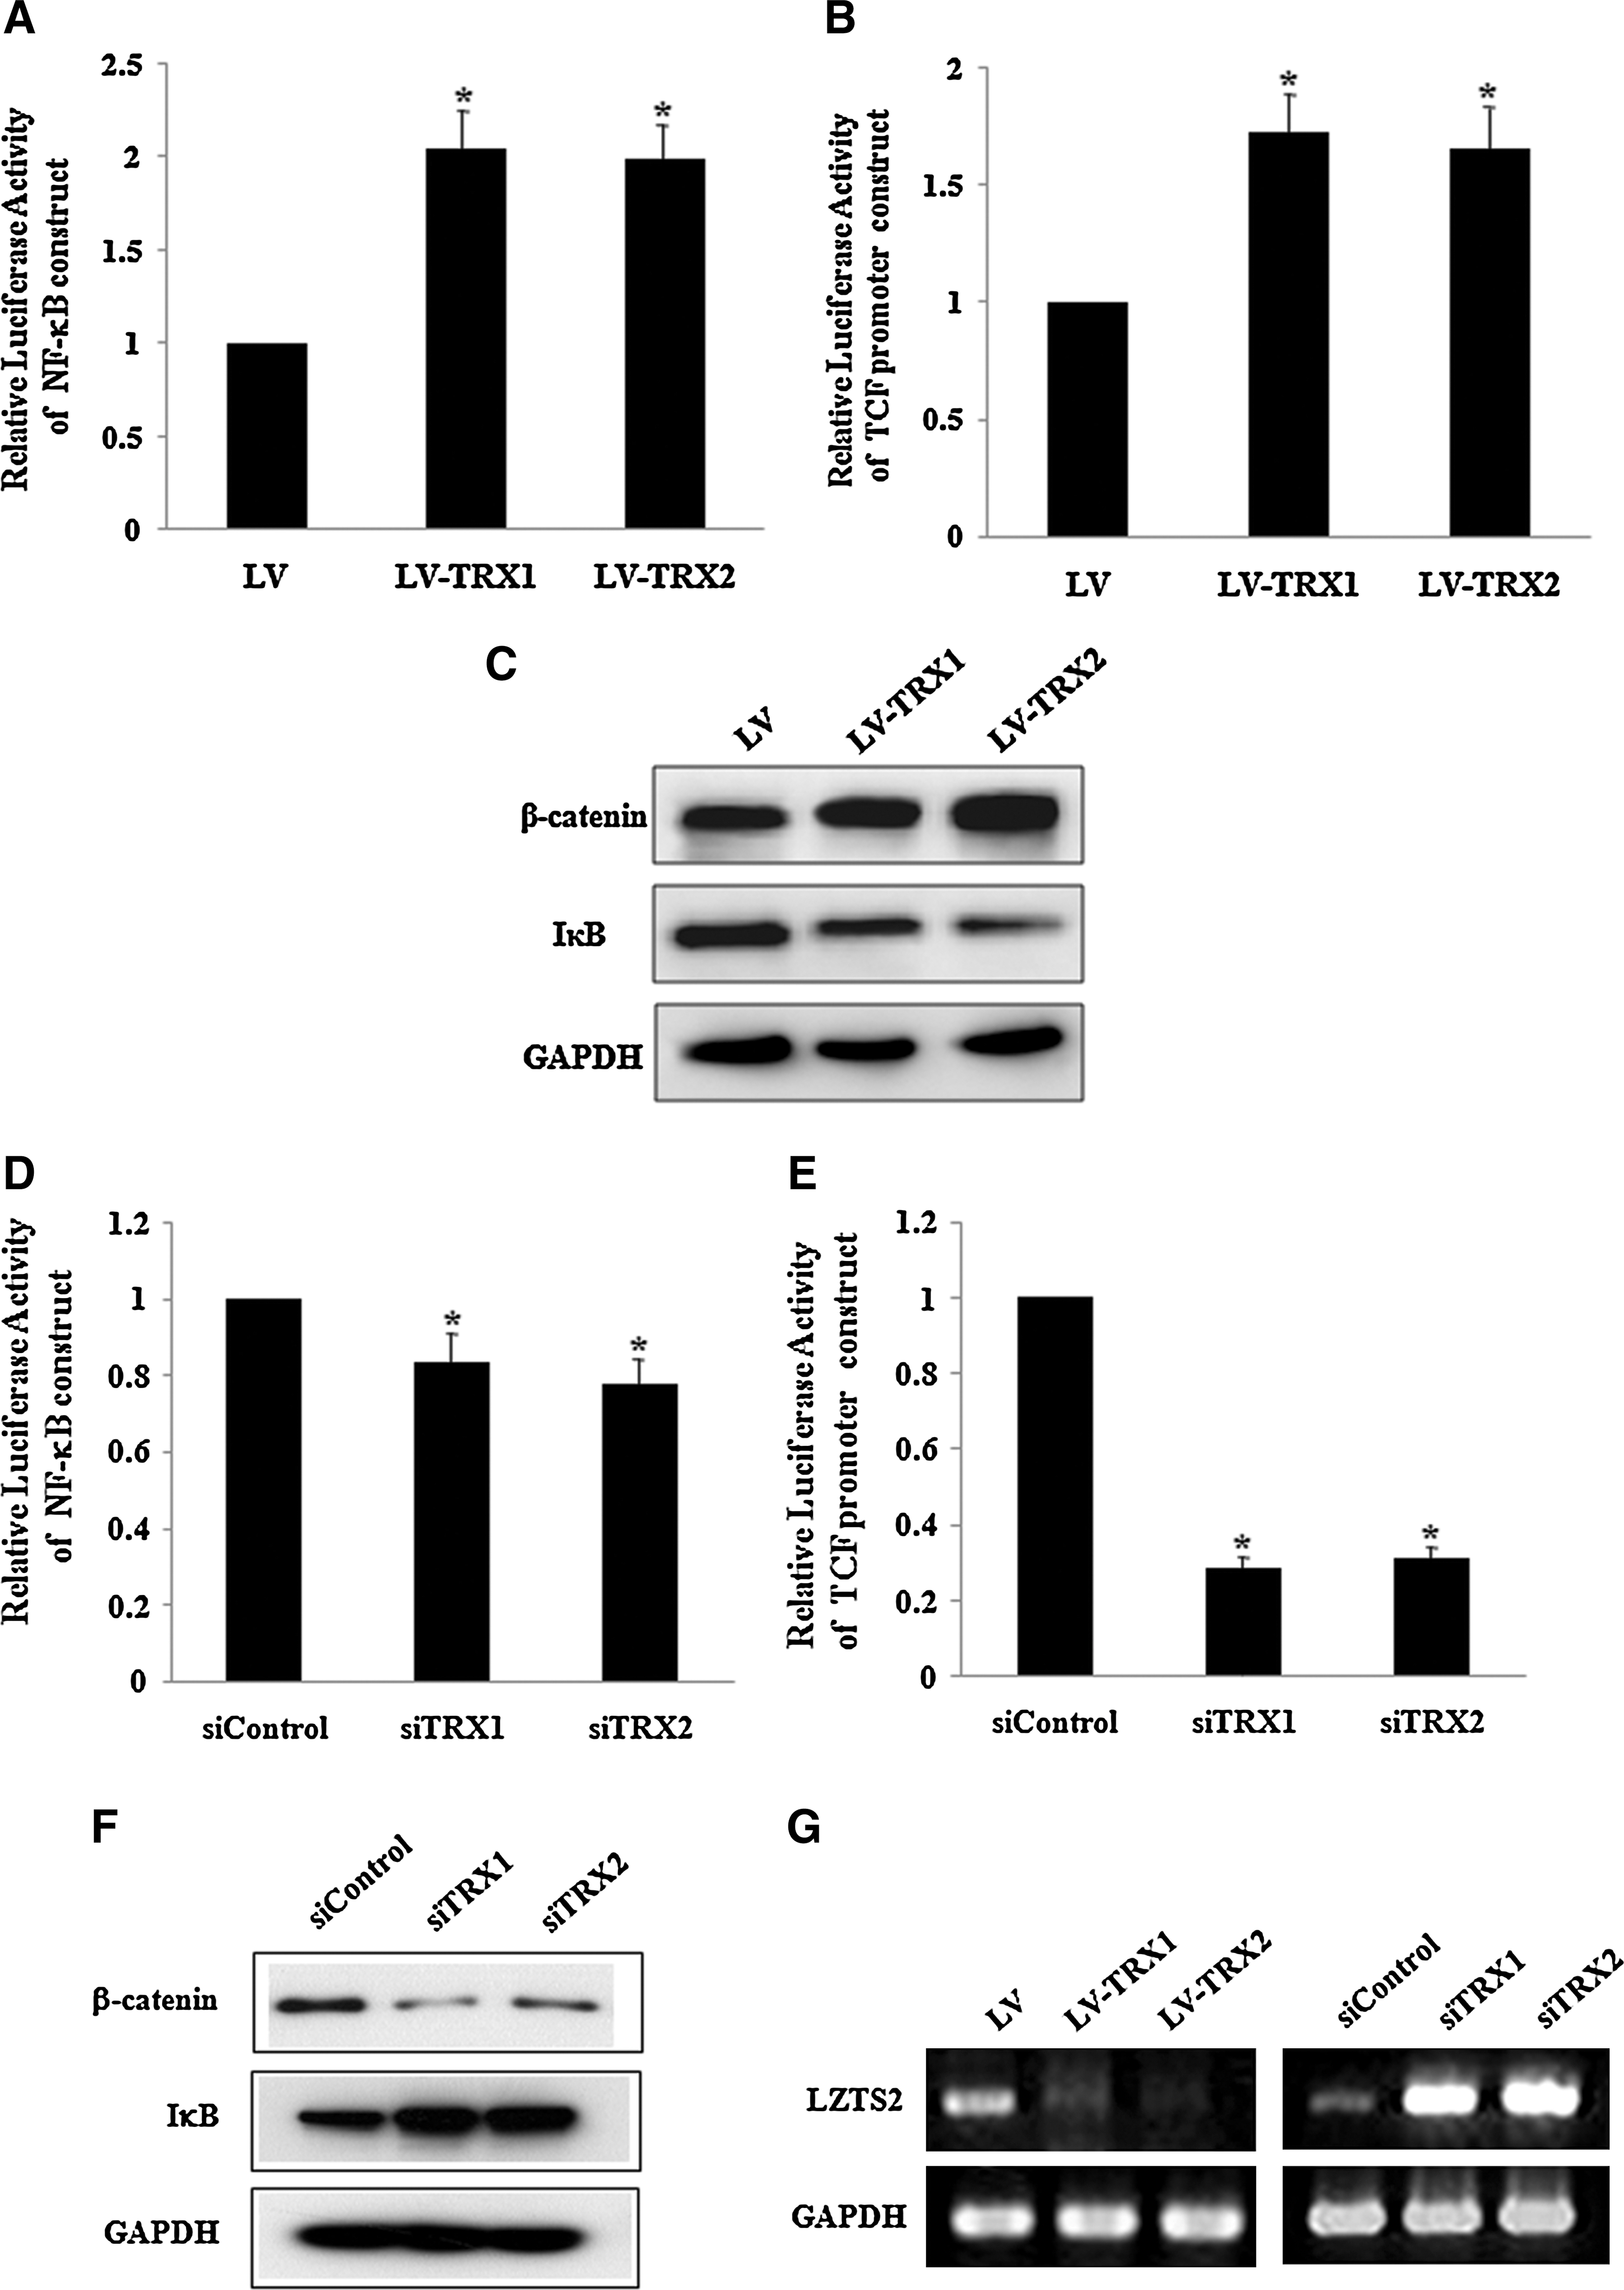
Effects of TRX1 and TRX2 overexpression on nuclear factor-kappaB (NF-κB) and β-catenin/Tcf signaling in hADSC.
We previously demonstrated that NF-κB activation in hADSC inhibits LZTS2 expression and that NF-κB-induced inhibition of LZTS2 expression activates the β-catenin/Tcf pathway in hADSC [29]. In this study, we showed that TRX overexpression induced NF-κB activation. Therefore, we determined whether TRX1 and TRX2 regulate the expression of LZTS2. RT-PCR analysis showed that TRX1 and TRX2 overexpression inhibited LZTS2 expression, and downregulation of TRX1 and TRX2 increased LZTS2 expression (Fig. 6G).
Effects of Wnt3a expression and LiCl treatment on ERK activation of hADSC
We determined whether TRX-induced activation of the β-catenin/Tcf pathway can mediate ERK activation. RT-PCR analysis showed that the transfection of Wnt3a cDNA increased the expression of Wnt3a in hADSC (Fig. 7A). Western blot analysis showed that transfection of Wnt3a and treatment with 10 mM LiCl, an inhibitor for GSK-3β, induced ERK1/2 phosphorylation and increased cellular β-catenin levels in hADSC (Fig. 7B).

Effects of Wnt3a expression and LiCl treatment on β-catenin signaling and ERK activation of hADSC.
Discussion
Mammalian cells express 2 TRX isoforms: TRX1, which is present in the cytosol, and TRX2, located in the mitochondria [5]. However, the functions of TRX1 and TRX2 in human MSC have not been investigated. In this study, we demonstrated that overexpression of TRX1 and TRX2 increases proliferation of hADSC without affecting their differentiation potentials (Figs. 2 and 3). The TRX-induced regulation of hADSC proliferation was further confirmed by the siRNA-induced downregulation of TRX1 and TRX2 (Fig. 3D). Although TRX1 has been reported to increase cell proliferation in intestinal epithelial cells, vascular smooth muscle cells, and various cancer cells, our study demonstrated that TRX2 and TRX1 enhance the proliferation of hADSC. Only a few reports have been published on the comparison of TRX1 and TRX2 functions in the same experimental system. HIF-1alpha function in cells is antagonistically regulated by TRX1 and TRX2 [30]. However, TRX1 and TRX2 overexpression shows similar effects on the protection of retinal ganglion cells in glaucoma, optic nerve transection, and oxidative stress [31,32]. The data in this study showed that TRX1 overexpression increased TRX2 expression and vice versa (Fig. 1B), which may be related to the similar actions of TRX1 and TRX2 overexpression on hADSC proliferation.
The ERK cascade is generally involved in the control of cell proliferation and differentiation by mitogens, growth factors, and cytokines [33]. The data in this study indicated that ERK1/2 activation is the major mechanism of TRX-induced increase in hADSC proliferation. Basal ERK1/2 phosphorylation increased in TRX1- or TRX2-overexpressed cells, and treatment with U0216, the inhibitor of MEK1 and MEK2, blocked TRX-induced increase in hADSC proliferation (Fig. 5A, C). We also demonstrated that the downregulation of TRX1 and TRX2 inhibited ERK1/2 activity (Fig. 5B). Increased ERK phosphorylation by TRX1 overexpression was reported in HeLa cells [34], but the mechanism is not clear. Oxidative stress is well known to induce the activation of ERK in various cell types [35]. However, in this study, we showed that TRX overexpression suppresses basal ROS production and inhibits oxidant-induced cell injury, thereby indicating antioxidant actions of TRX1 and TRX2 in hADSC (Fig. 4). Therefore, the TRX-induced ERK activation cannot be explained on the basis of redox-based mechanisms.
We found that overexpression of TRX1 and TRX2 induced NF-κB activation, which was accompanied by IκB degradation, and that the downregulation of TRX1 and TRX2 induced the opposite effect on NF-κB promoter activity and IκB levels (Fig. 6). TRX1-mediated NF-κB activation is explained by 2 independent mechanisms: (1) TRX1-mediated MEKK1-dependent phosphorylation of IκB [27] and (2) TRX1-induced facilitation of the NF-κB DNA binding in the nucleus by its protein-reducing function after the translocation of the p50/p65 heterodimer [28]. Psarra et al. [6] reported that overexpression of mitochondrial TRX2 activates NF-κB promoter activity in HEK-293 cells. The data in this study showed that overexpression of TRX1 and TRX2 induced the degradation of IκB, thereby supporting the MEKK1-dependent action (Fig. 6C).
We previously demonstrated that NF-κB activation in hADSC inhibits LZTS2 expression [29]. Since LZTS2 inhibits the β-catenin pathway [36], NF-κB-induced inhibition of LZTS2 expression activates the β-catenin/Tcf pathway in hADSC [29]. In this study, we showed that TRX overexpression inhibits LZTS2 expression and that downregulation of TRX increases LZTS2 expression (Fig. 6G). We also showed that overexpression of TRX1 and TRX2 increased β-catenin expression and Tcf promoter activity and that downregulation of TRX1 and TRX2 showed the opposite effects on β-catenin expression and Tcf promoter activity (Fig. 6). TRX-induced activation of β-catenin/Tcf signaling pathway suggests a relationship between TRX and ERK activation, because it has been shown that Wnt signaling induces ERK phosphorylation [37 –39]. That is, TRX-induced ERK activation may be mediated by the NF-κB-mediated regulation of LZTS2 expression and the subsequent activation of β-catenin/Tcf pathway. This possibility is supported by the findings of this study in which Wnt3a and treatment with LiCl activated ERK1/2 in hADSC (Fig. 7B).
This study indicated that increased expression of TRX1 and TRX2 induces cell survival on oxidant stress and proliferation of hADSC. Therefore, the modulation of TRX expression in hADSC may provide a new approach for improving the therapeutic efficacy of hADSC transplantation by increased survival of transplanted cells in vivo.
Footnotes
Acknowledgments
This study was supported by a grant (E0027) of National Research Foundation and the MRC program of MOST/KOSEF (R13-2005-009).
Author Disclosure Statement
No competing financial interests exist.