
Abstract
Induced pluripotent stem (iPS) cells have been generated from bone marrow (BM) hematopoietic progenitor cells by ectopic expression of Sox-2, Oct-4, and Klf-4 with the hope that they may differentiate more efficiently than embryonic stem (ES) cells in vitro into hematopoietic cell lineages because of their epigenetic memory. An in vitro culture system has been standardized to allow a quantitative assessment of the capacities of different ES, BM-derived iPS, and fibroblast-derived iPS cell lines developing to erythroid, myeloid, and lymphoid cell lineages. Surprisingly, the efficiency to differentiate BM-derived iPS cells to hematopoietic cells in vitro is severely reduced compared with ES cells and fibroblast-derived iPS cells. Undifferentiated as well as differentiated stages of the BM-derived iPS lines express elevated mRNA levels of the transcription factors Sox-2, Oct-4, and Klf-4 with which the iPS cells have been transduced. Overexpression of the transcription factors inhibits development of Flk-1+ mesodermal to CD45+ hematopoietic progenitors. The overexpression of Sox-2 appears to be inversely related to hematogenic potency. These results suggest that iPS cell generation with the aim of developing hematopoietic cells should be controlled and selected for low levels of transduced Sox-2, Oct-4, and Kfl-4 expression.
Introduction
E
iPS cells have been generated from a variety of mouse as well as human differentiated tissue cells by the overexpression of the transcription factors Sox-2, Oct-4, Klf-4, in some cases with the added expression of c-Myc [7 –13]. If such iPS cells are functionally equivalent to blastocyst-derived ES cells, they should allow the proper development of all cell lineages and their differentiated tissues of the body.
Although several reports indicate high similarities between ES and iPS cells, including indistinguishable global histone modification and DNA methylation patterns [8,14], there is rising evidence for significant differences. The pattern of DNA methylation [15 –17] as well as the expression of mRNAs and microRNAs [18 –21] have been reported to be distinguishable between ES and iPS cells. Further, the continued presence of an imprinted gene cluster, Dlk1-Dio3, might be mandatory for full developmental potential of iPS cells [20].
The standard qualitative approach demonstrating reprogrammed somatic cells is to check germline chimera and teratoma formation from iPS cells [8,10]. The question remains whether iPS cells are as efficient as ES cells to generate a whole mouse with normal life expectance and to develop into somatic and progenitor cells at normal rates. If iPS cells are to be used to develop hematopoietic cells for the reconstitution of a normal blood-forming system, as hematopoietic stem cells are capable in bone marrow (BM) transplantations and for the treatment of hematopoietic disorders, they should be as efficient as ES cells in this development.
The most frequently analyzed type of iPS cells is derived from fibroblasts and mesenchymal cells. It has been shown that those iPS cells can efficiently develop into cells of the hematopoietic system [22,23]. One important question is whether this ability is dependent on the source of cells from which the iPS cells are generated.
ES cells do not develop with 100% efficiency into somatic cells. Thus, one could hope that iPS cells that are generated from hematopoietic cells might even have a higher efficiency to develop into hematopoietic cells compared with ES cells, maybe as a consequence of epigenetic memory. Therefore, in addition to overcoming transplantation tolerance, such hematopoietic cell-derived iPS cells, especially those derived from multipotent progenitors and stem cells of BM, it might be more efficient to generate hematopoietic cells.
We have developed a tissue culture protocol that allows us to quantitatively monitor the development of erythroid, myeloid, and lymphoid cells with time by determining the numbers of differentiated cells which develop at various times after initiation of ES- or iPS cell differentiation. Here, we use this in vitro culture system, which we describe in detail, to compare the efficiency of hematopoietic differentiation of 2 ES cell lines with 7 BM-derived iPS (BM-iPS) cell lines and 8 fibroblast [mouse embryonic fibroblasts (MEFs)]-derived iPS (MEF-iPS) cell lines.
Materials and Methods
Cell lines
The OP9 and OP9-DL1 stromal cell lines [24] (a kind gift of Dr. Zuniga-Pfluecker, University of Toronto) were cultured in α-minimum essential medium (α-MEM) (Gibco-Invitrogen)/20% fetal calf serum (FCS; Sigma-Aldrich). The ST2 stromal cell line [25] was maintained in RPMI-1640 (Gibco-Invitrogen)/5×10−5M 2-mercaptoethanol (Sigma-Aldrich)/5% FCS (JRH Biosciences). The ES cell lines J1 [26] and Bruce4 [27] and all the iPS cell lines (described below) were maintained on irradiated MEFs in Dulbecco's minimum essential medium (DMEM) (GlutaMAX™; Gibco-Invitrogen)/15% heat-inactivated FCS (Gibco-Invitrogen)/10–4 M 2-mercaptoethanol (Sigma-Aldrich)/1×nonessential amino acids (Gibco-Invitrogen)/1×sodium pyruvate (Gibco-Invitrogen)/leukemia inhibitory factor (LIF) equivalent to 1,000 U/mL.
Cytokine-conditioned media (CM) were produced using appropriate hybridoma cell lines: IL-2 (X63/IL-2) [28], IL-4 (X63/IL-4) [28], IL-5 (X63/IL-5) [28] IL-7(J558L/IL-7) [29], anti-CD40 (FGK45) [30], stem cell factor (SCF) (CHO-SCF, kind gift of Dr. Thorsten Feyerabend, Universitaet Ulm), Flt-3L (Sp2.0-Flt3-L, kind gift of Dr. Paulo Vieira, Institute Pasteur, Paris), and LIF (J558-LIF). These cytokine-CM were titrated against known concentrations of recombinant cytokine preparations (PeproTech). In all cases, between 2% and 4% of cytokine-CM correspond to 10 ng/mL recombinant cytokines.
Retroviral vectors, production of retroviral particles, and transduction of target cells
All expression constructs have been generated by using the backbone of pMYc-I-G retroviral vector [31] that also contains in addition to cDNA cloning sites IRES-EGFP unit for easy scoring of the transduced cells. Expression is driven from 5′ LTR sequence. IRES-EGFP was deleted in retroviral vectors coding “the Yamanaka cocktail” to increase the packaging efficiency due to the smaller size of the retroviral genome. In these cases, transduction efficiency was monitored by parallel experiments using the original pMYc-I-G vector (approximately same size as “the cocktail” vectors). Viral particles were produced by the ecotrophic Plat-E packaging cell line [32] and collected 24–72 h after introduction of vector DNAs via classical Ca3(PO4)2 mediated transfection. Transfection procedure of Plat-E cells has been optimized to 80% transfection frequency. For transduction, supernatant containing the viral particles was spinoculated (4,000 rpm, 60 min) on fibronectin coated wells or plates. After supernatant was removed, the target cells in their own media were added and the culture was continued on these plates for few hours, after which they could be subjected to further rounds of transductions (usually 4). Usual transduction frequencies for BM cells and MEFs are 80% and 90%, respectively. Alternatively concentrated viral supernatants could be added directly on target cells.
Derivation of iPS cells
We have used the combination of the 3 transcription factors—Oct-3/4, Sox-2, and Klf-4—to induce iPS cell generation [9]. Our iPS derivation essentially followed an established protocol: BM cells from C57Bl/6 mice treated with 5-FU (-day 4) were isolated. These cells were cultured for 2 days in suspension cultures in the presence of SCF and IL-6 (S6 media). They were then transduced with “Yamanaka” retrovirus cocktail obtained from Plat-E packaging lines and plated (1×10⁶/10 cm dish) on MEFs in S6 media. After 3 days, the media were changed to contain only LIF as an exogenous cytokine (ES media, see above). About 1–2 weeks later, colonies having morphology of typical mouse ES cells were picked and further propagated in ES media on MEF. As a control, MEFs were transduced in the same way and plated (1×10⁶/10 cm dish) on MEFs in ES media.
Embryonic body formation assay
Embryonic body (EB) formation was performed as previously described [33,34].
Teratoma formation and histological analysis
About 2×10⁶ cells were subcutaneously injected into Rag2−/− γc −/− mice, and mice were observed to make tumors. Tumors were surgically dissected from the mice. Samples were fixed in phosphate-buffered saline (PBS)/4% formaldehyde, embedded in OCT component, frozen in Hexan cooled by Aceton/Dry ice mixture, and stored at −80°C. Sections were stained with hematoxylin and eosin.
Differentiation of ES and iPS cells
Undifferentiated ES or iPS cells were inoculated at 1.25×10³ cells/mL in 6-well plates (Corning) on preseeded confluent OP9 cells and cultivated in α-MEM/20% FCS (Gibco-Invitrogen). On day 5, the cells were harvested by trypsinization and re-seeded at 7×10⁴ cells/mL in T25 flasks (Corning) onto confluent OP9 layers in α-MEM/20% FCS (JRH Bioscience)/3% SCF-CM/2% Flt-3L-CM. On day 10, cells were passed to fresh confluent OP9 layers with α-MEM/20% FCS/3% SCF-CM/2% Flt-3L-CM at 7×10⁴ cells/mL in T25 flask. On day 12, the media was changed to Iscove's modified Dulbecco's medium (IMDM)/2% FCS/0.03% Primatone [35]/1% IL-7-CM/2% Flt-3L-CM. On day 15, all cells were tapped off, filtrated, and subsequently passed to fresh OP9 layers (70% confluency). On day 19, cells were harvested by tapping and analyzed. For maturation of the preB cells, were passed to IMDM/2% FCS/0.03% Primatone/3% IL-4-CM/3% IL-5-CM/5 μg/mL anti-CD40 for 4 days.
To differentiate the cells into T lineage cells instead of OP9 cells as stomal cells, OP9-DL1 cells were used from day 10 on retaining all media.
To induce natural killer (NK) cells, cells from culture day 10 were cultivated on confluent OP9 with α-MEM/20% FCS/3% IL-2-CM/10 ng/mL IL-15 (Biochrom) for an additional 8 days.
Erythrocytes were induced by cultivating cells from day 10 on confluent OP9 with α-MEM/20% FCS/3% SCF-CM/2 U/mL erythropoietin (R&D) for an additional 6 days.
For osteoclastogenesis, cells from day 5 were kept on OP9 cells without additional cytokines until day 10 and were subsequently passed to confluent layers of ST2 cells in α-MEM/10% FCS/10−8 M 1α,25(OH)2D3 (Biomol Research Laboratories)/10–7M dexamethasone (Sigma-Aldrich) for 6 additional days at 2×10³ cells/mL on 24-well-plates (Corning) [36].
Antibodies and fluorescence activated cell sorting
The fluorescein isothiocyanate (FITC) anti-mouse CD45 (30-F11), FITC anti-mouse CD41 (eBioMWReg30), FITC anti-mouse CD71 (RI7 217.1.4), FITC anti-mouse NKG2A/C/E (20d5), FITC anti-mouse TCR β (H57/597), phycoerythrin (PE) anti-mouse Ter119, PE anti-mouse Flk-1 (Avas12a1), PE anti-mouse Oct-3/4 (EM92), Alexa647 anti-mouse Nanog (eBioMLC-51), allophycocyanin (APC) anti-mouse Mac-1 (M1/70), APC anti-mouse c-kit (ACK2), APC anti-mouse CD8 (53–6.7), PE-Cy7 anti-mouse B220 (RA-6B2), PerCP-Cy5.5 anti-mouse CD19 (1D3), PerCP-Cy5.5 anti-mouse CD25 (PC61.5), PerCPCy5.5 anti-mouse CD4 (GK1.5) eFluor™ 450 anti-mouse CD44 (IM7), biotin anti-mouse TCR γδ (GL3), biotin anti-mouse SSEA-1 (eBioMC-480) antibodies, and PE-Cy7-coupled Streptavidin were obtained from eBioscience, San Diego. Cells were subsequently incubated with heat-inactivated rabbit serum for 10 min followed by staining with a combination of conjugated antibodies in fluorescence activated cell sorting (FACS) buffer (PBS/2% FCS) for 15 min, DAPI (Calbiochem) diluted in FACS buffer for 10 min, and finally washed with FACS buffer. Cells were FACS-analyzed on an LSRII flow cytometer (BD Biosciences). To analyze surface marker expression, dead cells were discriminated by DAPI staining.
Intracellular stainings were performed using Foxp3 Staining Buffer Set (eBioscience,) according to the manufacturer's instructions.
Stained cells were analyzed using FACSCalibur (BD Biosciences), LSRII (BD Biosciences, and FlowJo software (Tree Star).
Tartrate resistant acid phosphatase staining
Cells were fixed with 10% formaldehyde (Roth) for 10 min at room temperature, washed with deionized water, and incubated with ethanol/acetone (50:50 v/v; Roth) for 1 min. After washing, cells were stained with fast red violet LB-salt (Sigma) mixed with tartrate resistant acid phosphatase (TRAP) solution [59.3M sodium tartrate (Sigma-Aldrich), 165.7M sodium acetate (Sigma-Aldrich), 0.56 mg/mL naphthol AS-MX phosphate (Sigma)] for 5 min at room temperature.
Red-stained cells were counted as TRAP-positive cells.
Alkaline phosphatase staining
After removal of media, 1 mL 10% formaldehyde (Roth)/PBS per well of a 6-well plate was added and incubated for 10 min at room temperature. During that time, the alkaline phosphatase staining solution was prepared. Therefore, 0.16 mg/mL fast red violet LB salt (Invitrogen) was added to the alkaline phosphatase staining solution [0.1 mg/mL naphthol AS-BI phosphate (Sigma-Aldrich] in 1% (v/v) N,N-dimethylformamide (Sigma-Aldrich) in 0.1M Tris-HCl pH 8.5]. The formaldehyde was aspirated, and the cells were washed twice with PBS. About 500 μL alkaline phosphatase staining solution was added per well and incubated for 5–15 min.
RNA purification and reverse transcription–polymerase chain reaction
Total RNA was purified using SV Total RNA Isolation System (Promega) and used as the template to synthesize cDNA using Superscript III reverse transcriptase (Invitrogen) primed with oligodT primer (Fermentas) and Random Hexamers (Fermentas) from 1 μg of total RNA. Gene expression was analyzed by polymerase chain reaction (PCR) using the following primers: granzyme A: 5′-TGACTGCTGCCCACTGTAAC-3′ and 5′-GGCATCTGGTTCCTGGTTTC-3′; perforin: 5′-GATGTGAACCCTAGGCCAGA-3′ and 5′-GTGGTAAGCATGCTCTGTGG-3′.
Primers for β-hemoglobin ζ-hemoglobin and hypoxanthine-guanine phosphoribosyltransferase have been previously described [36].
Quantitative RT-PCR
Total RNA was purified as just described. Expression levels of mRNAs were quantitatively assessed using QuantiTect SYBR Green PCR Kit (Qiagen) in a 7900HT Fast Real-Time PCR system (Applied Biosystems) with the GAPDH gene as reference. For each reaction (25 μL final volume), 0.25 μL RT mix and 10 μL of RNA sample (50 ng/reaction) were mixed with 0.5 μL of primer pairs (400 nM final), 12.5 μL of SYBR Green mix, and 1.75 μL RNase-free water. For coupled cDNA synthesis and target gene amplification, 0.25 μL of QuantiTect RT mix was added. Each sample was assayed in triplicate for every run. RNA from undifferentiated ES cells was used to construct a standard curve for all inspected genes, proving specificity and reliability of the designed oligonucleotide pairs. The cycling program included initial hold for 30 min at 50°C and 15 min at 95°C. Each PCR was performed at 45 cycles consisting of 20s at 95°C melting, 40s at 60°C annealing, and 40s at 72°C elongation.
A threshold cycle value (C t) was chosen to fall within the linear phase for each set of curves. Triplicate wells were averaged, and target gene values were normalized to GAPDH expression levels.
The following primer pairs were used: GAPDH: 5′-TCTCCATGGTGGTGAAGACA-3′ and 5′-GCAGTGGCAAAGTGGAGATT-3′; Sox-2 (total–binding in the open reading frame [ORF] region): 5′-CGAGTGGAAACTTTTGTCGGAG-3′ and 5′-CCTTCTTCATGAGCGTCTTGGT-3′; Oct-4 (total–binding in the ORF region): 5′-GGAGAATTTGTTCCTGCAGTGC-3′ and 5′- AGAACCACACTCGGACCACATC-3′; Klf-4 (total–binding in the ORF region): 5′-AGAGTTCCCATCTCAAGGCACA-3′ and 5′-TCGCATTTTTGGCACTGGA-3′; Nanog (total–binding in the ORF region): 5′-AGCAGAAGATGCGGACTGTGTT-3′ and 5′-GAGTTCTTGCATCTGCTGGAGG-3′; Sox-2 (endogenous–binding to the untranslated region [UTR] region): 5′-CAAAAACCGTGATGCCGACT-3′ and 5′-AGACTTTTGCGAACTCCCTGC-3′; Oct-4 (endogenous–binding to the UTR region): 5′-CATTCAAACTGAGGCACCAGC-3′ and 5′-AATTTAACCCCAAAGCTCCAGG-3′; Klf-4 (endogenous–binding to the UTR region): 5′-AGGAAGAGGAAGCGATTCAGGT-3′ and 5′-CGACTCACCAAGCACCATCAT-3′; Nanog (endogenous–binding to the UTR region): 5′-CCAGGTTCCTTCCTTCTTCCA-3′ and 5′-GAGTTCAAATCCCAGCAACCA-3′.
Results
Development of iPS cells from SCF/IL6-reactive mouse BM cell lines
BM cells from C57Bl/6 mice treated with 5-Fluorouracil (-day 4) were isolated and cultivated in the presence of the hematopoietic cytokines SCF and IL-6 (S6 media) [37]. BM-iPS cells were generated by retroviral transduction with 3 vectors constitutively expressing Sox-2, Oct-4, and Klf-4 (see Materials and Methods section). All iPS cell clones derived from independently picked original colonies were tested for pluripotency markers along with the positive control ES cell line Bruce4 (Fig. 1). Alkaline phosphatase activity, SSEA-1 surface antigen level, Nanog and Oct-3/4 expression were used as indicators for stem cell activity of the generated iPS cell clones [38 –40] (Fig. 1A–D). Note that we have used FACS when possible to measure pluripotency markers, because it is a single cell assay unlike PCR that can only measure cell populations. EB formation and the ability to induce tumors are additional characteristics of ES-like stages [34,41]. All used iPS cell clones are able to form EBs in vitro (Fig. 1E). On subcutaneous injection into Rag2−/−γc −/− mice, they formed large tumors that were identified to be teratomas revealing structures from all 3 germ layers (Fig. 1F).
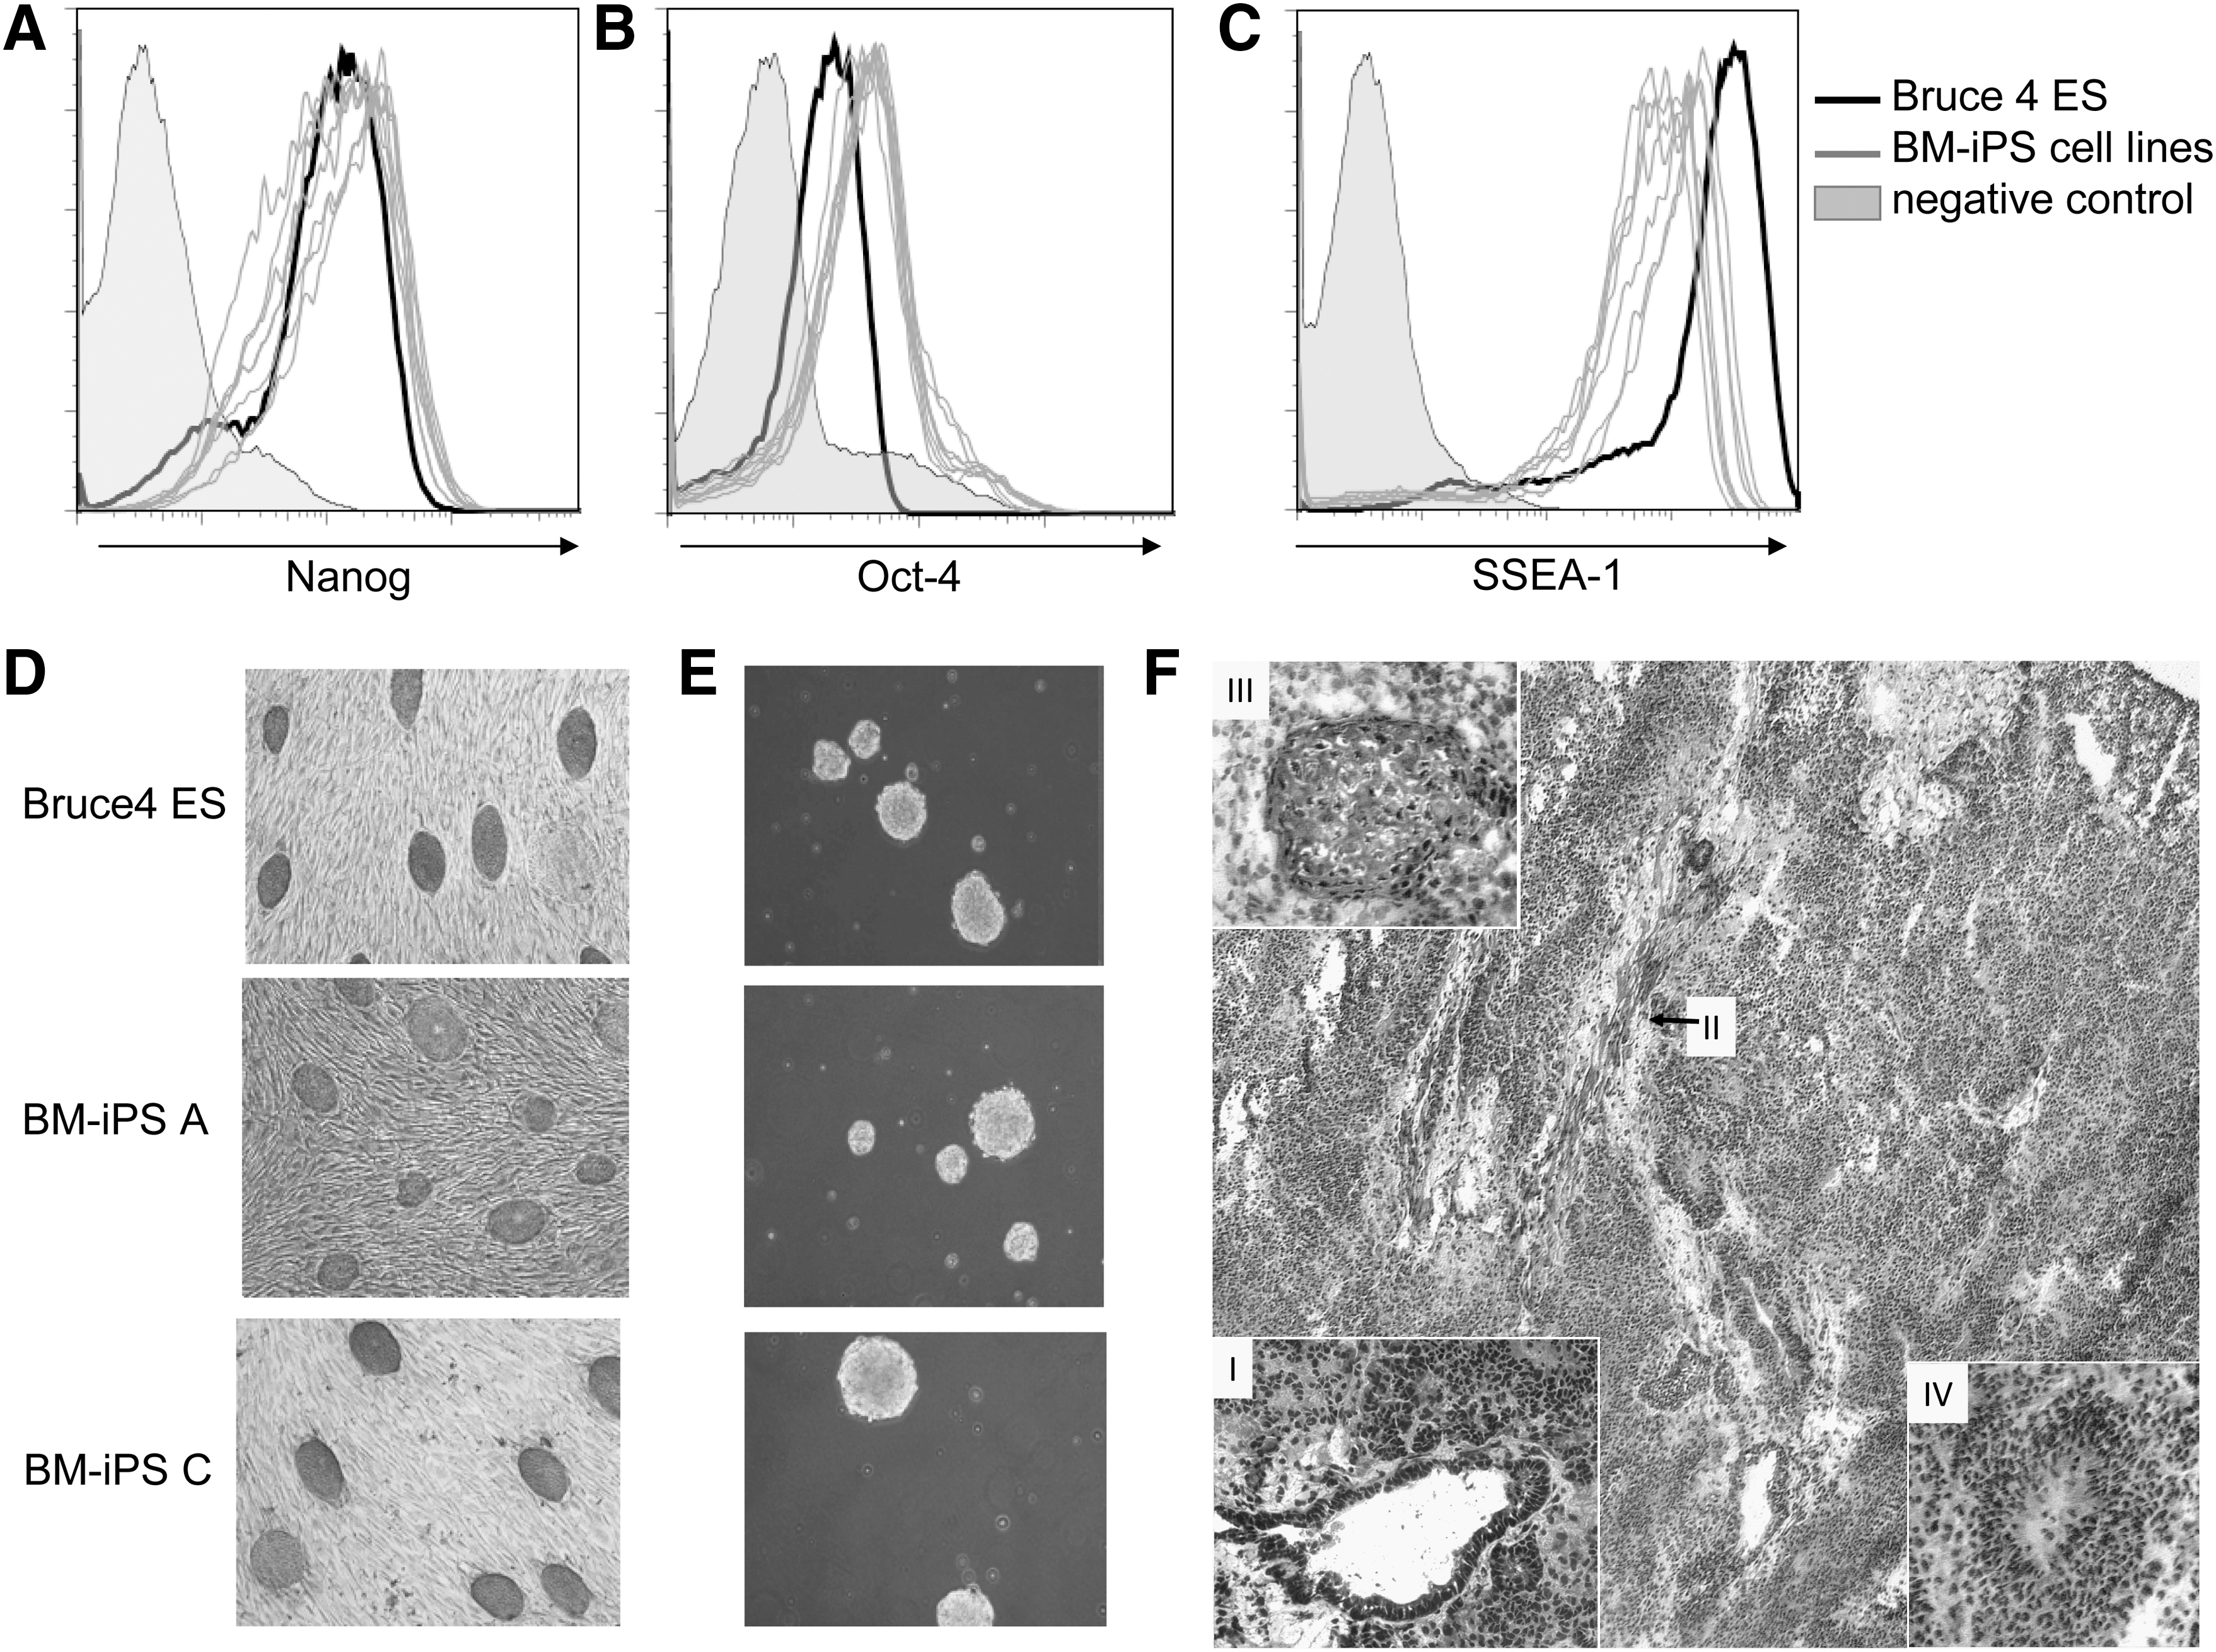
Pluripotency marker test on the generated BM-iPS cells.
We have used a pMY [31] backbone that is known to produce high-titer retroviruses in transient transfection. In contrast to pMX vectors, these viruses can efficiently express genes in most ES and hematopoietic progenitor cells [31].
BM-iPS cells develop with reduced efficiency into lymphoid, erythroid, and myeloid cells in vitro
For a quantitative analysis of the hematopoietic potential of ES- and BM-derived iPS cells, a previously described tissue culture system of ES cell differentiation on layers of the M-CSF-deficient OP9 stromal cells [24,42] was further modified (Fig. 2A). Numbers of cells developing in vitro into erythrocytes, osteoclasts, B and T lymphocytes, and NK cells were determined. Seven independently generated BM-derived iPS cell clones (iPS A-G) were studied and compared with 2 normal ES cell lines (J1, Bruce4).

Comparison of the potential of ES and BM-iPS cells to develop into lymphoid, erythroid, and myeloid cells.
Undifferentiated cells were cultured for 5 days on OP9 stromal cells. On day 5, they were sub-cultivated onto fresh confluent OP9 stromal cell layers and cultured for additional 5 days with addition of SCF and Flt-3L. The cells were passed on day 10 on fresh stromal cell layers depending on the lineage (described below) with addition of SCF and Flt-3L (Fig. 2A).
Lymphopoiesis was initiated from day 12 in the presence of Flt3-L and IL-7, on either OP9 to induce B-lymphopoiesis, or OP9-DL1 stromal [43] cells to induce T-lymphopoiesis (Fig. 2A).
Differentiating ES cells developed to B-lymphoid cells expressing CD19 at day 19 of culture (Fig. 2B). These CD19+ cells could, in fact, be further propagated in vitro on OP9 stromal cells in the presence of IL-7 (Fig. 2B). The CD19+ cells could be induced to differentiate to surface IgM+ cells after removal of IL-7 from the cultures. This suggests that the cells proliferating on OP9 stromal cells in the presence of IL-7 were preBI cells (Supplementary Fig. S1A; Supplementary Data are available online at
Development of B lymphoid cells from BM-iPS cells was severely reduced when compared with development from ES cells. BM-iPS A generated ∼10-fold, BM-iPS B, C, and F between 1,000- to 10,000-fold reduced numbers of cells, whereas iPS E and G generated no detectable numbers (ie, at least 100,000-fold lower numbers) of B cells (Fig. 2B). Maturation could not be shown from BM-iPS cell-derived preB cells because of low numbers.
Differentiating ES cells also developed into T-lymphoid cells on OP9-DL1 stromal cells in the presence of Flt3-L and IL-7. They were CD4− CD8− double-negative cells, from which some CD4+ CD8+ double positive as well as CD4+ or CD8+ single positive had further differentiated (Fig. 2C). At day 30 of culture, with continuous differentiation on OP9-DL1 and IL-7, the cultured T-lymphoid cells expressed α/β TCR and γ/δ TCR (Supplementary Fig. S1B).
T cell development from all BM-iPS cell clones was reduced by a factor of 100–1,000 identified by the expression of CD4 and CD8 (single-positive and double-positive stages) (Fig. 2C).
NK cell development was induced on OP9 in the presence of IL-2 and IL-15 (Fig. 2A). Eight to 10 days after induction, NK1.1+ (only for C57Bl/6-derived cells) NK cells developed in the cultures. Granzyme A and perforin are lysing enzymes known to be NK cell-specific [43]. To functionally investigate the differentiated cells, reverse transcription-polymerase chain reaction (RT-PCR) was performed to test expression of granzyme A and perforin (Fig. 2D). The NK cells could not be maintained in culture. They killed the OP9 stromal cell layer (data not shown). This again confirms the functional characteristics of the developed NK cells.
All BM-iPS cell clones developed NK cells, but with at least 10 times lower efficiency. NK cells from all BM-iPS cell clones expressed perforin, and all but BM-iPS G expressed granzyme A at a detectable level (Fig. 2D).
Erythropoiesis was induced by culturing the day 10 differentiated ES cell-derived hematopoietic progenitors in the presence of SCF and erythropoietin (Fig. 2A). On day 16, CD71+ and Ter119+ cells were detected (Fig. 2E). Expression of fetal (ζ) and adult (β) type-globin was tested by RT-PCR. Both types of globin were expressed in the CD71+ Ter119+ cells, indicating that both primitive and definitive hematopoiesis had been induced in these cultures (Fig. 2E).
The BM-iPS cell clones A and B developed a similar number of erythrocytes, with evident expression of fetal and adult globin whereas BM-iPS C-G developed 100–1,000 times lower numbers (Fig. 2E).
Myelopoiesis to osteoclasts was induced in the presence of receptor activator of nuclear factor κB ligand-positive cells [ST2 stroma cells induced by 1α,25(OH)2D3 and dexamethasone] (Fig. 2A). TRAP+ cells counted at day 6 after induction showed that the differentiated ES cells had developed into mature osteoclasts (Fig. 2F). Most of the TRAP+ osteoclasts counted in that assay were multinucleic.
From the lower number of differentiated BM-derived iPS cells at day 10, only BM-iPS clones A, B, D, and F developed detectable numbers of osteoclasts (BM-iPS C and E at least 1,000-fold lower numbers), although cultures were set up at the same initial cell concentrations. They were ∼20-fold (BM-iPS A) to more than 100-fold lower (BM-iPS A, D, F) than the numbers of osteoclasts developed with normal ES cells (Fig. 2C).
Our results reconfirm that ES cells differentiated on confluent OP9 stromal cells can undergo both primitive as well as definitive hematopoiesis and can develop the different lymphoid lineages expectable from a full lymphopoietic potential of normal ES cells.
All 7 BM-iPS clones developed several types of hematopoietic lineages.
In summary, BM-iPS A and B were the most potent clones, whereas BM-iPS clones E, D, and G showed severe defects in the development of several hematopoietic lineages. It is evident from these experiments that each iPS clone had a characteristic pattern of severity in defective lineage differentiation.
We conclude from these results that a series of iPS cell lines, all generated from BM cells cultured under IL-6/SCF conditions, have different, but all of them reduced capacities to develop in vitro into myeloid and lymphoid cell lineages.
Reduced capacity of hematopoietic differentiation of BM-iPS cells becomes manifest during the development from mesodermal to hematopoietic progenitors
Since all different hematopoietic lineages show reduced cell numbers, we investigated the common stages, that is, from day 0 to 5 and from day 5 to 10 of in vitro differentiation. Within the first 5 days on OP9 cells, the differentiating ES cells expanded by 100–200-fold, so that from 8×10³ ES cells 8×10⁵–2×10⁶ differentiated, mesodermal-like cells were generated (Fig. 3A). It is evident from the data in Fig. 2B that the proliferative expansions of 4 BM-derived iPS cell lines between days 0 and 5 after induction of differentiation were comparable to normal ES cell differentiation. Three BM-iPS cell lines (BM-iPS A, E, G) were around 20% less efficient. Similar to differentiated ES cells, approximately half of all the differentiated BM-iPS cells of each clone expressed the mesodermal marker Flk-1+ [44,45] (Fig. 3B). The cells developed from ES and BM-iPS iPS cells are not distinguishable by their morphological appearance on day 5 of the culture (Supplementary Fig. S2). The number of Flk-1+ cells on day 5 of the culture is comparable between the ES and BM-iPS cells (Fig. 3B, C). The expression of CD41, a marker of very early hematopoiesis [46 –48], is around 2 to 5-fold lower in the BM-iPS compared with ES cells at this stage (Fig. 3B, C).
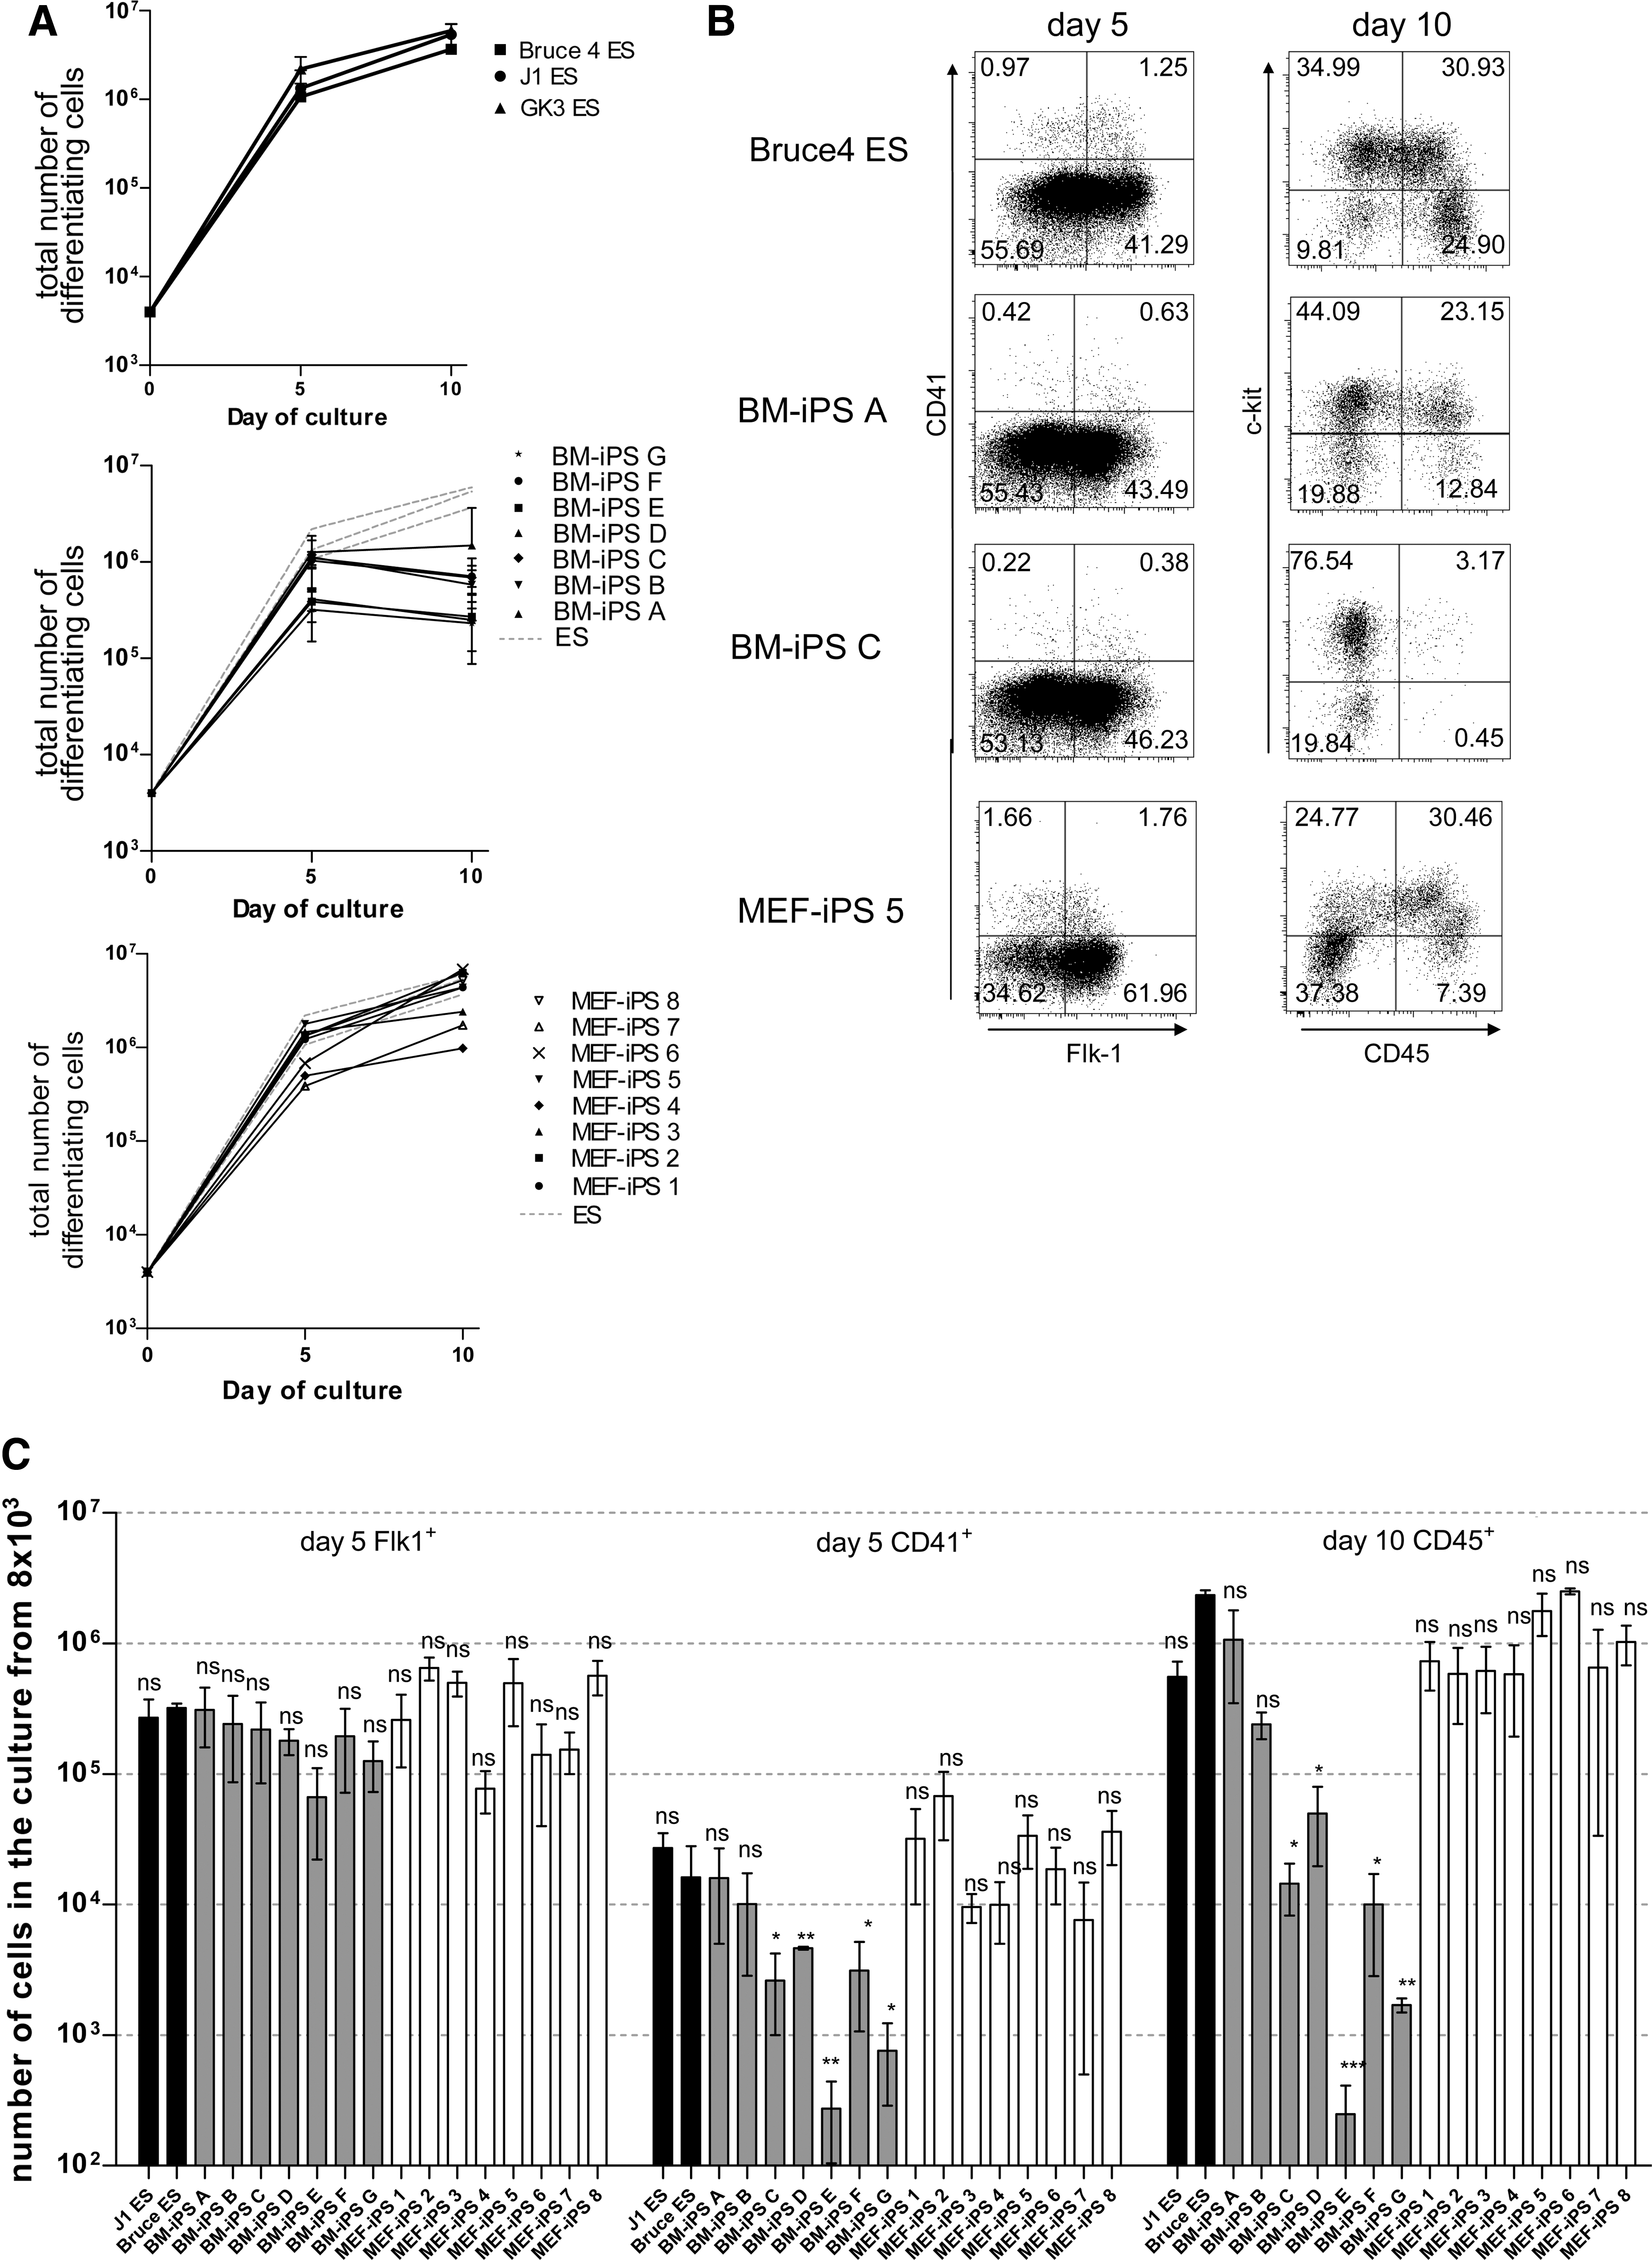
Differentiation of ES and iPS cells into hematopoietic progenitors.
At day 5, differentiating cells were collected and replated on fresh confluent OP9 cells, supplemented with SCF and Flt-3 ligand (Flt-3L). In this second period of culture, expression of Flk-1 was downregulated, whereas expression of CD45 was upregulated (Fig. 3B). The differentiating ES cells expanded at best by a factor of 3. In experiments not shown here, we found that the Flk-1+ cells, which also expressed Tie-2, were the hematogenic mesodermal progenitors that developed into the CD45+ cells [36,49,50].
Between days 5 and 10, all BM-derived iPS cell lines developed less well than the normal ES cells evident in a lack of further proliferative expansion and a concomitant lower number of CD45+ cells in the cultures at day 10 in BM-iPS cell clones C-G (Fig. 3A–C). The BM-iPS cell clones A and B show similar percentages of CD45+ cells in the culture compared with Bruce4 and J1ES cells (Fig. 3B, C).
However, the morphology of the cells on day 10 is not distinguishable between ES and BM-iPS cells (Supplementary Fig. S1). The reduced numbers on day 10 are due to increased apoptosis between days 5 and 10 as measured by Annexin V/7-AAD-staining (Supplementary Fig. S3).
Next, we addressed the question whether the source of cells that are used to generate the iPS cell lines influences the efficiency of iPS cells to differentiate to CD45+ hematopoietic cells. Therefore, we generated 8 MEF-derived iPS cell lines, following the same protocol as for the BM-derived iPS cells. All clones were positive for the pluripotency markers SSEA-1 and alkaline phosphatase (data not shown, comparable to BM-iPS cell clones, see Fig. 1).
The MEF-iPS cells were differentiated along with the 2 control ES cell lines until day 10. All 8 MEF-iPS cell lines and the control ES cells gave rise to similar numbers of cells at days 5 and 10 (Fig. 3A). Further, similar numbers of Flk-1+ as well as CD41+ cells on day 5 and CD45+ cells on day 10 developed from the 8 differentiated MEF-iPS cell lines 1–8 and from ES cells (Fig. 3B, C).
Therefore, it appears that iPS cells derived from MEFs generate more CD45+ hematopoietic progenitors than iPS cells derived from BM cells.
Expression of Sox-2, Oct-4, and Klf-4 in undifferentiated and differentiating ES and iPS cells
pMY vectors that achieve high-titer retroviruses and efficiently express genes in hematopoietic progenitor cells have been used to derive iPS cells from hematopoietic progenitors. This favorable expression to derive iPS cells might, in turn, inhibit their differentiation potential, because they might still be active at high levels, even after iPS cells are induced to differentiate. This was tested in the following experiments.
Quantitative RT-PCR analyses were performed to determine the expression of Sox-2, Oct-4, and Klf-4 in ES cells and iPS cells (Fig. S4A). To distinguish between endogenous and exogenous expression, quantitative RT-PCR was also performed using primers that specifically amplify the endogenous genes by binding to the UTR sequences that are absent in the retroviral vectors (Fig. 4B). Nanog as a stem cell specific gene was also added as control (Fig. 4B). Normal ES cells express Sox-2, Oct-4, and Klf-4 in the undifferentiated stage at an expected level. When they differentiate into mesodermal-like cells from day 5 of the culture, they downregulate the expression of those genes by a factor of 100 for Sox-2 and a factor of 5–10 for Oct-4 and Klf-4.
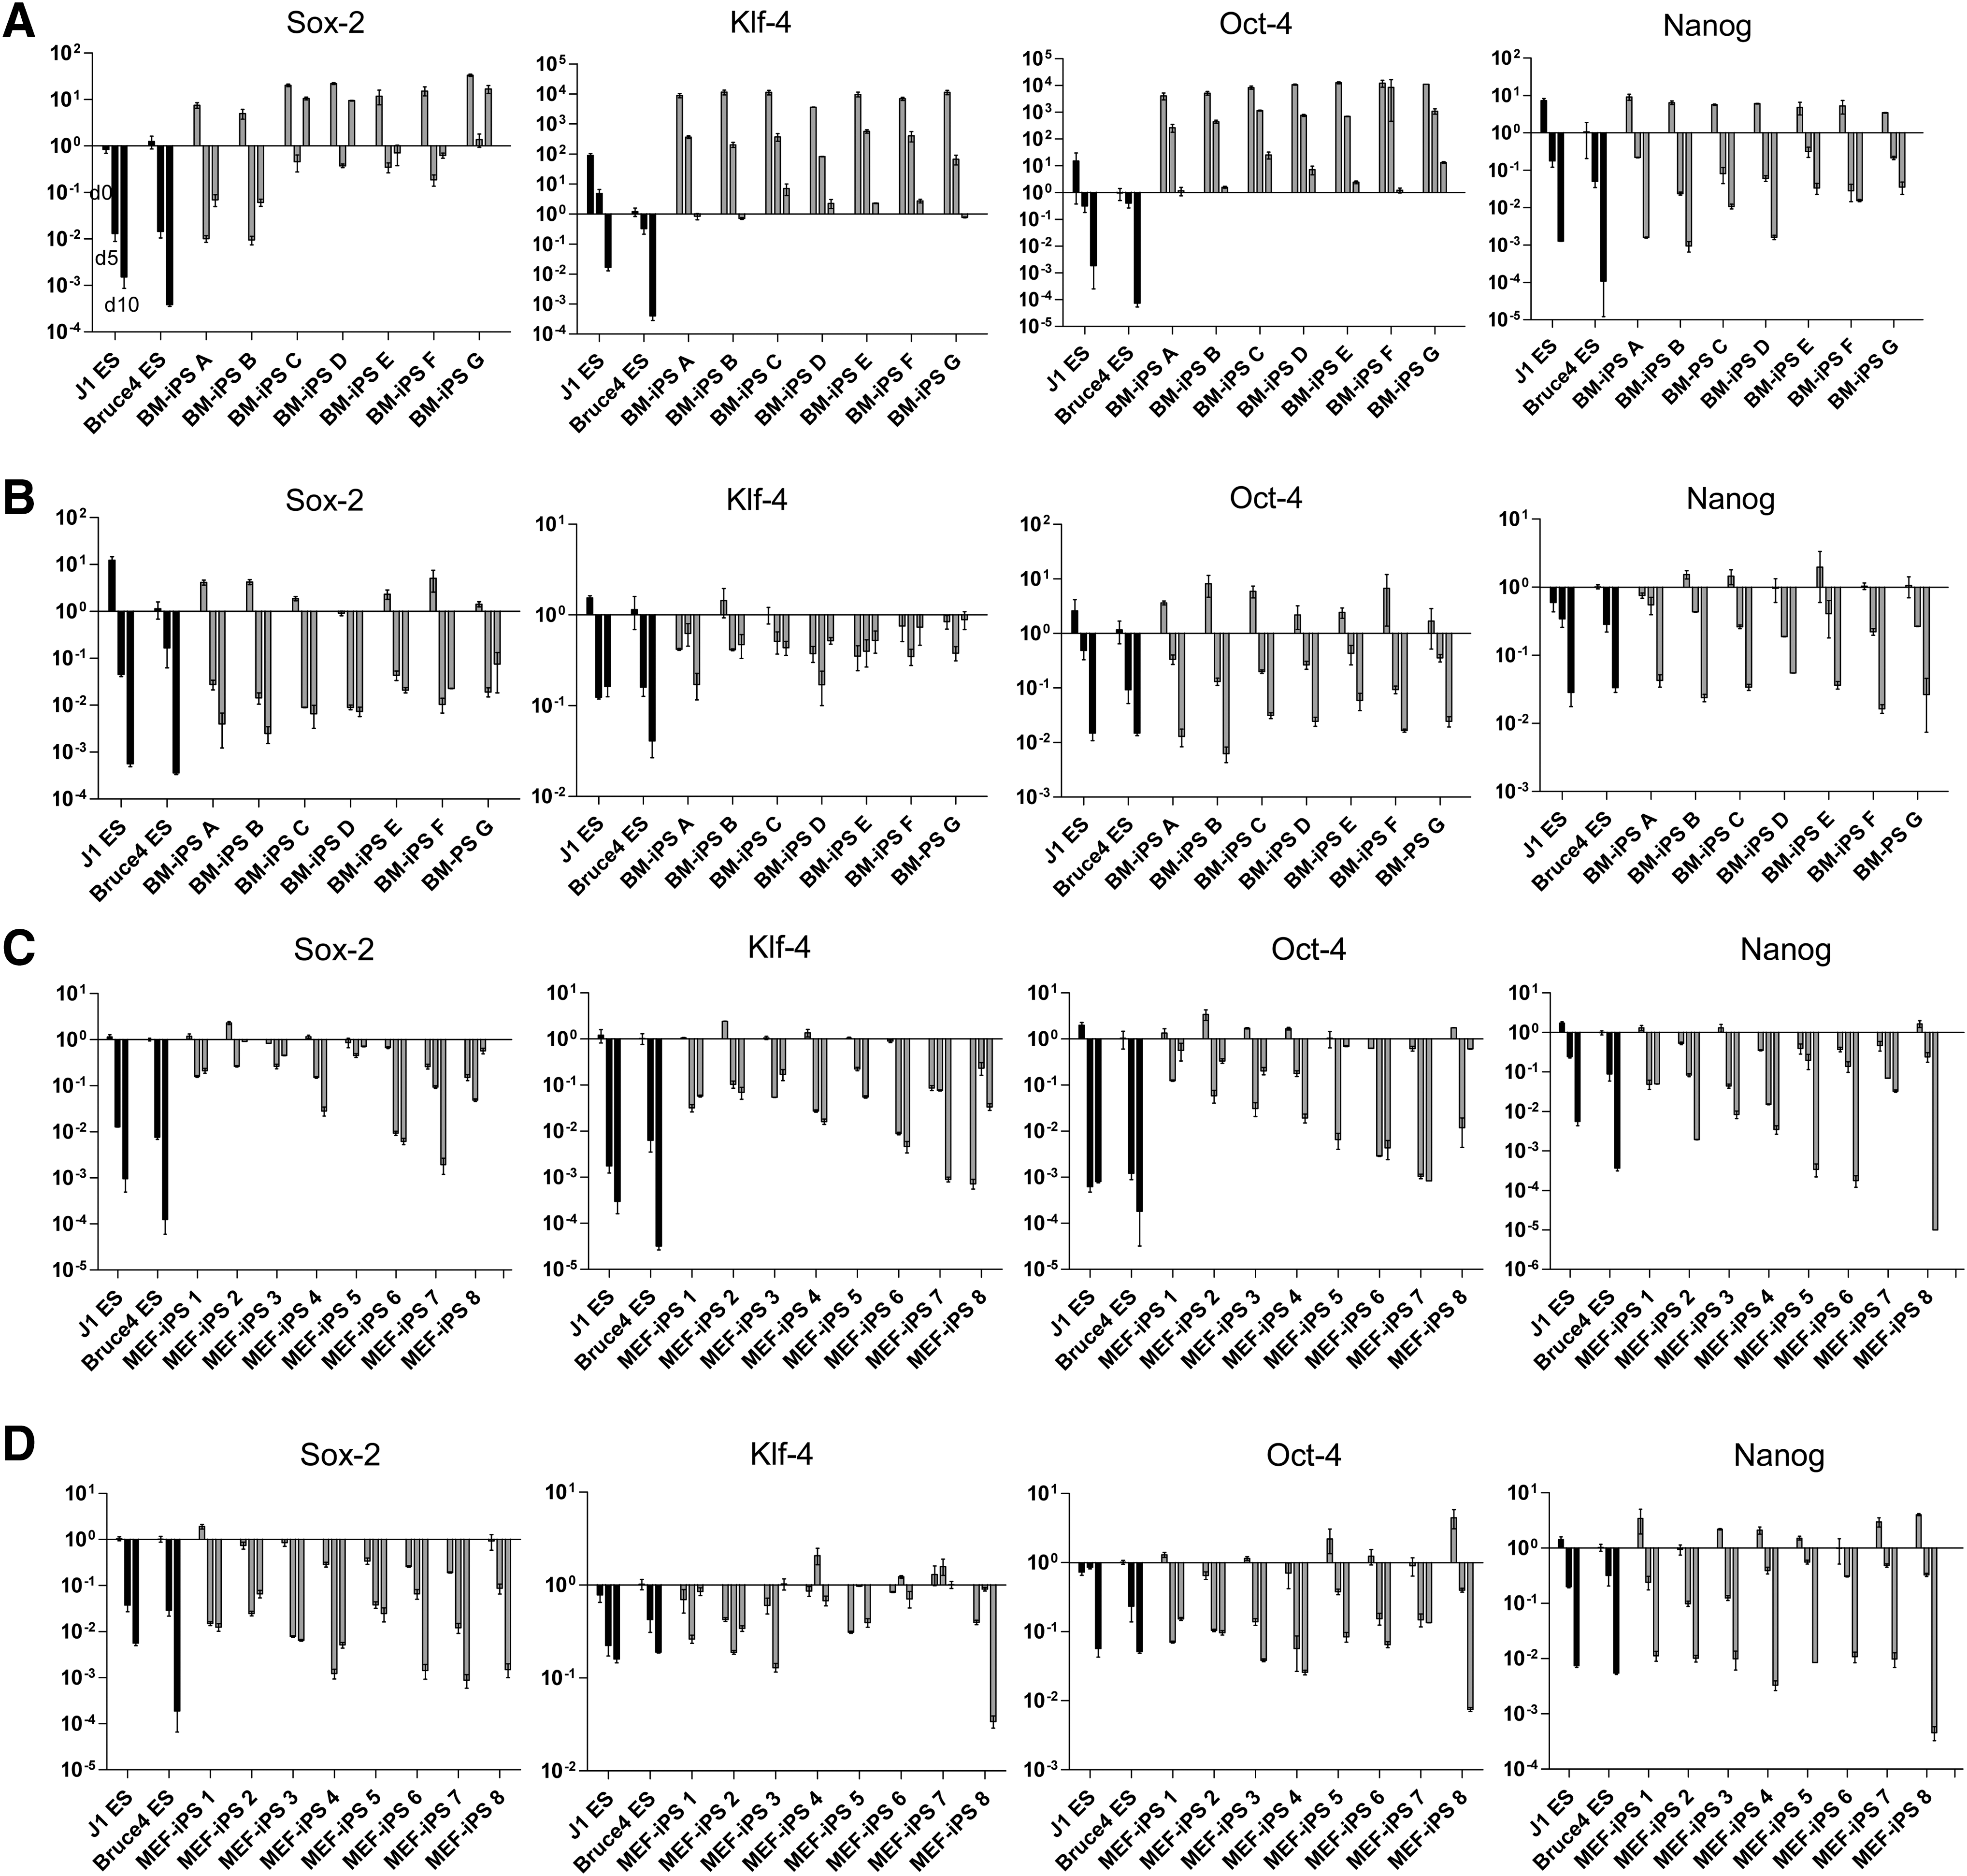
Expression levels of Sox-2, Oct-4, and Klf-4 in undifferentiated and differentiating ES and iPS cells.
All 7 BM-iPS lines show similar patterns of downregulation of Oct-4 and Klf-4 from day 0 over day 5 to 10 of iPS differentiation, all at higher levels compared with the 2 ES cell lines. Compared with ES cells, BM-iPS cells express 5,000–10,000 times more Klf-4 and Oct-4 in the undifferentiated stage. The expression levels of Oct-4 and Klf-4 are reduced in all BM-iPS cell clones when the cells differentiate, but remain 100–1,000-fold increased in differentiating iPS cells (days 5 and 10).
MEF-iPS cell clones show similar Klf-4 and Oct-4 mRNA expression levels as ES cells (Fig. S4B).
Expression of Sox-2 is around 10-fold higher in all BM-iPS lines, compared with ES cells. However, the downregulation of Sox-2 is markedly different. BM-iPS A and B express Sox-2 levels on day 5 of the culture similar to those in differentiating ES cells, whereas BM-iPS cell lines C, E, F, G, and H do not downregulate Sox-2 expression to a comparable extent. In BM-iPS cell lines C, D, and G Sox-2 expression is even upregulated again on day 10 of differentiation. In contrast to that, the analysis of endogenous gene expression shows a very similar pattern compared with ES cells in all 3 differentiation stages.
The ES-cell-like Sox-2 downregulation at day 5 in BM-iPS cell lines A and B is in line with their higher efficiency to develop into hematopoietic lineages compared with the other BM-iPS cell clones. It is also notable that the downregulation of Sox-2 expression in ES cells at day 10 of differentiation is not followed by the BM-iPS lines A and B, a difference that may contribute to the lower hematogenic capacity of the BM-derived iPS lines.
From these results, it appears that the pattern of Sox-2 expression in iPS cells during hematopoietic differentiation is a critical factor for the efficiency of this differentiation.
MEF-iPS cells show similar Sox-2 mRNA levels compared with ES cells (Fig. 4C, D).
From the endogenous gene expression analyses of Sox-2, Klf-4, Oct-4, and Nanog, it becomes clear that the ectopic overexpression of Sox-2, Klf-4, and Oct-4 itself has an effect on the iPS cells reducing their potential to differentiate into hematopoietic lineages.
In line with the effect of overexpression of the transcription factors is the observation that the lower overexpression observed in MEF-iPS cells correlates with a better hematopoietic potential.
Discussion
We have generated iPS cells from hematopoietic progenitors present in BM of 5-fluorouracil-treated mice, which proliferate in vitro in the presence of SCF and IL-6 [51,52]. These cells were retrovirally transduced for irreversible ectopic expression of Sox-2, Oct-4, and Klf-4 [12,13]. All iPS cell lines express pluripotency genes and give rise to teratoma when subcutaneously injected into mice. It was expected that iPS cells generated from hematopoietic progenitors might have epigenetic memory that might be close to the hematopoietic cells which we want to develop from the iPS cells in vitro. Such iPS cells might, therefore, be more efficient in the development of hematopoietic cell lineages in vitro and on transplantation in vivo.
The initiation of the developments of erythroid, myeloid, as well as T-, B-, and NK-lymphoid cells from BM-iPS cells are all severely reduced compared with ES cells.
The most obvious differences were detectable for the development into the B cell lineage. BM-iPS A showed only 10 times lower efficiency, whereas BM-iPS clones B and C were 10,000-fold less efficient and no preB cells were detectable from BM-iPS D-G. By contrast, the differences are not so severe for erythropoiesis and NK cell development. For most of the lineages, BM-iPS A proved to be the clone with the highest efficiency among the BM-iPS cell clones. However, for osteoclastogenesis, BM-iPS B gave rise to as many mature cells as BM-iPS A. These results indicate that different BM-iPS clones might have different capacities to develop into the different hematopoietic cell lineages. However, all of them are lower than ES cells.
Since the developmental potential of different types of hematopoietic lineages is reduced from BM-iPS cells compared with ES cells, we investigated the development of the common stages, that is, Flk1+ mesodermal cells (day 5) and CD45+ hematopoietic progenitors (day 10).
Of the 7 BM-iPS cell clones, 4 developed the same number, and 2 half the number of mesodermal Flk-1+ cells seen with ES cells at day 5 of iPS cell differentiation. Thereafter, from day 5 onward, all 7 BM-iPS cell lines generated much lower numbers of total and of CD45+ hematopoietic lineage cells, when compared with the 2 ES cell lines. In a parallel study, we have found that pluripotent hematopoietic progenitors develop in this in vitro culture system between days 9 and 10. (K. Seiler et al., manuscript in preparation). Therefore, it appears that the severely reduced capacity of our differentiating BM-iPS cell lines becomes manifest in the time between days 5 and 10 of in vitro development, that is, during the development of hematopoietic progenitors from mesodermal progenitors.
During this phase of in vitro development, increased apoptosis rates of BM-iPS cells is observed and is likely to be one of the reasons for the lower numbers of CD45+ hematopoietic progenitors that develop at day 10.
It should be clear from our experimental results that our studies cannot clarify whether, and, if so, how this defective development continues into the different hematopoietic cell lineages after day 10 of differentiation.
iPS cell generation and subsequent differentiation, either to whole mice or to differentiated cell lineages in vitro, may be the consequence of the loss or mutation of genes [20] or of epigenetic programming of the cells of origin, such as DNA methylation or miRNA expression, that is maintained in the iPS cells. Therefore, one explanation for the different capacities of BM-derived iPS cell clones A-G to generate hematopoietic cells could be that these different clones derive from different differentiation stages of BM. If this is the case, then MEF-derived iPS cell lines are better sources for hematopoietic development than any of the BM-derived iPS cell clones studied in this article.
For our BM-derived iPS cell lines, it appears also reasonable to expect that the strongly increased, irreversible expressions of Sox-2, Oct-4, and Klf-4 in the iPS cells and in the same, differentiating iPS cells at days 5 and 10 are major contributing factors that inhibit normal development from mesodermal-like cells at day 5 to hematopoietic progenitors at day 10. In this context, it is worth noting that the BM-iPS cell lines with the lowest increase in Sox-2 expression (lines A and B, Fig. 4A) have the best capacities to develop hematopoietic progenitors between days 5 and 10, and erythroid, myeloid, and lymphoid cells thereafter. It is, therefore, not clear whether all 3 transcription factors, or only 1 or 2 of them, suppress hematopoiesis. The analysis of the endogenous expression of Sox-2, Oct-4, and Klf-4 in all iPS cell lines in comparison to ES cells showed that they express similar levels. Therefore, we suggest that the hematopoietically suppressive actions are the direct result of the action of the transduced genes and not an indirect activation of the endogenous loci by the transduced gene products.
The BM-derived iPS cell clones all show at least 2-fold-elevated levels of transduced Oct-4 and Klf-4 expression compared with the expression of the corresponding endogenous gene loci in nontransduced ES cells. In contrast, the MEF-derived iPS cell clones do not express the reprogramming factors at significantly higher levels than ES cells. This might indicate that high expression of these transduced transcription factors, maintained during iPS cell differentiation, could inhibit hematopoietic cell development. This possibility is also suggested from the differences in transduced Sox-2 expression in different BM-derived iPS cell clones where low levels correlate with increased capacities of hematopoietic cell development. However, it is also possible that different cellular sources (BM, MEF) provide additional factors that influence the development of iPS cells generated from them to subsequent hematopoiesis.
Previous studies using human iPS cells demonstrated significant differences in efficiency of blood production from different lentivirally derived iPS cell lines from fibroblasts [53]. Interestingly, these differences were not related to the type of reprogrammed fibroblasts or to the background of expression of reprogramming factors. This might indicate that there are differences of the character of human and mouse iPS cells which remain to be studied.
Conclusion
One practical consequence of our studies for the development and use in hematopoiesis and hematopoietic cell replacement strategies comes from our analyses of the ectopic expression of Sox-2, Oct-4, and Klf-4. Turning off the expression of these transcription factors might be crucial for proper differentiation of the iPS cells. It is also possible that origin of cells being reprogrammed toward iPS cells might be critical to develop hematopoietic progenitors.
Footnotes
Acknowledgments
The authors thank Irving F. Weissman for ES cell lines; Juan Carlos Zuniga-Pfluecker for OP9 and OP9-DL1 cells lines; Thorsten Feyerabend for the CHO-SCF cell line; Paulo Vieira for the Sp2.0-Flt-3L cell line; and Patricia Vegh, Jana Winckler, and Erika Berg for technical assistance. The work was supported by 2 grants, 1 from the MPG to F.M. and 1 to K.K. for collaborative studies between MPIIB-Berlin of the MPG and NTU.
Author Disclosure Statement
The authors have no conflicting financial interests.
References
Supplementary Material
Please find the following supplemental material available below.
For Open Access articles published under a Creative Commons License, all supplemental material carries the same license as the article it is associated with.
For non-Open Access articles published, all supplemental material carries a non-exclusive license, and permission requests for re-use of supplemental material or any part of supplemental material shall be sent directly to the copyright owner as specified in the copyright notice associated with the article.