
Abstract
Nitric oxide (NO), an important mediator molecule in mammalian physiology, initiates a number of signaling mechanisms by activating the enzyme soluble guanylyl cyclase (sGC). Recently, a new role for NO/cyclic guanosine monophosphate signaling in embryonic development and cell differentiation has emerged. The changes in expression of NO synthase isoforms and various sGC subunits has been demonstrated during human and mouse embryonic stem (ES) cells differentiation. Previously, our laboratory demonstrated that nascent α1 sGC transcript undergoes alternative splicing and that expression of α1 sGC splice forms directly affects sGC activity. Expression of sGC splice variants in the process of human ES (hES) cells differentiation has not been investigated. In this report, we demonstrate that α1 sGC undergoes alternative splicing during random hES differentiation for the first time. Our results indicate that C-α1 sGC splice form is expressed at high levels in differentiating cells and its intracellular distribution varies from canonical α1 sGC subunit. Together, our data suggest that alternative splicing of sGC subunits is associated with differentiation of hES cells.
Introduction
N
sGC is a heme-containing heterodimer composed of α and β subunits that catalyzes the synthesis of second messenger cGMP from guanosine triphosphate [5]. Direct binding of NO to the sGC heme group increases the production of cGMP more than 100-fold [6]. Each sGC subunit is represented by 2 isoforms (α1, α2 and β1, β2) encoded by separate genes. To date, only heterodimers containing the β1 subunit were shown to be catalytically active in vivo [7]. sGC is the only known NO-activated sGC and represents a unique link connecting the upstream NO signaling with its multiple downstream cGMP-binding effectors, including protein kinases, phosphodiesterases, and cyclic nucleotide-gated channels [8].
The precise role of different enzymatic components of NO/cGMP pathway in development still remains unclear. However, several reports from different laboratories indicate that the alterations in NO/cGMP intracellular levels affect the differentiation of bone-marrow-derived progenitor and embryonic stem (ES) cells [9 –11]. Previously, our laboratory demonstrated a dynamic expression of NOS isoforms and sGC subunits during mouse and human embryonic cells differentiation. Undifferentiated ES cells do not express enzymatically active sGC, but with cell differentiation the α1/β1 sGC mRNA and protein levels increase, which coincides with augmentation of NO-inducible intracellular cGMP levels [12 –14]. The administration of NO donors and various sGC activators also affects the expression of cardiac-specific genes (myosin light chain and Nkx2.5 transcriptional factor), suggesting a possible role of the NO/cGMP signaling in cardiomyocyte differentiation [14]. Therefore, regulation of sGC expression and activity may be essential for properly directing the process of cell differentiation.
sGC is regulated on multiple levels, including transcriptional, post-transcriptional, and post-translational [15 –19]. At the post-transcriptional level alternative RNA splicing has been shown to produce several sGC isoforms [17,20 –23]. Previously, our laboratory demonstrated the existence of α1 sGC splice variants encoding proteins with various deletions in C- and N-termini [17]. One of the characterized splice forms, N1-α1 sGC, exhibited the properties of a dominant-negative regulator by inhibiting functional α1/β1 sGC activity when overexpressed in insect Sf9 or human neuroblastoma BE2 cells. Another splice variant, C-α1 sGC, supported a fully active heterodimer with β1 subunit and was uniquely resistant to oxidative protein degradation. As alternative splicing of sGC genes regulates sGC function, it also has the potential to play an important role in ES cells differentiation by modulating sGC activity.
Since the expression of splice variants of sGC genes in the process of ES differentiation has not been investigated previously, in this report we evaluate the splicing of α1 sGC gene. We demonstrate for the first time that α1 sGC gene undergoes alternative splicing during human ES (hES) cells differentiation. We also show that the relative amounts of α1 sGC transcripts and proteins change during the time course of differentiation. Our results indicate that high level of C-α1 sGC splice form is expressed in differentiating cells and that its intracellular distribution varies from the canonical α1 sGC subunit. Together, our data suggest that alternative splicing of sGC subunits may play an important role in differentiation of human stem cells.
Materials and Methods
Cell culture
Human ES cells H-9 (WA-09) were purchased from WiCell Research Institute and grown on Dulbecco-modified Eagle's medium/F12 medium supplemented with 20% knockout serum replacer, 1 mM L-glutamine, 0.1 mM β-mercapthoethanol, 1 mM nonessential amino acids, and 4 ng/mL basic fibroblast growth factor as described previously [13,14]. All cell culture reagents were purchased from Invitrogen Corporation. ES cells were subjected to differentiation using embryoid bodies (EB) formation as previously described [12]. Day 0 represents the undifferentiated ES cells, before subjecting cells to EB formation. Differentiating cell cultures were harvested at different time points for analysis.
Reverse transcription-polymerase chain reaction and quantitative real-time polymerase chain reaction
Total RNA from ES cells was isolated by using UltraSpec total RNA isolation reagent (Biotecx). cDNA was prepared using a high-capacity cDNA kit (Applied Biosystems). Analysis was performed by the Quantitative Genomics Core Laboratory at the University of Texas at Houston Medical School using quantitative assays for α1, N1- and N2-α1 sGC (Applied Biosystems, [17]). Absolute amounts of transcripts were determined using the relative standard curve method and were normalized on 36B4 housekeeping gene levels. The assay for α1 sGC canonical mRNA was targeted to a sequence in the α1 sGC transcript coding full-size protein (accession no. Y15723), which is shared by all α1 sGC transcripts.
Western blot analysis
Western blot analysis was performed as described previously [17]. Briefly, H9 cellular lysates were prepared in 50 mM TEA buffer (pH 7.4) containing protease inhibitor cocktail (Sigma). Protein lysates (20 μg) were loaded on 8% polyacrylamide gels, separated by electrophoresis, and transferred on polyvinylidene fluoride membranes. Membranes were blocked with 5% nonfat milk in Dulbecco's Phosphate Buffered Saline (DPBS), incubated with primary antibodies for 1 h and with secondary horseradish peroxidase-conjugated antibodies (Sigma) for 45 min at room temperature. The signal was observed by enhanced chemiluminescence (ECL Plus; Amersham). The following primary antibodies were used: custom-made rabbit polyclonal anti-α1 sGC antibodies raised against human C-terminal peptide FTPRSREELPPNFP (1:1,000 dilution), custom-made rabbit polyclonal anti-β1 sGC antibodies raised against human peptide Ac-EKNIQESLPQRKTSRSRVYLHTC-Amide (1:2,500 dilution), and β-actin (Sigma; 1:7,000 dilution).
Immunocytochemistry
Immunochemistry was performed as described previously with minor modifications [14]. Unless noted, all reagents were from Molecular Probes. The cells grown on gelatin-coated chamber slides (Nalgen Nunc International) were washed in phosphate-buffered saline and fixed in 4% paraformaldehyde for 30 min and permeabilized in 0.1% Triton × 100 (Sigma) for 15 min at room temperature. Slides were incubated for 1 h at room temperature with primary antibodies against OCT3/4 (C-10, 1:50; Santa Cruz Biotechnology); Nanog (1:150; Chemicon); tubulin (5H1, 1:10; BD Pharmigen); f-actin (1:40; Invitrogen); cGMP (1:5,000, [12]); or anti-α1 sGC (1:100) and anti-β1 sGC (1:150) described above. Signal was observed with Alexa-Flour fluorescently labeled secondary antibodies. 4′,6-diamidino-2-phenylindole (DAPI) was used for nuclear staining. Digital images were acquired with an inverted fluorescent Zeiss microscope and Zeiss image capturing software. For confocal microscopy, cells were detached by treatment with 2 mg/mL collagenase IV (Invitrogen), sedimented on a slide by centrifugation, and processed as described above, except that ToPro-3 dye was used for nuclei staining. Images were captured by a Leica confocal microscopy system and processed with Leica LAS imaging software.
Results
Analysis of α1 and β1 sGC, Oct3/4, NANOG protein expression, and cGMP intracellular levels in differentiating H9 hES cells
Expression of α1 and β1 sGC, Oct3/4, NANOG proteins, and cGMP levels was detected by immunocytochemistry in undifferentiated (day 0) and differentiating (day 18) H9 cells (Fig. 1A, B). Oct3/4 and NANOG proteins are markers of pluripotency [24], and their staining was drastically reduced in differentiated cells. On the contrary, expression of α1 and β1 sGC proteins was significantly elevated, which coincided with increased staining for intracellular cGMP. The intensity of α1/β1 sGC and cGMP staining varied between individual cells, indicating that sGC is differentially expressed in heterogeneous cell population. Our cultures contained on average 14% ± 6.7% (per 100 cells in the field of vision; mean ± standard deviation, n = 5) of α1 sGC-positive cells. The observed immunostaining was specific to α1 sGC according to the validation based on established cell models: sGC-positive BE2 human neuroblastoma cells [17], and sGC-negative T84 human colorectal carcinoma cells [25] and COS7 [25] (see Supplementary Fig. S1; Supplementary Data are available online at
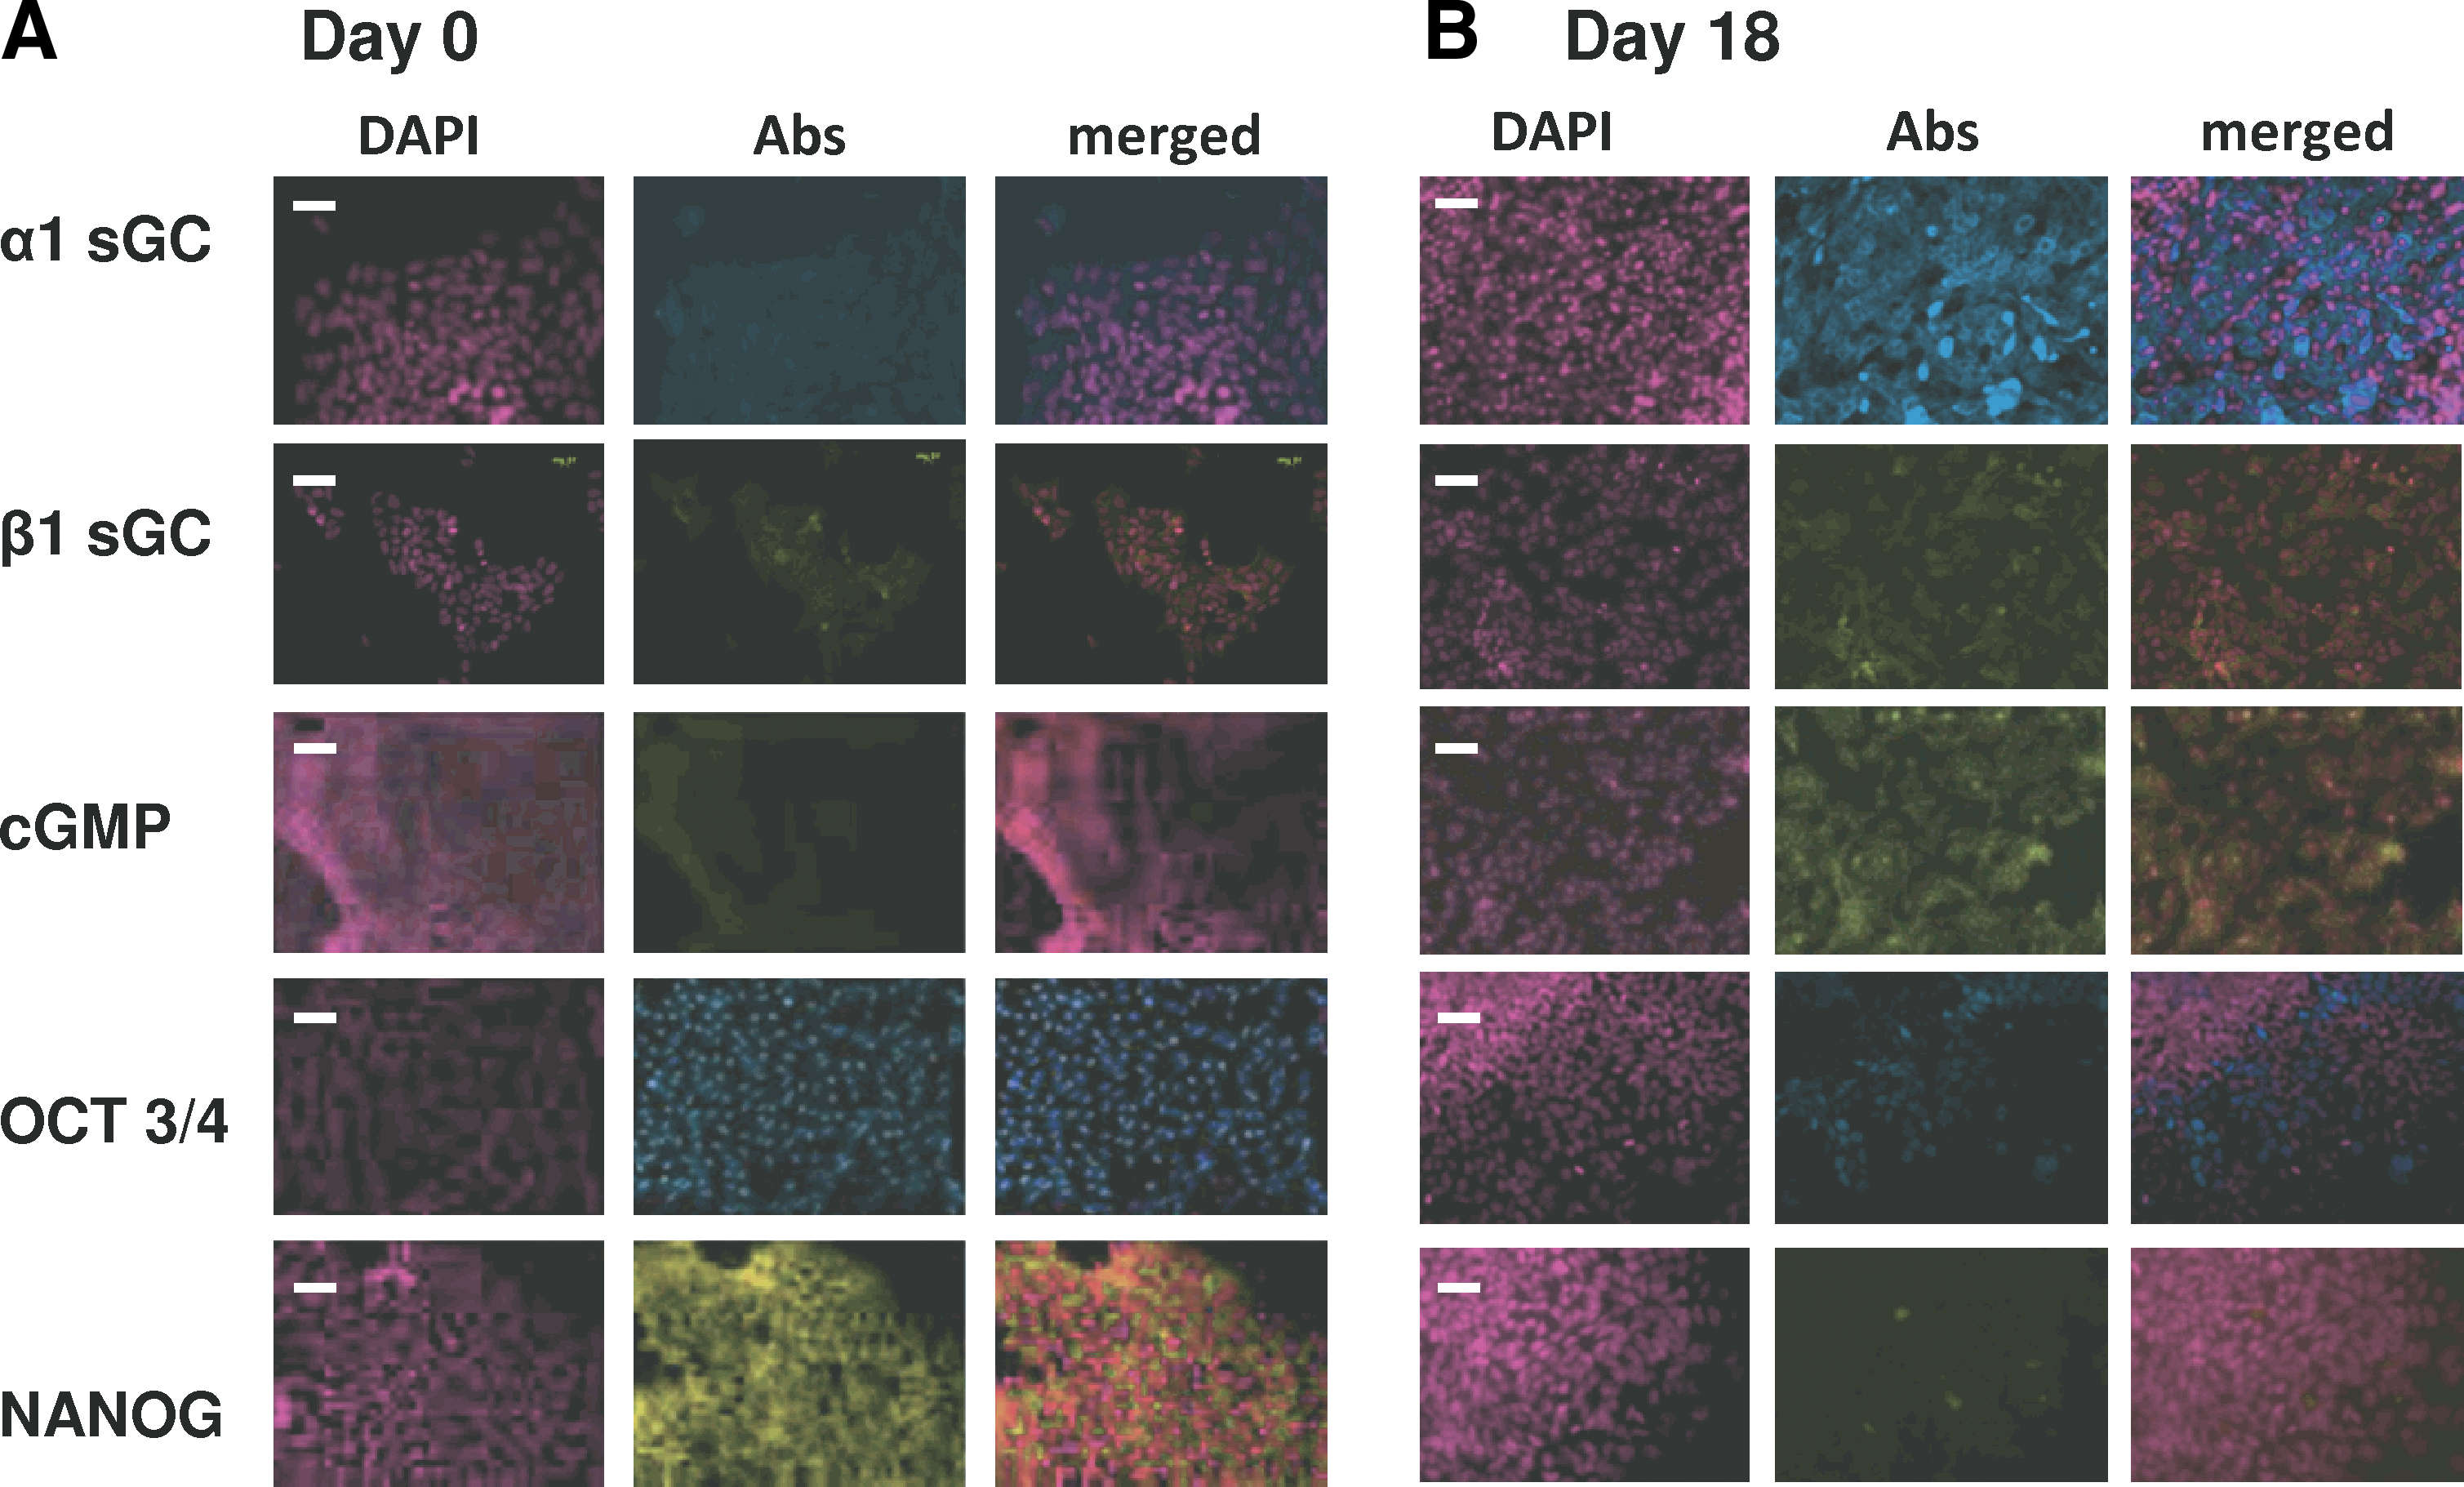
Expression of α1 and β1 sGC is increased in differentiated H9 human ES cells.
Expression of N1, N2, and C-α1 sGC splice variant transcripts in differentiating H9 cells
Quantitative real-time polymerase chain reaction (qRT-PCR) analysis was used to detect changes in expression of canonical α1 sGC and N1- and N2-α1 splice variants at various stages of H9 ES cells differentiation (Fig. 2). None of the α1 sGC transcripts was detected in undifferentiated cells. However, the expression of canonical α1 sGC and N1- and N2-α1 sGC splice isoforms demonstrated robust induction during the course of differentiation with maximal increase at day 12–14 (Fig. 2A–C). Semi-qualitative RT-PCR detection was used to detect the expression of C-α1 sGC transcript. Similar to other sGC mRNA isoforms, the expression of C-α1 transcript was observed starting from day 6 (Fig. 2D) and continued though the entire time course. Thus, we conclude that α1 sGC nascent RNA undergoes alternative splicing during the differentiation of hES cells.
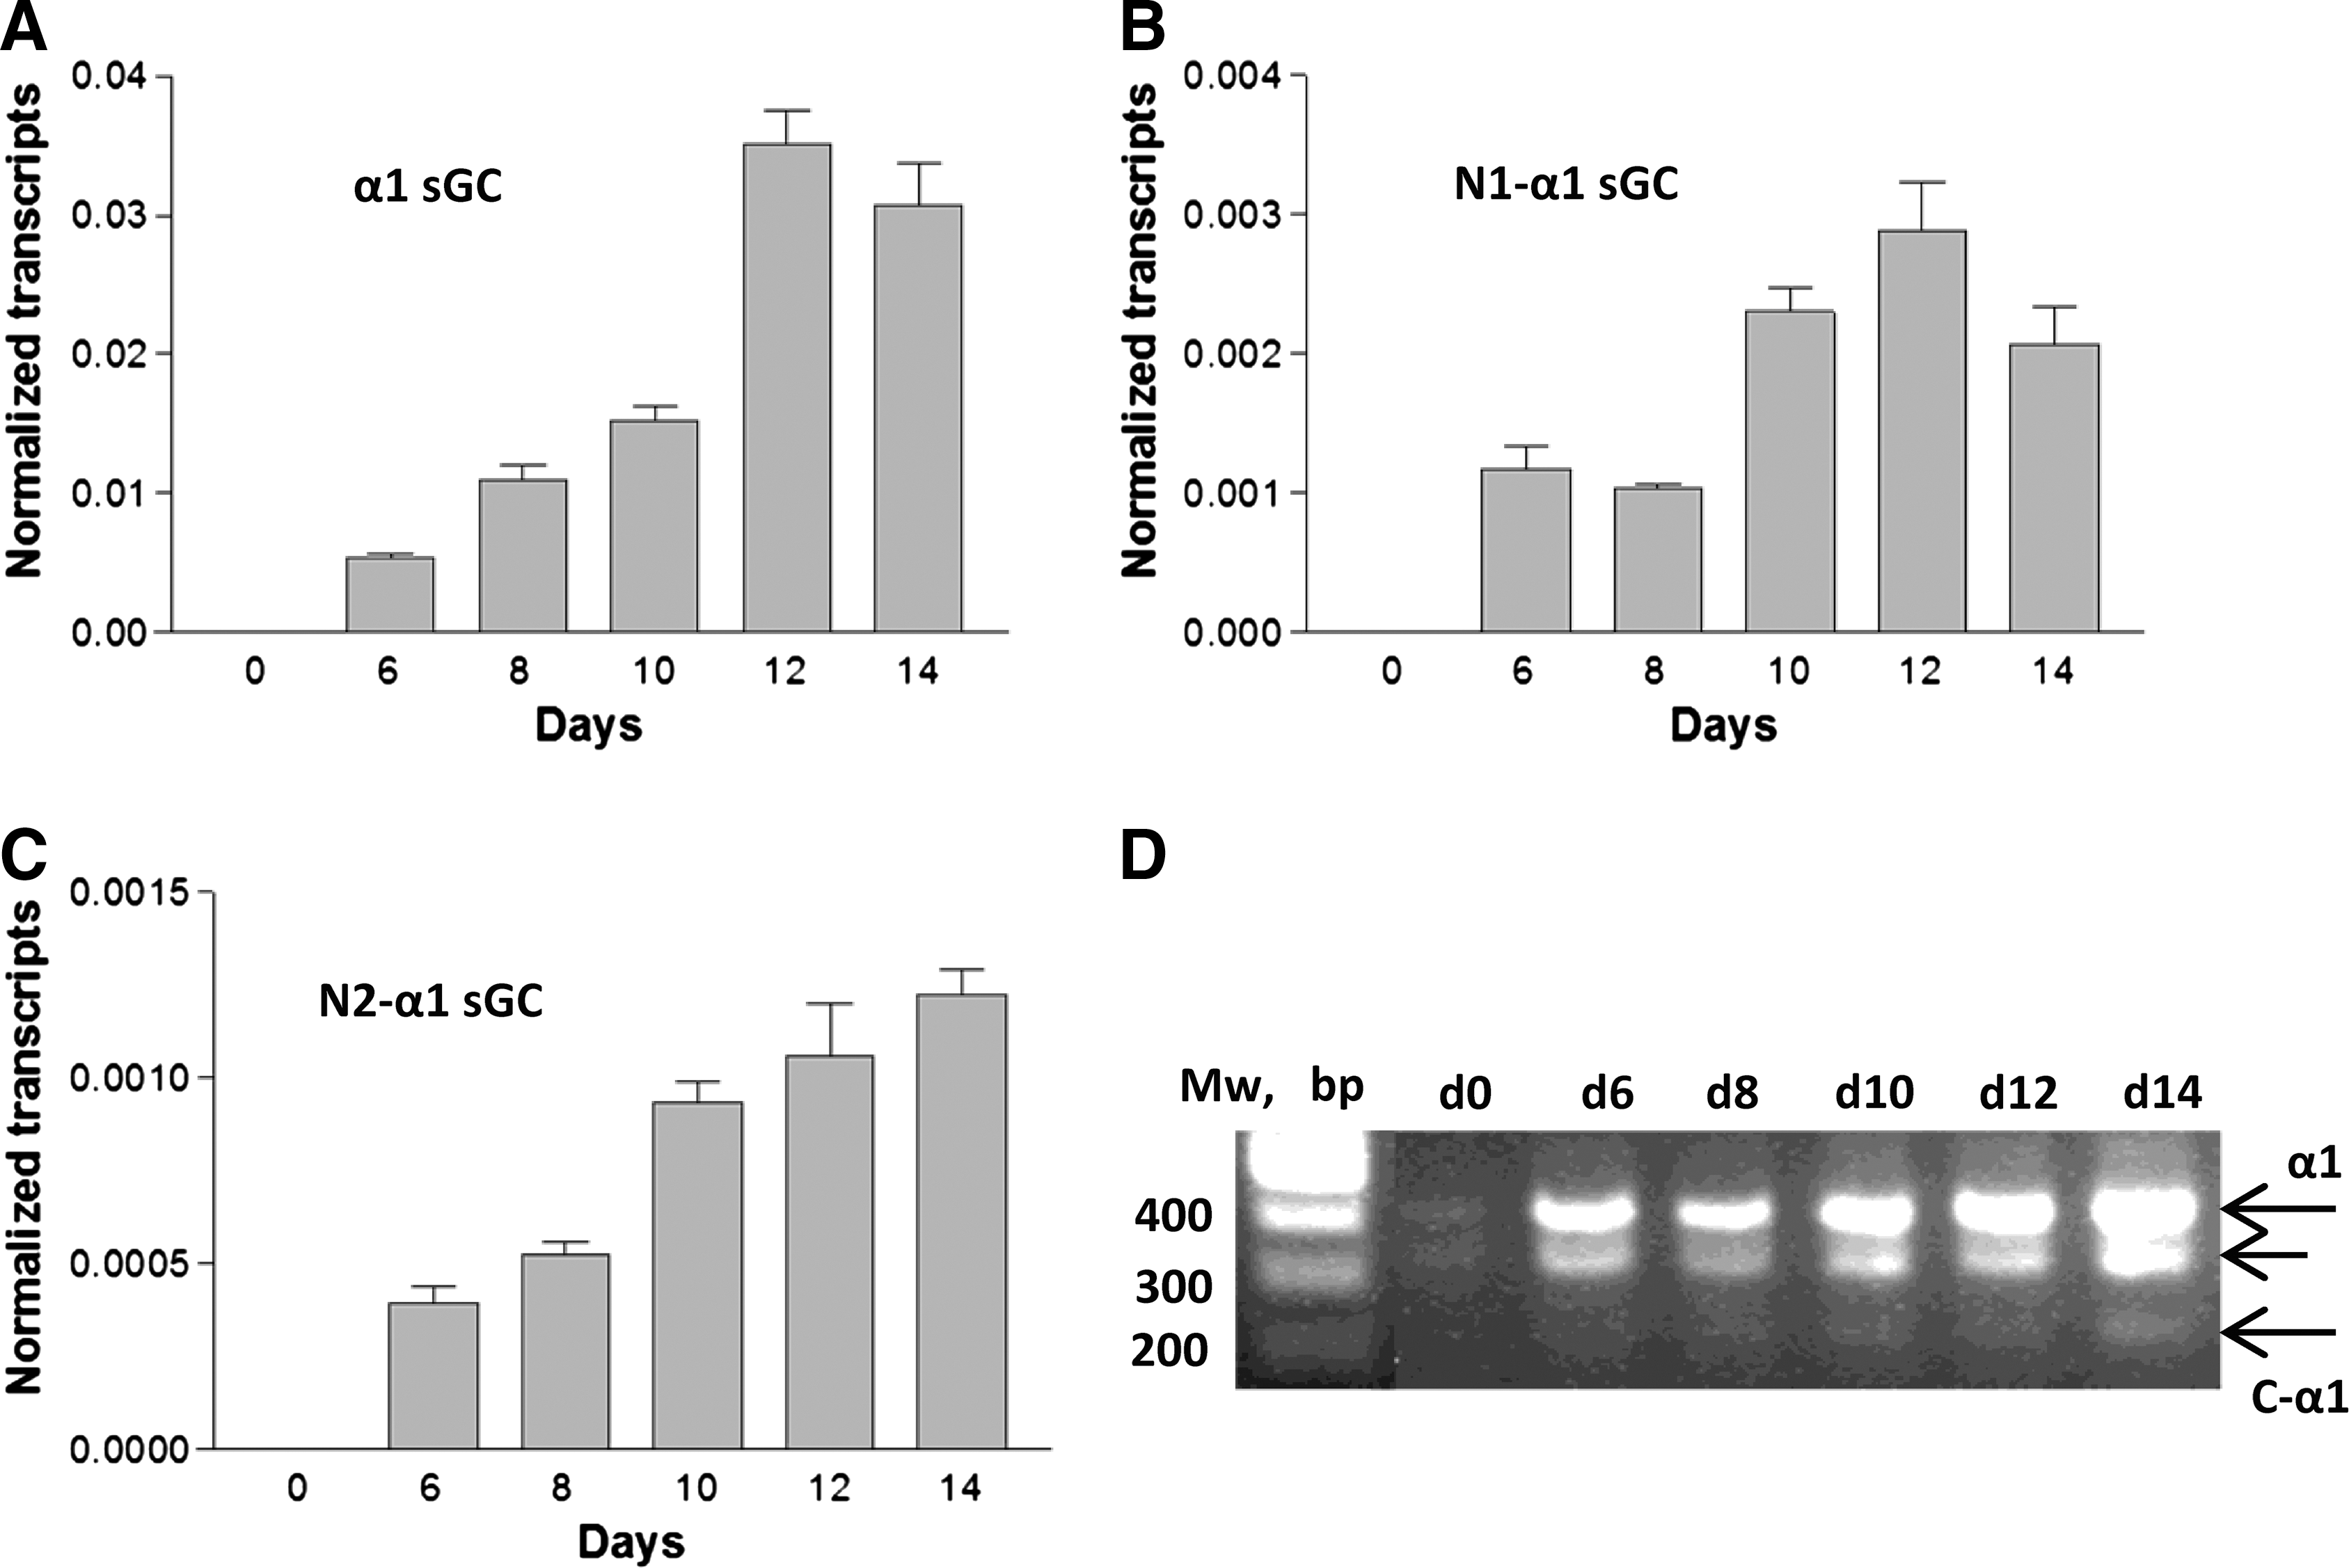
Nascent α1 sGC transcript undergoes splicing during H-9 cell differentiation. Differentiating H9 cells were collected on days 0, 6, 8, 10, 12, and 14 of differentiation and qRT-PCR analysis was performed to determine relative expression of canonical α1
Subcellular distribution of α1 sGC and C-α1 sGC proteins in differentiating H9 cells
We investigated the changes in expression of α1 and C-α1 sGC protein during EB-directed H9 differentiation. We used antibodies against C-terminal epitope of α1 sGC that recognize both the full-size α1 (83 kDa) sGC and shortened C-α1 sGC splice form (54 kDa) proteins [17]. As expected, the expression of α1 sGC protein was increased in total cell lysates starting on day 6 and increased continuously throughout day 32 (results not shown). As a next step, H9 lysates were partitioned by centrifugation into fractions representing different subcellular compartments to investigate the subcellular localization of α1 and C-α1 sGC proteins according to the scheme represented in Fig. 3A. The fraction containing big organelles (nuclei, mitochondria, and lysosomes [26]) was pelleted at 14,000 g (Fig. 3D). Collected supernatants (Fig. 3B) were further separated into plasma membrane/microsomal fraction (Fig. 3D, pellet) and cytosol (Fig. 3C, supernatant) by centrifugation at 100,000 g. Samples collected at every stage of separation were analyzed by Western blotting with anti-α1 sGC antibodies. The results demonstrated that canonical α1 sGC protein was present in both 14,000 and 100,000 g supernatants (Fig. 3B, C). A part of canonical α1 sGC was found in 14,000 g pellet fraction and relatively small, but detectable amount was found in 100,000 g pellet (Fig. 3D, E). The relative amount of C-α1 protein remained at detectable levels throughout the time course with maximal expression around day 10, when it represented a significant portion of cumulative α1 sGC protein. Interestingly, C-α1 protein was found almost exclusively in the supernatant fraction and only traces were present in 14,000 g pellets, indicating preferential cytosolic localization of this splice form.

Expression of canonical α1 and C-α1 sGC splice form proteins in differentiated H9 cells. Lysates of H9 cells were prepared at different days after the transfer to differentiation media, fractionated by high-speed centrifugation according to the scheme
Immunocytochemistry analysis of cellular localization of α1 sGC and C-α1 sGC proteins in differentiating H9 cells
To assess cellular localization of α1 sGC proteins in differentiated H9 cells, immunocytochemistry was performed on day 12 of differentiation. Two different patterns of immunoreactive staining were observed in the α1 sGC-positive cell population. The main population (representing ∼88% of positive cells) showed a diffused staining corresponding to cellular cytosol (Fig. 4, right pane). A smaller fraction of stained cells (∼12%) demonstrated intense filamentous staining, indicating that α1 sGC protein is likely to be associated with some intracellular structures in these cells (Fig. 4, left pane).
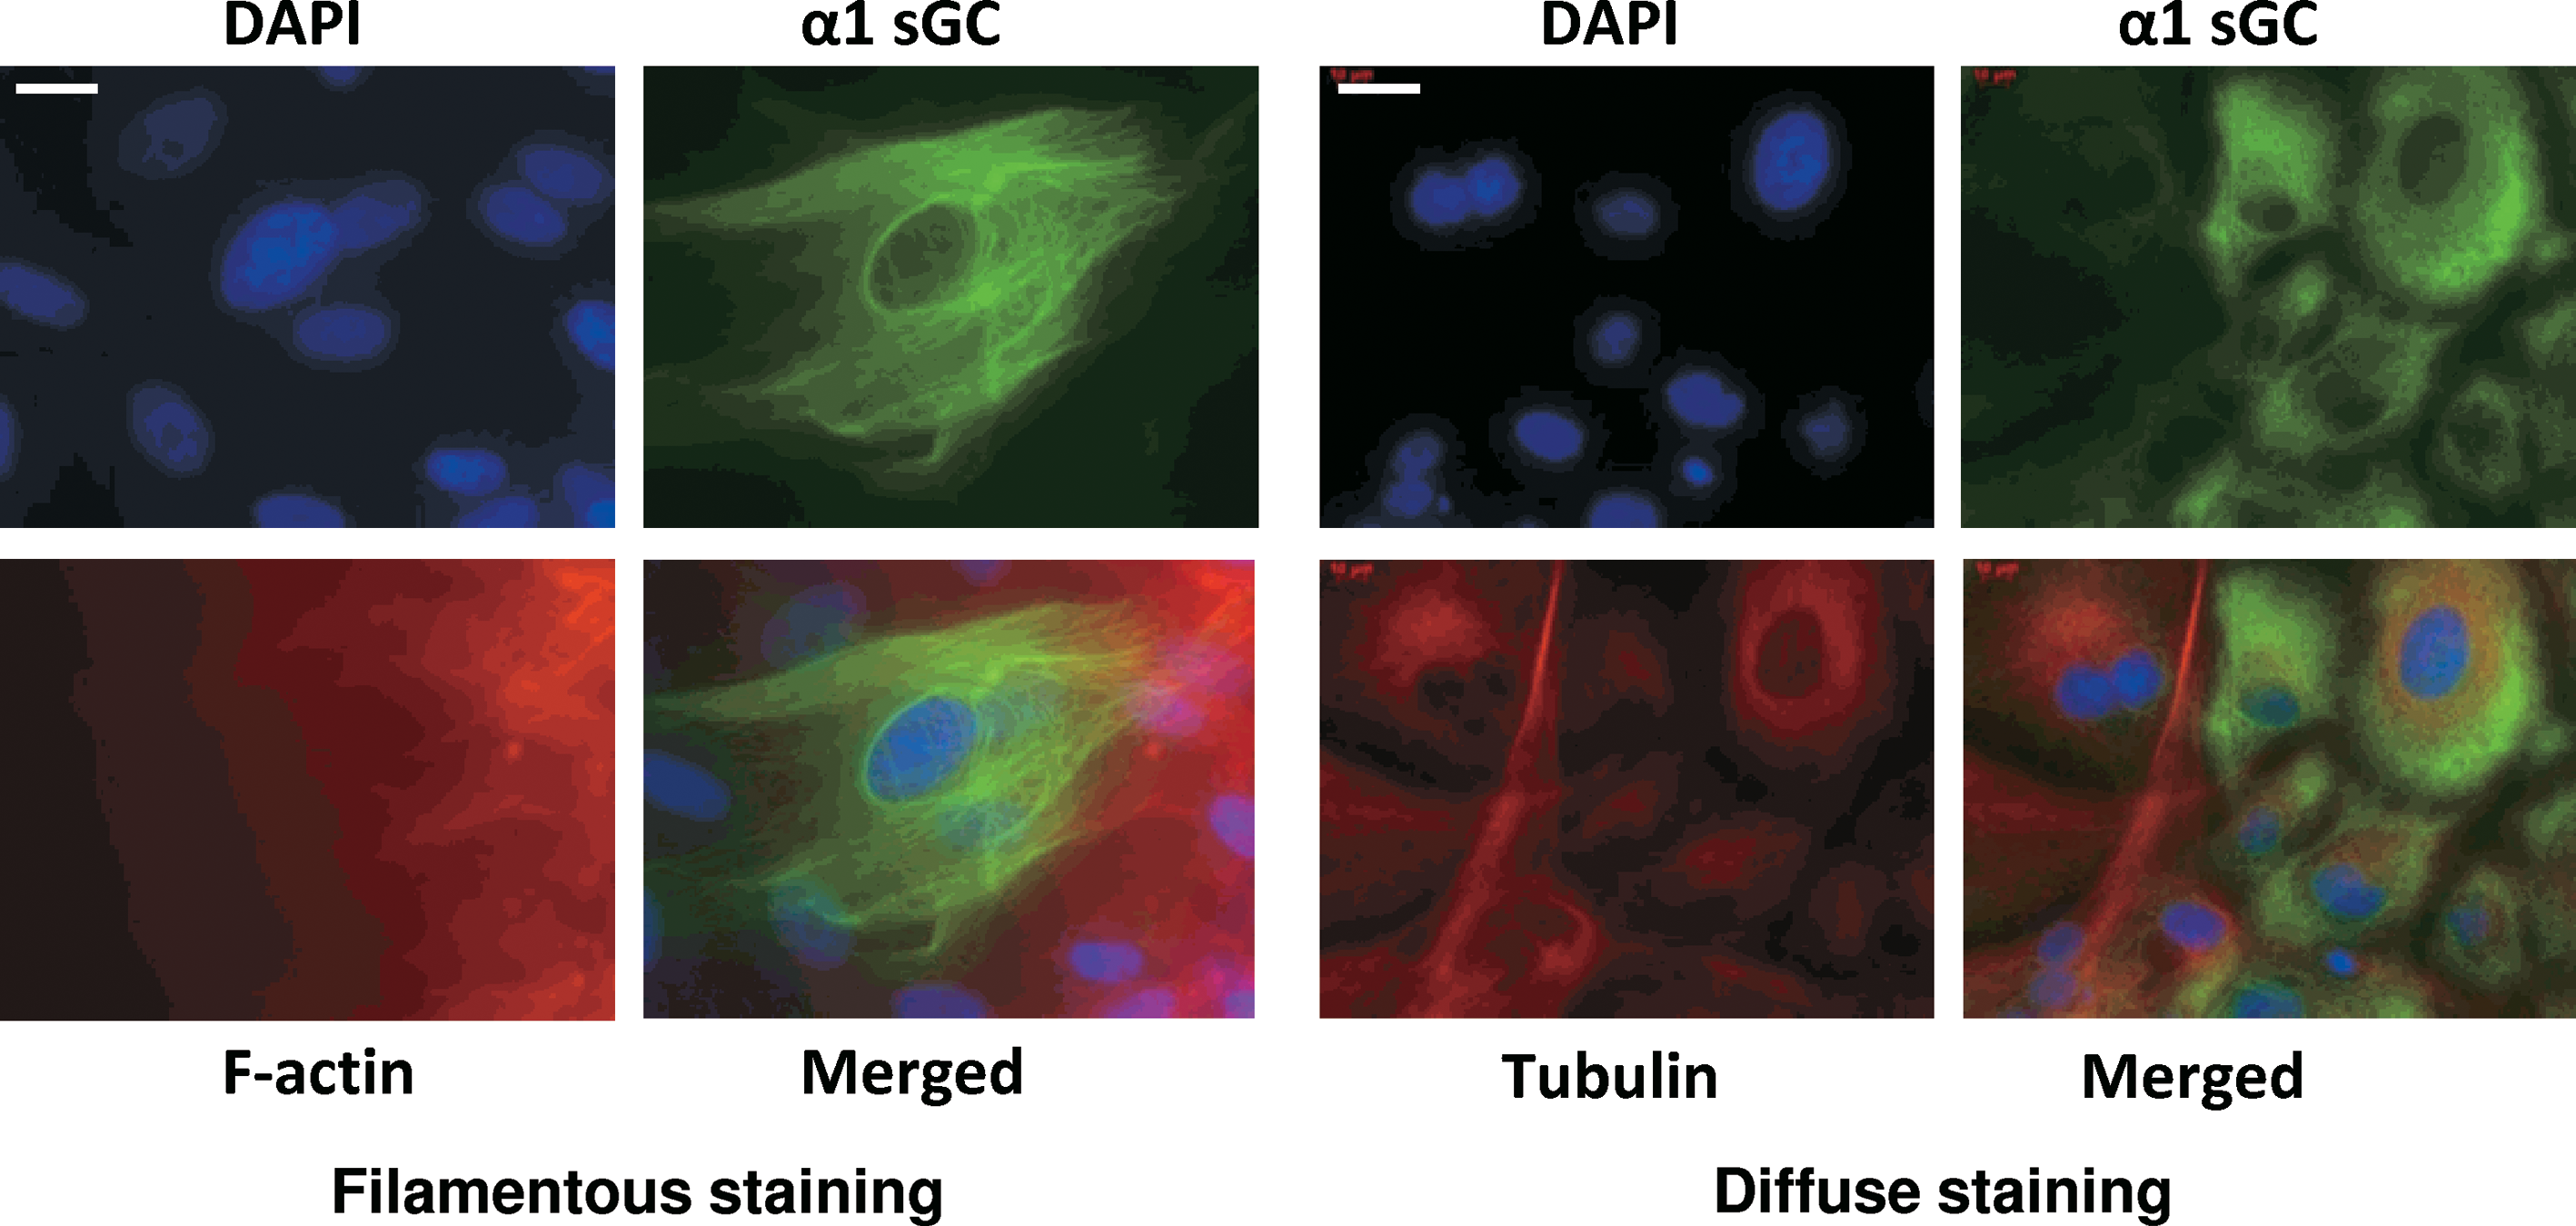
Cellular localization of α1 sGC in differentiating ES cells. H9 cells were fixed with 4% paraformaldehyde on various days of differentiation induced by embryoid bodies formation. Cells were co-immunostained with anti-tubulin, or f-actin (red) and anti-α1 sGC (green) antibodies. Cells were counterstained with DAPI for DNA and images were captured with an inverted fluorescent microscope. Scale bars = 30 μm. Figures are representative of 3 independent experiments. Color images available online at
The β1 sGC subunit was shown to be associated with chromosomes during mitosis and was localized to the perinuclear region in a number of cell lines [27]. Thus, we have assessed subcellular localization of sGC α1 and β1 subunits in differentiated H9 cells by confocal microscopy. Data shown in Fig. 5 indicate that α1 sGC is predominantly localized in the cytosol. On the contrary, the β1 sGC subunit demonstrated both perinuclear and cytosolic localization supporting the hypothesis that sGC subunits might participate in differentiation process as hetero- and mono-dimers [27].
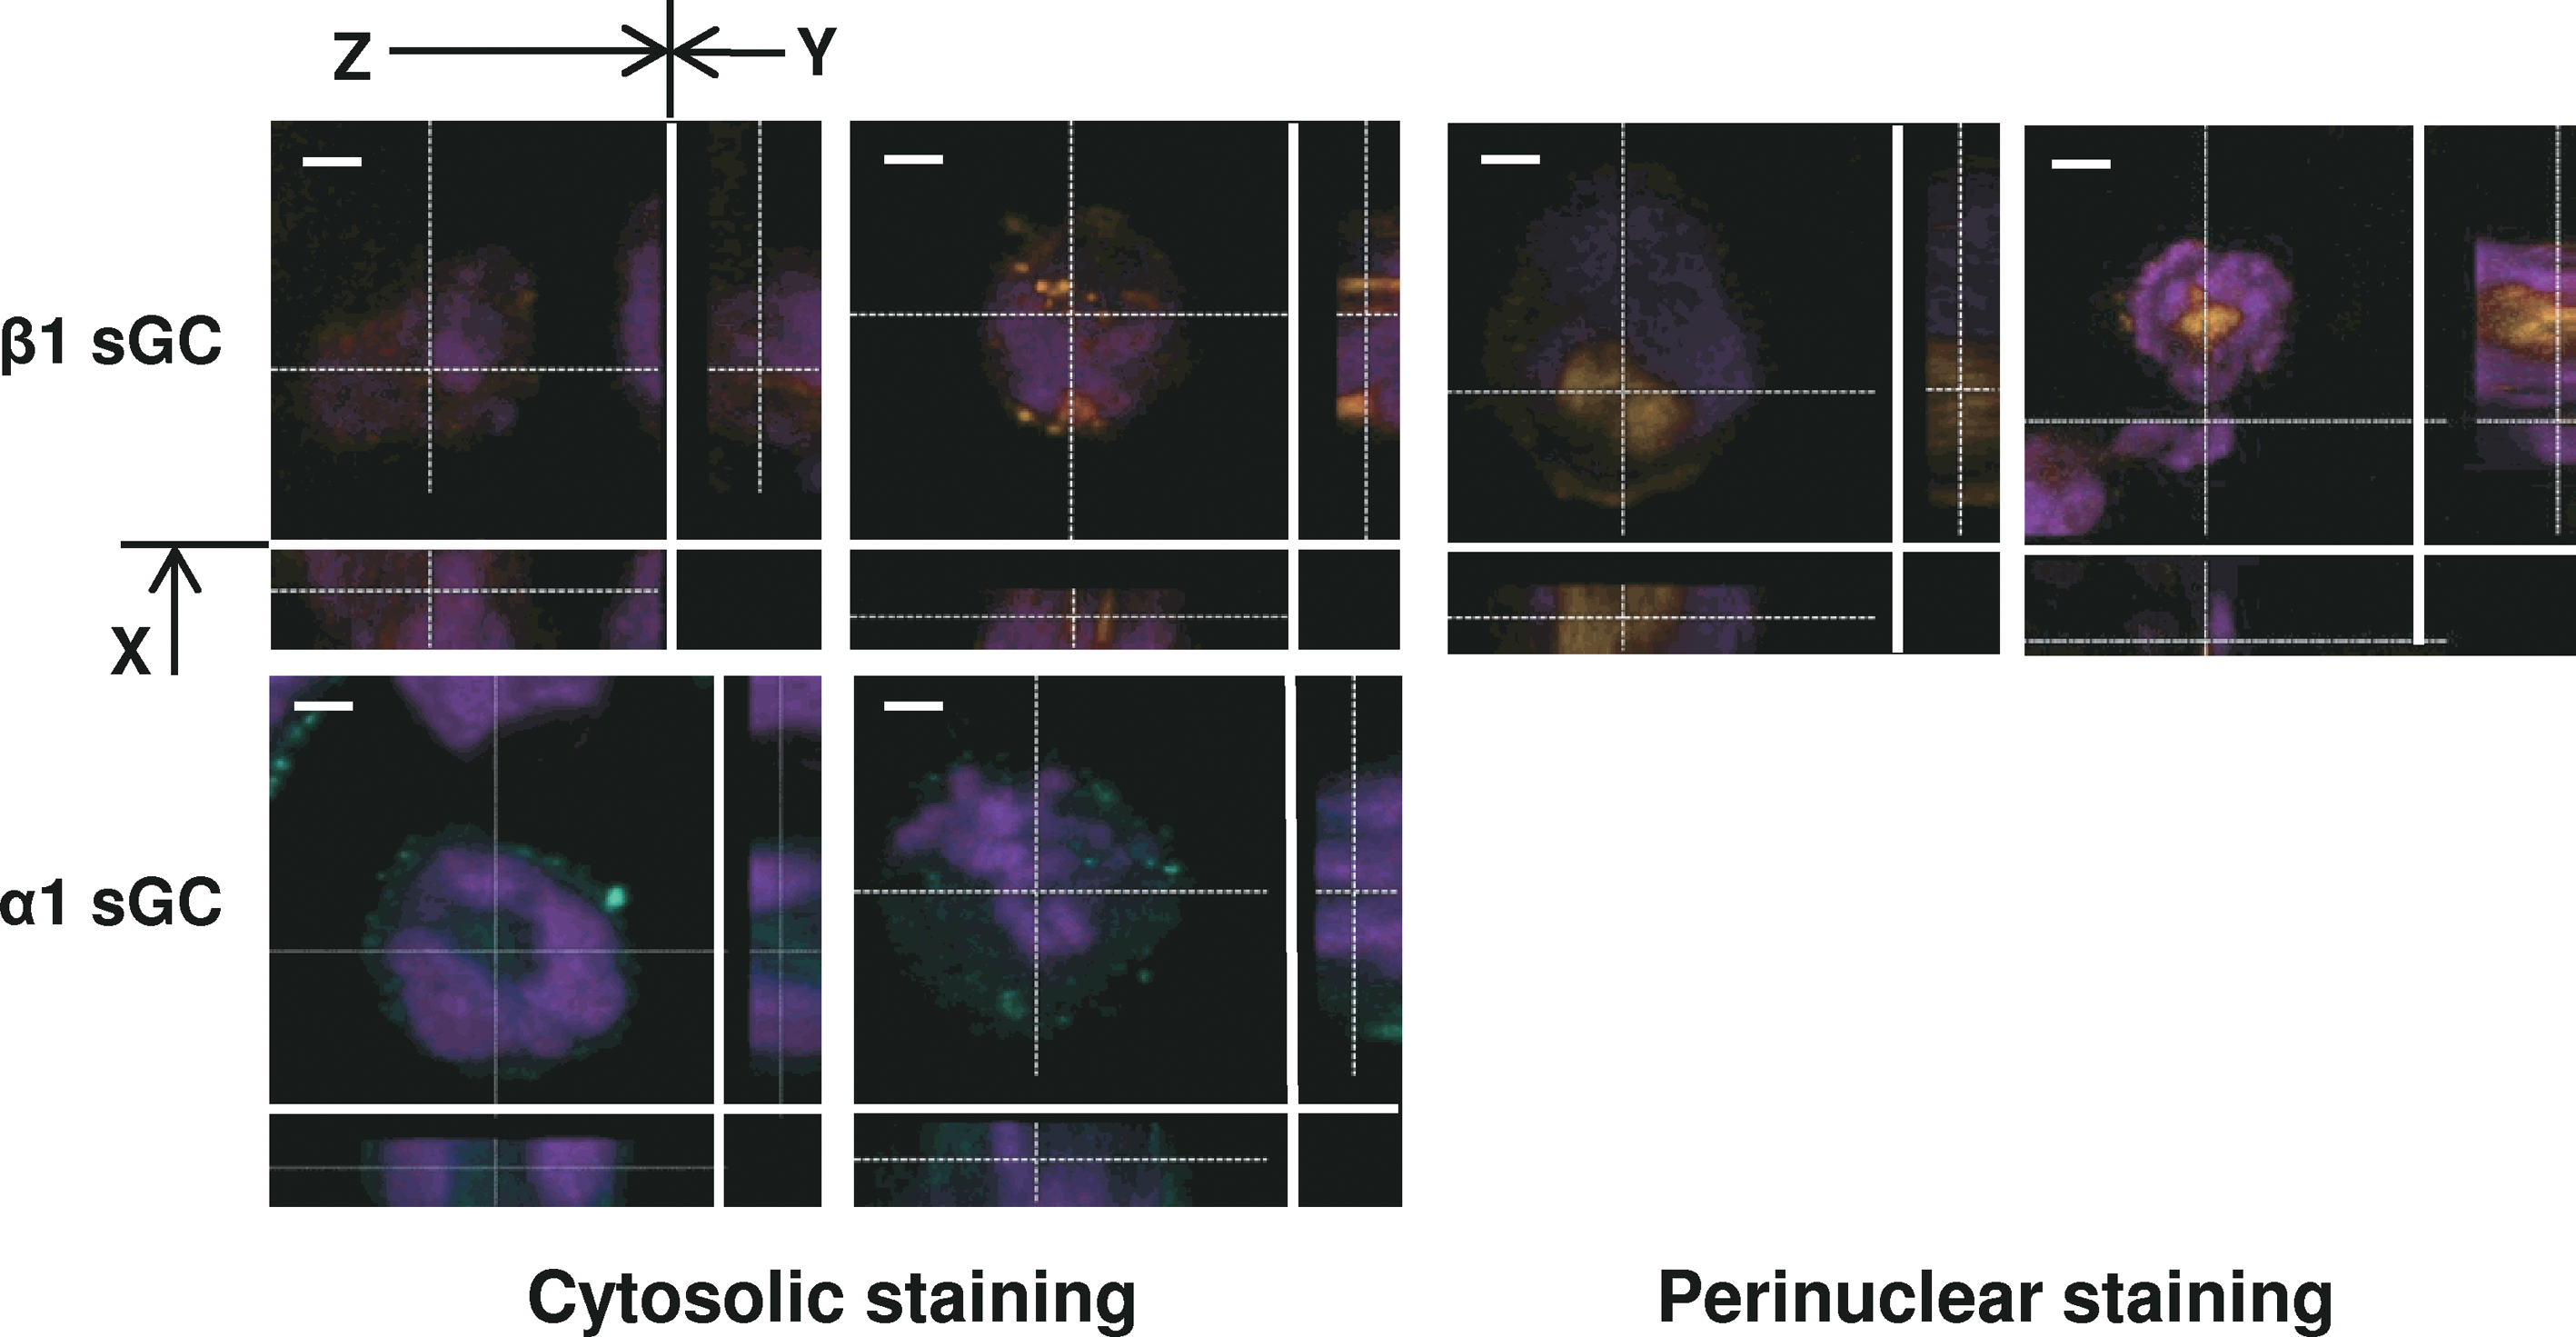
Analysis of α1 and β1 sGC subunits by confocal immunostaining. Differentiated H9 cells were detached by collagenase IV treatment and sedimented on slides by centrifugation. Cells were fixed with 4% paraformaldehyde solution, immunostained with anti-α1 (green) or anti-β1 (red) sGC antibodies, and counterstained for DNA with ToPro-3 dye. Only cells demonstrating diffuse staining were assessed. Scale bars = 5 μm. The images were acquired by confocal microscopy. The X-Y-Z cut planes are indicated by arrows. Color images available online at
Discussion
H9 cells are an established hES cell line capable of differentiation through EB induction. We were able to induce the progression of H9 cells through differentiation as assessed by the changes in expression of pluripotency markers Oct3/4 and NANOG (Fig. 1A, B). Immunofluorescence of these proteins was significantly reduced on the day 18 of differentiation in comparison with undifferentiated cells. Simultaneously, we observed increased α1/β1 sGC and cGMP immunostaining, confirming previous observations by our group that expression of α1 and β1 sGC was induced in differentiated ES cells and validating our cell model [13,14].
The α1 sGC gene undergoes an extensive splicing ([17], NCBI database). In previous report [17] we investigated the expression of several α1 sGC splice forms. RT- and quantitative real-time polymerase chain reaction (qRT-PCR) analyses demonstrated a time-dependent increase in mRNA levels of canonical α1 and catalytically inactive N1- and N2-α1 splice forms transcripts (Fig. 2A–C). Relative abundance of N1- and N2-α1 sGC splice variant transcripts was ∼10 times lower in comparison with the canonical α1 sGC. These data may indicate that expression of N-type splice forms is not likely to play a significant role in regulation of sGC activity. However, since RNA samples for analysis were purified from heterogeneous cell population, we cannot exclude that N-type α1 splice variants could be restricted to a specific cell type or subcellular compartment where their relative abundance is sufficient to exert a significant regulatory effect. This possibility remains to be investigated.
Expression of the C-α1 sGC splice variant, resistant to oxidative stress-induced protein degradation, in differentiating cells was detected by reverse transcription-polymerase chain reaction (RT-PCR) analysis (Fig. 2D) and Western blotting (Fig. 3). Semi-quantitative RT-PCR detection indicates that C-α1 transcript levels are significantly lower than the canonical transcript levels. This may be due to amplification efficacy for the α1 and C-α1 amplicons. On the other hand, the results of Western blotting suggested that C-α1 protein is rather abundant in differentiating hES cells probably due to its greater stability. According to Fig. 3B and D, relative amount of the C-α1 isoform (cumulative supernatant and pellet fractions) is approaching approximately half of the canonical full size α1 sGC subunit (day 10). Although it slowly decreases after achieving maximum at day 10, C-α1 sGC protein remains detectable at day 32. The present study is first to demonstrate the level of endogenous expression C-α1 sGC splice protein to be comparable to the level of the canonical α1 isoform. Previous studies demonstrated detectable levels of NO-inducible sGC activity in differentiating H9 cells [14]. Furthermore, our earlier report demonstrated that C-α1 protein is capable of creating a fully active, NO-responsive heterodimeric sGC enzyme [17]. The results presented in current report indicate that at least part of sGC activity in hES cells is mediated by the C-α1/β1 sGC heterodimer and suggest that this splice variant may a play role during the initial stages of hES differentiation.
sGC was originally discovered due to its cytosolic localization [28]. However, more recent evidence suggests that in certain tissues, such as brain, heart, skeletal muscle, adrenal gland, and colon, a significant fraction of sGC protein is associated with cellular membranes [29 –32]. We investigated subcellular distribution of α1 and C-α1 sGC protein isoforms in hES cells by high-speed fractionation of protein lysates. Our results demonstrate a differential distribution of α1 sGC protein isoforms in subcellular fractions. The canonical α1 sGC protein (83 kDa) was present in all fractions, whereas C-α1 sGC (54 kDa) was found exclusively in the supernatant fractions. This result cannot be explained by the lower C-α1 protein content in the lysates. The C-α1 protein was equally abundant in 14,000 g and 100,000 g supernatants (Fig. 3B, C), but was completely absent in the 100,000 g pellets, and only traces were present in the 14,000 g pellets. On the contrary, a significant portion of canonical α1 sGC protein was associated with 14,000 g pellets, and low but detectable amounts, were found in the 100,000 g pellets. These results indicate that in differentiating hES cells C-α1 protein derived from the splice variant mRNA preferentially resides in the cytosol, whereas the canonical α1 sGC protein is at least partially associated with large organelles and microsomes.
Previous reports demonstrated that sGC may be associated with different subcellular compartments, depending on investigated cell type. For example, sGC was shown to be associated with sarcolemma region of skeletal muscle [30], caveolar fraction in endothelial cells, plasma membrane in platelets [32], and apical plasma membrane in epithelia [29]. In the present study, we used immunofluorescence with anti-α1 sGC antibodies to further investigate sGC localization in hES cells. At least 2 different staining patterns were detected (Fig. 4). We observed both diffuse and filamentous staining, corroborating our results with lysate fractionation. Further investigation are necessary to determine the nature of filamentous structure and the identity of structural proteins associated with α1 sGC staining, as we did not find evidence of α1 sGC co-localization with β-actin (results not shown), tubulin, or f-actin staining.
We used confocal microscopy to evaluate nuclear localization of α1 and β1 sGC subunits in differentiating H9 cells. Nuclear and perinuclear localization of sGC subunits has been demonstrated in ES cell-derived cardiomyocytes [12], hepatocytes [33], and astrocytes [27], where it was proposed to play an important role in regulation of transcription and proliferation via both cGMP-dependent and cGMP-independent signaling. Our data support the report of nuclear localization of the monomeric β1 subunit [27], as we found that α1 sGC signal is preferentially in the cytosolic regions (Fig. 5, green), whereas the β1 sGC staining (Fig. 5, red) was located both in nuclei and cytosol.
In summary, we demonstrate for the first time that nascent α1 sGC transcript undergoes alternative splicing and that C-α1 sGC splice form protein is expressed at levels comparable to the canonical α1 sGC isoform in differentiating hES cells. Also, we demonstrate different subcellular distribution for the canonical α1 and alternative C-α1 sGC proteins at early stages of differentiation. Our data suggest that splicing of the sGC genes might play an important role in regulation of hES cell differentiation.
Footnotes
Acknowledgments
The authors would like to thank Dr. Gilbert Cote for critical reading of the manuscript. This work was supported in part by the Grants RO1 GM076695 (to F.M.) and HL088128 (to E.M) from National Institutes of Health, the Welch and the John S. Dunn Foundations, and startup funds (to I.S.) from The University of Texas.
Author Disclosure Statement
No competing financial interests exist.
References
Supplementary Material
Please find the following supplemental material available below.
For Open Access articles published under a Creative Commons License, all supplemental material carries the same license as the article it is associated with.
For non-Open Access articles published, all supplemental material carries a non-exclusive license, and permission requests for re-use of supplemental material or any part of supplemental material shall be sent directly to the copyright owner as specified in the copyright notice associated with the article.