
Abstract
The density gradient centrifugation method was originally designed for the isolation of mononuclear peripheral blood cells and rapidly adapted to fractionate bone marrow (BM) cells. This method involves the use of gradient density solutions with low viscosity and low osmotic pressure that allows erythrocytes and more mature cells gravitate to the bottom at a density fraction superior to 1.080 g/dL; mononuclear cells (MNCs) held in the plasma-solution to interphase at a density between 1.053 and 1.073 g/dL; plasma, dilution medium and anticoagulant to occupy a density less than 1.050 g/dL and the fat cells to float due to their very low density. BM-mesenchymal stem cells (MSCs) are usually obtained after the separation and cultures of BM-MNCs from the plasma-solution interphase, which is traditionally considered the only source of progenitor cells (hematopoietic and nonhematopoietic). In this study evidences that MSCs could be isolated from the very low-density cells of the fat layer are presented. In addition, we demonstrated that the MSCs obtained from these cells have similar immunophenotypic characteristics, and similar proliferative and differentiation potential to those obtained from the MNCs at plasma-solution interphase. The method represents a simple and cost effective way to increase the MSCs yield from each BM donor, without the need to look for other sources, additional manipulation of cells, and risks of contamination or disturbances of the potential of differentiation. These cells might serve as a complementary source of MSCs to facilitate preclinical and clinical application in tissue engineering and cell therapy.
Introduction
M
The techniques usually applied to obtain mononuclear cells (MNCs) are based on the density gradient centrifugation method, originally designed for the isolation of mononuclear peripheral blood cells and rapidly adapted to fractionate BM cells [10]. These techniques involve the use of gradient density solutions with low viscosity and low osmotic pressure like Ficoll, Percoll, or Lymphoprep. Hence, erythrocytes and more mature cells gravitate to the bottom at a density fraction superior to 1.080 g/dL; MNCs including progenitor cells (hematopoietic and nonhematopoietic) are held in the plasma-solution interphase at a density between 1.053 and 1.077 g/dL; plasma, dilution medium and anticoagulant occupy a density less than 1.050 g/dL; and the fat cells float due to their very low density [11].
Usually, BM samples are obtained in heparinized tubes by direct aspiration from the iliac crest or sternum of healthy donors. The samples are diluted (1:1 or 1:2) in phosphate buffered saline (PBS), layered onto a ficoll density gradient solution, centrifuged to separate the different layers and finally MNCs are taken from the plasma-solution interphase, while fat and other unwanted elements are discarded [12]. Alternatively, BM samples could be centrifuged immediately after the dilution and prior to the layering by the density gradient solution, to eliminate the fat contamination [13]. The common characteristic of both procedures is that the fat layer is discarded and the MSCs solely derived from the MNCs obtained from the plasma-solution interphase, as it was originally described.
Given that tissue fat is an important source of MSCs [5], the currently wasted fat fraction of the density gradient solution is a potential source of MSCs. The present study shows evidence that MSCs could be isolated from the very low-density cells of the fat layer. Additionally, MSCs obtained from these cells have similar immunophenotypic characteristics, and similar proliferative and differentiation potential to those obtained from the MNCs at the plasma-solution interphase.
Materials and Methods
Separation of BM cell fractions
BM aspirates of 5–6 mL were collected in preservative-free heparinized tubes from the posterior iliac crest of 9 volunteers (6 males, 3 females, median age 26 years old, range 6–45), in good clinical conditions. The donors underwent elective orthopedic surgery (nonunion, slipped disc, and avascular necrosis of the hip as a result of traumatic posterior dislocation) at the University Hospital Vírgen de la Arrixaca in Murcia (Spain), after obtaining informed consent according to the Hospital Ethic Committee. The samples were diluted 1:1 in PBS (Gibco, Invitrogen), layered onto ficoll density gradient (Ficoll-Hypaque; Sigma) and centrifuged at 540 g×20 min at room temperature. After separating the different layers, the MNCs at plasma-solution interphase and the very low density cells (fat floating cells) were collected in different tubes, washed in PBS by gently pipetting and counted using an automated counter (Sysmex Kx-21N™). Both samples were resuspended in low glucose (1 g/L) Dulbecco's modified Eagle's medium (DMEM) (Gibco, Invitrogen). MNCs at plasma-solution interphase and the very low density cells were both seeded at a density of 1×10⁵ cells/cm2 in T 25 culture flasks (Nunc) in DMEM, supplemented with 10% fetal bovine serum (FBS) (BioWittaker; Lonza), 1% L-Glutamine (BioWittaker; Lonza) and 1% penicillin/streptomycin (BioWittaker; Lonza), and incubated at 37°C, in a 5% CO2 atmosphere and 95% relative humidity. Before seeding, a sample of each source was taken to evaluate by cytological and immunological techniques. Commercial antibodies against CD34, CD45 and CD38 antigens were used as markers of MNCs (Becton Dickinson Biosciences).
Primary cultures
After 72 h both T 25 culture flasks (Nunc) were observed at phase contrast inverted microscope (Nikon Eclipse Ti-S™) with 10×magnification, adherent cells were morphologically evaluated and nonadherent cells were removed at the same time the first medium was changed. Then culture medium was renewed every 3 days until 90% confluence. Once the cells were confluent they were washed with PBS to remove residual culture medium and detached with 0.05% trypsine-EDTA (Sigma) in PBS (pH 7.5) for 5–10 min incubation at 37°C, passage 0 (P0). The total number of adherent cells from the flask seeded with the MNCs of the plasma-solution interphase and from the flask containing cells from the fat layer was counted separately in duplicate using a haemocytometer. Mean values were then expressed as a percentage of adherent cells obtained from initial cells seeded from each source. The total amount of adherent cells was estimated with the contribution of the adherent cells obtained from fat cells expressed in percentage. Cell viability was assessed for each cell source by trypan blue exclusion test and was always at least 87%.
MSCs proliferation assay
The growth kinetics of MSCs from both sources in primary culture (P0) was evaluated by EZ4U cell proliferation assay (Biomedica). Briefly, 3.0×10³ cells/well were cultivated in 200 μL basal culture medium in 96 well plates and incubated at 37°C, in a 5% CO2 atmosphere and 95% relative humidity. Medium was changed every 3 days. Rate of cell proliferation was examined every fourth day from day 1 till 21. For the assay 20 μL of dye substrate (EZ4U) was added to each well, and the cells were further incubated at 37°C for 4 h. After the incubation, plates were removed from the incubator and gently mixed by tipping on all 4 sides. The absorbance was measured by a photometer microplate-reader set at a wavelength of 450 nm with 620 nm as a reference. The measurements were performed in quadruplicate.
Colony-forming units-fibroblast assay
To evaluate the MSCs proliferative capacity by the colony-forming units assay (CFU-F), cells of primary culture (P0) from each source were plated at 1.0×10²cells/cm2 in 60 mm (28 cm2) tissue culture dishes (BD Falcon™) in basal culture medium. The medium was replaced every 3 days. After incubation for 14 days at 37°C in 5% humidified atmosphere CO2, the medium was removed and cells were washed with PBS, fixed with methanol and stained with May-Grünwald-Giemsa (Merck KGaA). Cell clusters containing more than 50 cells were scored as CFU-F colonies, and Clonogenic efficiency was calculated using the formula: Cloning efficiency=(number of colonies/number of cells seeded)×100 [14,15].
Ex vivo expansion of MSCs
To measure the MSCs expansion in culture, cells of primary culture (P0) from each source were seeded by duplicate at 1.0×10³/cm2 in T 75 culture flasks. The medium was replaced every 3 days. When cultures achieved 90% confluence the adherent layer from both sources was washed with PBS to remove residual medium and cells were harvested with 0.05% Trypsine-EDTA for 5–10 min at 37°C. The process was repeated at passages 1, 2, 3 and 4. At the end of each passage, the cells were counted by duplicate on a haemocytometer. The total number of MSCs generated in cultures after 4 passages was estimated, and the percentage increment of the total MSCs number determined by the MSCs obtained from the fat layer was calculated.
Fluorescence-activated cell sorting analysis
Cells at the fourth passage (P4) from both sources were harvested and resuspended in PBS for fluorescence-activated cell sorting analysis. Cells were incubated for 15 min with fluorescein isothiocyanate-conjugated (FITC) CD105, FITC-CD14, FITC-CD45 and FITC-HLADR, phycoerythrin conjugated (PE) CD73, PE-CD90, PE-19, phycoerythrincyanide 5-conjugated (PerCP) CD34, all from Becton Dickinson Biosciences. Measurements were performed on a fluorescence-activated cell sorting Calibur flow cytometer (Becton Dickinson Biosciences). Cell Quest software program (Becton Dickinson Biosciences™) was used for the acquisition of 10.000 total cells: Data Analysis was performed using the PAINT-A-GATE program (Becton Dickinson Biosciences).
In vitro cell differentiation assays
For osteogenic differentiation P4 MSCs from both sources were plated by duplicate at 3.0×10⁴cell/mL in 35 mm cell culture dish in osteogenic medium (NH Osteodiff Medium; Miltenyi Biotec), incubated at 37°C in 5% CO2 humidified atmosphere and grown up to 80% confluence. The medium was replaced every 3 days. After 21 days, the medium was completely removed and cultures were washed with PBS, fixed with precooled methanol, incubated for 5 min at −20°C and were allowed to dry completely. Alizarin Red S staining was used to reveal calcium deposition. Plated cells were exposed to a solution of Alizarin Red S, pH 6.2 (1 mg/mg), for 30 min at room temperature, after which the colonies were gently washed under running water and examined under a phase contrast microscope. The red staining revealed osteogenic differentiation.
For adipogenic differentiation, P4 MSCs from both sources were plated at 5.0×10⁴ cell/mL in 35 mm cell culture dish in adipogenic medium (NH Adipodiff Medium; Miltenyi Biotec), incubated at 37°C in 5% CO2 humidified atmosphere and grown up to 80% confluence. The medium was changed twice a week for 21 days, after which the cells were washed with PBS to remove residual adipogenic medium, fixed with precooled methanol and incubated for 5 min at −20°C. Then methanol was removed and cells culture dish washed twice with deionized H2O. To detect adipocytes, Oil Red O staining reagent (a lipophilic red dye) (Certistain Merck KGaA) was added to each cell culture dish and slowly mixed for 20 min on a plate shaker at room temperature. The staining reagent was removed, and the cell culture dish washed twice with deionized H2O. Immediately after staining, cells were evaluated under a phase contrast microscope. Adipogenic differentiation was revealed by the accumulation of red lipid vesicles after staining with Oil red O dye.
For chondrocyte differentiation, P4 MSCs from each source were diluted to a final concentration of 2.5×10⁵cells/mL of DMEM, transferred to a total volume of 1 mL to a 15 mL polypropylene conic tube and centrifuged at 150 g×5 min at room temperature. The medium was completely aspirated, 1 mL of prewarmed NH ChondroDiff Medium (Miltenyi Biotec) was added, cells were resuspended, centrifuged once and again, and the pellets were cultured at 37°C in 5% CO2 humidified atmosphere in 1 mL chondrogenic medium. The medium was changed every 3 days. After 24 days of culture, pellets were embedded in paraffin, cut into 5 mm sections and chondrocyte differentiation was demonstrated by the detection of a proteoglycan rich matrix in the sections using Alcian Blue staining, and by type II collagen detection through immunofluorescence using a mouse anti-human type II collagen monoclonal antibody and a secondary anti-mouse antibody conjugated with FITC (both from Chemicon International).
qRT-PCR analysis
For gene expression assay, RNA from MSC or their differentiated lineages was extracted using RNeasy-mini (Qiagen) that includes a treatment with DNaseI to avoid genomic DNA contamination. Typically, 1ug of RNA was retrotranscribed by GeneAmp iScript cDNA synthesis kit (Bio-Rad), and resulting cDNA was used for qPCR following SYBR premix ex Taq kit (Takara) according to manufacturer instructions. Genes were amplified using QuantiTect Primer Assay (
Statistical analysis
For Tables 1 –4, mean and the standard error of the mean were used for descriptive analysis. The parametric paired Student's t-test and Pearson correlation coefficients were used to compare the results obtained from both MSCs sources. The cutoff value for significance was set at P<0.05
MNC, mononuclear cell; FAT, floating fat cell.
Cells seeded: 1×10⁵/cm2 F25.
Cells: seeded 1.0×10².
CFU-F, colony-forming units assay.
MSC, mesenchymal stem cell.
Results
Isolation and cellular composition of BM fractions
BM aspirations were separated in different fractions by ficoll density gradient centrifugation. Cells collected from the plasma-solution interphase and from the fat layer were counted, then morphologically and immuno-phenotypically characterized. The number of MNCs isolated from the plasma-solution interphase of each BM sample was significantly higher (34.36±3.66×10⁶ cells) than the number obtained from very low density cells of the fat layer (4.29±0.36×10⁶ cells) (P<0.05) (Table 1).
Morphological studies were performed on smears prepared from MNCs obtained from the plasma-solution interphase and cells obtained from the fat layer. The slides were air dried and stained with Oil red staining to reveal the presence of lipids, then, samples were counterstained with Wright-Giemsa. The morphologic evaluation of the cells obtained from plasma-solution interphase evidenced, as expected, MNCs, platelets and very few granulocyte and red blood cell. Additionally, the very low-density fraction that typically is discarded, when observed, revealed dispersed MNCs and cell aggregates formed by MNCs, adipocytes and lipid drops (Fig. 1).

Smears prepared from mononuclear cells (MNCs) obtained from the plasma-solution interphase and from the fat layer stained with Oil red staining and counterstained with Wright-Giemsa. In the MNCs preparation MNCs and some platelets can be seen. The low-density fraction revealed dispersed MNCs and cells aggregates formed by MNCs, adipocytes and lipid drops. Color images available online at
Immunophenotypic analysis of slide extensions of both cell sources identified single CD34, CD45 and CD38 positive cells and both double positive CD34/CD45 and CD38/CD45 cells in either MNC or fat layer (Fig. 2A, B), indicating the presence of precursor cells in both compartments.
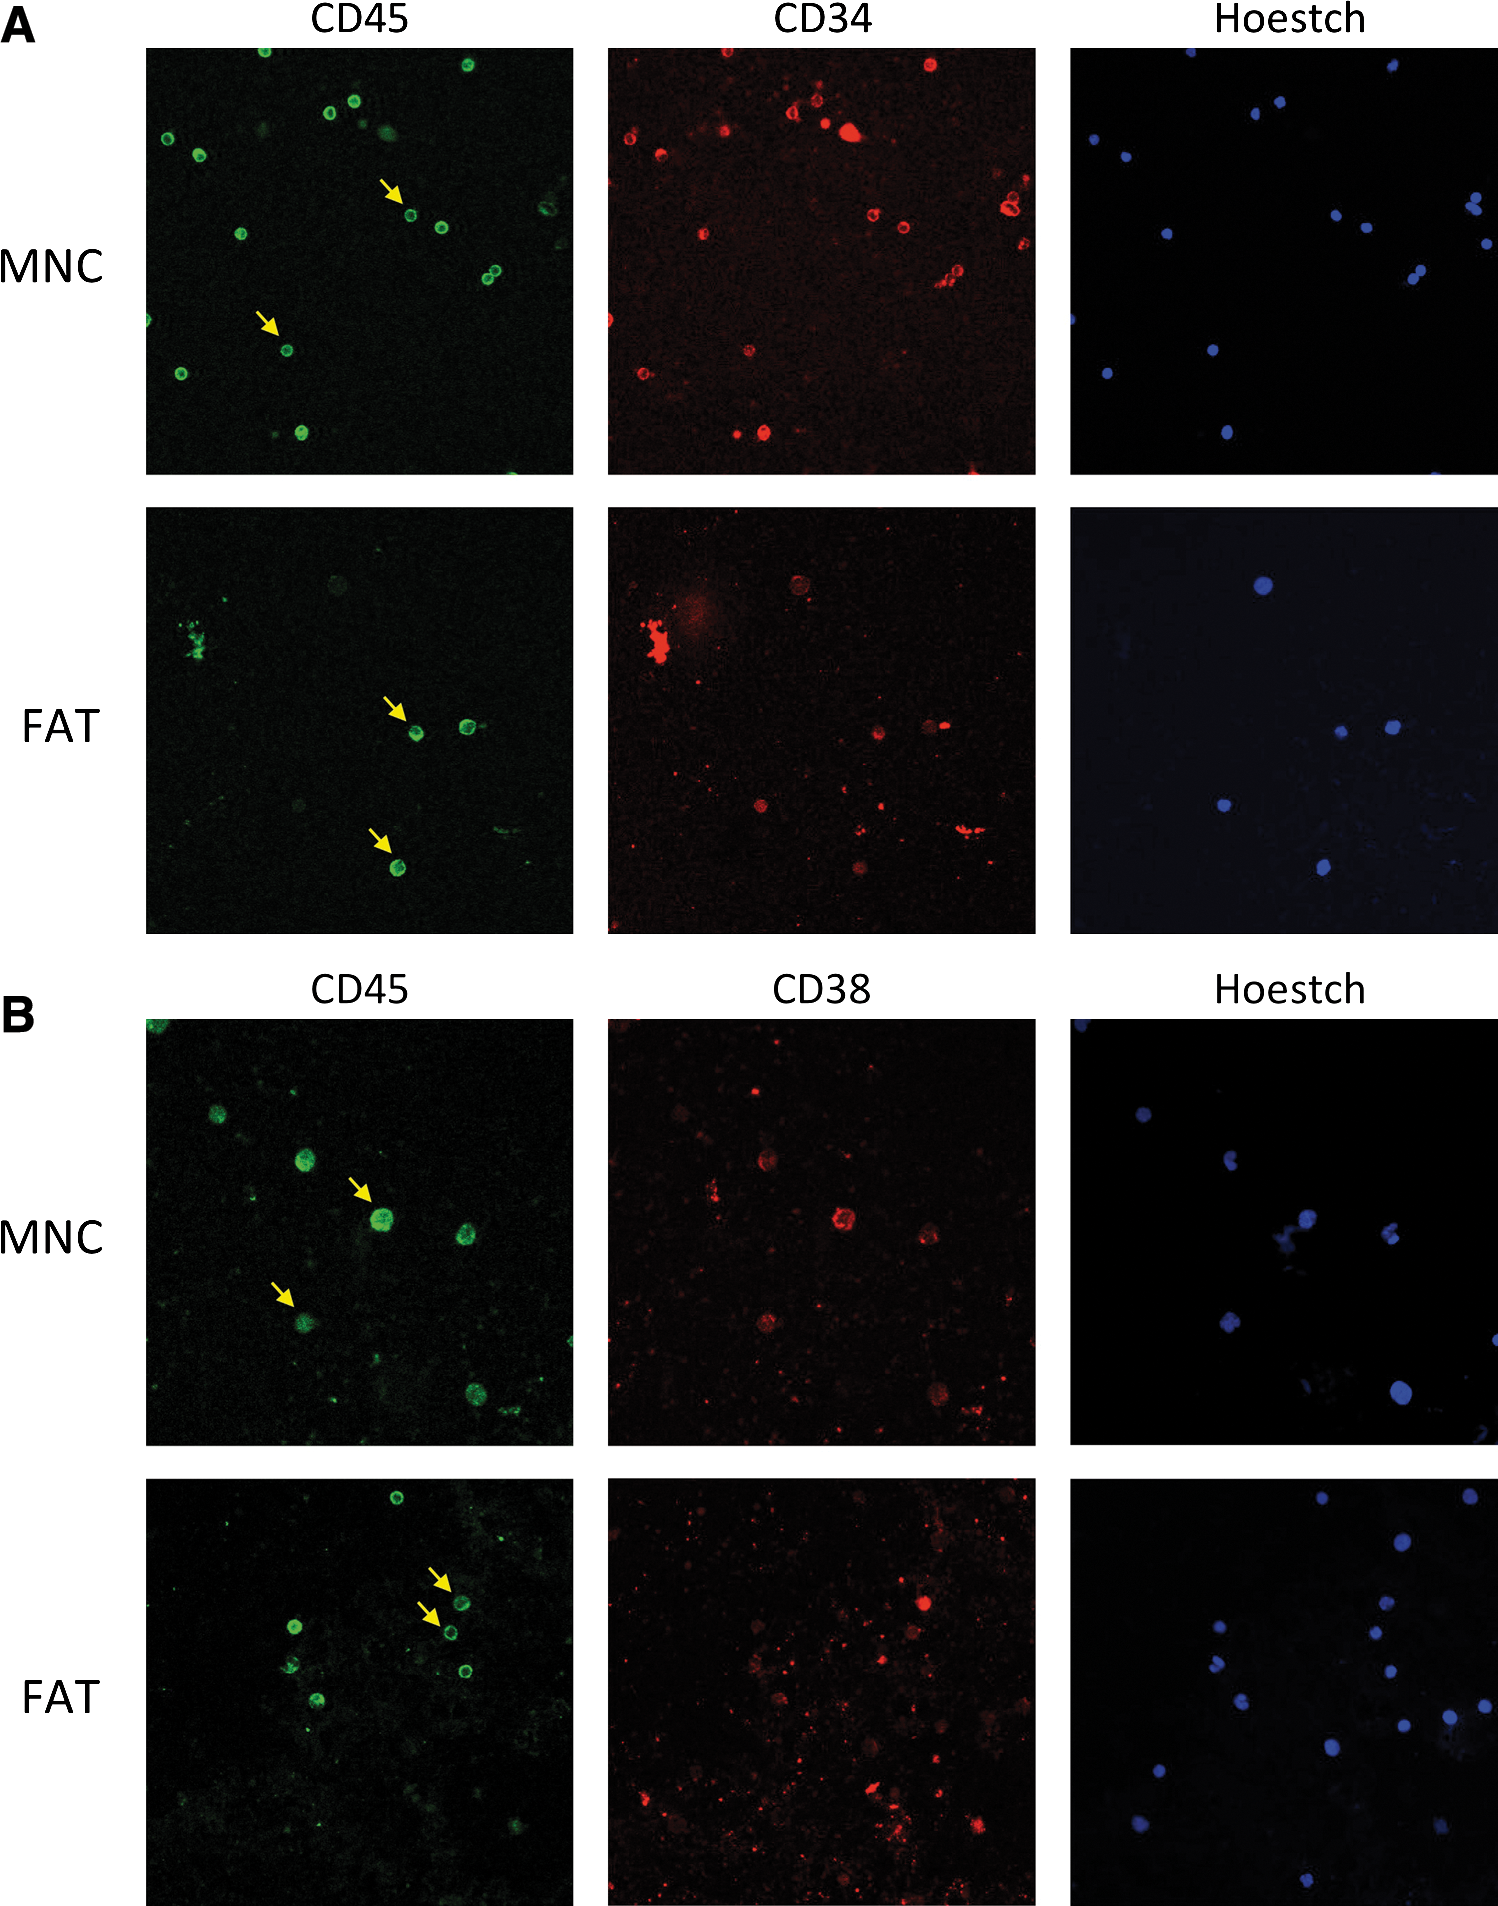
Immunostaining of MNCs obtained from the plasma-solution interphase and from the fat layer.
Cells obtained from the fat layer exhibit similar proliferation to cells from the plasma-solution interphase
At 72 h, evaluation under inverted microscope (10×) revealed the existence of adherent cells of similar morphology in all cultures. Initially, individual spindle-shaped cells sparsely distributed across the flasks and small colonies of few cells were observed (Fig. 3A, B). Then, colony number and size increased in the following days, and the cells became flattened keeping their spindle shape appearance, although a few of them became polygonal shaped with variable and spread cytoplasmic extensions. Distinctive oval nucleus with 2–4 nucleoli was observed (Fig. 3C, D).
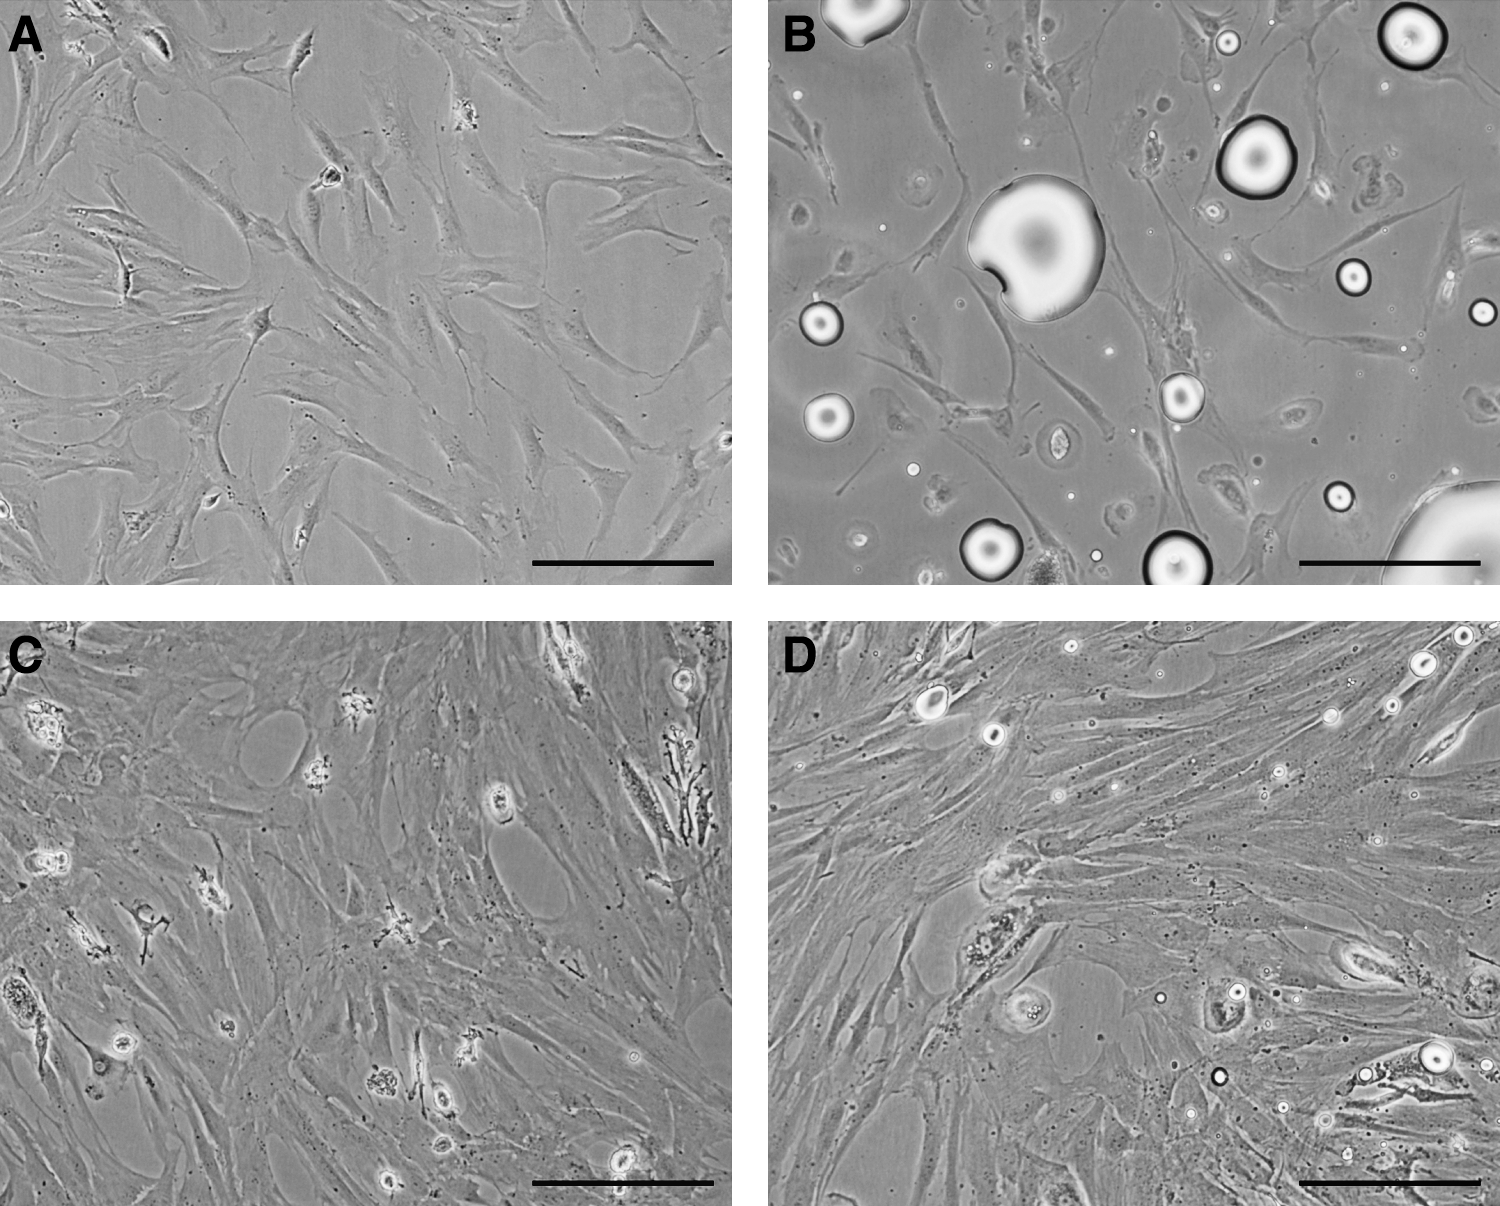
Initial Adherent Cell Population obtained at 72 h from MNCs plasma-solution interphase
There were differences in the median time to reach 90% confluence between the different sources of cells: 18.8 days (range 14–22 days) for the adherent cells derived from the MNCs plasma-solution interphase and 17.2 days (range 13–20 days) for the adherent cells derived from the fat floating cells, although the P value was not significant (Table 2). At the time of this confluence, adherent cells isolated from 2.5×10⁶ MNCs of the plasma-solution interphase seeded (1×105 cm−2), ranged between 517×103 to 799×103 cells with an average of 643.53±33.55×10³ cells; the average number of adherent cells isolated from 2.5×10⁶ floating cells of the fat layer seeded was 700.6±30.39×10³ cells (range of 530×103 to 859×103 cells). The percentage of adherent cells obtained from initial cells seeded from each source varied from 21.2% to 34.3%, being somewhat higher for the fat source (28% vs. 25.6%). The total number of BM-adherent cells obtained from MNCs of the plasma solution interphase plus adherent cells obtained from floating cells reached a mean of 1344.3±58.31×10³cells. Therefore, the total number of adherent cells obtained from each BM sample increased to an average of 52.1% (45.0% to 57.3%), due to the contribution of cells obtained from the fat layer (Table 2).
MSCs from fat layer and plasma-solution interphase show similar proliferation rates
The growth curves determined by the EZ4U proliferation assay suggest that MSCs derived from the fat layer cell population had similar cell proliferation rates to MSCs derived from the plasma-solution interphase cell population cultured in the same standard media during 21 days (Fig. 4).

Comparison of cell proliferation rate of mesenchymal stem cells (MSCs) derived from MNCs at plasma-solution interphase
Colony-forming units-fibroblast assay reveals similar efficiency in MSCs from fat layer and plasma-solution interphase
MSCs from P0 derived from the very low-density cells of the fat layer give rise to CFU-F in vitro in the same proportion as MSCs obtained from the plasma-solution interphase. There were no statistically significant differences in the number of CFU-F at P0 from both sources (Table 3). The CFU-F appearance and morphology were also similar in both cases, and consisted of elongated spindle-like cells (Fig. 5A–D). These observations imply the existence of MSC precursors present at the fat layer, as in the plasma-solution interphase.
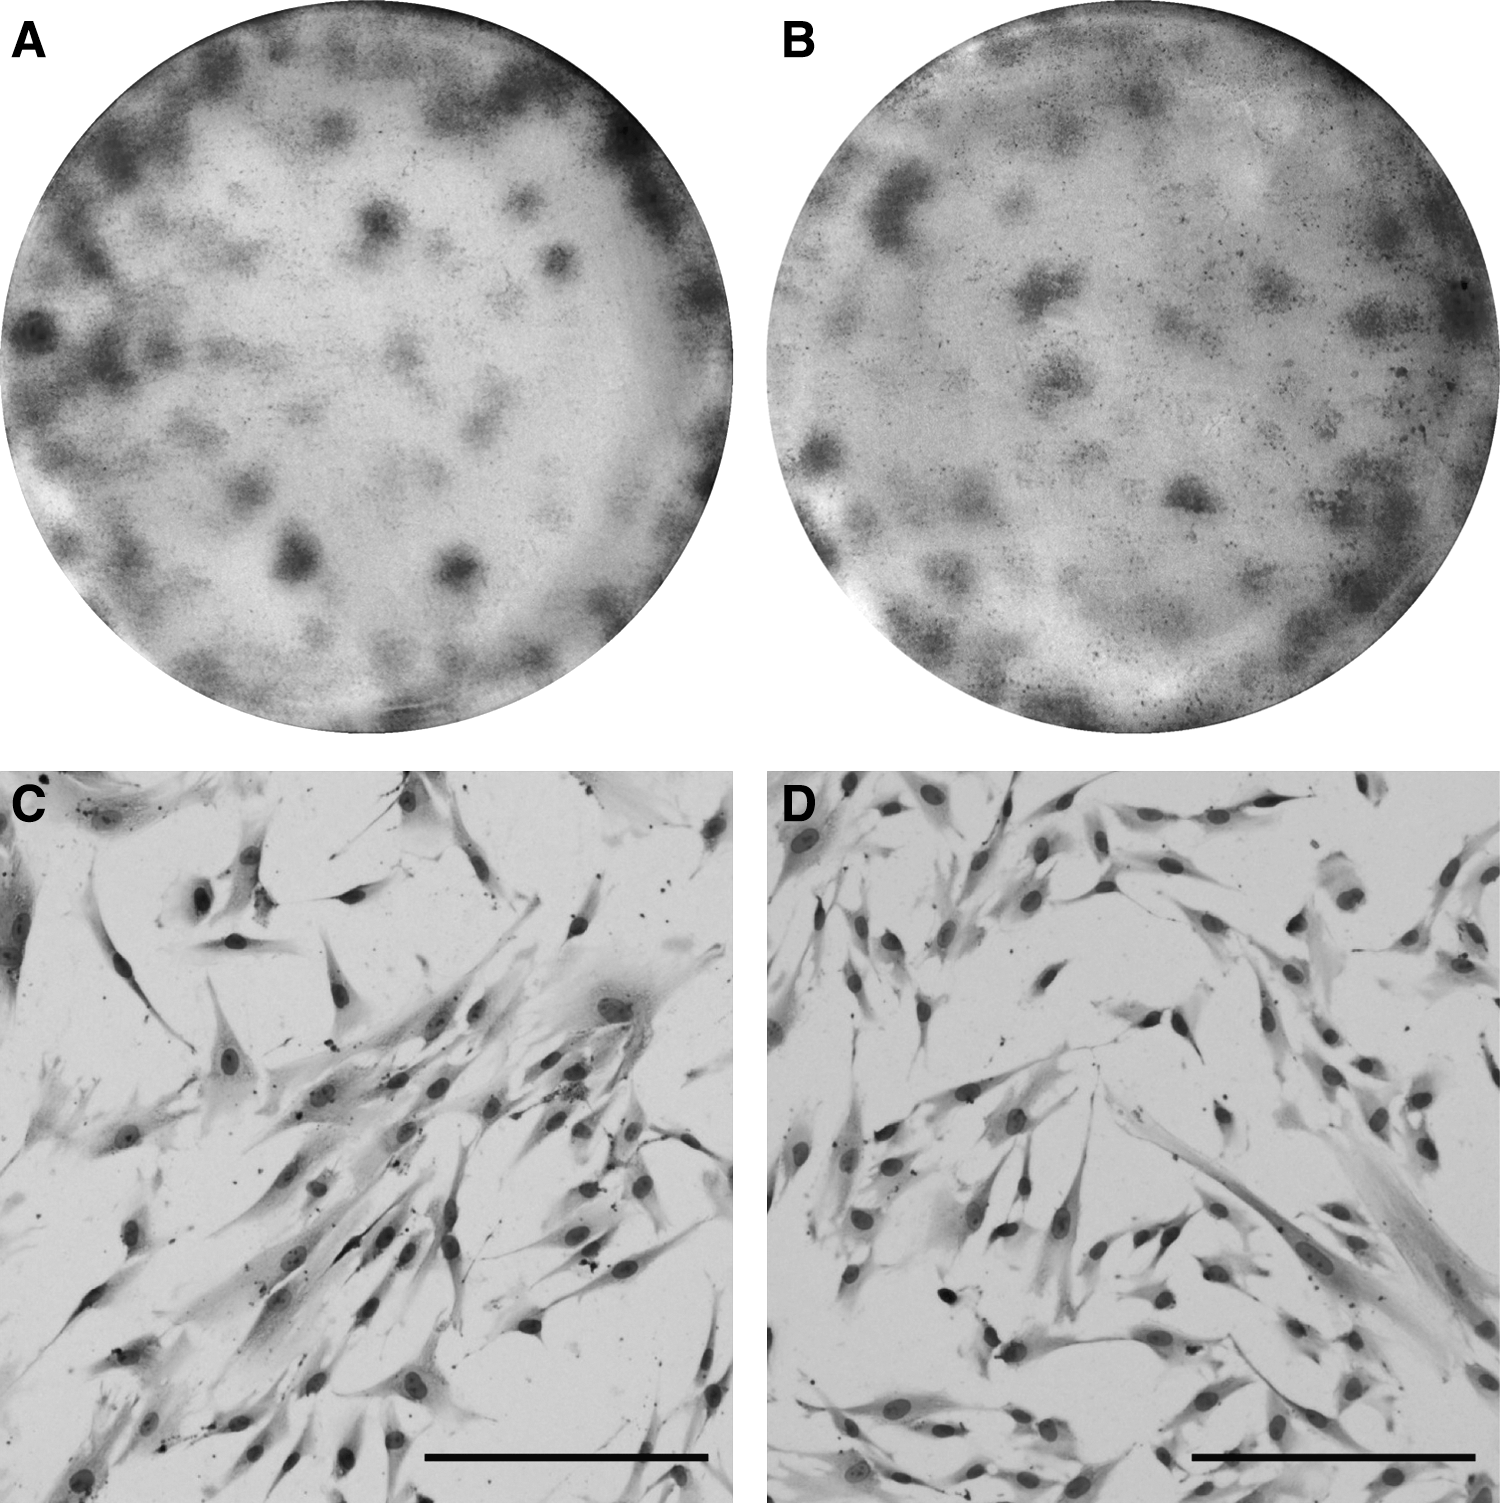
Representative photographs of colony-forming units assay (CFU-F) obtained from MNCs plasma solution interphase
In vitro expansion of MSCs from fat layer and plasma-solution interphase is similar
Table 4 shows MSC expansion in subculture from both sources, seeded at the same density cells (1.0×103 cm−2) on the same number of culture flasks. The cumulative quantity of MSCs derived from the MNCs source at the plasma-solution interphase cells obtained from P1 to P4 averaged 3953.5±105.01×10³ cells in a mean time of 35 days. This implies an increase of approximately 52.7 times. In comparison, the cumulative quantity of MSCs derived from the very low-density cells of the fat layer was 4,000±59.68×10³ cells in a mean time of 33 days (approximately 53.3 times increase). Each source produced practically the same quantity of cells after 4 passages. The total amount of MSCs obtained from both sources was 7,954±118.3×10³ cells (range 7275–8749×103 cells) in a month (33–35 days). The contribution of MSCs obtained from fat layer to the total number of MSCs was close to 50% (Fig. 6).

Expansion of MSCs in sub-cultures at passages 1, 2, 3 and 4. Cultures were seeded at a density of 1.0×10³ cells/cm2 in T 75 flasks and fed on every 3 days until confluence. At this time culture was harvested for calculation of cells number as described in Materials and Methods. The results represent the mean total numbers of MSCs accumulated after 4 passages of MSCs obtained from MNCs of plasma-solution interphase (gray columns) plus MSCs obtained from the very low-density cells at the fat layer (black columns).
Immunophenotypical characterization of MSCs from fat layer and plasma-solution interphase show a similar antigen pattern
In both groups, MSCs expressed CD73, CD90, CD105, and did not express CD14, CD19, CD34, CD45 or HLA-DR (Fig. 7). Therefore, cells derived from both fat layer and plasma-solution interphase satisfied the phenotypic requirements to define MSCs of the Committee of the International Society for Cellular Therapy [16]. There were not differences in the antigenic expression intensities.
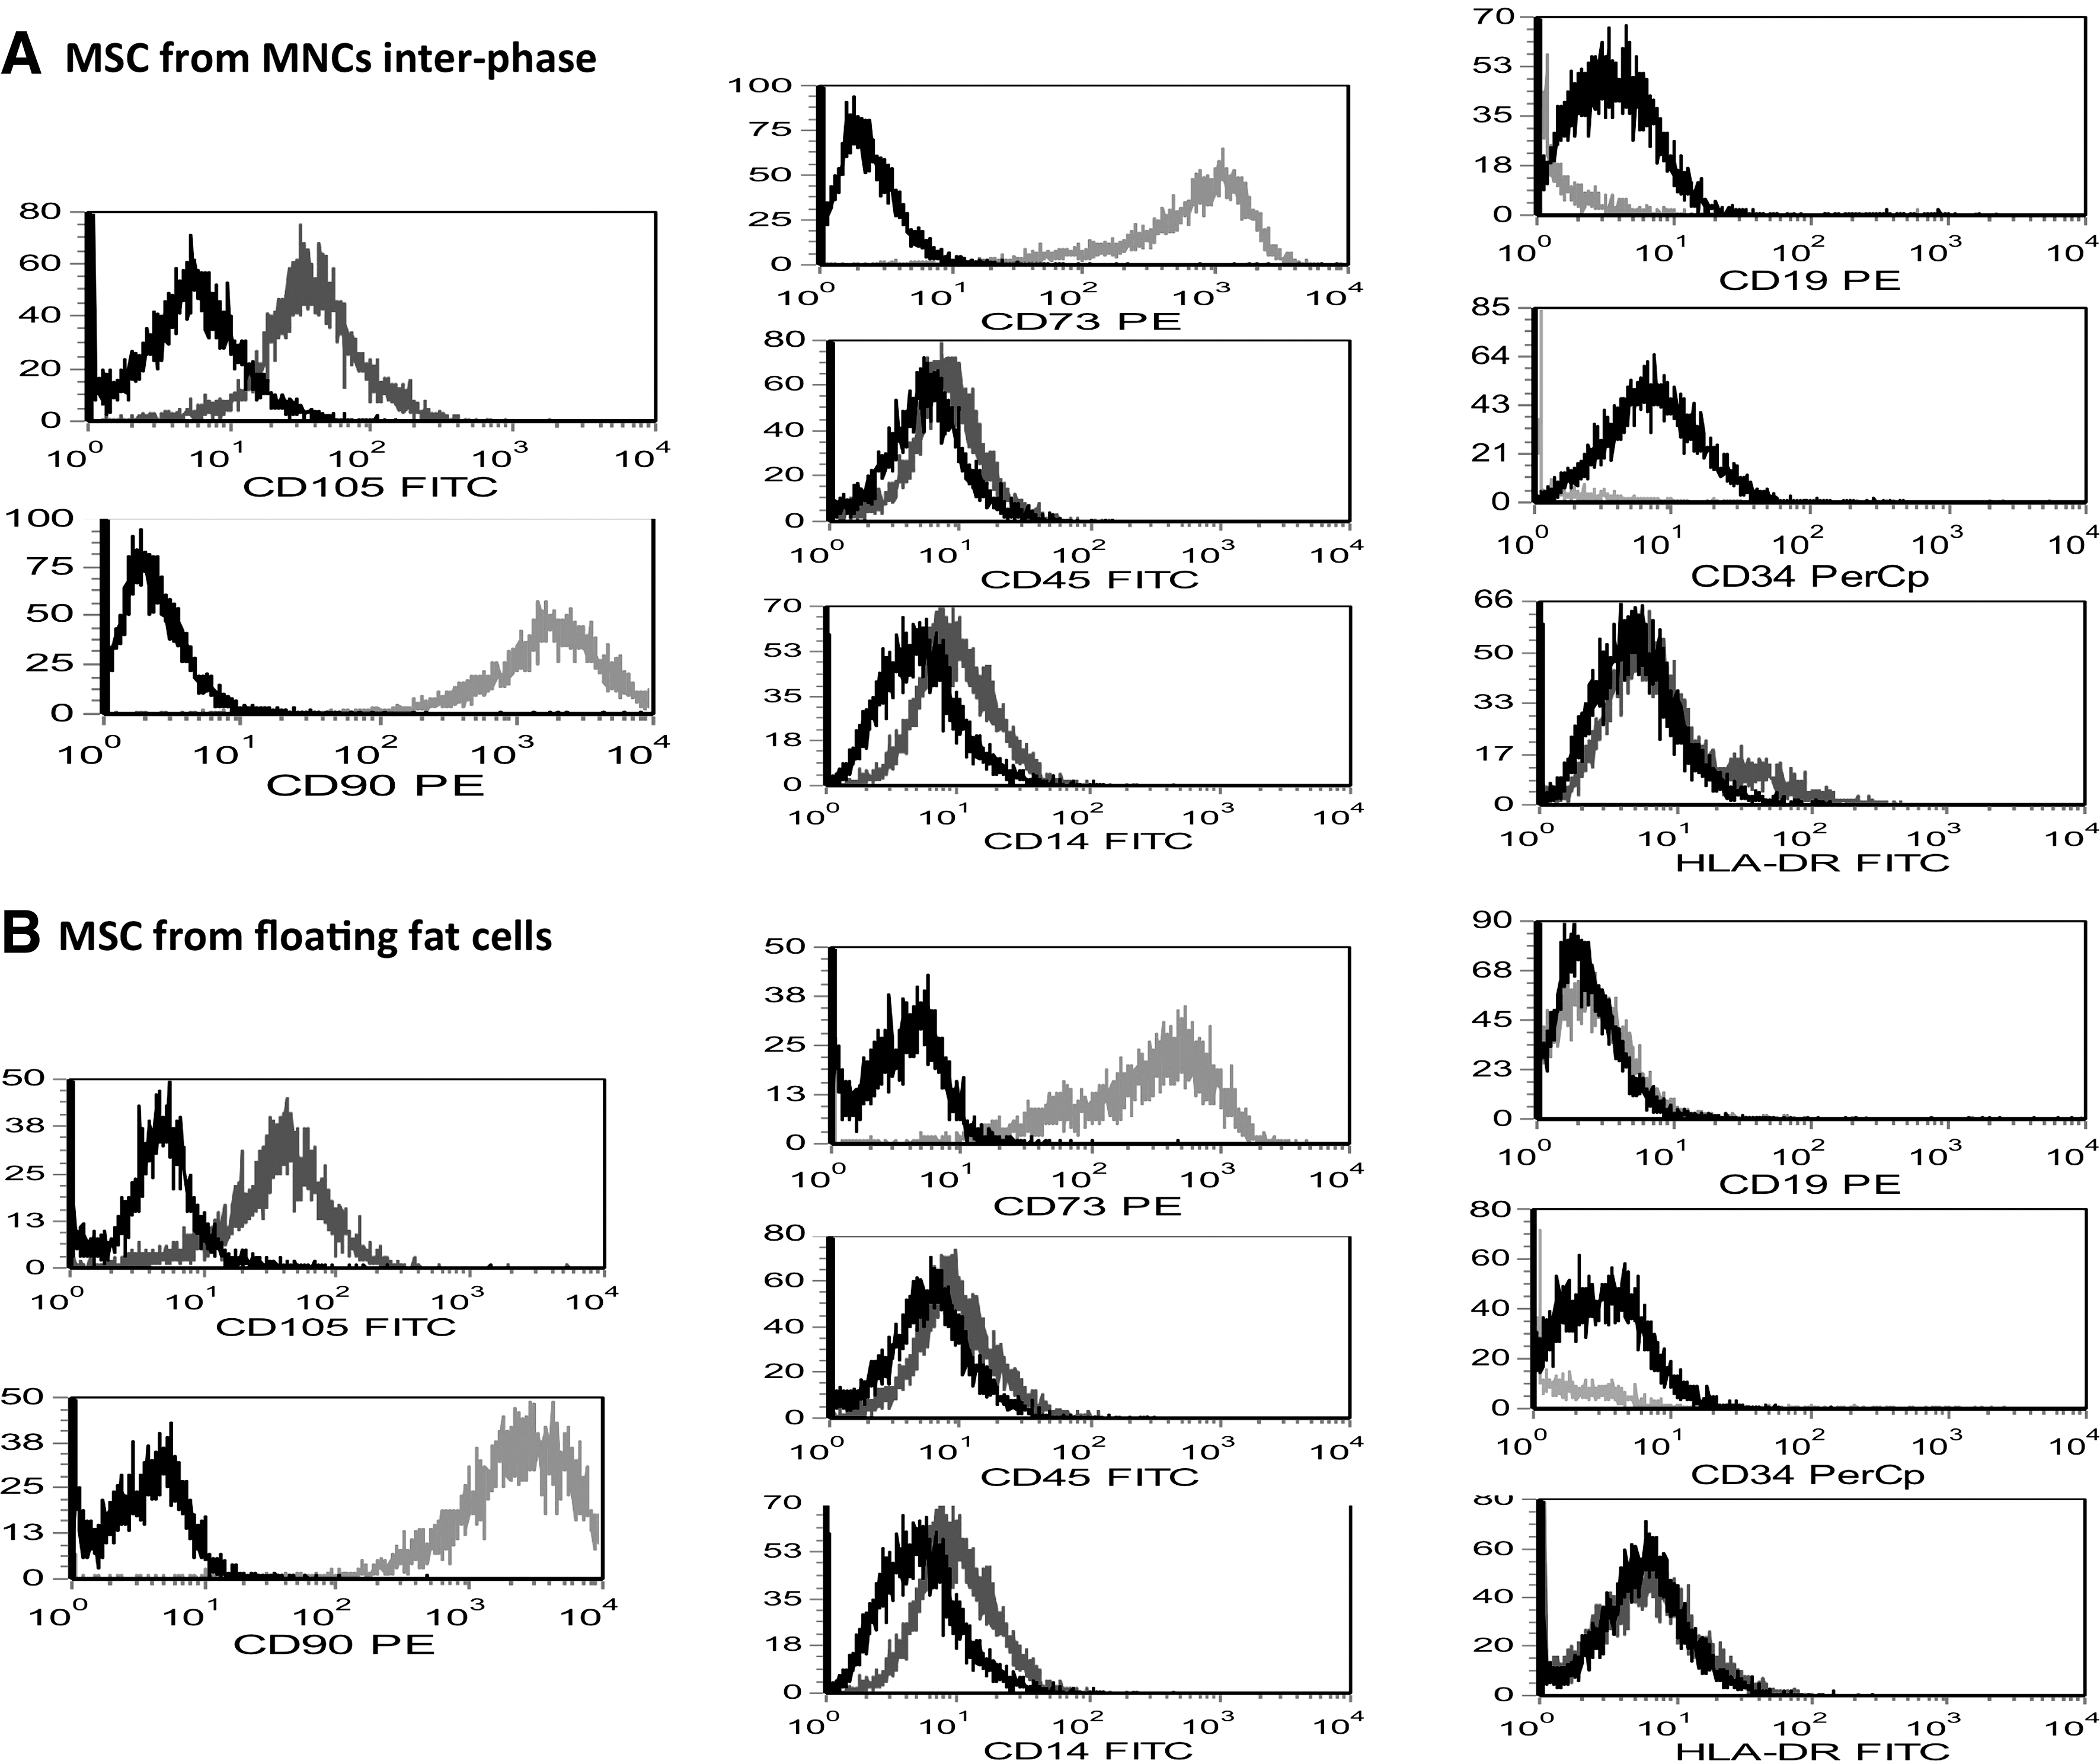
Immunophenotype by fluorescence-activated cell sorting analysis of MSCs obtained from MNCs at the plasma-solution interphase
Differentiation potential of MSCs from fat layer and plasma-solution interphase is similar
MSCs derived from the fat layer cell population cultures had similar cell differentiation potential in vitro to MSCs derived from the MNCs plasma-solution interphase cell population (Fig. 8A, B). As shown by Alizarin Red S staining, under osteogenic induction conditions MSCs derived from both sources revealed the presence of calcium (mineralization), considered an osteoblastic marker (Fig. 8A.1, B.1). Oil red 0 positive lipid droplets appeared under adipogenic inductions conditions, suggesting adipocytic differentiation (Fig. 8A.2, B.2), and the chondrogenic differentiation was evident using Alcian blue staining for the detection of proteoglycans (Fig. 8A.3, B.3), and immunoflurescence methods for the detection of collagen type II using primary antibodies against this collagen type and secondary antibodies conjugated with FITC (Fig. 8A.4, B.4). No osteogenic, adipogenic or chondrogenic differentiation was seen in the same cells when cultured with the basal medium.

MSC obtained from MNCs at the plasma-solution interphase
We used primers to specific genes involved in osteogenic, chondrogenic and adipogenic differentiation to assess the occurrence of these processes in MSC from both sources. Alkaline phosphatase (ALPL) as an osteogenic marker, aggrecan (ACAN) as a chondrogenic marker, and lipase lipoproteic (LPL) as an adipogenic marker were chosen. Expression levels of these genes obtained by q RT-PCR confirmed the differentiation of MSC derived from MNC and from cells from the fat layer toward osteocytes, chondrocytes and adipocytes (Fig. 9)

Expression of alkaline phosphatase (ALPL), lipase lipoproteic (LPL) and aggrecan (ACAN) mRNA in MSCs obtained from plasma-solution interphase and fat. Both source cells were induced to osteogenic, adipogenic and chondrogenic differentiation. Total RNA was extracted, converted into cDNA, and analyzed by qPCR. The ALP, LPL and ACAN gene expressions are represented as a ratio to housekeeping gene GAPDH using arbitrary units. To compare between MNC and fat samples, the expression of genes at each sample was calculated as a percentage of the maximum value obtained in each case. Data are representative of at least 3 independently performed experiments and shown as mean±SD; *P<0.05 using the U-Mann Whitney test.
Discussion
Although cells with typical MSC features have been successfully isolated from nearly every tissue examined, at present, the MSCs derived from the BM aspiration are the best characterized and the most used in preclinical and clinical assays. The use of these cells in the field of tissue engineering, cell therapy, and gene therapy has become widely accepted. However, some problems have to be solved before its clinical use could be standardized. One of these problems is related to the great number of MSCs required for the clinical approaches and the low percentage of them obtained from BM aspiration. To get sufficient quantity of these cells in a clinically permitted period is an essential aspect for successful tissue engineering or therapy approaches that have made their in vitro expansion a mandatory requirement.
Some investigators have proposed different methods to increase the proliferation of marrow-derived MSCs through modification of culture conditions, such as conditioned medium [17], autologous serum or plasma [18,19], platelet lysate [20], combination of growth factors [21], low O2 tension [22], etc., but the results of these studies sometimes have been divergent [23].
Others have proposed the use of gravidity sedimentation instead of the traditional density gradient method, to obtain a higher number of MSC progenitors, based on the observation that the classic approach would result in the loss of up to 90% of these progenitors [24,25]. However, 1 study reported [25] that the sedimentation method retarded or did not allow the initiation of MSC expansion in standard culture medium (DMEM supplemented by 10% FCS), probably due to the loss of platelets, since the addition of platelets lysate to the culture medium improved the MSCs expansion [25]. When the density gradient method is used, platelets remain at the plasma-solution interphase together with MNCs and secrete important growth factors crucial to initiate cell proliferation [25].
Wan et al. [26] presented a different method to increase the number of BM-MSCs based on the collection and replating of the initially nonadherent cell population, which is washed out during the first feeding. With this method, they suggested that MSCs existed in the nonadherent cell population of primary BM cell culture and that when the nonadherent cells were collected and counted accumulatively, the total number of MSCs increased to an average of 36.6% (20.70% -44.97%), compared with the number of cells obtained only from the primary BM cultures. Other reports have shown that nonadherent BM cells can give rise to CFU-Fs in vitro [27,28].
In this study a new method is presented to increase the number of MSCs from each BM donor. MSCs can thus be derived not only from the MNCs obtained from the plasma-solution interphase, but also from the very low density cells fraction (floating fat cells) separated by density gradient centrifugation method of BM. Cells from both kinds of fractions from 9 BM donors always produced CFU-F that proliferated in cells culture systems with an efficiency of 100%, indicating the utility of 2 available sources of MSCs from each BM donor.
The time for adherence from both sources was similar and so was the confluence time. Adherent, spindle-shaped colonies started forming at 72 h in the culture and became confluent at some time between 13 and 22 days, as has been reported by other MSCs isolated from BM-MNCs [1,12,13,25]. The morphology of individual adherent cells and colonies obtained from either source was similar.
The initial amount of adherent cells and the percentage of adherent cells/cells seeded obtained from the fat layer (700.6±30.39 and 28%) was higher than the percentage of adherents cells/cells seeded obtained from the MNCs of the plasma solution interphase (643.6±30.55 and 25.6%). Although the difference was not significant, it might suggest that proportionally there are more mesenchymal progenitors in the fat cell layer than in the MNC plasma-solution interphase, where the hematopoietic progenitors are more numerous, but it also might indicate better support is offered by adipose cells to the expansion of MSC. It has been shown that adipose tissue seems to be an excellent ancillary support, with the required combination of growth factors to obtain an optimal MSC expansion [5,29]. In this study adherent cells from the fat layer increased the total adherent cells by an average of 52% (45.0% −57.3%).
MSCs derived from the floating cells of the fat layer had similar cell proliferation in vitro when compared with the MSCs derived from MNCs of the plasma-solution interphase. This was evidenced by the results of EZU4 cell proliferation assay and the CFU-F quantitation obtained from both sources.
The rates of cell proliferation in subcultures from passage 1 to passage 4 were similar in cells obtained from both sources and so was the number of MSCs obtained after 4 passages. Additionally, when these cells were collected and counted accumulatively, the total number of MSCs increased to an average of 50.28% (48.6%–51.4%), compared with the number of cells obtained only from the plasma-solution interphase cell population cultured in the same time. This is one of the most important aspects of this paper because it means that by culturing MNC and cells from the fat layer we could obtain nearly double the number of MSCs in the same culture time from each BM sample.
Like MSCs obtained from BM-MNC, adherent cells obtained from the fat layer, expressed the immunophenotype and the multilineage potential proposed as the minimal criteria for definition of MSCs by the Mesenchymal and Tissue Stem Cell Committee of the International Society for Cellular Therapy [16].
It is possible that among cells separated at very low density exists some “special different stromal precursors” responsible for initiating MSCs growth in vitro. In view of their very similar characteristics (CFU-F, auto-renewal and differentiation into multilineage cells in vitro), we believe that the progenitors MSCs collected with the floating cells of the fat layer are identical to the progenitor MSCs collected in the plasma-solution interphase. Additionally, they could be found as cross-contamination between the 2 compartments. In this sense the cytological and immunophenotypic studies to investigate the composition of the very low density layer evidenced the presence of dispersed MNCs (morphologic and phenotypic similar to those observed in the slide prepared with the cells from the plasma-solution interphase), and cell aggregates formed by adipocytes, MNCs, lipid drops. The adherence of the MNCs to adipocytes could explain why they separate at a very low density. Another explanation could be obtained from the papers of Blazsek et al. [30 –32], which have provided evidence that the low density fraction contained spheroid structures named hematon, organized in an ordered 3 dimensional network of adipocytes, fibroblasts and fixed macrophages which maintain a close contact with erythroid, myeloid and megakaryocyte progenitor cells and with their progenies, and contain more progenitor cells than the mononuclear fractions. From these structures, they have been able to isolate GM-CFC (Granulocyte-macrophage colony forming cells, E-CFC (Erythoid colony forming cells) and F-CFU (Fibroblastic colony forming units).
Finding other sources of MSCs in the BM aspiration with the same characteristic is important. Firstly, because the ability to culture nearly doubles the amount of cells in the same time could prove particularly important in aged donors or patients as it has been demonstrated that the number, differentiation potential and the maximal life span of MSCs from BM decline with increasing age [33,34]. Secondly, because to obtain more cells with the same characteristics in relatively less culture time decreases the risk of contamination and the associated costs of maintaining cell cultures. Thirdly, because from the same sample of BM aspiration we could obtain MSCs from the fat layer, and reserve MNCs from the plasma-solution interphase to obtain hematopoietic stem cells (HSCs) that are also present in such specimens and are lost during MSCs purification. The MSCs could be used in many preclinical and clinical assays and the HSCs could be used for the treatment of hematologic and nonhematologic disorders as well as in regenerative and tissue engineering. Different studies have demonstrated that the coculture of MSCs with HSCs in an in vitro system has a significant impact on the expansion, migratory potential and “stemness” of HSCs [35 –37]. So, many groups are focusing on ex vivo expansion of HSCs through the coculture system. The possibility to get 2 kinds of cells from the same BM donor could represent an important contribution to these studies. Finally, the feasibility of clinical implementation of cotransplantation of MSCs together with HSCs for quick hemopoiesis reconstitution and maintaining after autologous transplantation of HSCs has been demonstrated in patients with breast cancer [38]. MSCs give origin to the subpopulation of stromal cells in BM, supporting hemopoiesis by production of cytokines (IL6, IL7, IL8, IL11, IL12, IL14), Fit-3, ligand-SCF, which exert regulatory effects on the proliferation and differentiation of HSCs [39].
In conclusion, this study demonstrates that not only do total MNCs give rise to CFU-F, but also the very low density cells fraction (floating fat cells) separated by density gradient centrifugation method of BM samples, give rise to CFU-F, indicating the presence of very low density mesenchymal progenitor cells in this layer. Collecting and plating the fat floating cells separating by density gradient centrifugation method of BM sample result in more MSCs in the same culture time. The method represents a simple and cost effective way to increase the MSCs yield from each BM donor, without the need to look for other sources, additional manipulation of cells, risks of contamination or disturbances of the potential of differentiation. The infusion of these culture-expanded MSCs would be of clinical significance in patients who receive HSCs transplantation after high dose chemotherapy. On the other hand, these cells might serve as a complementary source of MSCs to facilitate preclinical and clinical application in tissue engineering and cell therapy.
Footnotes
Acknowledgments
This work was supported by a grant from the Fundación Séneca de la Región de Murcia. We are indebted to the Hospital Universitario Virgen de la Arrixaca and University of Murcia that strongly supported this research.
Author Disclosure Statement
The authors state no conflict of interest.