
Abstract
Heterogeneity among induced pluripotent stem cell (iPSC) lines with regard to their gene expression profile and differentiation potential has been described and at least partly linked to the tissue of origin. Here, we generated iPSCs from primitive [lineage negative (Linneg)] and nonadherent differentiated [lineage positive (Linpos)] bone marrow cells (BM-iPSC), and compared their differentiation potential to that of fibroblast-derived iPSCs (Fib-iPSC) and embryonic stem cells (ESC). In the undifferentiated state, individual iPSC clones but also ESCs proved remarkably similar when analyzed for alkaline phosphatase and SSEA-1 staining, endogenous expression of the pluripotency genes Nanog, Oct4, and Sox2, or global gene expression profiles. However, substantial differences between iPSC clones were observed after induction of differentiation, which became most obvious upon cytokine-mediated instruction toward the hematopoietic lineage. All 3 BM-iPSC lines derived from undifferentiated Linneg cells yielded high proportions of cells expressing the hematopoietic differentiation marker CD41 and in 2 of these lines high proportions of CD41+/CD45+ cells were detected. In contrast, little hematopoiesis-specific surface marker expression was detected in 4 Linpos BM-iPSC and 3 Fib-iPSC lines. These results were corroborated by functional studies demonstrating robust colony outgrowth from hematopoietic progenitors in 2 of the Linneg BM-iPSCs only. Thus, in conclusion, our data demonstrate efficient generation of iPSCs from primitive hematopoietic tissue as well as efficient hematopoietic redifferentiation for Linneg BM-iPSC lines, thereby supporting the notion of an epigenetic memory in iPSCs.
Introduction
P
Most commonly iPSCs were derived from murine embryonic fibroblasts (MEFs) or human dermal fibroblasts obtained from skin biopsies, but successful iPSC generation also has been achieved from a wide variety of other sources, including keratinocytes [15], neuronal cells [16,17], hepatocytes [18], or mesenchymal cells [19]. Cells of the lymphohematopoietic system are a particularly attractive starting material for iPSC production, as peripheral blood samples can easily be obtained from patients or healthy volunteers. In addition, ample amounts of hematopoietic stem/progenitor cells (HSCs) can be obtained from bone marrow (BM), umbilical cord blood, or peripheral blood subsequent to systemic growth factor application and already HLA-typed cell samples are provided by a well-established blood banking system. Early studies focussed on these HSCs [20,21], whereas reprogramming of mature, fully differentiated peripheral blood cells have proven more difficult and initially only was demonstrated in a transgenic mouse model, allowing for doxycyclin-induced expression of reprogramming factors [22]. More recently, however, several groups have reported the generation of iPSCs from human peripheral blood samples [23 –26].
To advance the generation of hematopoietic tissue from pluripotent starting populations, we here have generated iPSC lines from murine BM and have systematically analyzed their redifferentiation capacity into the hematopoietic lineage.
Materials and Methods
Cell culture and vector production
MEFs (from C3H mice) were cultured in low-glucose DMEM supplemented with 10% heat-inactivated fetal calf serum (FCS) gold (PAA), penicillin–streptomycin, 1 mM
Lentiviral constructs utilized in this study were based on third-generation self-inactivating lentiviral vectors [27]. To improve viral titers and transcriptional termination, a woodchuck hepatitis virus-derived post-transcriptional regulatory element (wPRE) was inserted into the 3′ untranslated region of the lentiviral cassette [28]. Reprogramming transgenes were expressed from a spleen focus forming virus (SFFV)-derived promoter/enhancer element [29] (Supplementary Fig. S1; Supplementary Data are available online at
Virus production was performed in a 4 plasmid-manner as previously described [30]. Briefly, 3.5×10⁶ 293T cells were seeded 24 h before transfection in 10 cm dishes. 293T cells were cultivated in high-glucose DMEM (Invitrogen, Karlsruhe, Germany) supplemented with 10% heat-inactivated FCS, penicillin–streptomycin, and 1 mM
iPSC generation and cultivation
BM cells were isolated from femurs and tibias of Oct4-GFP transgenic mice (OG2) [32] and immunomagnetically separated into lineage negative (Linneg) and lineage positive (Linpos) populations using the mouse lineage depletion kit containing antibodies against CD5, CD45R (B220), CD11b, Gr-1 (Ly-6G/C), 7–4, and Ter-119 (Miltenyi Biotec). Purity of separation was controlled by subsequent flow cytometric analysis. Linneg cells were cultivated in serum-free StemSpan medium (Stem Cell Technologies) supplemented with 2 mM
The MEF-derived iPSC lines (Fib-iPSC1, 2, and 3) were generated by transduction of OG2-MEFs with the same lentiviral vector constructs. Reprogramming efficiencies ranged from 0.1% to 0.2%. For all Fib-iPSC lines complete reprogramming was demonstrated by alkaline phosphatase (AP) and SSEA-1 staining, pluripotency factor expression, and teratoma formation (data not shown).
In vitro differentiation assays
For the generation of embryoid bodies (EBs), iPSCs and ESCs were trypsinized and resuspended in regular ESC medium without LIF. To induce EB formation using the hanging-drop method, drops of 20 μL containing 600 cells were pipetted onto the lids of 10 cm cell culture dishes and incubated at 37°C for 3 days. Thereafter, EBs were washed off the plate with phosphate-buffered saline (PBS) and transferred to 10 cm dishes containing ESC medium without LIF in which they were incubated for 3 additional days before harvesting.
For endodermal differentiation, iPSCs or ESCs underwent EB formation as described above before they were transferred onto gelatin-coated chamber slides in ESC medium without LIF supplemented with 40 ng/mL Activin A (Peprotech). After 3 days, the medium was additionally supplemented with 50 ng/mL BMP4 and 10 ng/mL basic fibroblast growth factor (bFGF) (Peprotech). Immunocytochemistry for Sox17 was carried out after 14–17 days of differentiation.
For myocardial (mesodermal) differentiation, iPSCs or ESCs were subjected to EB formation for 3 days in IMDM+GlutaMax (Invitrogen) supplemented with 15% FCS, nonessential amino acids, 0.1 mM β-mercaptoethanol, and
For ectodermal differentiation, iPSCs and ESCs underwent EB formation using the hanging-drop method for 3 days. Thereafter, EBs were collected and transferred to DMEM F-12 with N2 and B27 supplements (Invitrogen), 1 mM
For hematopoietic differentiation, experimental conditions were adapted from Ma et al. [34]. In brief, iPSCs and ESCs were harvested and cells were seeded out for EB formation in suspension cultures containing IMDM (PAA), 15% pretested FCS, penicillin–streptomycin, 1 mM
Immunocytochemistry
Immunocytochemistry was performed using standard protocols. In brief, cells were fixed with 4% formaldehyde, permeabilized with 0.2% Triton X-100, and blocked with appropriate serum. Primary antibodies were incubated overnight (1:250 dilution); secondary antibodies were incubated at room temperature for 1 h (dilution 1:1,000). Primary antibodies used were anti-Troponin-T, anti-Sox17, anti-Tuj1 (all Millipore), anti-Oct4, and anti-SSEA-1 (Santa Cruz Biotechnology). Secondary antibodies used were goat anti-mouse-Alexa 488, goat anti-rabbit-Alexa 488, goat anti-rabbit-Texas Red, and goat anti-mouse-Alexa 647 (all Jackson ImmunoResearch Europe).
AP staining
Staining was performed using the Alkaline Phosphatase Detection Kit (Chemicon) according to the manufacturer's instructions: cells were fixed with 4% paraformaldehyde, washed with Tris-buffered saline (with 0.1% Tween-20, TBST), and stained with AP staining solution.
Flow cytometry
For detection of SSEA-1, cells were harvested after trypsinization and resuspended in FACS buffer (PBS with 2% FCS). Cells were rinsed with FACS buffer and stained with a phycoerythrin-coupled anti SSEA-1 antibody (R&D systems) according to the manufacturer's instructions. For detection of other surface markers, cells were harvested as described above. The following antibodies were used in concentrations according to the manufacturer's instructions: anti-mouse-CD45-PE, anti-mouse-CD117-APC, anti-mouse-Sca1-PE, anti-mouse-CD41-APC, anti-mouse-CD31-PE, anti-mouse CD3e-FITC, anti-mouse CD45R(B220)-PE, anti-mouse Cd11b-APC, anti-mouse CD11c-APC, anti-mouse Gr-1-PE, and anti-mouse TER119-PE-Cy7 (all eBioscience). All flow cytometric analyses were performed using a FACSCalibur instrument (Becton Dickinson).
Quantitative RT-PCR
For quantitative RT-PCR (qRT-PCR), total RNA was isolated from cells using the GeneElute Mammalian Total RNA Kit (Sigma-Aldrich) followed by a DNaseI digestion (Invitrogen) according to the manufacturer's instructions. Subsequently, RNA was reversly transcribed using AMV reverse transcriptase and oligo(dT) or random hexamer primer (both Fermentas). For TaqMan-based qRT-PCR, 65 ng cDNA was used as input. The following predesigned assays were obtained from Applied Biosystems: mOct4 (Mm00658129_gH), mSox2 (Mm00488369), mNanog (Mm02384862_g1), mcMyc (Mm00487804_m1), mKlf4 (Mm01351375_g1), mActin beta (Mm00607939_s1), hOct4 (Hs03005111_g1), hSox2 (Hs01053049_s1), and hcMyc (Hs01570247_m1). For SYBR green-based real-time PCR, the following Quantitect primer assays (Qiagen) were used: Gapdh (QT01658692), Dlx1 (QT01078413), and Cxcr4 (QT00249305). Real-time PCR was performed on a StepOnePlus thermocycler (Applied Biosystems) with 40 cycles of 95°C for 15 s and 60° for 1 min.
Western blots
Total protein isolation was performed by osmotic cell lysis in presence of protease inhibitors (Complete Mini; Roche). Equal amounts of denatured protein (usually 5–15 μg) were separated by 12% sodium dodecyl sulfate (SDS)–polyacrylamide gels. Proteins were transferred onto polyvinylidene fluoride (PVDF) membranes (Hybond-P; GE-Healthcare) using the wet-blotting technique. Transfer efficiency was controlled with Ponceau-S (Sigma-Aldrich). Membranes were blocked with TBST containing 5% dry milk for 1 h. Membranes were incubated with primary antibodies (anti-Oct4: sc-5279; anti Sox2: sc-17320; Santa Cruz; anti-α-tubulin: T9026, Sigma-Aldrich; anti-Vinculin: V9131, Sigma-Aldrich; anti-Sox17, Millipore; anti-Tuj-1, Millipore, anti-Troponin-T, Millipore) in TBST with 5% dry milk at 4°C over night. Membranes were rinsed with TBST and incubated with the appropriate horseradish-peroxidase-coupled secondary antibodies (Jackson ImmunoResearch) at room temperature for 1 h. Protein detection was performed with enhanced chemoluminescence reagents (SuperSignal West Femto/Pico; Thermo Scientific) and the ChemiDoc XRS+station (BioRad).
Global gene expression analysis
Transcriptomal profiling was performed as described before [17]. In brief, RNA samples were prepared using Qiagen RNeasy columns with on-column DNA digestion. Three hundred nanograms of total RNA per sample was used as input into a linear amplification protocol (Ambion), which involved synthesis of T7-linked double-stranded cDNA and 12 h of in vitro transcription incorporating biotin-labeled nucleotides. Purified and labeled cRNA was then hybridized for 18 h onto MouseRef-8 v2 expression BeadChips (Illumina) following the manufacturer's instructions. After washing as recommended, chips were stained with streptavidin-Cy3 (GE Healthcare) and scanned using the iScan reader (Illumina) and accompanying software. Samples were hybridized as biological replicates. Data were processed by mapping bead intensities to gene information using BeadStudio 3.2 (Illumina). Background correction was performed using the Affymetrix Robust multiarray analysis background correction model [35]. Variance stabilization was performed with log2 scaling and gene expression normalization was calculated with the method implemented in the lumi package of R-Bioconductor. Data postprocessing and graphics were performed with in-house developed functions in Matlab. Hierarchical clustering of genes and samples was performed with one minus correlation metric and the unweighted average distance (UPGMA) (also known as group average) linkage method.
Bisulfite sequencing for Oct4, Cxcr4, and Dlx1 promotor analysis
Genomic DNA was purified from cells by proteinase K treatment (10 mM Tris-HCl pH 8.0, 10 mM EDTA pH 8.0, 1% SDS, and 20 μg/mL proteinase K). Seven hundred nanograms of genomic DNA was digested with NotI (New England Biolabs), and then denatured by addition of 2 M NaOH. Afterward, DNA was embedded in 50 μL of 20 mg/mL dissolved low melting agarose Roth and transferred to ice-cold mineral oil to form agarose beads. For bisulfite treatment 2.5 M bisulfite-hydroquinone solution pH 5.0 (Roth) was added to the mineral oil containing the beads and left for 4 h at 50°C in darkness. One primer set specific for the Oct4 promoter CR1 region in mouse. Primer sequences were designed with MethPrimer software (
For promoter analysis of Cxcr4 and Dlx1, genomic DNA was isolated using the GenElute Mammalian gDNA Kit (Sigma-Aldrich) and bisulfite converted with the EpiTect Kit (Qiagen). Primers amplifying promoter regions (∼1 kb upstream of the start codon) of Cxcr4 and Dlx1 were designed with MethPrimer (Supplementary Table S1). PCR products were subcloned into pCR2.1 vector with the TopoTA cloning Kit (Invitrogen). Individual colonies were picked, plasmid DNA was purified, and DNA was sequenced using M13 primers. Degree of methylated DNA was analyzed with the BiQ Analyzer Software [36].
Teratoma formation
About 1×10⁶ cells were injected into left or right flanks of NOD/SCID/γcnull mice according to approved animal protocols. Mice were investigated for tumor development every day and sacrificed as soon as formed tumors were palpable. Tumors were fixed in 4% formaldehyde and paraffin sections were stained with hematoxylin/eosin for histological analyses.
Statistical analysis
Statistical analysis was performed using analysis of variance followed by Dunnett's post-test or Student's t-test. Data were processed using GraphPad Prism software (GraphPad Software, Inc.)
Results
Generation of iPSCs from murine BM cells
To facilitate early detection of reprogrammed cells, cells from Oct4-GFP transgenic OG2 mice [32] were utilized. Studies were performed separately on more primitive (Linneg) and further differentiated (Linpos) cells, to determine a potential influence of the differentiation status of BM cells on iPSC generation. Purity of starting populations was above 90% in all experiments (Supplementary Fig. S2A). Major subpopulations of Linpos cells consisted of T (∼6%) and B (∼20%) cells, NK and dendritic cells (∼7%), nucleated erythroid progenitors (∼5%), and myeloid cells (∼75%), whereas Linneg cells showed a proportion of ∼10% of nucleated red cells but only minor fractions of T, B, NK/dendritic, or myeloid cells (Supplementary Fig. S2B). Cells were transduced with a cocktail of 4 lentiviral vectors coding individually for the human cDNA transcripts of the reprogramming factors Oct4, Sox2, Klf4, or c-Myc in a 1:1:1:1 stoichiometry. Self-inactivating (SIN) lentiviral vectors were used, and reprogramming factors were expressed from an internal SFFV promoter/enhancer cassette, a design previously shown to be suited for high transgene expression in hematopoietic cells [29]. Transduction followed protocols previously optimized for the genetic manipulation of murine hematopoietic progenitor cells [37,38] with an MOI of 50. Control transductions using these protocols in combination with a GFP-expressing lentiviral vector construct yielded transduction efficiencies of ∼40% for both Linneg and Linpos cells, and for the Linneg fraction a persistence of ∼60% of Linneg cells was observed at the end of the 72 h transduction period, whereas the other ∼40% of cells differentiated into Gr-1+ and/or CD11b+ myeloid cells. In the Linpos fraction, contaminating Linneg cells were completely absent at the end of transduction with only B cells (∼20%) and Gr-1+ (∼50%) and/or CD11b+ (∼60%) myeloid cells detectable (Supplementary Fig. S2C). Consequently, also transduced cells only consisted of Gr-1+ and/or CD11b+ myeloid cells (Linpos fraction) or B cells plus Gr-1+ and/or CD11b+ myeloid cells (Linneg fraction; Supplementary Fig. S2D). GFP expression from the SFFV promoter was particularly robust in Linneg and Gr-1+ or CD11b+ myeloid cells (irrespective of their origin from within the Linpos population or after differentiation from an initially Linneg cell), whereas an ∼1 log reduction was observed for CD45R+ B cells (Supplementary Fig. S2E).
Induction of pluripotency in Linneg cells was remarkably fast as single GFP-positive cells, indicating activation of transgenic Oct4-GFP expression and thus initiation of the reprogramming process were visible in the Linneg fraction as early as day 5 pt (post-transduction) and by day 14 pt first colonies with ESC-like morphology were detected (Fig. 1A). This process was considerably delayed in Linpos cells, where GFP-expressing colonies were not observed before day 18. Moreover, the overall reprogramming efficiency was twice as high in Linneg (0.01%–0.015%) as compared with Linpos cells (0.005%–0.007%; n=2), indicating an influence of the differentiation status of the initial cell population on the reprogramming process. BM-iPSC-derived colonies displayed the distinct morphology of murine ESC with a doubling time of 10–11 h similar to OG2 ESCs.
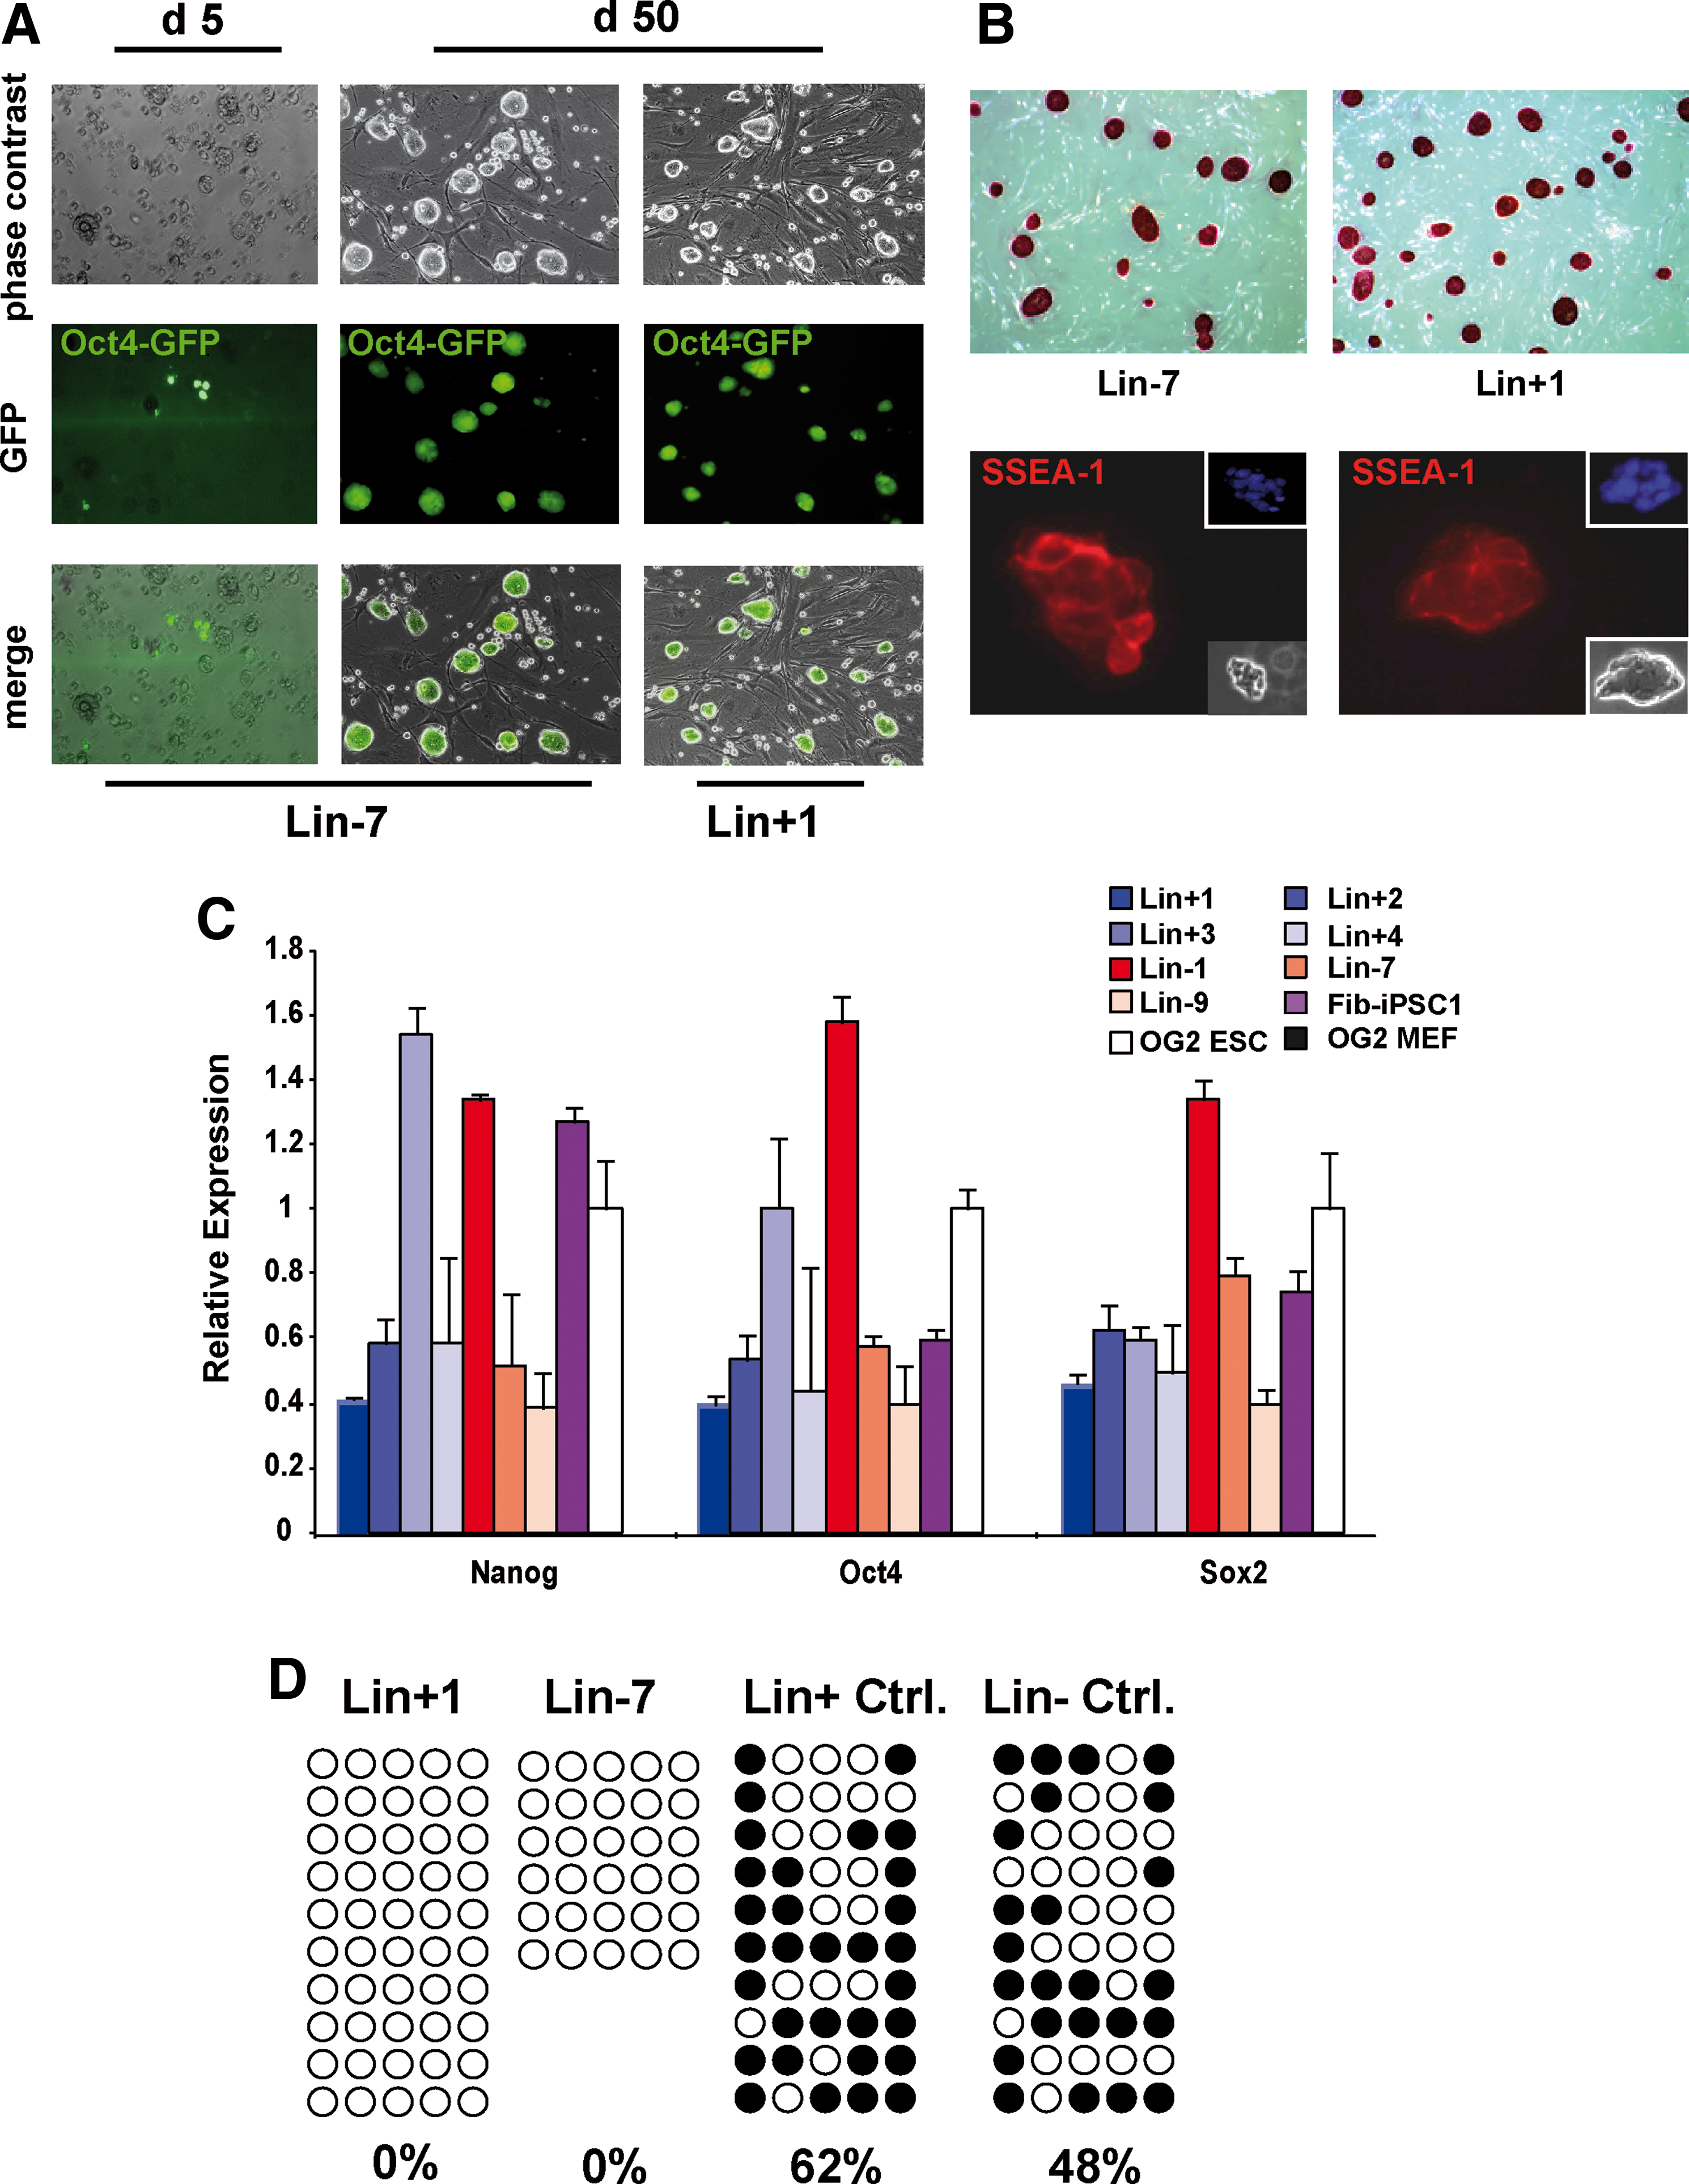
Generation of induced pluripotent stem cells (iPSCs) from murine bone marrow (BM). Lineage negative (Linneg) BM cells reactivate endogenous Oct4 expression ∼5 days after transduction with lentiviral constructs expressing human Oct4, Sox2, Klf4, and cMyc. iPSCs generated from Linneg and lineage positive (Linpos) BM cells display typical embryonic stem cell (ESC)-like colony growth and retain their GFP expression
In 2 independent experiments, initially, 45 (20/25) and 24 (10/14) colonies were obtained from Linneg and Linpos cells, respectively. Based on morphology and growth characteristics, 9 (Linneg) and 5 (Linpos) of these clones were maintained. Of these, several clones were lost due to a partially reprogrammed phenotype or due to differentiation during early passages. Others were discontinued when Southern blot analysis of retroviral integration patterns demonstrated common cellular origin of clones. Thus, finally, 7 individual BM-iPSC lines (Lin-1, Lin-7, Lin-9, Lin+1, Lin+2, Lin+3, and Lin+4) remained for further characterization. These lines subsequently were cultured for 30–50 passages and maintained Oct4-driven GFP expression as well as their distinct morphology throughout.
Characterization of BM-iPSC lines
BM-derived iPSC lines showed over 90% AP-positive colonies and expressed the murine ESC typical marker SSEA-1 (surface-specific embryonic antigen-1) (Fig. 1B). As expected, BM-iPSCs lost the expression of hematopoietic markers such as CD45 and Sca-1; however, BM-iPSCs as well as reference ESCs stained positive for CD117 (c-Kit, Supplementary Fig. S3). To analyze endogenous, reprogramming-induced expression levels of Nanog, Oct4, and Sox2, qRT-PCR was performed on BM-iPSC lines using primer/probe combinations specific for the murine pluripotency factors. As depicted in Fig. 1C, endogenous expression of Nanog, Oct4, and Sox2 was detected in all 7 BM-iPSC lines and in Fib-iPSC 1 and was comparable to expression in OG2-ESCs. Control MEFs from OG2 mice did not show relevant Nanog, Oct4, or Sox2 signals. In addition, Nanog, Oct4, and Sox2 mRNA was not detectable in parental Linneg and Linpos BM cells, whereas c-Myc and Klf4 were expressed in both Linneg and Linpos cells (data not shown). We also analyzed remaining reprogramming vector-related transgene activity applying qRT-PCR with primer/probe combinations specific for the human reprogramming factors. In these studies little or no expression of human reprogramming factors was detected in Linneg BM-iPSC lines and in the Linpos iPSC line Lin+2, indicating efficient silencing of the viral transgenes (Supplementary Fig. S4A). In contrast, persistent expression of virus-derived Oct4 was observed in the Linpos iPSCs. No exogenous expression of Sox2 or cMyc was detected in our iPSC lines (data not shown). In 4 of the BM-derived iPSC lines, western blot analysis for total Oct4 and Sox2 expression was performed and revealed levels similar to the reference OG2 ESCs (Supplementary Fig. S4B).
As promoter demethylation-induced reactivation of the Oct4 locus is a classical feature of iPSCs, we analyzed the methylation pattern in the Oct4 promotor region in our iPSC lines. In accordance with the qRT-PCR data, bisulfite sequencing of the Oct4 promoter revealed absence of DNA-methylation in both Lin+1 and Lin-7 iPSC lines, indicative of active promoter usage and transcription. In contrast, freshly isolated Linpos and Linneg BM cells showed significant levels of promoter methylation with 62% and 48% of CpGs methylated, respectively (Fig. 1D).
To assess the pluripotent potential of our BM-iPSCs, in vitro differentiation as well as teratoma formation was analyzed. For in vitro differentiation analysis, all BM-iPSC, OG2 ESC, and a control Fib-iPSC line were subjected to EB formation via the hanging drop technique. After 5 days, directed differentiation into the 3 germ layers was induced. All iPSC lines and the OG2 ESC gave rise to derivatives, which stained positive for Troponin T, neuronal-specific β-III tubulin (Tuj1), and Sox17, indicating their capability to differentiate into cells of all 3 germ layers (Fig. 2A).
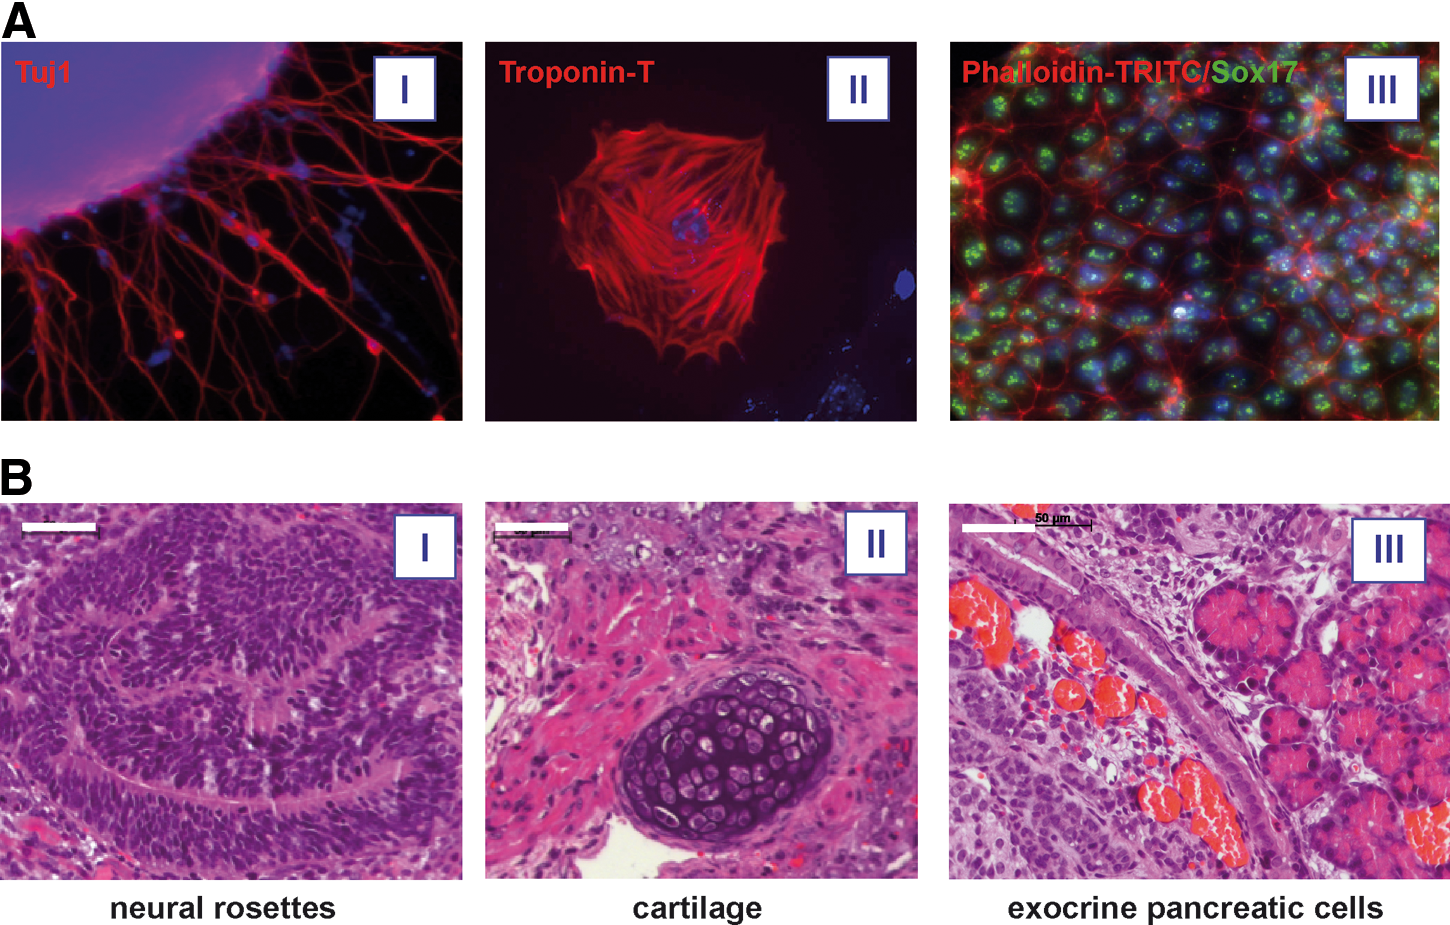
Functional characterization of BM-iPSCs. Directed in vitro differentiation of BM-iPSCs yielded derivatives of the 3 germ layers as shown by expression of Tuj1 (ectoderm, I), Troponin-T (mesoderm, II), and Sox17 (endoderm, III) in immunocytochemistry analysis. Cell nuclei were stained with DAPI
After subcutaneous injection into NOD/SCID/γcnull mice, all BM-iPSC lines induced teratomas within 4–5 weeks, which contained cells of all 3 germ layers as evaluated by histological analyses. However, the maturity of teratomas somewhat differed between BM-iPSC lines. Whereas Lin-7 and Lin-9 cells and to a slightly lesser degree also Lin-1 cells gave rise to mature teratomas displaying well-differentiated neural tube-like structures, keratinizing epithelium, smooth and striated muscle, cartilage, actively secreting gland-like epithelia, ciliated epithelium, and exocrine pancreatic cells (Fig. 2b), iPSCs derived from Linpos BM cells induced teratomas of lesser maturity and particularly in Lin+1 and Lin+4 cells predominantly gave rise to poorly differentiated neuronal-like tissue (Supplementary Fig. S5A). Considerable differences among our iPSC lines also were observed when germ layer-specific markers were analyzed by qRT-PCR in day 5 EBs before further directed differentiation into hematopoietic cells. In comparison to OG2 ESC all our iPSC lines with the exception of Lin+1 showed increased levels of the endodermal transcription factor Gata4, whereas the mesodermal marker Flk1 was markedly increased only in the Lin-7 and Lin-9 lines. Expression of the ectodermal marker Otx2 was reduced in all iPSC lines with the exception of Lin+1 and Fib-iPSC1 and reduced expression in these 2 lines also was observed for the mesendodermal marker brachyury (Supplementary Fig. S5B).
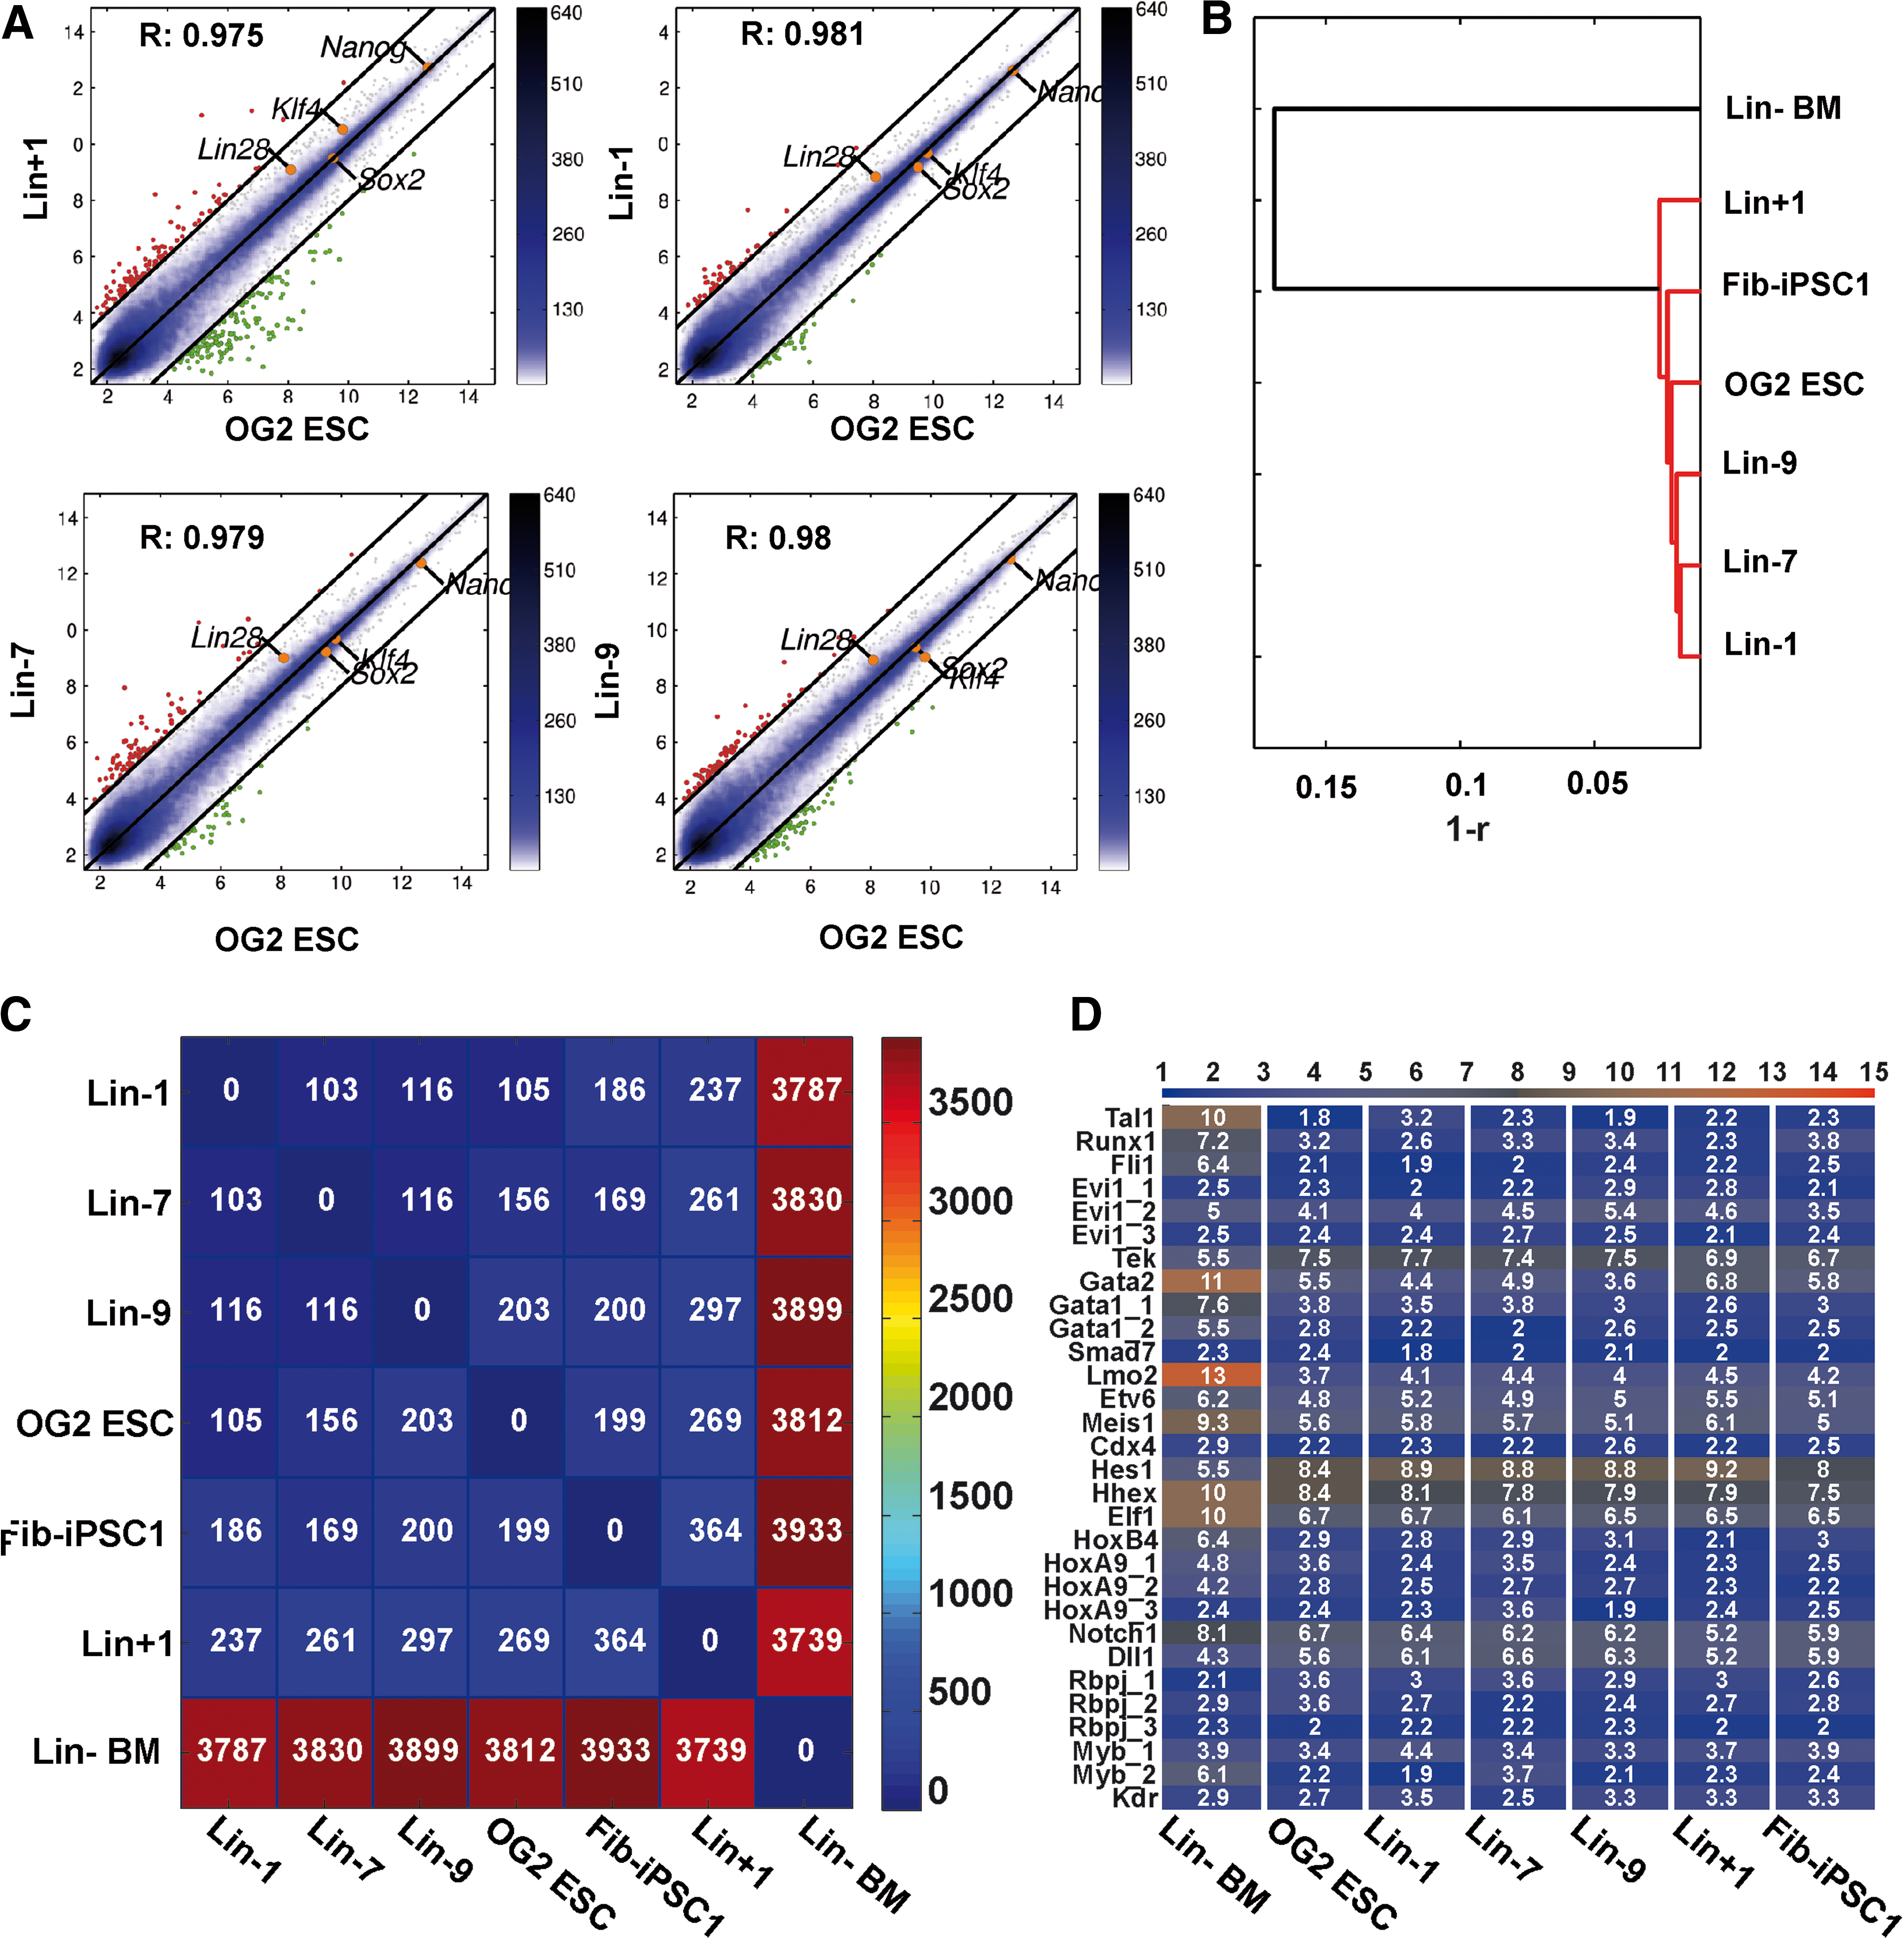
Global gene expression analysis of BM-iPSCs and OG2 ESCs by Illumina-based microarray analysis. Scatter plot analysis with important pluripotency factors (correlation coefficient r is indicated)
Gene expression analysis
The considerable differences in the differentiation potential of our iPSC lines, however, were not reflected on global gene expression profiling. When global cDNA from a panel of our BM-iPSC lines was subjected to Illumina-based micro array analysis a high grade of similarity between all iPSC lines and OG2 ESCs was observed, including expression levels of important pluripotency-associated genes such as Nanog, Lin28, and Sox2 (Fig. 3A). Interestingly, homogeneity in gene expression was most pronounced among BM-iPSC lines derived from Linneg cells as demonstrated by numbers of differing genes or dendogram visualization (Fig. 3B, C). As expected, freshly isolated and Linneg BM cells from OG2 mice showed few similarity with iPSCs or OG2-ESCs.
Given the generation of our iPSCs from BM as well as our interest in hematopoietic redifferentiation, we specifically monitored expression of 30 genes and isoforms with particular relevance for hematopoiesis and hematopoietic development within our microarray data set (Fig. 3D). However, we were unable to identify genes that were clearly overexpressed specifically in the Linneg or Linpos iPSC lines when compared with OG2 ESCs or Fib-iPSC1.
Hematopoietic redifferentiation
Next, we set up hematopoietic in vitro differentiation assays based on EB formation and subsequent cytokine-supported terminal hematopoietic differentiation. To better assess the role of the tissue of origin in hematopoietic differentiation capacity, 2 additional Fib-iPSC lines (Fib-iPSC2 and 3) generated and characterized by the same methodology as Fib-iPSC1 were introduced to the studies. CCE-ESCs [39] as an ESC line known for its high hematopoietic differentiation potential were used as positive controls. Substantial differences between BM- and Fib-iPSCs were observed when early mesodermal (Flk1), endothelial (CD31), or hematopoietic (CD41 or CD41/CD45) surface marker expression was analyzed at various time points. At day 4 of the differentiation process most of Linpos or Linneg iPSC lines yielded high proportions of Flk1+ cells similar to CCE-ESCs (Fig. 4A). Expression of CD41 as a marker for early hematopoietic development [40] was analyzed on day 9 and all Linneg BM-iPSC lines exhibited a substantial population of CD41+ cells similar to the ESC lines. In contrast, only minimal CD41 expression was observed in all Fib-iPSCs as well as 2 Linpos IPSC lines with the remaining 2 Linpos lines yielding intermediate results (Fig. 4B). Differences were even more striking for CD41/CD45 double-positive cells. Higher proportions of CD41+/CD45+ cells only were observed in Linneg iPSC (Lin-7 and Lin-9) and ESC (CCE-ESC) lines. Lin-1 and OG2 ESCs showed a minor population of these cells, whereas this population was virtually absent in all Linpos BM cell- and fibroblast-derived iPSC lines (Fig. 4C). Heterogeneity between cell lines was less pronounced, when endothelial differentiation as indicated by CD31+ cells was investigated (Fig. 4D).
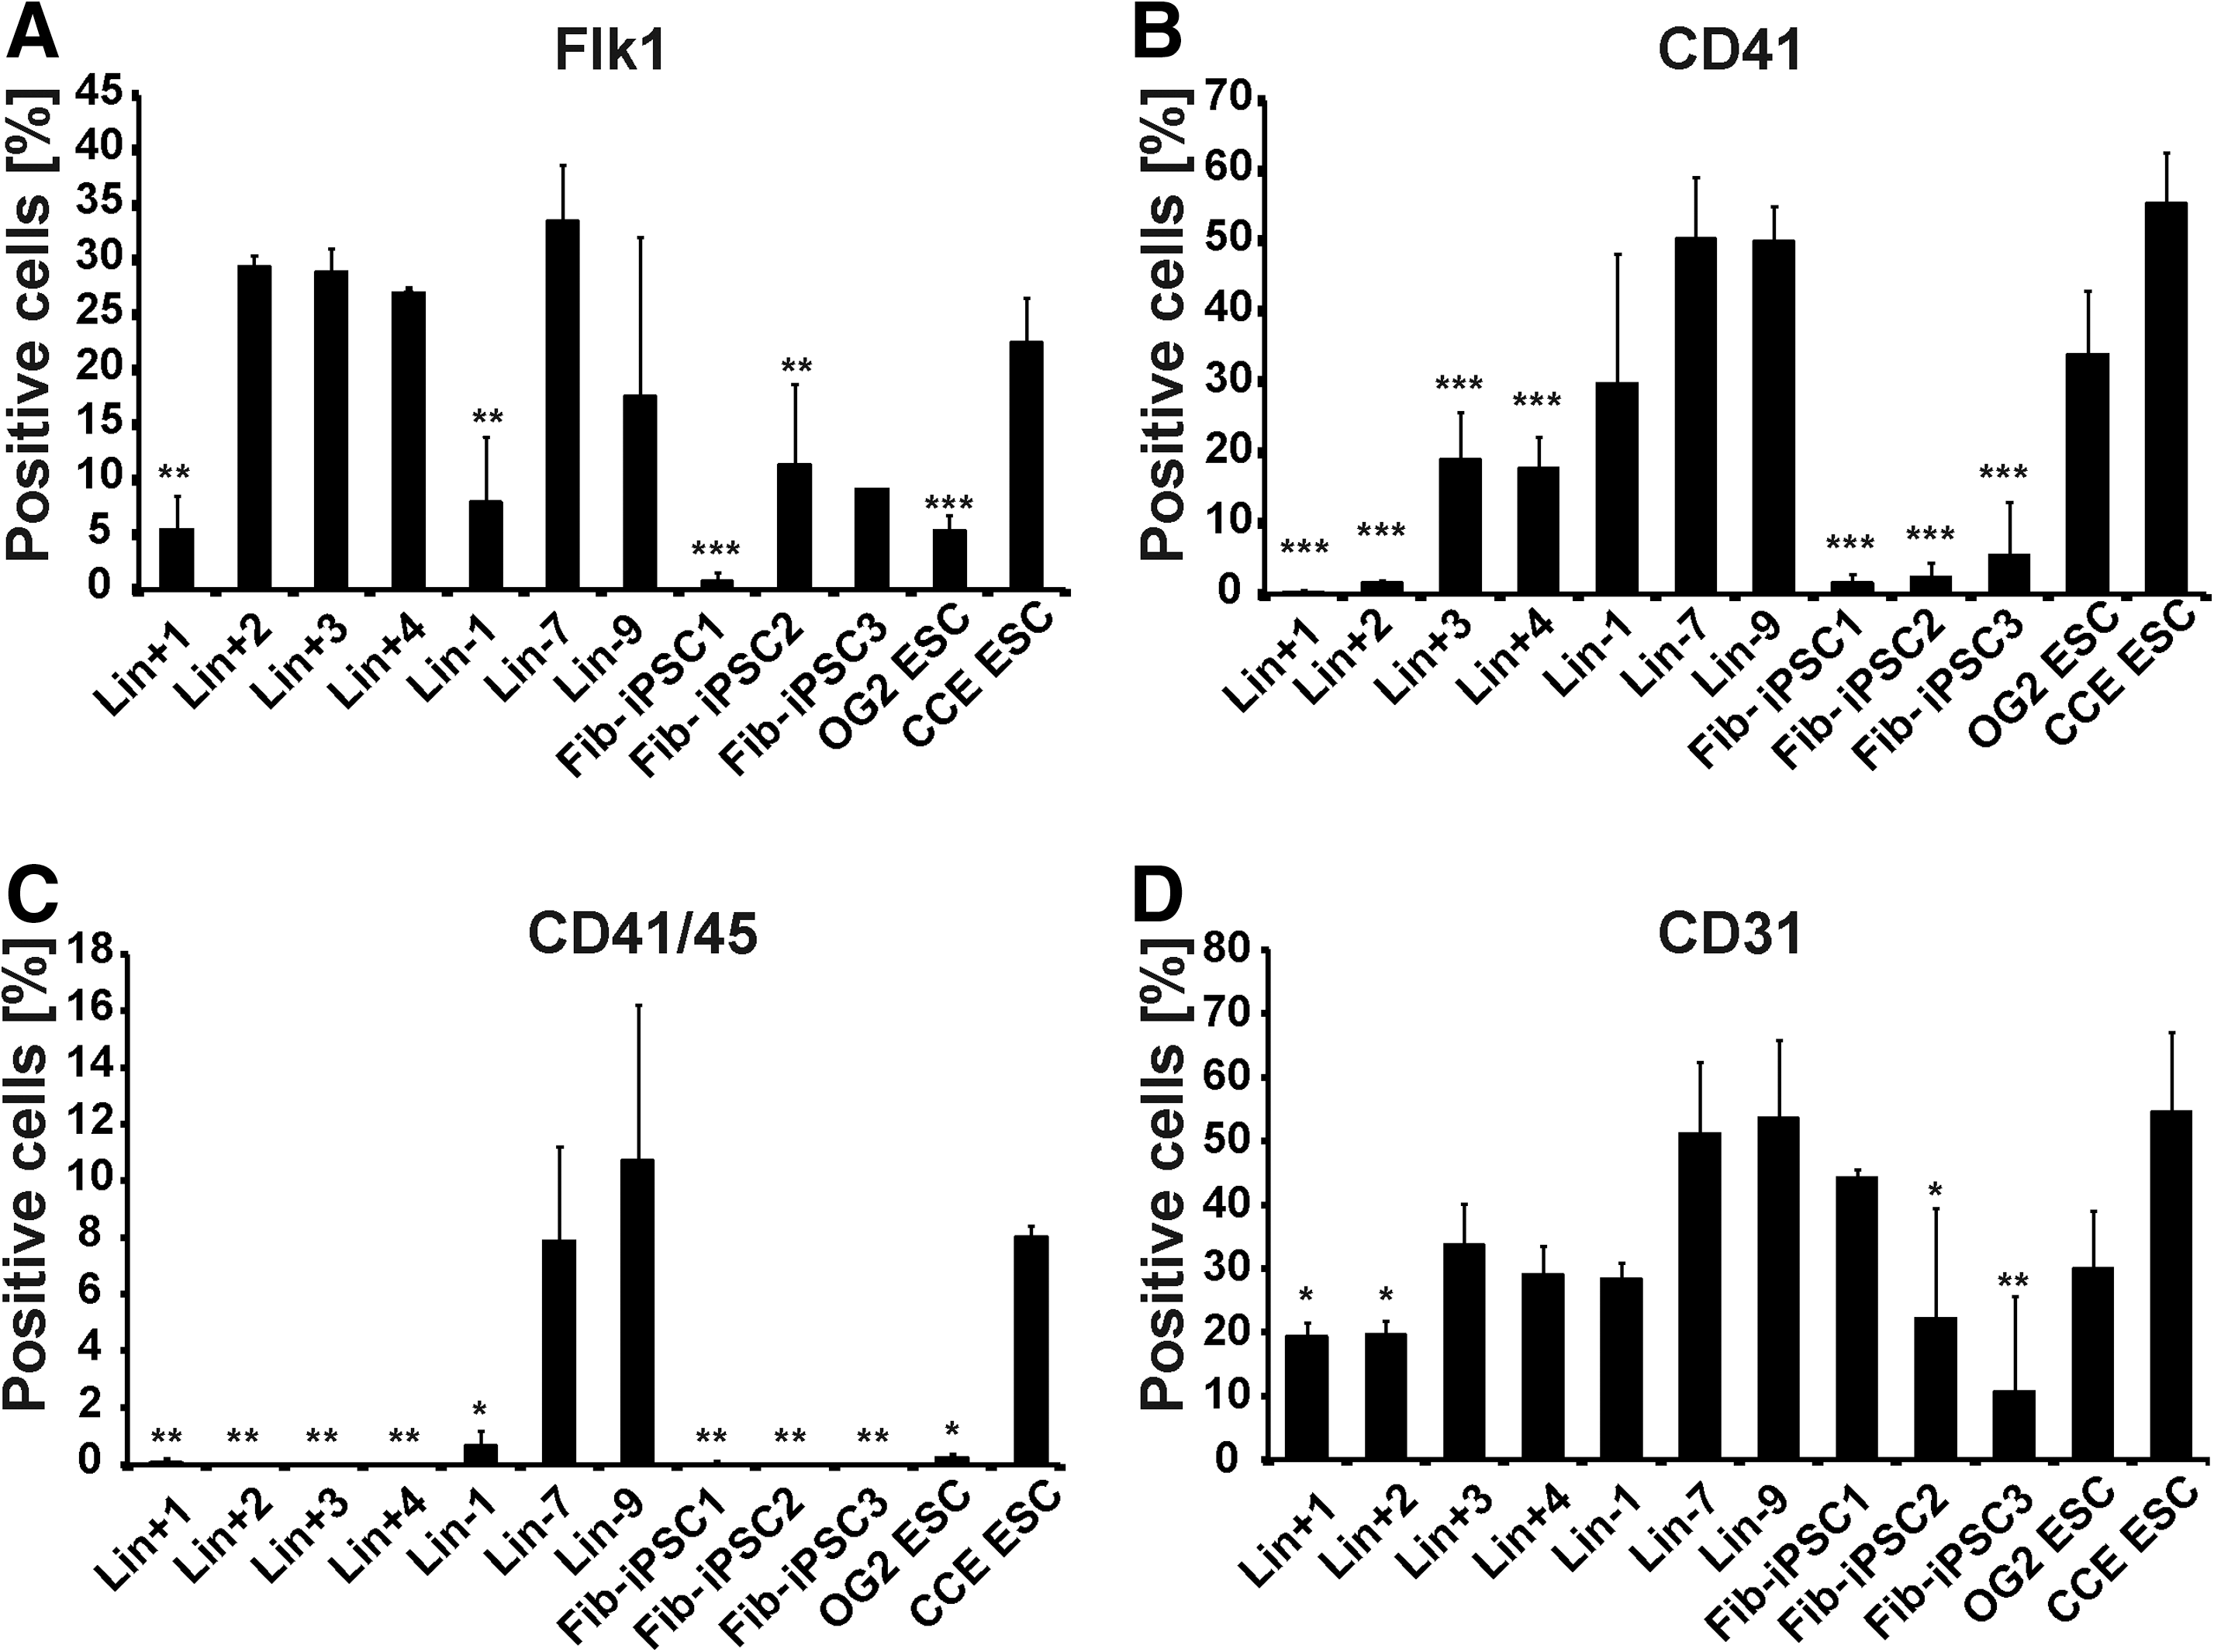
Flow cytometric analysis of directed mesodermal, hematopoietic, and endothelial differentiation. BM-iPSCs, Fib-iPSCs, OG2 ESCs, and CCE ESCs were subjected to mesodermal differentiation via embryoid body (EB) formation. On day 4, early mesodermal Flk-1+ cells were analyzed
Efficient hematopoietic differentiation in BM-iPSC lines Lin-7 and Lin-9 was confirmed by clonogenic assays, which yielded progenitor-derived colonies of myeloid, erythroid, or multilineage differentiation at similar numbers as CCE-ESCs (Fig. 5A–C), whereas colony outgrowth from fibroblast- or Linpos cell-derived iPSC was significantly lower. Thus, substantial differences between the hematopoietic differentiation capacity of BM- versus fibroblast-derived iPSCs but also between iPSCs derived from Linpos and Linneg BM lines were demonstrated by phenotypic as well as functional analysis. Of note, efficient hematopoietic redifferentiation of Linneg lines in our hands was observed for cells from high passage numbers, as all hematopoietic differentiation experiments were performed from late passage (p25–45) cells.
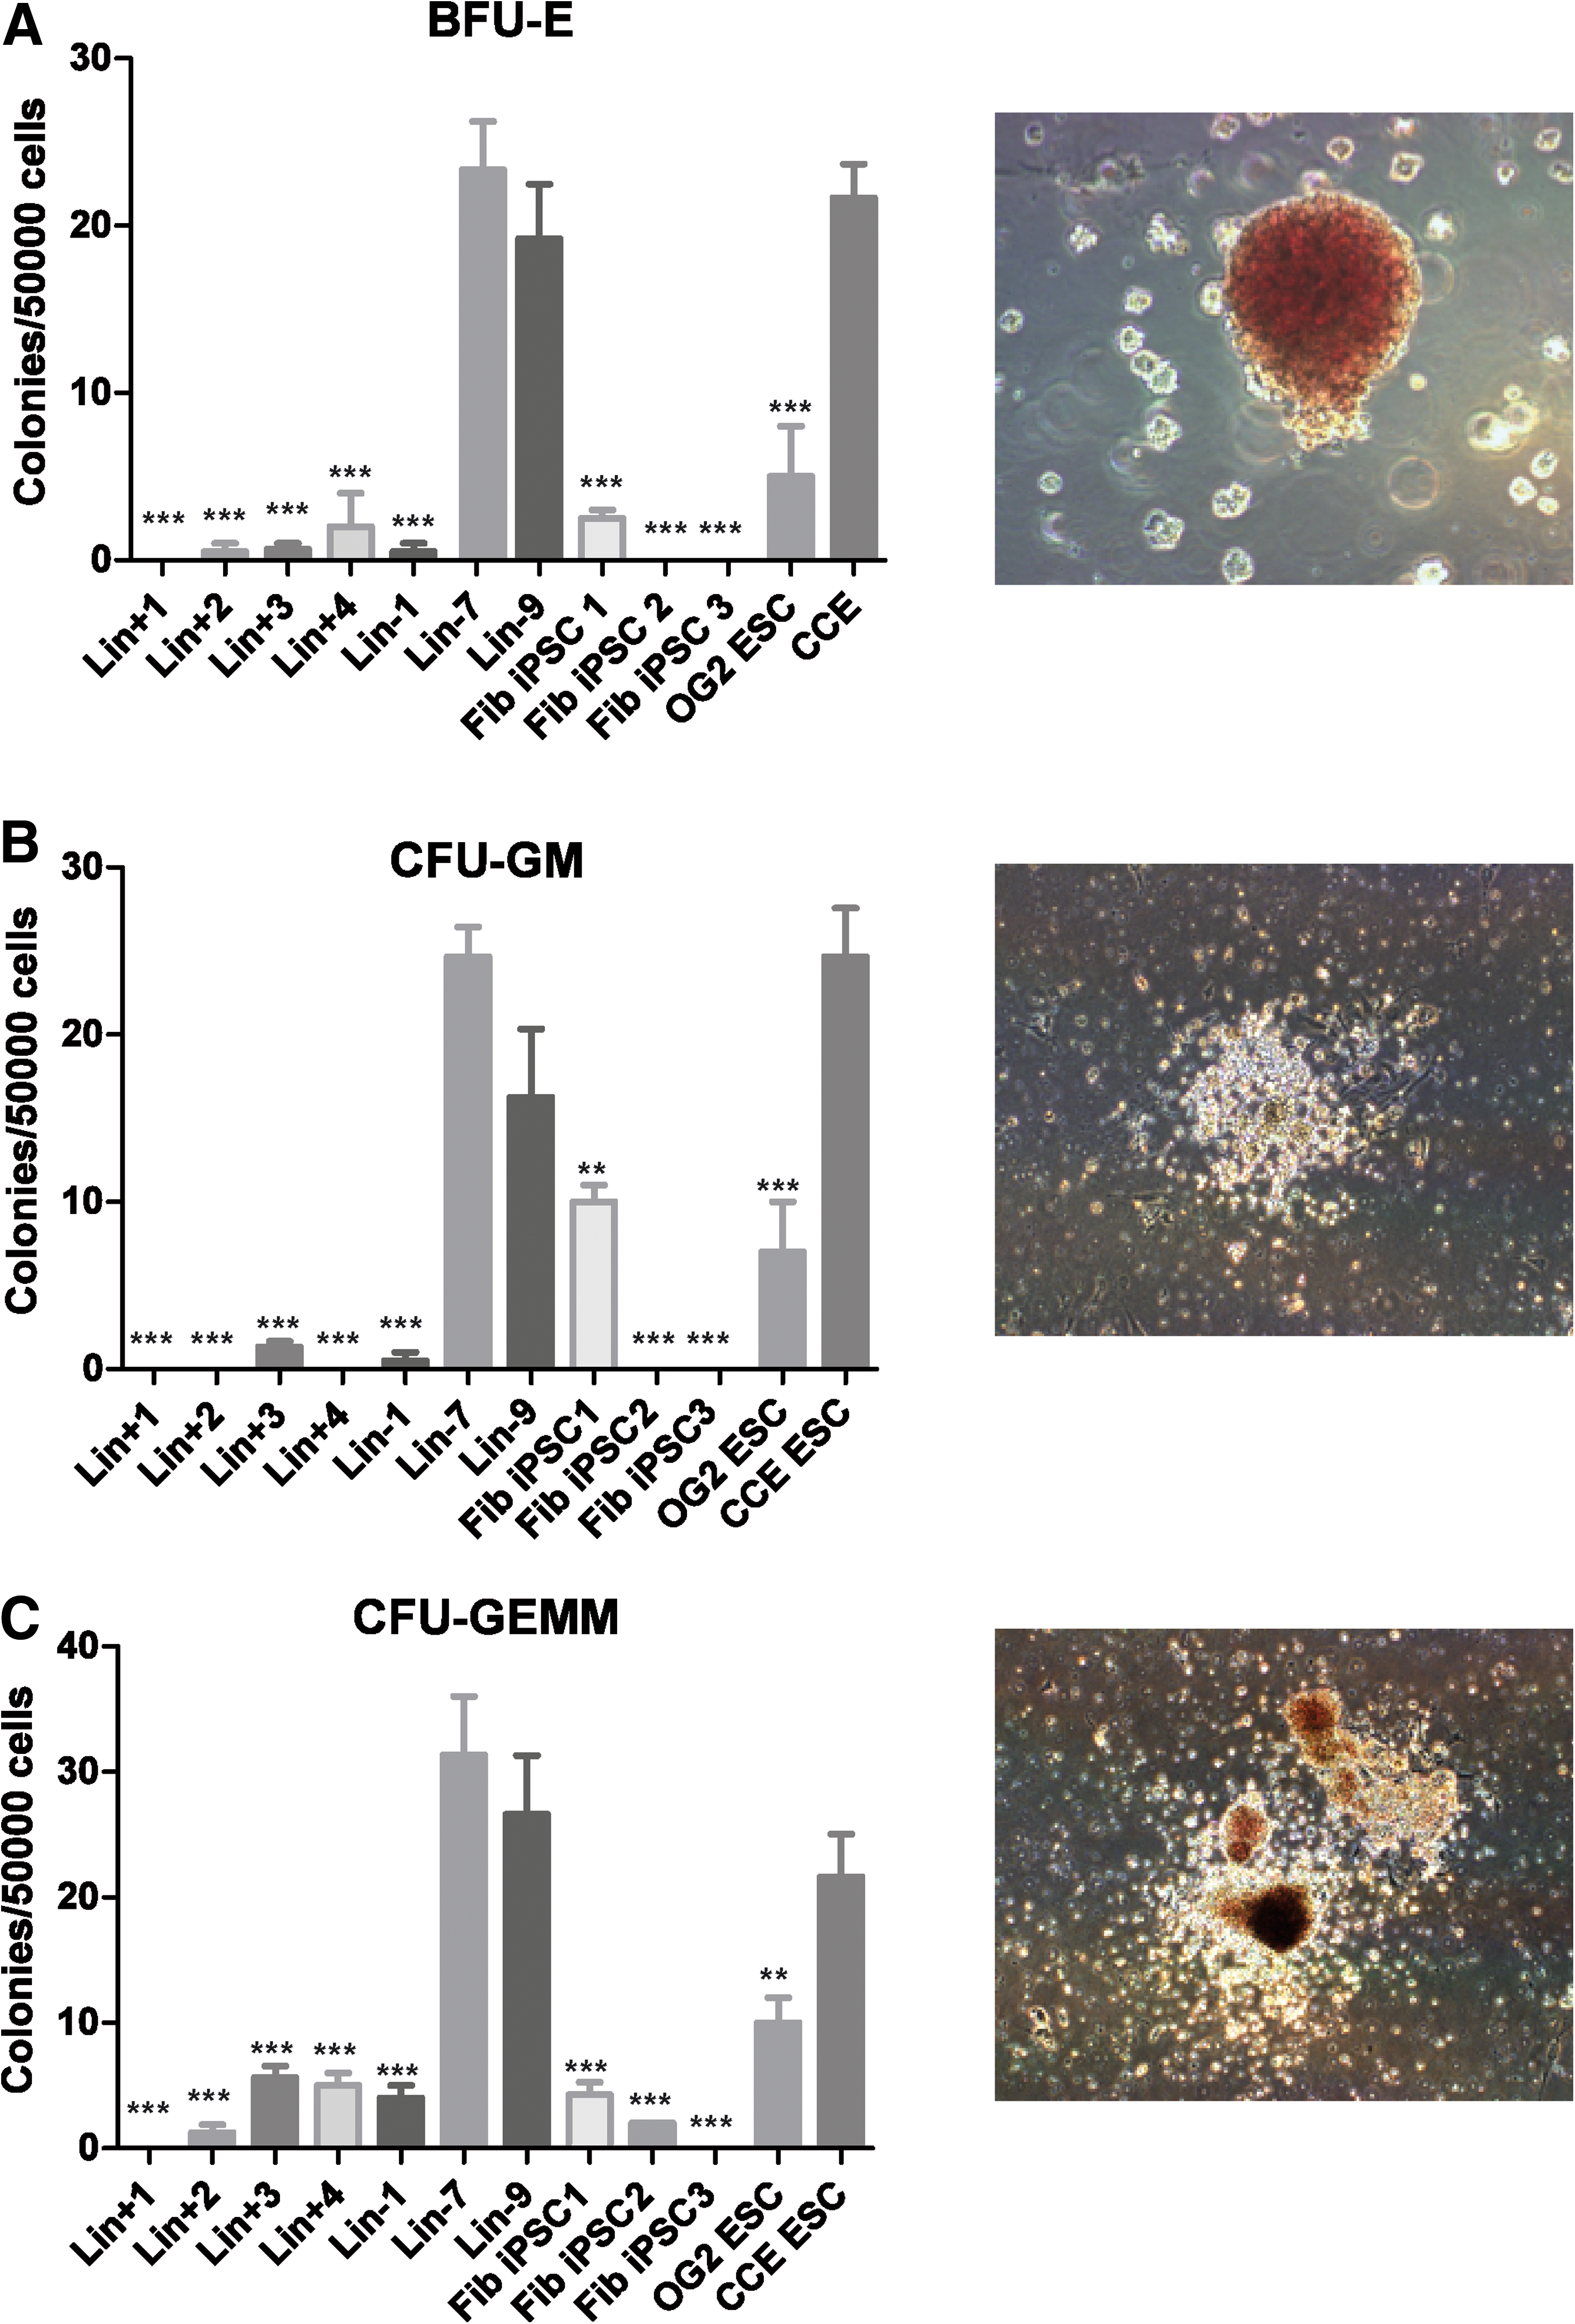
Functional analysis of iPSC-derived hematopoietic cells. After 8 days of EB culture and 8 subsequent days in methylcellulose cultures, burst-forming units erythroid
Recently, distinct transcriptional and epigenetic patterns have been linked to an epigenetic memory of iPSCs derived from hematopoietic or other tissues [12,13] and, therefore, we specifically investigated promoter methylation and transcription of the 2 hematopoiesis-associated genes: Cxcr4 and Dlx1. Both genes exhibited only minimal promoter methylation in our iPSC as well as ESC lines (Fig. 6A, C). However, in line with the notion of an epigenetic memory, significantly higher levels of Cxcr4-specific mRNA were detected in Linneg iPSCs compared with Fib-iPSCs and ESCs, with Linpos iPSCs yielding intermediate results (Fig. 6B). In none of the cell lines, Dlx1-specific mRNA in excess of background levels was detectable.

Promoter methylation and expression analysis of the Cxcr4 and Dlx1 genes. DNA methylation of CpG islands 1 kb upstream of the start codon of Cxcr4
Discussion
Our studies address the issues of iPSC generation from various cell sources as well as their efficient (re)differentiation into hematopoietic tissues. Toward this aim we have generated iPSC lines from different subpopulations of murine BM cells and compared their hematopoietic differentiation capacity to that of fibroblast-derived iPSC and ESC lines established on the same genetic background. To facilitate the detection of reprogrammed cells, Oct4-GFP transgenic (OG2) mice were utilized, as this strain has been proven to reliably indicate early reprogramming events by the appearance of GFP-positive cells in various experimental settings such as fusion of somatic with pluripotent cells [41,42], somatic cell nuclear transfer [43], or transcription factor-based reprogramming [17].
In the first part of our work we describe efficient reprogramming of primitive BM cells lacking the expression of surface markers associated with terminal lineage differentiation. Design of these experiments was inspired by several reports indicating reprogramming efficiency to be reciprocally correlated to the degree of cellular differentiation. For example, mouse embryonic fibroblasts represent a convenient and frequently used starting source for efficient iPSC generation, whereas reprogramming of adult fibroblasts has proven more cumbersome [44,45]. Similarly, neural stem cells (NSCs) in contrast to differentiated neural tissue can be reprogrammed by single factor overexpression of Oct4, and this observation has been linked to endogenous expression of Sox2, Klf4, and c-Myc in NSCs [16]. Also, for the hematopoietic system more efficient reprogramming of stem/progenitor as compared with fully differentiated cells has been described in a transgenic murine model system allowing for doxycyclin-inducible expression of reprogramming factors [46]. Our studies now extend this observation to primary BM cells from wild-type animals. Primitive Linneg HSCs not only were reprogrammed more rapidly but also with increased efficiency when compared with differentiated cells. In addition, all iPSC clones obtained from the more differentiated Linpos BM cells showed some degree of exogenous, vector-derived Oct4 expression even after extensive passaging (p20–40), supporting the notion that complete reprogramming is more difficult to achieve in these cells. In contrast to NSCs [16], however, enhanced reprogramming of Linneg versus Linpos BM cells in our experiments cannot easily be explained by differential expression of reprogramming factors before induction of pluripotency, but rather reflects the more primitive, stem cell-related gene expression pattern in the Linneg population [47,48].
Our extensive flow cytometric subgroup analysis of the heterogenous Linpos population indicated myeloid and potentially B cells as the primary source of the Linpos iPSCs. This notion is further substantiated by the fact that our transduction protocols were primarily suited to transduce myeloid cells. In addition, the lentiviral vectors employed in our study yielded higher expression levels in myeloid than in lymphoid cells. Thus, our data probably underestimate the reprogramming capacities of lymphoid cells, and utilizing more lymphoid-directed transduction protocols efficient reprogramming of murine as well as human lymphoid cells has been reported by a number of groups [23 –25].
To express the human reprogramming factors Oct4, Klf4, Sox2, and c-Myc in differentiated as well as primitive hematopoietic cells, we applied lentiviral SIN vectors specifically suited for this purpose. In these vectors expression of the transgene is driven from the SFFV promoter/enhancer, which originally has been developed to yield high transgene expression levels in hematopoietic stem and progenitor cells and also is well-suited for gene expression in myeloid cell compartments [29,38]. On a more technical note, this vector system is designed in a modular fashion, allowing for the convenient exchange of the promoters or the genes-of-interest. In addition, the single reprogramming vectors can be equipped with different fluorescent reporter genes that may be helpful for more detailed studies of the role of individual transcription factors in the context of induced pluripotency [49].
When we compared the hematopoietic differentiation potential of BM- and fibroblast-derived iPSC lines marked differences were observed. These differences were detectable in spontaneous, nondirected differentiation within EBs and became even more obvious upon growth factor-directed differentiation toward the hematopoietic lineage. Two of our 3 Linneg BM-iPSC lines yielded high amounts of cells expressing hematopoiesis-specific surface markers and in both lines this was associated with the efficient production of clonogenic progenitor cells. In contrast, Linpos iPSCs as well as Fib-iPSCs by phenotypic as well as by functional criteria displayed little hematopoietic differentiation. The high hematopoietic redifferentiation potential of our Linneg BM-iPSCs was not attributable to an intermediate state of reprogramming in which iPSC clones are continuously dependant on exogenous transgene expression while lacking endogenous expression of reprogramming factors [50,51], as we demonstrated adequate endogenous activation of pluripotency genes by qRT-PCR in all our lines. Moreover, we did not observe significant differences in the overall gene expression signature of our Linneg iPSCs compared with ESCs or control iPSCs derived from fibroblasts or Linpos BM cells. In particular, we could not substantiate a remnant generalized hematopoietic gene expression pattern in any of these lines. Interestingly, differences in differentiation capacities also were reflected to some degree in our teratoma assay, as the 2 iPSC lines with the best mesodermal and hematopoietic redifferentiation potential also gave rise to the best-differentiated teratomas. Here, particularly in the Linpos iPSC lines the differentiation capacity may have been affected by the persistent expression of lentivirally delivered Oct4 [3].
Epigenetic memory originally has been described in the context of somatic cell nuclear transfer experiments [52] and thereafter also for transcription factor-based reprogramming approaches [9,53]. While most studies have correlated epigenetic memory with the methylation/demethylation status of promoter/enhancer sequences, also other mechanisms have been described, such as faulty restoration of bivalent domains or loss of pioneer factors [54,55]. Yet, the confounding molecular basis of epigenetic memory may be difficult to detect in the pluripotent state. In our hands, morphology, surface marker expression, and growth properties of Linneg iPSCs in the pluripotent state were virtually undistinguishable from OG2 ESCs, Fib-iPSCs, or Linpos iPSCs. This observation was further substantiated by micro-array-based global gene expression analysis demonstrating only a small number of differentially expressed genes when Linneg and Linpos iPSCs were compared with fibroblast-derived iPSC lines or ESCs derived from the same mouse strain. Even when the analysis specifically focused on genes selected for their known importance in hematopoietic development no clear-cut differences between the various iPSC lines and ESCs were detected. Two recent reports have systematically and in depth analyzed epigenetic memory in hematopoiesis-derived iPSCs and have linked the phenomenon to distinct transcriptional and epigenetic patterns [12,13]. These observations are supported by our data demonstrating expression of Cxcr4 mRNA specifically in Linneg iPSCs. However, the low levels of Cxcr4 promoter methylation also underline the fact that epigenetic memory cannot solely be attributed to promoter methylation patterns. Indeed, for the Cxcr4 gene transcriptional activity in iPSC lines derived from cells of different origins was demonstrated to be independent from promoter DNA methylation. In these studies rather histone modifications such as high levels of histone 3 acetylation (H3Ac) or trimethylation at lysine residue 4 (H3K4me3) and low levels of histone 3 trimethylation at lysine residue 27 were described as the epigenetic basis of high Cxcr4 expression in hematopoietic cell-derived iPSCs [12]. Interestingly, in our Linneg iPSCs the enhanced hematopoietic differentiation potential was observed to persist until late passages (>p40). This appears noteworthy, as in previous reports [12], the epigenetic memory conveyed by the cell type-of-origin has been described in particular for early passage of iPSCs (∼p4–10).
In conclusion, the present results show that iPSCs derived from primitive hematopoietic tissue such as Linneg BM cells represent a highly suitable source for regenerating the hematopoietic system from pluripotent cell population. Given their high potential for redifferentiation along the hematopoietic lineage, these cells merit further study as a starting material for patient-specific cell therapeutics targeting the lymphohematopoietic system. Clinical exploitation of this strategy will be supported by a well-established blood banking system, allowing for easy access to already HLA-typed HSCs derived from BM, cord blood, or peripheral blood after growth factor stimulation.
Footnotes
Acknowledgments
The authors thank Doreen Lüttge for excellent technical assistance, and Matthias Ballmaier and his crew from the Hannover Medical School cell-sorting facility for help with cell sorting. This work was supported by the Deutsche Forschungsgemeinschaft (Cluster of Excellence REBIRTH; Exc 62/1) and BMBF grant ReGene (to A.S. and C.B.).
Author Disclosure Statement
No competing financial interests exist.
References
Supplementary Material
Please find the following supplemental material available below.
For Open Access articles published under a Creative Commons License, all supplemental material carries the same license as the article it is associated with.
For non-Open Access articles published, all supplemental material carries a non-exclusive license, and permission requests for re-use of supplemental material or any part of supplemental material shall be sent directly to the copyright owner as specified in the copyright notice associated with the article.