
Abstract
The capability to reprogram human somatic cells to induced pluripotent stem cells (iPSCs) has opened a new area of biology and provides unprecedented access to patient-specific iPSCs for drug screening, disease models, and transplantation therapies. Although the process of obtaining iPSC lines is technically simple, reprogramming is a slow and inefficient process consisting of a largely uncharacterized chain of molecular events. To date, researchers have reported a wide range of reprogramming efficiencies, from <0.01% to >1%, depending on the specific reprogramming factors used, the mode of delivery of the reprogramming factors, properties of the starting cells, and culture conditions. We have applied a quantitative polymerase chain reaction methodology, TaqMan Protein Assays to directly quantify the kinetics, and cellular levels of crucial transcription factors during the reprogramming process. Further, we have used the assays to ascertain the threshold levels of reprogramming protein factors required to generate iPSC colonies, to characterize the protein expression signatures of different iPSC lines, and to rapidly identify iPS versus non-iPSC colonies based on expression of pluripotency markers. These data demonstrate that TaqMan Protein Assays can be used as tools to dissect and gain greater understanding of the mechanisms guiding reprogramming and to further characterize individual established iPSC lines.
Introduction
T
The TaqMan Protein Assays provide a simple, rapid, and sensitive method for relative quantification of proteins in cell and tissue lysates, typically requiring 500 or fewer cell equivalents and 50 ng or less protein for definitive results. These assays are based on the proximity ligation assay (PLA™) technology that combines antibody–protein binding with qPCR-based detection of DNA templates coupled to the antibodies [13,14]. This assay consists of 4 steps (shown in Fig. 1). The first step involves the binding of paired antibody–oligonucleotide probes to a protein target in a whole-cell lysate, bringing the 2 oligonucleotide probes into close proximity. The second step results in the ligation of the oligonucleotides, which is followed by the third step, the qPCR detection of the ligated template. The last step is Cq data analysis by Protein Assist software (Fig. 1). These homogenous assays are highly sensitive and specific. They are as sensitive as gene expression assays, requiring only a small number of cells per reaction, meaning that they can be conducted on cells from single colonies. The specificity is ensured by the requirement for binding of 2 antibody–oligonucleotide pairs. This report demonstrates the application of an integrated qPCR approach to measure relative changes in gene and protein expression of 3 exogenously delivered transcription factors, OCT4/POU5F1, SOX2, and KLF4, in human dermal fibroblasts during reprogramming [15].

The Taqman Protein Assay process consists of 4 steps: (1) Cells are lysed in a nonionic detergent buffer. This homogenous lysate can be serially diluted and used directly in the binding reaction. The PLA™ probes, paired antibody–oligonucleotides, are added to the diluted lysate and allowed to bind to targets for 60 min at 37°C. Each reaction well uses 2 μL of lysate and 2 μL of PLA probe. (2) Proximal PLA probe oligonucleotides are ligated. A ligation buffer containing DNA ligase and a short connector oligonucleotide is added in a volume of 96 μL. The ligation event requires 10 min and is followed by a 15 min ligase inactivation step. (3) qPCR detection is commenced using a Fast Master Mix and qPCR cycling protocol. (4) Cq data analysis for relative quantification is conducted using the Life Technologies ProteinAssist software. qPCR, quantitative polymerase chain reaction.
Major issues that limit the broad application of iPSC technology are the inefficiency and long time-frame of the reprogramming process, with a 3–4-week interval between transduction of the reprogramming factor genes and identification iPSC colonies [2,5]. In virally mediated reprogramming, the efficiency of the reprogramming process is critically dependent on the viral titers. Viral titers are commonly measured by quantifying viral nucleic acid content using qPCR, but this method does not directly reflect the functional titer; discrepancies between the qPCR and direct functional assays often range between a hundred-fold to a thousand-fold. We have demonstrated that the TaqMan Protein Assays can be used as a rapid and convenient alternative to direct measurement of functional viral titer by showing the levels of protein expression determined by PLA correlate with the formation of colonies that express pluripotent markers. These measurements also enable the determination the minimum level of protein expression required for iPSC generation in any given system.
During the reprogramming process, the majority of the colonies that initially form in the cultures will not ultimately become fully reprogrammed iPSC colonies. These colonies may express one or more of the pluripotent markers but differ in their ability to differentiate and maintain pluripotency [4], and are likely to be partially reprogrammed “pre-iPSC” or cells that have gone down alternative paths. A variety of methods are currently used to distinguish the small subset of “true” iPSCs from pre-iPSCs or non-iPSCs, including immunofluorescence staining with antibodies to pluripotency markers, alkaline phosphatase assays, DNA methylation analysis, and teratoma formation. These methods are time- and labor-intensive, and require expansion of large numbers of cells. Here, we describe the use of the TaqMan Protein Assays as a rapid tool to directly screen potential individual iPSC colonies for protein expression of the pluripotent markers, OCT4/POU5F1, SOX2, and LIN28, eliminating the need to perform large-scale expansion of cells that may not be fully reprogrammed. We also apply the assays to characterize different iPSC lines by measuring the relative levels of these pluripotency-associated proteins.
Materials and Methods
Comparison of gene and protein expression of SOX2 mRNA and protein by qPCR assays
To compare the sensitivity of RT-qPCR and TaqMan Protein Assays, a 2-fold dilution series of the SOX2-expressing human embryonal carcinoma cell line Ntera2 was spiked into the non-SOX2-expressing human B-cell lymphoma cell line Raji. The total cell concentration after mixing the 2 cell suspensions was held at a constant 1,000 cells per μL of PBS. The series began at 250 μL of 1,000 Ntera2 cells per μL spiked into 750 μL of 1,000 Raji cells per μL, ending with the 1,000 μL (1 mL) final volume. The series continued at 125, 62, 31, 16, 8, 4, 2, 1, and 0 Ntera2 cells per μL, with the corresponding Raji levels adjusted upward to reach the constant 1,000 cells per μL total in a 1 mL final volume. The cell mixture was split into 2 portions: 450 μL was processed to make purified total RNA and the other 450 μL was diluted 2-fold into 450 μL of 2×Protein Expression Sample Prep buffer (Applied Biosystems P/N 4405443). The Tempus™ Spin RNA Isolation kit (Applied Biosystems P/N 4380204) and DNase treatment (AbsoluteRNA Wash Solution; Applied Biosystems P/N 4305545) was used to purify the RNA and remove any contaminating gDNA according to manufacturer's instructions. The RNA was quantified with UV A260 values and 50 ng used for each one-step RT-qPCR (TaqMan one-step RT-PCR Master Mix Reagents kit Applied Biosystems P/N 4309169). The one-step RT-qPCRs were conducted using SOX2 TaqMan Gene Expression Assays (Applied Biosystems P/N Hs01053049_s1) and TaqMan beta-actin Detection Reagents as the endogenous control (Applied Biosystems P/N 401846). Relative gene expression levels were calculated by determining the ΔCqs between SOX2 and the beta-actin endogenous reference transcript. TaqMan Protein Assays for SOX2 were performed on 2 μL of the neat lysate, 1,000 cell equivalents per well (per Applied Biosystems protocol, P/N 4405495 and 4408591) [16]. Each qPCR assay was conducted in triplicate and average and standard deviation values were calculated. Protein expression levels were determined by calculating the ΔCq between the No Protein Control sample and the serial dilution cell mixture assay Cqs (Applied Biosystems ProteinAssist™ Software).
Virus preparation and infection
Construction of lentiviral vectors containing OCT4/POU5F1, SOX2, KLF4, and MYC under the control of the tetracycline operator and minimal CMV promoter were generated by LR reactions via Gateway Recombination Technology into the pLenti6.3/V5 DEST CMV TetO vector (Life Technologies). The resulting vectors were analyzed by restriction digestion with NcoI enzyme and fully sequenced. These constructs were used to generate replication incompetent lentiviral particles by packaging in 293FT cells using Life Technologies' ViraPower Lentiviral Expression Systems. Viral supernatants were filtered through a 0.45 μM filter before being applied to cells for 2 rounds and replaced with iPSC medium after 48 h post-transduction. Retroviral supernatants containing OCT4/POU5F1, SOX2, KLF4, and MYC were gifts from The Loring's lab at The Scripps Research Institute. Neonatal human dermal fibroblasts were obtained from Life Technologies Cat#C-004-5C and fetal human dermal fibroblasts were purchased from ScienCell (Cat# 2300) and maintained as recommended by the manufacturers.
On day 4 after viral transduction, cells were harvested and 50,000 cells/per well were plated onto 24-well-Geltrex-coated plate for protein assays (Life Technologies). Every other day, cells were harvested from each well and subjected to TaqMan protein assays and TaqMan gene expression assays. In addition, 100,000 cells were transferred to mitotically inactivated MEFs and cultured in DMEM/F12 (Life Technologies #10565–018) and KSR (Life Technologies #10828–028) medium with 1 mM VPA (Sigma) and 4 ng/mL bFGF (Life Technologies) for generation of iPSC colonies. Between day 25 and 30 post-transduction, the number of colonies was manually counted under a microscope and recorded. Colonies were selected based on live staining results with SSEA4 or Tra-1–60 before expansion.
Random differentiation of iPSCs
Undifferentiated iPSCs were harvested using collagenase to generate embryoid bodies (EBs) and were cultured for 4 days in suspension in differentiation medium containing DMEM-F12 with GlutaMAX, 20% Knockout Serum Replacement, 1% nonessential amino acid, and 55 μM 2-mercaptoethanol (Life Technologies). On day 5, EBs were seeded on Geltrex-coated plates for an additional 17 days of differentiation in the same medium, and then the cells were used for immunocytochemistry. Differentiation into various lineages, and induction toward endodermal and mesodermal progeny were performed as described [17].
Immunofluorescence staining
Cells were fixed in 4% paraformaldehyde for 20 min at 25°C, washed 3 times with PBS, and blocked for 15 min with 5% FBS in PBS containing 0.1% Triton-X. Primary antibodies used were ms-SSEA4 (Life Technologies Cat#41–4000), Ms anti-TRA-1–60 (Life Technologies #41–1000), Ms anti-TRA-1–81 (Life Technologies #41–1100), human OCT4/POU5F1 (1:500; Abcam), ms-SSEA4 (1:500; Life Technologies), human NANOG (R&D Systems), and human SOX2 (R&D Systems). Overnight at 4°C in 1%FBS containing 0.1% Triton-X, cells were washed 3 times with PBS and incubated with fluorophore-labeled appropriate secondary antibodies. The following secondary antibodies were used: Alexa Fluor 594- or 488-conjugated anti-mouse IgG (1:1,000), Alexa 594- or 488-conjugated anti-rabbit IgG, (1:1,000), Alexa Fluor-conjugated donkey anti-goat IgG, and allophycocyanin (1:1,000, all from Life Technologies). For live staining, cells were washed 1×with DMEM/F-12 and incubated with primary antibody for 60 min at 37°C. Cells were washed 3×with DMEM/F12 and incubated with secondary antibody in DMEM/F-12 for 60 min at 37°C. Images were captured using a Zeiss Axiovision microscope and processed using AdobePhotoshop CS.
TaqMan protein assays and reagents
All TaqMan Protein Assays and associated reagents kits were obtained from Life Technologies. Cells were harvested and counted, and 50K cells were incubated in 100 μL of re-suspension and 100 μL of lysis buffer. TaqMan Protein Assays were carried out with cell lysate dilutions of 500 or 250 cells per reaction using Applied Biosystems StepOnePlus™ real-time PCR system. In parallel, the same cell inputs were also subjected to 18S genomic ribosomal DNA assays to obtain endogenous control Cq. The 18S Cq value normalizes for any variations in cell counting. The ΔCq between the 18S gDNA reference and the protein for each sample was calculated. The day 0 cell sample was used as the calibrator protein expression control for each experiment. To determine the fold difference using the ΔΔCq method, the slope of each protein target assay was obtained by performing TaqMan Protein Assays with diluted lysates [16]. TaqMan protein assays efficiency is calculated based on the equation 10 (−1/slope) – 1. The 18S gDNA reference assay efficiency is 1.0 (100%). Fold differences between the different samples was determined with the following equation: fold difference=[(1 + protein assay efficiency)ΔΔCq].
TaqMan gene expression assays and reagents
The TaqMan Cells-to-Ct Kit and TaqMan probes were purchased from Life Technologies. Gene expression assays were performed according to the manufacturer's protocols. Each RT-qPCR used ∼5,000 cell equivalence of RNA and Cqs are normalized to 18S ribosomal RNA. All reactions were performed in triplicates.
Results and Discussion
Comparison of qPCR assay sensitivities for SOX2 mRNA and protein expression
A dilution series of SOX2-expressing NTera2 (pluripotent teratocarcinoma) cells were spiked into SOX2 nonexpressing Raji cells (EBV-transformed lymphocytes). This cell mixture was split into 2 samples, one for preparing purified total RNA and the other for TaqMan protein lysates for comparative analysis. TaqMan Gene Expression Assays were conducted on 50 ng of total RNA converted to cDNA and TaqMan Protein Assays were performed on 1,000 cell equivalents of protein lysates. Using an estimate of 20 pg of total RNA per each Raji and NTera2 cell, 50 ng corresponds to 2,500 cell equivalents. Results show that the detection limit by RT-qPCR was ∼10 NTera2 spiked cells per 1,000 total cells (Fig. 2A), whereas the TaqMan Protein Assays could detect ∼8–16 spiked cells per 1,000 total cells (Fig. 2B). Our results showed that the TaqMan Protein and Gene Expression Assays had similar sensitivities for SOX2.
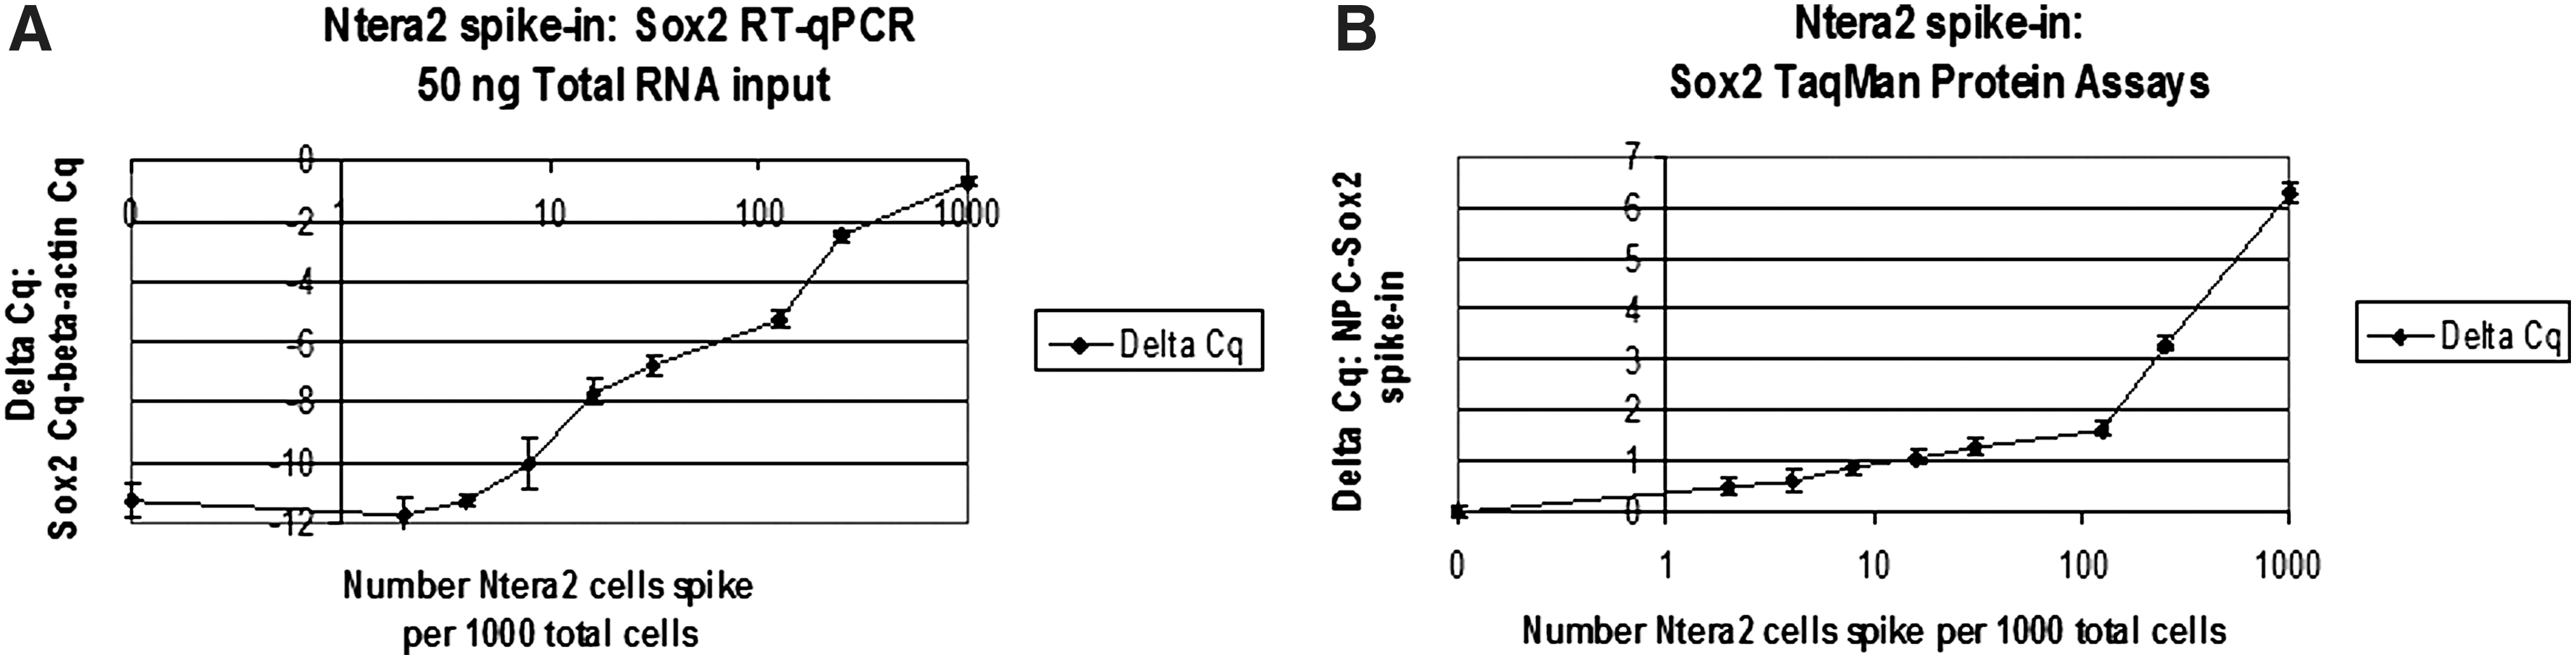
Comparison of qPCR assay sensitivities for SOX2 mRNA and protein expression. A dilution series of the SOX2-expressing human embryonal carcinoma cell line Ntera2 was spiked into non-SOX2-expressing human B-cell lymphoma cell line Raji. The total cell concentration was held at a constant 1,000 cells per μL in PBS. The series began at 250 Ntera2 cells per μL spiked into 750 Raji cells per μL. The series continued at 125, 62, 31, 16, 8, 4, 2, 1 and 0 Ntera2 cells per μL, whereas the corresponding Raji levels were adjusted for a total and constant 1,000 cells per μL total. The cell suspension was divided into 2 tubes, one used for RNA purification and DNase treatment, and the other for generating a whole cell protein lysate. One step RT-qPCRs for SOX2 and the endogenous reference beta-actin were performed
Monitoring levels of OCT4/POU5F1, SOX2, and KLF4 protein and mRNA expression after transduction with retrovirus and lentivirus on human dermal fibroblasts
To determine the kinetics and expression of reprogramming factors during reprogramming, human dermal fibroblasts were transduced with retrovirus or lentivirus constructs carrying 4 transcription factors, OCT4/POU5F1, SOX2, KLF4, and MYC. On day 4 post-transduction, 50,000 transduced cells were transferred onto a 24-well feeder-free culture plate and 100,000 onto inactivated MEFs (mouse embryonic fibroblasts) for iPSC generation. Every other day, 500 cells from the 24-well plate were interrogated with TaqMan Protein Assays to determine the levels of OCT4/POU5F1, SOX2, and KLF4 protein expression. The MYC protein assay was unavailable for this study. Results show that OCT4/POU5F1 protein expression was persistent and could still be detected at day 18 post-transduction. SOX2 protein expression was highest on day 4 to 6 and gradually diminished by day 18, whereas KLF4 expression was detectable on day 4 to 6 and undetectable thereafter (Fig. 3A, C). Further, the pattern of relative expression for all 3 proteins was similar in both retrovirus and lentivirus transduction experiments.
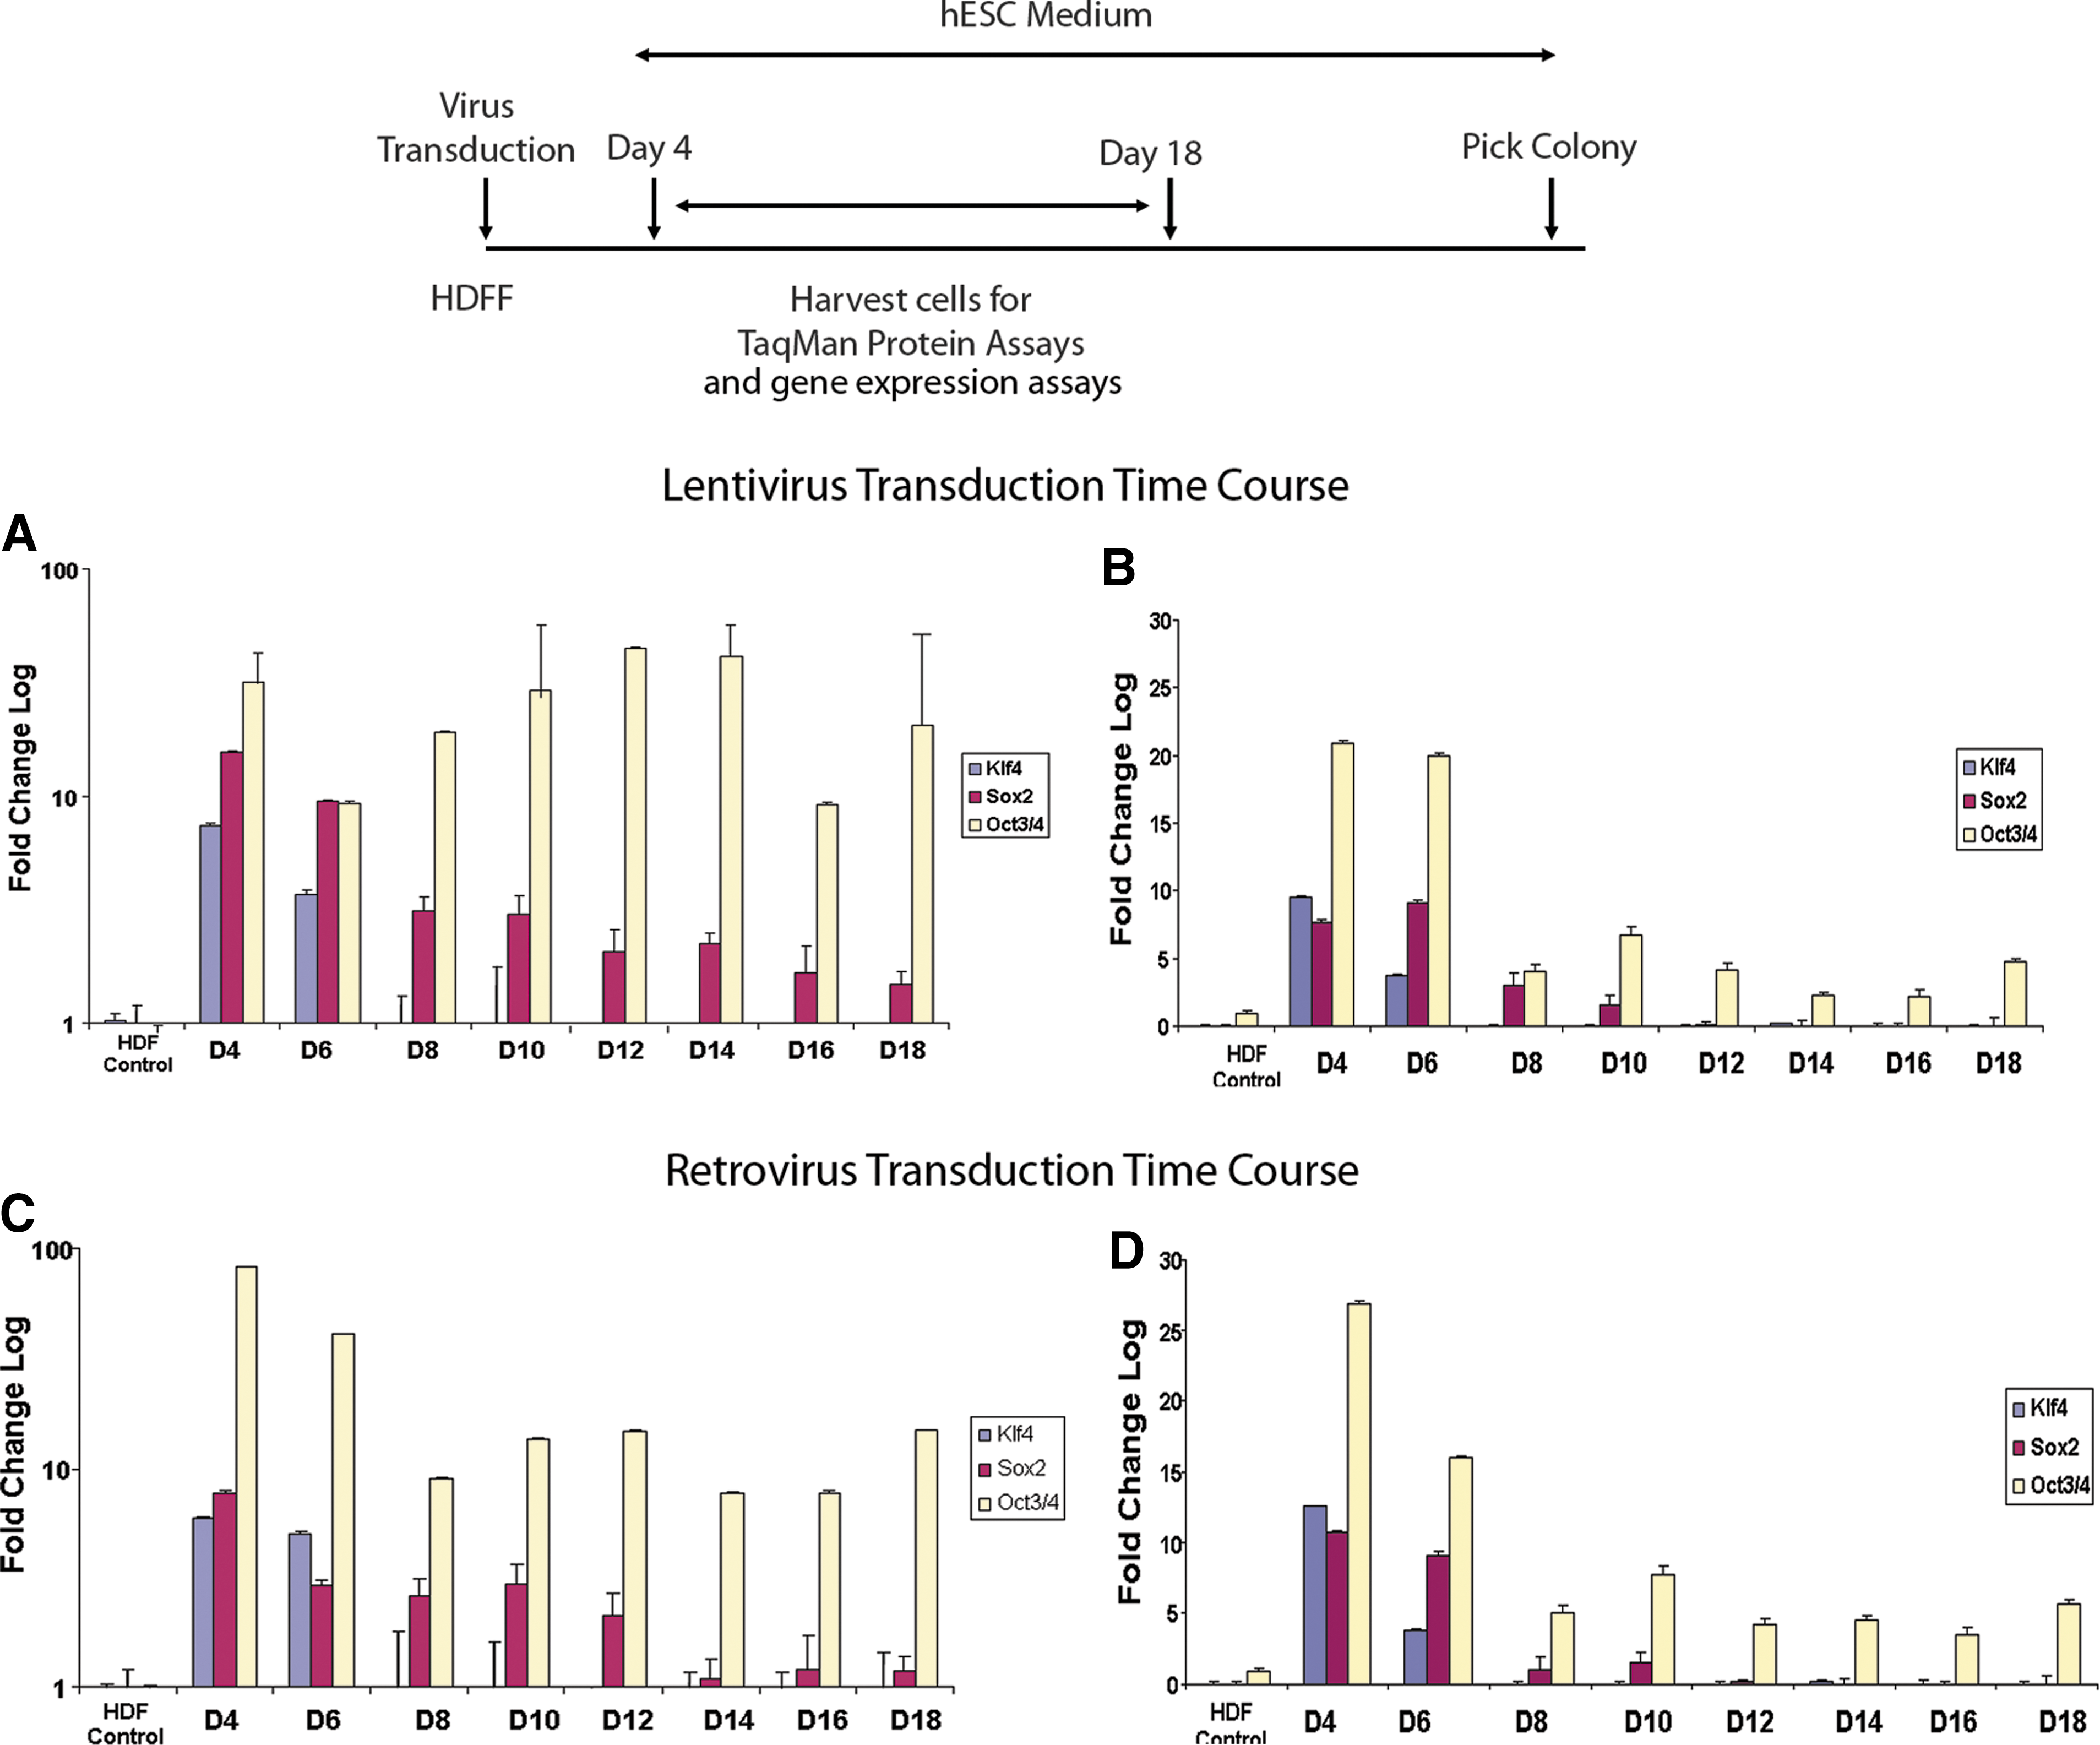
Kinetics and levels of KLF4, SOX2, and OCT4/POU5F1 protein and mRNA expression in human dermal fibroblast-fetal transduced with lentivirus and retrovirus. At day 4 post-transduction, cells were harvested and transferred to iMEFs (irradiated mouse embryonic fibroblasts) and feeder-free conditions. Every other day, cells on feeder-free plates were harvested for protein and gene expression assays.
For the mRNA levels, ∼5,000 cells from the same lysates used in the protein assays were processed using the TaqMan Gene Expression Assays workflow. Results show that although mRNA levels for all 3 factors could be readily detected on days 4 and 6, KLF4 was undetectable by day 8 and SOX2 by day 12, whereas OCT4/POU5F1 message level could be detected at low levels until day 18 (Fig. 3B, D). The pattern of mRNA expression for all 3 genes was similar for both retroviral and lentiviral transductions.
Our results demonstrated that during reprogramming, OCT4/POU5F1 and SOX2 (low level) protein expression was persistent, in particular OCT4/POU5F1 lasting to at least day 18. On the other hand, KLF4 expression was undetectable by day 8. Differences in the level of fold change between OCT4/POU5F1, SOX2, and KLF4 may be due to differences in binding affinity of each set of antibodies, and the fold change is normalized to un-transduced HDF. Nevertheless, while we observed SOX2 and KLF4 protein and message levels reflect one another, OCT4/POU5F1 mRNA was quite low during the course of reprogramming; yet, high protein expression persisted through day 18. While regulation of SOX2 is not well characterized, OCT4/POU5F1 stability has been shown to be regulated via post-translational modifications, including phosphorylation and ubiquitination [18]. Phosphorylation of OCT4/POU5F1 affects homodimer or heterodimer complex formation [18], which may influence the stability of OCT4/POU5F1 and protein turnover [19]. In addition, reports show that turnover of OCT4/POU5F1 is a dynamic process, with new protein constantly being generated to replenish the older pools as they are degraded [18]. Results from the TaqMan Protein Assays demonstrate the lack of correlation between OCT4/POU5F1 protein expression and message level, and warrant further investigation into its regulation. In addition, these results indicate that persistent OCT4/POU5F1 protein expression is critical for iPSC generation. We have tested other methods for delivery of reprogramming factors and found that if protein expression diminished after 4–5 days, we could not detect any colony formation (data not shown). Although our data were generated from mixed populations of cells rather than single cells, our results were consistent with a correlation between persistent expression of the OCT4/POU5F1 and SOX2 proteins in the bulk population of transduced cells and reprogramming success.
Alternative method to determine levels of transcription factors necessary to reprogram cells
Reprogramming is a highly inefficient process that requires high titers of virus to deliver sufficient levels of pluripotency transcription factors into a large population of somatic cells to obtain a small number of iPSC colonies. We have found that viral titer as determined by nucleic acid qPCR quantification often does not correlate with functional titers, such as those measured by viral plaque assays (data not shown). We used the TaqMan Protein Assays to directly measure the levels of protein expression for OCT4/POU5F1, SOX2, and KLF4 delivered by retroviral or lentiviral vectors, and correlated the protein levels with the efficiencies of iPSC generation. Six different lots of lentiviral particles were made on different days, transduced onto human dermal fibroblasts, and subjected to TaqMan Protein Assays at day 4 post-transduction. Results showed that the first 3 lots of virus lots (#1–3) had substantially higher OCT4/POU5F1, SOX2, and KLF4 protein expression compared to the last 3 lots of virus (#4–6) (Fig. 4). When we counted the total number of colonies generated from the different lots of virus, the total numbers of colonies were very similar (Table 1). On the other hand, the number of colonies that stained positive for Tra-1–60, representing fully-reprogrammed colonies, was highly correlated with protein levels of the 3 transcription factors (Table 1 and Fig. 4). Confirmation that Tra-1–60 staining corresponded to a fully reprogrammed state was demonstrated by expanding Tra-1–60-positive colonies and showing that they also stained positive for Tra-1–60+ (Fig. 5B), NANOG (Fig. 5C), SOX2 (Fig. 5D), OCT4/POU5F1 (Fig. 5E), and alkaline phosphatase (Fig. 5F). Cells from these colonies were also capable of differentiating in vitro into EBs containing cells from all 3 embryonic germ layers. Differentiated cells were stained for endoderm marker α fetoprotein (Fig. 5G), mesodermal marker smooth muscle actin (Fig. 5H), and ectoderm marker beta 3-tubulin (Fig. 5I). We observe that the protein levels of OCT4/POU5F1 and SOX2 required for successful reprogramming are similar to the protein levels observed in WA09 line.
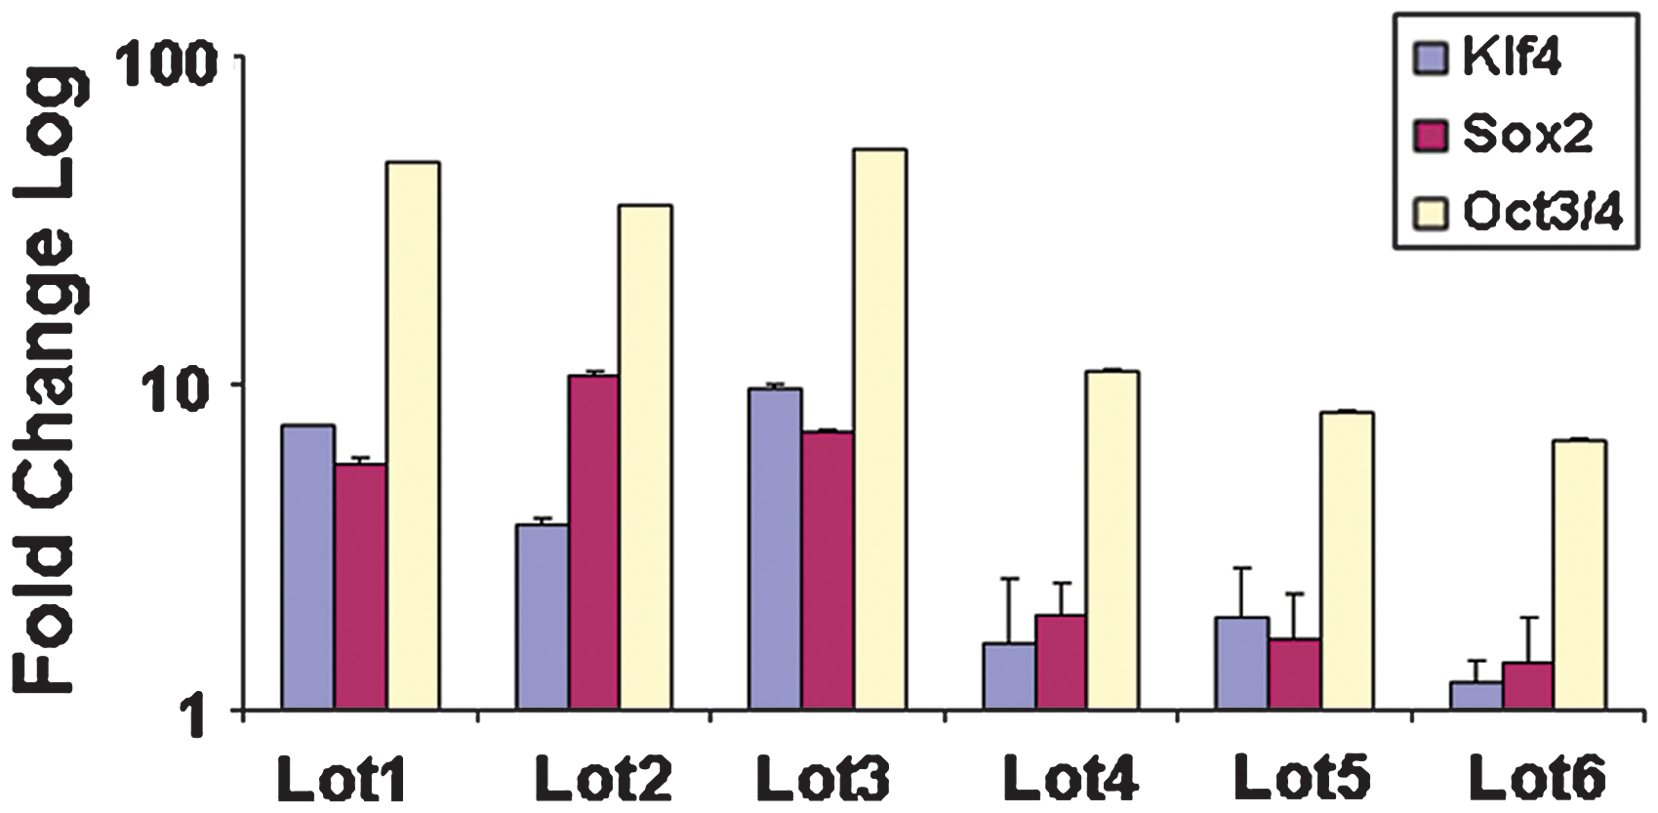
Comparison of different lentivirus production runs with levels of protein expression of KLF4, OCT4/POU5F1, and SOX2 by TaqMan Protein Assays. Each reaction used 500 cells for input. Samples are normalized against the endogenous reference 18S ribosomal genomic DNA and plotted (log10 scale) relative fold change to the expression level of un-transduced human dermal fibroblasts.

Characterization and differentiation of Tra1-60+ colonies. Phase:
Comparison of different viral production runs with total number of colony formation and Tra1-60+ colonies.
OCT4/POU5F1, SOX2, and KLF4 lentivirus were generated on different production runs. Six different viral lots were subjected to reprogramming and the total number of colonies per 10,000 cell plated and Tra1-60+ were scored per 100,000 cells.
We observed that transduction with only 2 factors, OCT4/POU5F1 and MYC, was not sufficient for reprogramming, but still resulted in formation of transformed-appearing colonies (data not shown). These results suggest that there are threshold levels of the reprogramming factors that are required for efficient reprogramming, and that if the levels of the reprogramming factors are below these thresholds, transformed-appearing colonies can still form, but do not become fully reprogrammed. Thus, we conclude that the TaqMan Protein Assays can be used as a rapid test during reprogramming experiments to determine if the minimum levels of protein expression necessary to generate iPSC colonies are present at 4 days post-transduction.
Comparison of expression of pluripotency markers in different iPSC lines by TaqMan protein assays
When different iPSC lines (Fig. 6E, I) were compared to the WA09 human embryonic stem cell line (Fig. 6A) by immunofluorescence staining with OCT4/POU5F1 {(Fig. 6B (WA09), 6F (iPSC line B), and 6J (iPSC line C)}, SOX2 {(Fig. 6C (WA09), 6G (iPSC line B), 6K (iPSC line C)}, and NANOG {(Fig. 6D (WA09), 6H (iPSC line B), 6L (iPSC line C)}, they all showed similar staining patterns. However, it has been shown that different iPSC lines differ in their abilities to differentiate and, for mouse iPSCs, undergo germline transmission [4,5,20]. When we used the TaqMan Protein Assays, the results shown on Fig. 7A demonstrated that the iPSC lines (line B and line C as shown on Fig. 6) and human embryonic stem cell line (WA09-H9ESC) had different levels of OCT4/POU5F1, SOX2, and LIN28, whereas gene expression profiles show minimal differences in Fig. 7B. We are currently investigating potential differences in proliferation, differentiation, and teratoma formation in these lines.
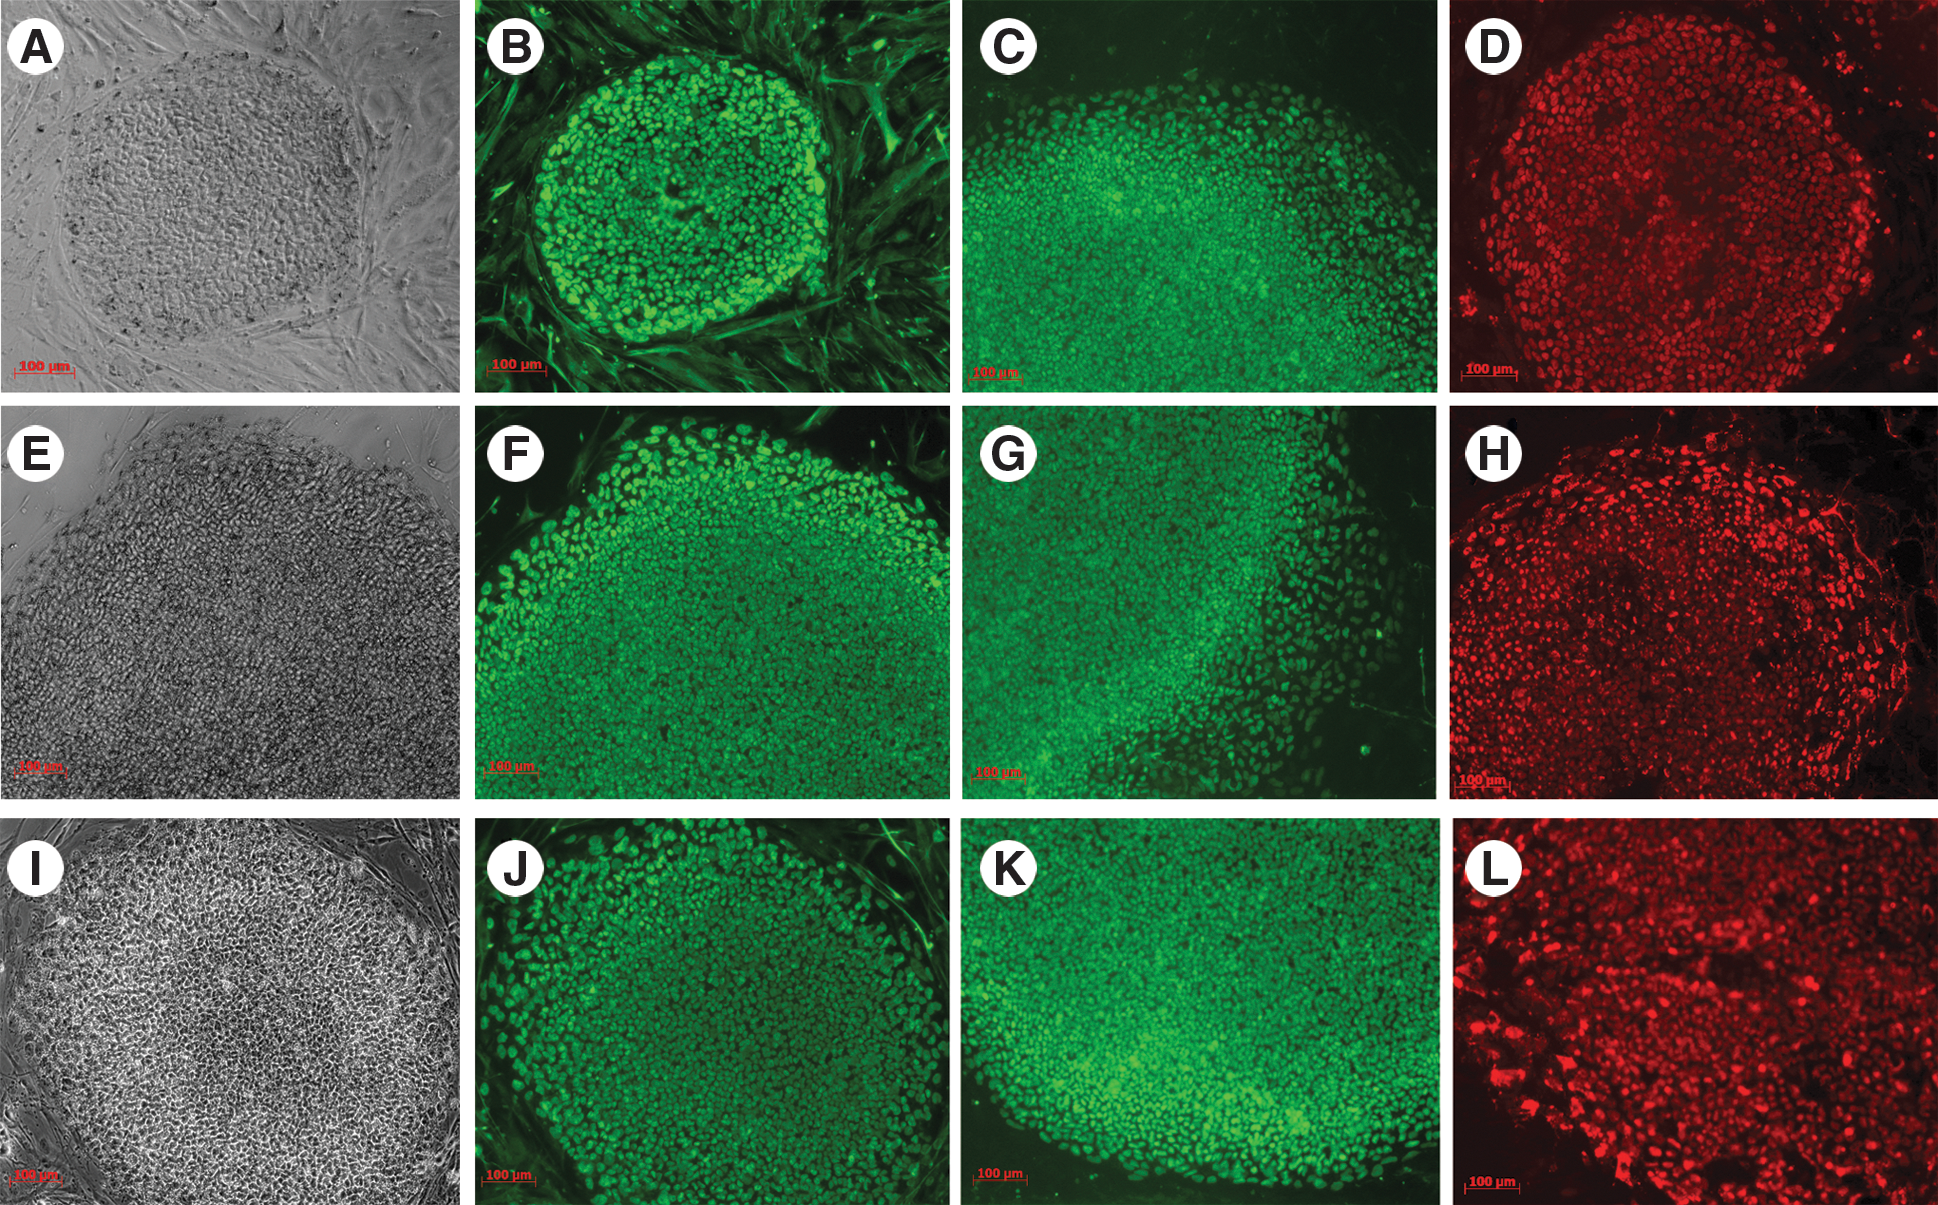
Pluripotent marker staining pattern of WA09 ESC and different iPSC lines. Phase:

Comparison of levels of pluripotent markers in WA09 ESC and 3 different iPSC lines (lines B and C are the same line on Fig. 6) by TaqMan Protein Assays. Results
TaqMan protein assays to identify non-iPSC vs. iPSC colonies
It has been suggested that reprogramming yields colonies with different phenotypic characteristics, with one “true” iPSC phenotype and other alternative phenotypes representing reprogramming intermediates [4,5,20 –22]. Reports have shown that early cells that express SSEA4+ sometimes do not reach a fully reprogrammed state, but instead senesce, die or remain partially reprogrammed [21,22]. We applied TaqMan Protein Assays to screen colonies early in the reprogramming process for expression of specific pluripotency markers, to identify expression patterns that correlated with a high likelihood of becoming fully reprogrammed. We performed live staining with SSEA4+ antibody and picked several colonies that were positive for SSEA4+ (Fig. 8B [iPSC line E], 8F [iPSC line F]). However, when we picked and expanded these colonies, some (represented by iPSC line F) failed to express other pluripotency markers—NANOG, 8G (iPSC line F); SOX2, 8H (iPSC line F)—and could not be expanded for more than a few passages. When we analyzed some of these colonies by TaqMan Protein Assays for OCT4/POU5F1, SOX2, and LIN28 expression, we saw that they (lines F, I, and J) did not express any of these markers (Fig. 9). This indicates that TaqMan Protein assays enable measurement of multiple markers from portions of single colonies, enabling screening of potentially reprogrammed colonies at an early stage of reprogramming, which would save time and labor compared to later-stage screening.
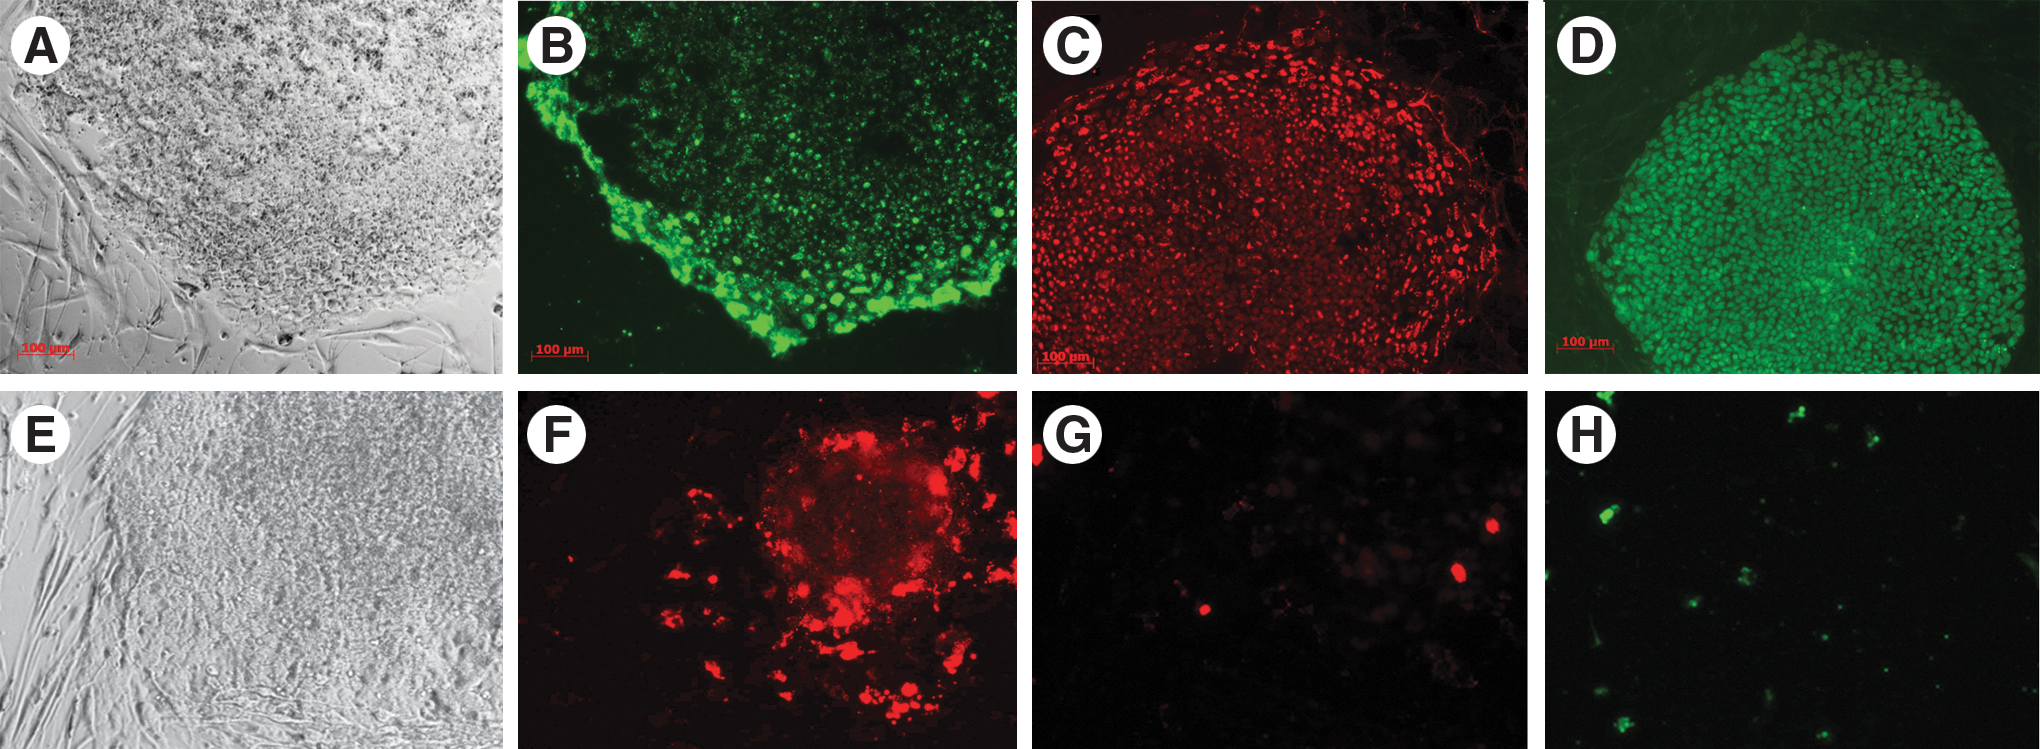
Immunofluorescence staining of potential iPSC (iPSC line E) and non-iPSC (iPSC line F) colonies. Phase:
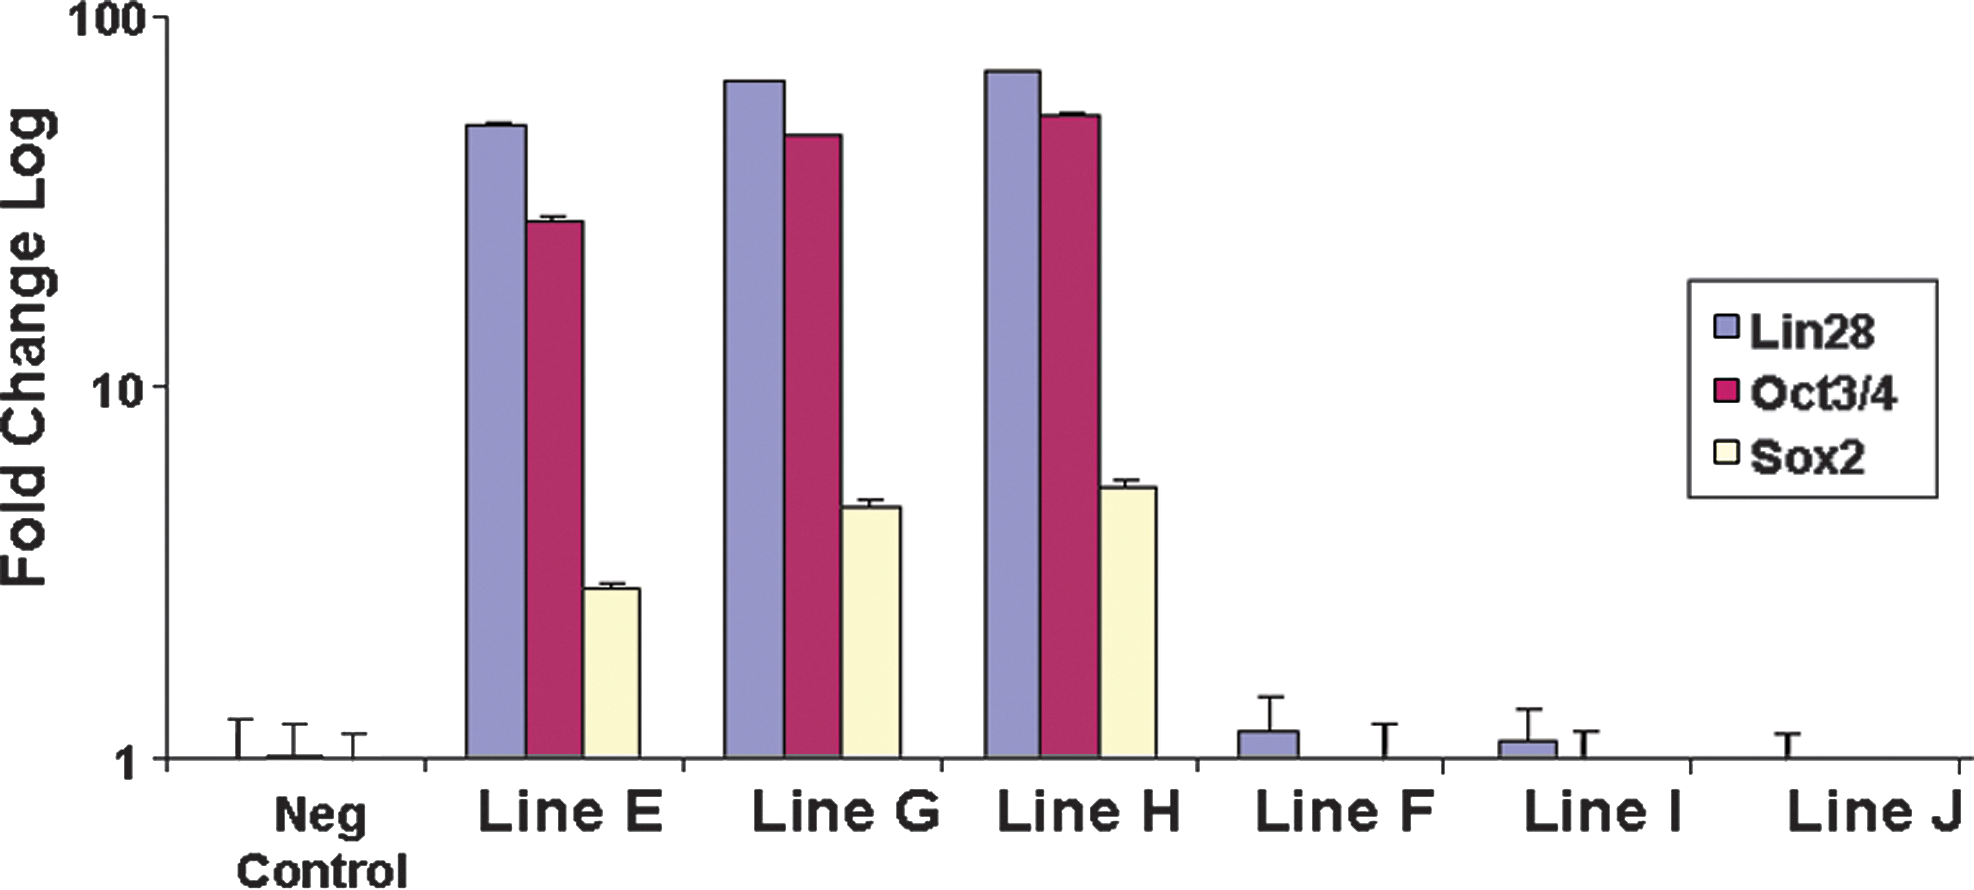
TaqMan Protein Assays to screen for potential iPSC (lines E, G, and H) versus Non-iPSC (lines F, I, and J) colonies. All 6 lines stained positive for SSEA4+ and were then subjected to Taqman Protein Assays for OCT4/POU5F1, SOX2, and LIN28. Samples are normalized against the endogenous reference 18S ribosomal genomic DNA and plotted (log10 scale) relative fold change to the expression level of un-transduced human dermal fibroblasts.
In summary, although only a handful of transcription factors are required to reprogram cells, reprogramming is a complex process and the mechanism is not well defined. One limitation is the lack of sensitive assays to correlate the intracellular levels of these transcription factors to successful reprogramming. We have demonstrated several applications of real-time PCR protein assays, for determining the kinetics and levels of transcription factor proteins during the reprogramming time course, for characterizing individual iPSC lines, for determining the protein levels required for generation of iPSCs, and for screening for potential iPSC colonies early in the reprogramming process. At present, our assays are not designed to distinguish between the level of endogenous and exogenous protein expression, and thus, we cannot determine when the exogenous protein expression is shutdown or when the endogenous protein level comes up. Results shown here represent the combined expression of these proteins during reprogramming. Nevertheless, the real-time protein assay is rapid and sensitive, requires few cells, provides relative quantitative data, and is less labor intensive than conventional methods for determining protein levels.
Footnotes
Acknowledgments
This work was supported by Life Technologies Corporation. We thank Dr. Jeanne Loring and Dr. Ying Liu for critical reading of the article. Ha Tran is supported by CIRM TR-01250.
Author Disclosure Statement
No competing financial interests exist.