
Abstract
Embryonic stem cells (ESCs) maintain their pluripotency through high expression of pluripotency-related genes. Here, we show that differing levels of Oct4, Nanog, and c-myc proteins among the individual cells of mouse ESC (mESC) colonies and fluctuations in these levels do not disturb mESC pluripotency. Cells with strong expression of Oct4 had low levels of Nanog and c-myc proteins and vice versa. In addition, cells with high levels of Nanog tended to occupy interior regions of mESC colonies. In contrast, peripherally positioned cells within colonies had dense H3K27-trimethylation, especially at the nuclear periphery. We also observed distinct levels of endogenous and exogenous Oct4 in particular cell cycle phases. The highest levels of Oct4 occurred in G2 phase, which correlated with the pKi-67 nuclear pattern. Moreover, the Oct4 protein resided on mitotic chromosomes. We suggest that there must be an endogenous mechanism that prevents the induction of spontaneous differentiation, despite fluctuations in protein levels within an mESC colony. Based on the results presented here, it is likely that cells within a colony support each other in the maintenance of pluripotency.
Introduction
R
In the context of regenerative medicine, there is an immense potential for the so-called induced pluripotent stem cells (iPSCs) [7 –10]. iPSCs can be artificially derived from nonpluripotent terminally differentiated somatic cells through the engineered expression of pluripotency genes. Viruses engineered to introduce expression for 4 pluripotency genes (Oct4, Sox2, Klf4, and c-myc) have been implemented in cultured fibroblasts collected from adult individuals [11]. More recent attempts have avoided lentiviruses, relying instead on specific minicircle technology for genome reprogramming of nonpluripotent cells, which leads to the induction of iPSCs [12]. Use of iPSCs avoids the ethical problems related to hESC isolation from human embryos.
Many studies have also been directed toward ESC differentiation into specific cell types and the corresponding changes in genome-wide expression patterns have been mapped [13]. Similar to ESCs, dedifferentiated iPSCs can be induced back into various differentiation pathways. The opposing processes of iPSC induction and hESC differentiation are both accompanied by changes in gene expression and histone signature. For example, Efroni et al. [13] showed distinct transcription levels in pluripotent and differentiated mESCs. This corresponds well with the higher levels of H3K9 acetylation observed in pluripotent hESCs compared with retinoic acid [all-trans retinoic acid (ATRA)]-differentiated hESCs [14]. Other post-translational modification of histones, such as H3K14ac, H3K4me3, H3K36me2, and H3K36me3, are significantly higher in pluripotent ESCs compared with more differentiated phenotypes (summarized in [15,16]).
As both transcription factors and the histone signature are considered to be epigenetic markers that regulate gene expression, we analyzed the distribution of transcription factors Oct4, Nanog, c-myc, and selected histone markers in individual cells of mESC colonies. We also determined whether the observed nonhomogeneous distribution of Oct4 protein within mESC colonies is associated with a particular cell cycle phase or whether it reflects the fact that, even in a colony of highly pluripotent stem cells, there are some spontaneously differentiated cells. These experiments provide a more complex view of the epigenetics of mESC colonies.
Materials and Methods
ESC cultivation and differentiation
mESC GOWT1 line (a generous gift from Hitoshi Niwa, Laboratory for Pluripotent Stem Cell Studies, RIKEN Center for Developmental Biology, Japan) and R1 (wild-type) mESC line [17] were cultivated in standard mESC medium (Glasgow modified minimum essential medium; GMEM)+5% fetal calf serum with leukemia inhibitory factor. For supplementary analysis, we used D3 mESC line. Cells were maintained at 37°C in a humidified atmosphere containing 5% CO2.
To induce differentiation, mESC colonies were treated with 2 μM ATRA (Sigma-Aldrich). After 2 days of cultivation at 37°C in a humidified atmosphere containing 5% CO2, the cells were fixed with 4% formaldehyde before further analysis.
Flow cytometric analyses and cell sorting
GOWT-1 cells were stained with 0.01 mg/mL Hoechst 33342 (stock solution 1 mg/mL) for 20 min at 37°C. Cell-cycle profile, GFP-Oct4 level, and cell sorting were determined using a fluorescence-activated cell sorting (FACS) Aria II flow cytometer (Becton Dickinson) equipped with an UV and argon lasers. Diva software was used for data acquisition and analysis.
Living cell observation and FRAP
These experiments were performed on a Leica TSC SP-5X confocal microscope equipped with a white light laser (470–670 nm in 1 nm increments), argon laser (488 nm), and UV lasers (405 and 355 nm). We used a magnification of 64×/NA=1.4. The cells were placed in a cultivation hood (EMBL) heated to 37°C. In addition, we used a specific “air stream” incubator to obtain 5% CO2 for optimal cell cultivation. For long-term live cell imaging, we used the “specific job's” software mode in LEICA LAS AF, version 2.1.2. Analysis of fluorescence intensity was performed in selected regions of interest using the LEICA LAS AF analysis tool. Fluorescence recovery after photobleaching (FRAP) was performed following the technique used by Bártová et al. [18].
Immunostaining of the interphase nuclei
After cell fixation, the interphase nuclei were permeabilized with 0.1% Triton X-100 for 12 min and with 0.1% saponin (Sigma) and then washed twice in phosphate-buffered saline (PBS) for 15 min. Incubation followed for 1 h at room temperature in 1% bovine serum albumin (BSA) dissolved in PBS. The slides were washed for 15 min in PBS, and preparations were incubated with mouse monoclonal antibodies against Oct4 (C10; No. sc-5279; Santa Cruz Biotechnology), rabbit polyclonal antibody against Nanog (ab80892; Abcam), antibody against c-myc (N-262; No. sc-764; Santa Cruz Biotechnology), anti-HP1α (clone 15.19s2; No. 05-689; Upstate), anti-HP1β (No. 07-333; Upstate), anti-H3K9me3 (No. 07-442; Upstate), or anti-H3K27me3 (No. 07-449; Upstate). Each antibody was diluted 1:100 in 1% BSA dissolved in PBS, followed by overnight incubation at 4°C. The cells were washed twice in PBS for 5 min and incubated for 1 h with appropriate antibody: anti-rabbit IgG-FITC (No. F0511; Sigma) or goat anti-mouse IgG3-Alexa Fluor 594 (Molecular Probes). Secondary antibodies were diluted 1:200 in 1% BSA dissolved in PBS. Immunostained preparations were washed 3 times in PBS for 5 min and TO-PRO(R)-3 iodide (0.04 μg/mL; Molecular Probes) or 4',6-diamidine-2'-phenylindole (0.02 μg/mL) was used as a counterstain. Protein pKi-67 was visualized using an antibody purchased from DakoCytomation (No. M7240), as described by Harničarová et al. [19].
Image acquisition
The image acquisition of fluorescently labeled interphase nuclei was performed using a laser scanning system (QLC 100; VisiTech International) connected to a Leica DMRXA epi-fluorescence microscope (Leica), as described elsewhere [19].
Results
Levels of Oct4 within mESC colonies are cell cycle dependent
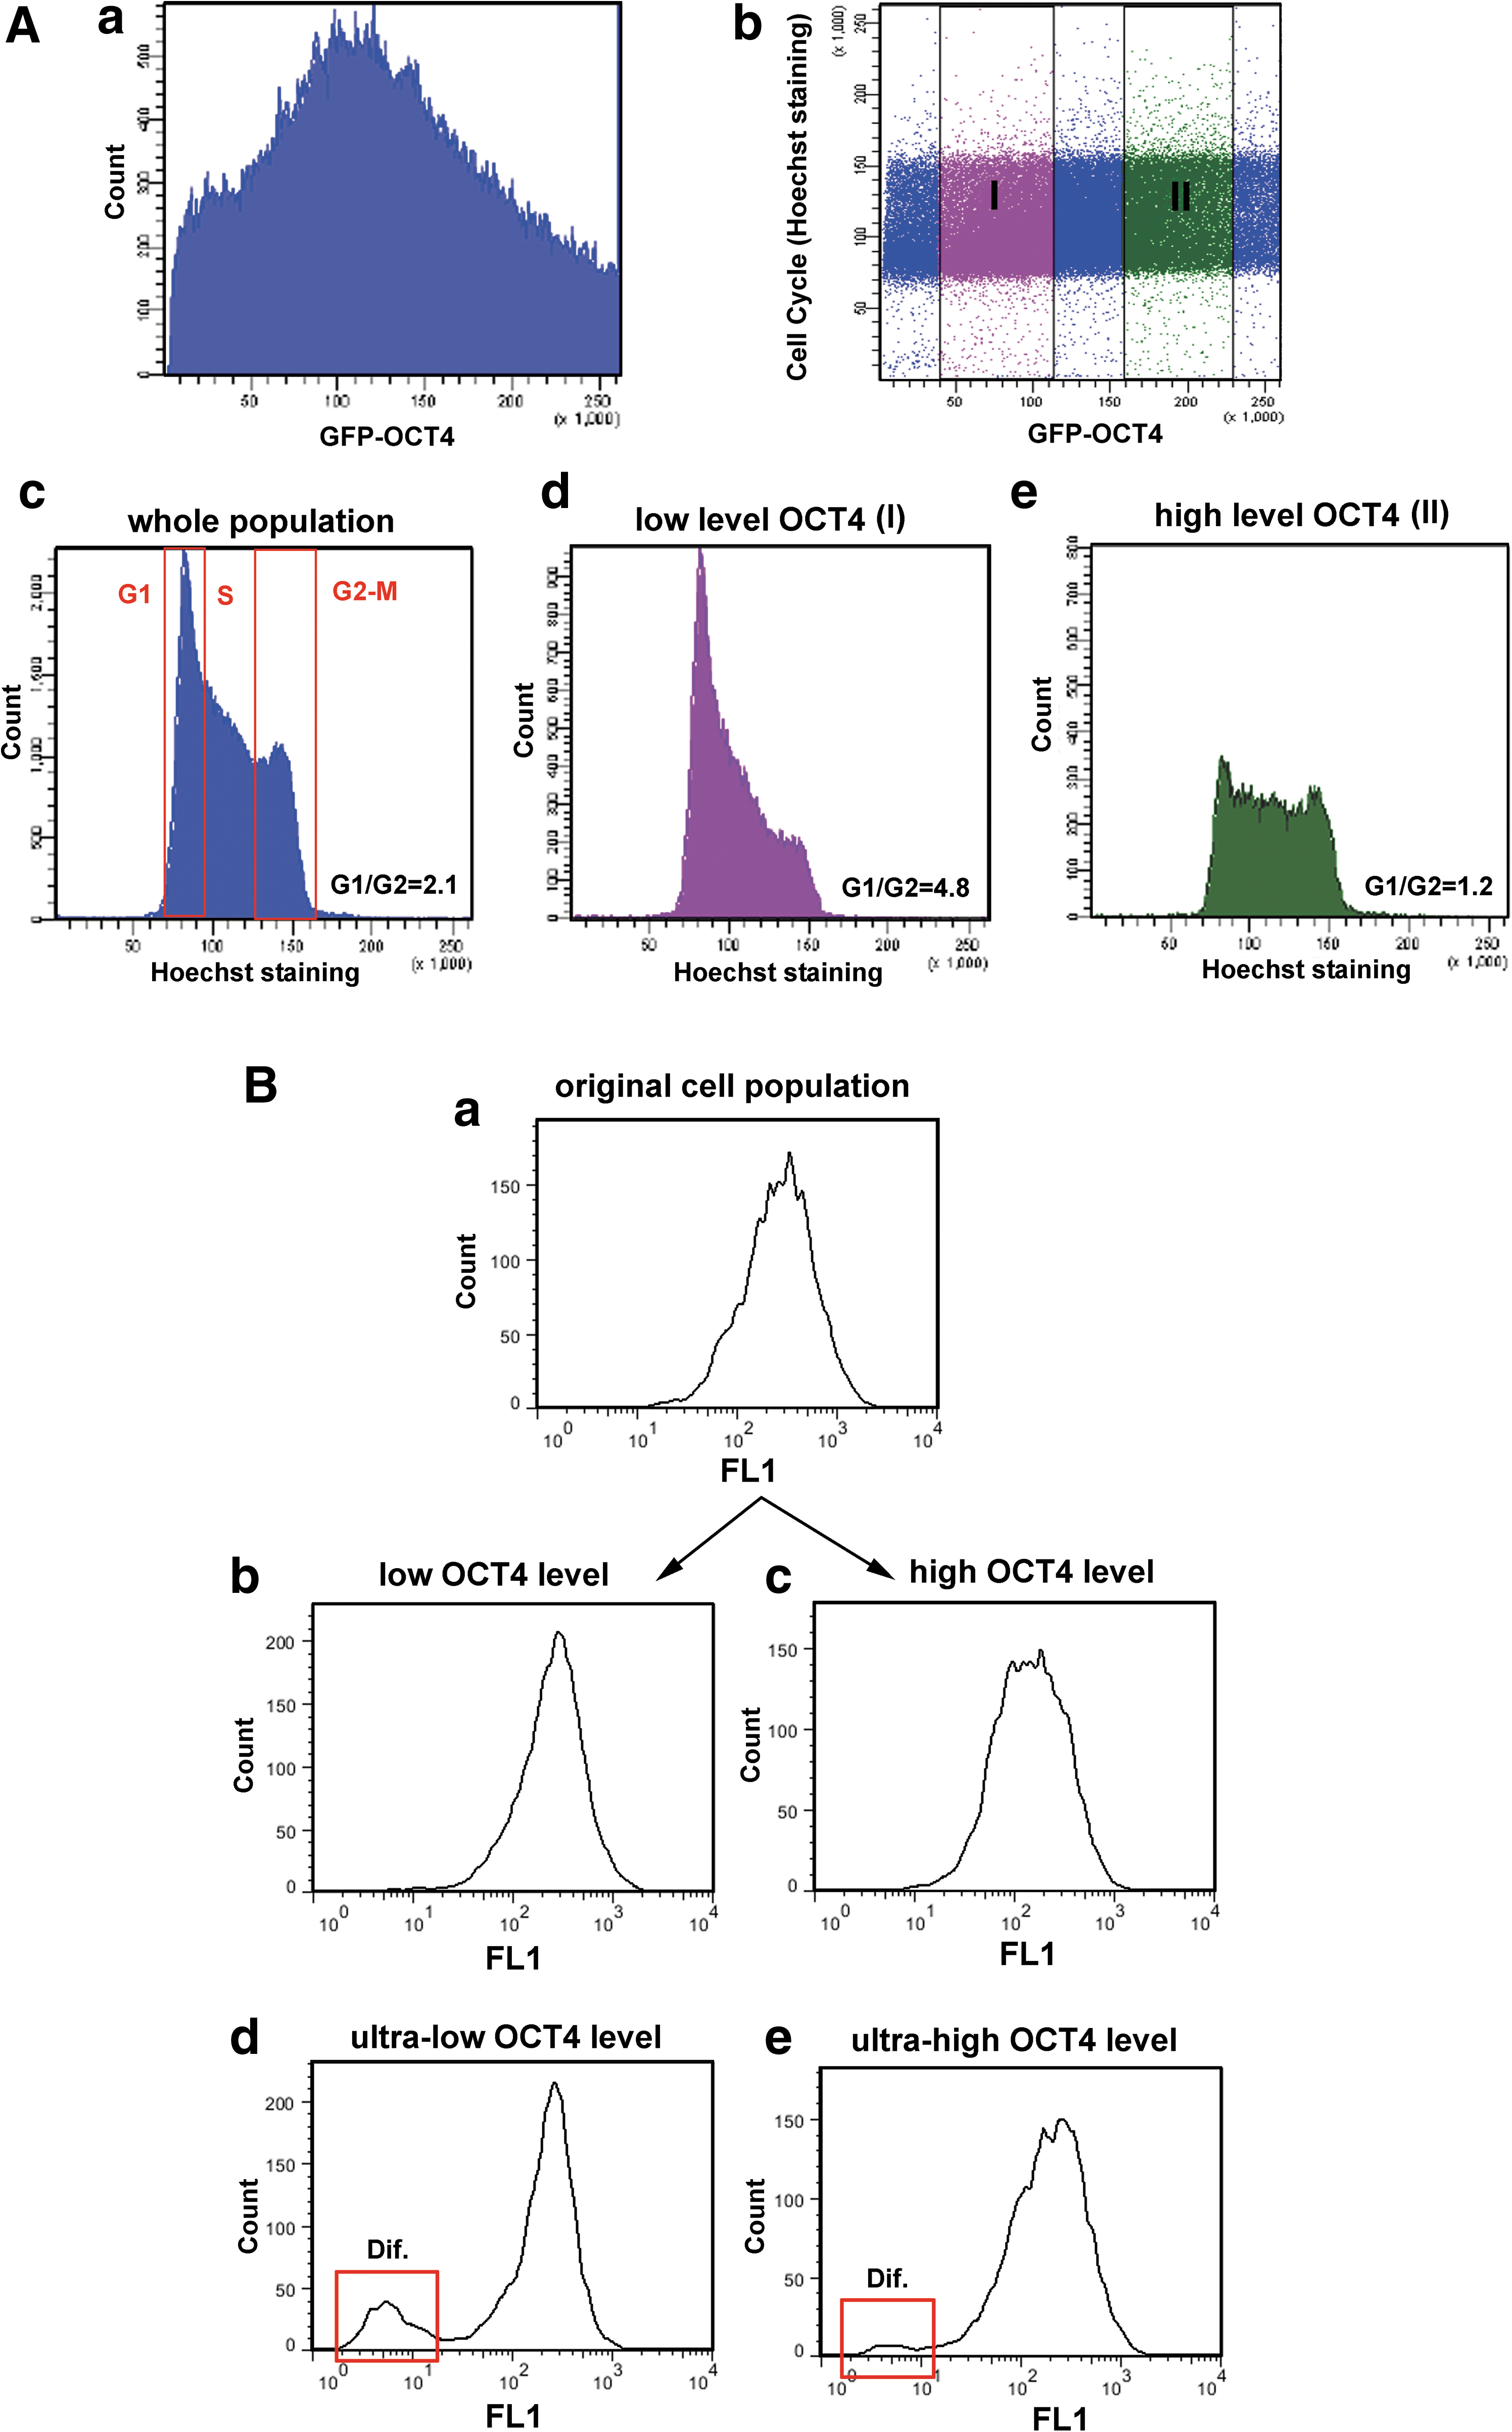
GOWT1 pluripotent mESCs stably expressing Oct4 displayed distinct levels of Oct4 within the cells of an mESC colony (Fig. 1A and quantification of fluorescence intensity in panel 1B). We asked whether the differences in Oct4 levels were cell cycle dependent and whether the kinetics of Oct4 varied with expression level. FRAP analysis showed no difference in fluorescence recovery time after photobleaching between cells with low and high Oct4 levels (τ50=2.7 s for low-level Oct4 and 3.3 s for high-level Oct4) (Fig. 1C). We considered that differing levels of Oct4 could be due to either cell cycle changes or differentiation (Fig. 1D). Therefore, we analyzed the levels of Oct4 within mESC colonies with respect to the cell cycle phase of individual cells. We monitored individual mESC colonies for 24 h and observed cell division and changes in Oct4 levels. The G1, G2, and M phases were clearly distinguished (Fig. 1E). Thus, we were able to see higher levels of Oct4 in G2 cells compared with cells in G1 phase (quantification in Fig. 1F). The GFP-Oct4 signal did not disappear during cell division, but it was weak (see M phase in Fig. 1E, F). In addition, we tried to distinguish individual cell cycle phases according to pKi-67 pattern (the highest level of pKi-67 we expected in G2 phase, as it was shown in [19]). We found that cells with strong Oct4 expression had the highest levels of pKi-67 (Fig. 1G). Thus, this observation confirmed our conclusion that the highest Oct4 level is in the G2 phase of the cell cycle (Fig. 1F, G). The fact that the level of Oct4 in individual cells was cell cycle dependent was supported by our flow cytometric data (Fig. 2). Data acquisition was performed in linear scale mode (see Fig. 2Aa, Ab). Using a flow cytometric software tool, we gated the cells according to GFP-Oct4 level (Fig. 2Ab, see gates I and II). We observed that the proportion of G1/G2 cells in the whole cell population had an approximate value of 2 (Fig. 2Ac), whereas this value was approximately 5 for the population of low-level Oct4 cells (Fig. 2Ad) and 1.2 for high-level Oct4 cells (Fig. 2Ae). These experiments confirmed the existence of cell cycle–dependent Oct4 levels, as did the confocal microscopy experiments.
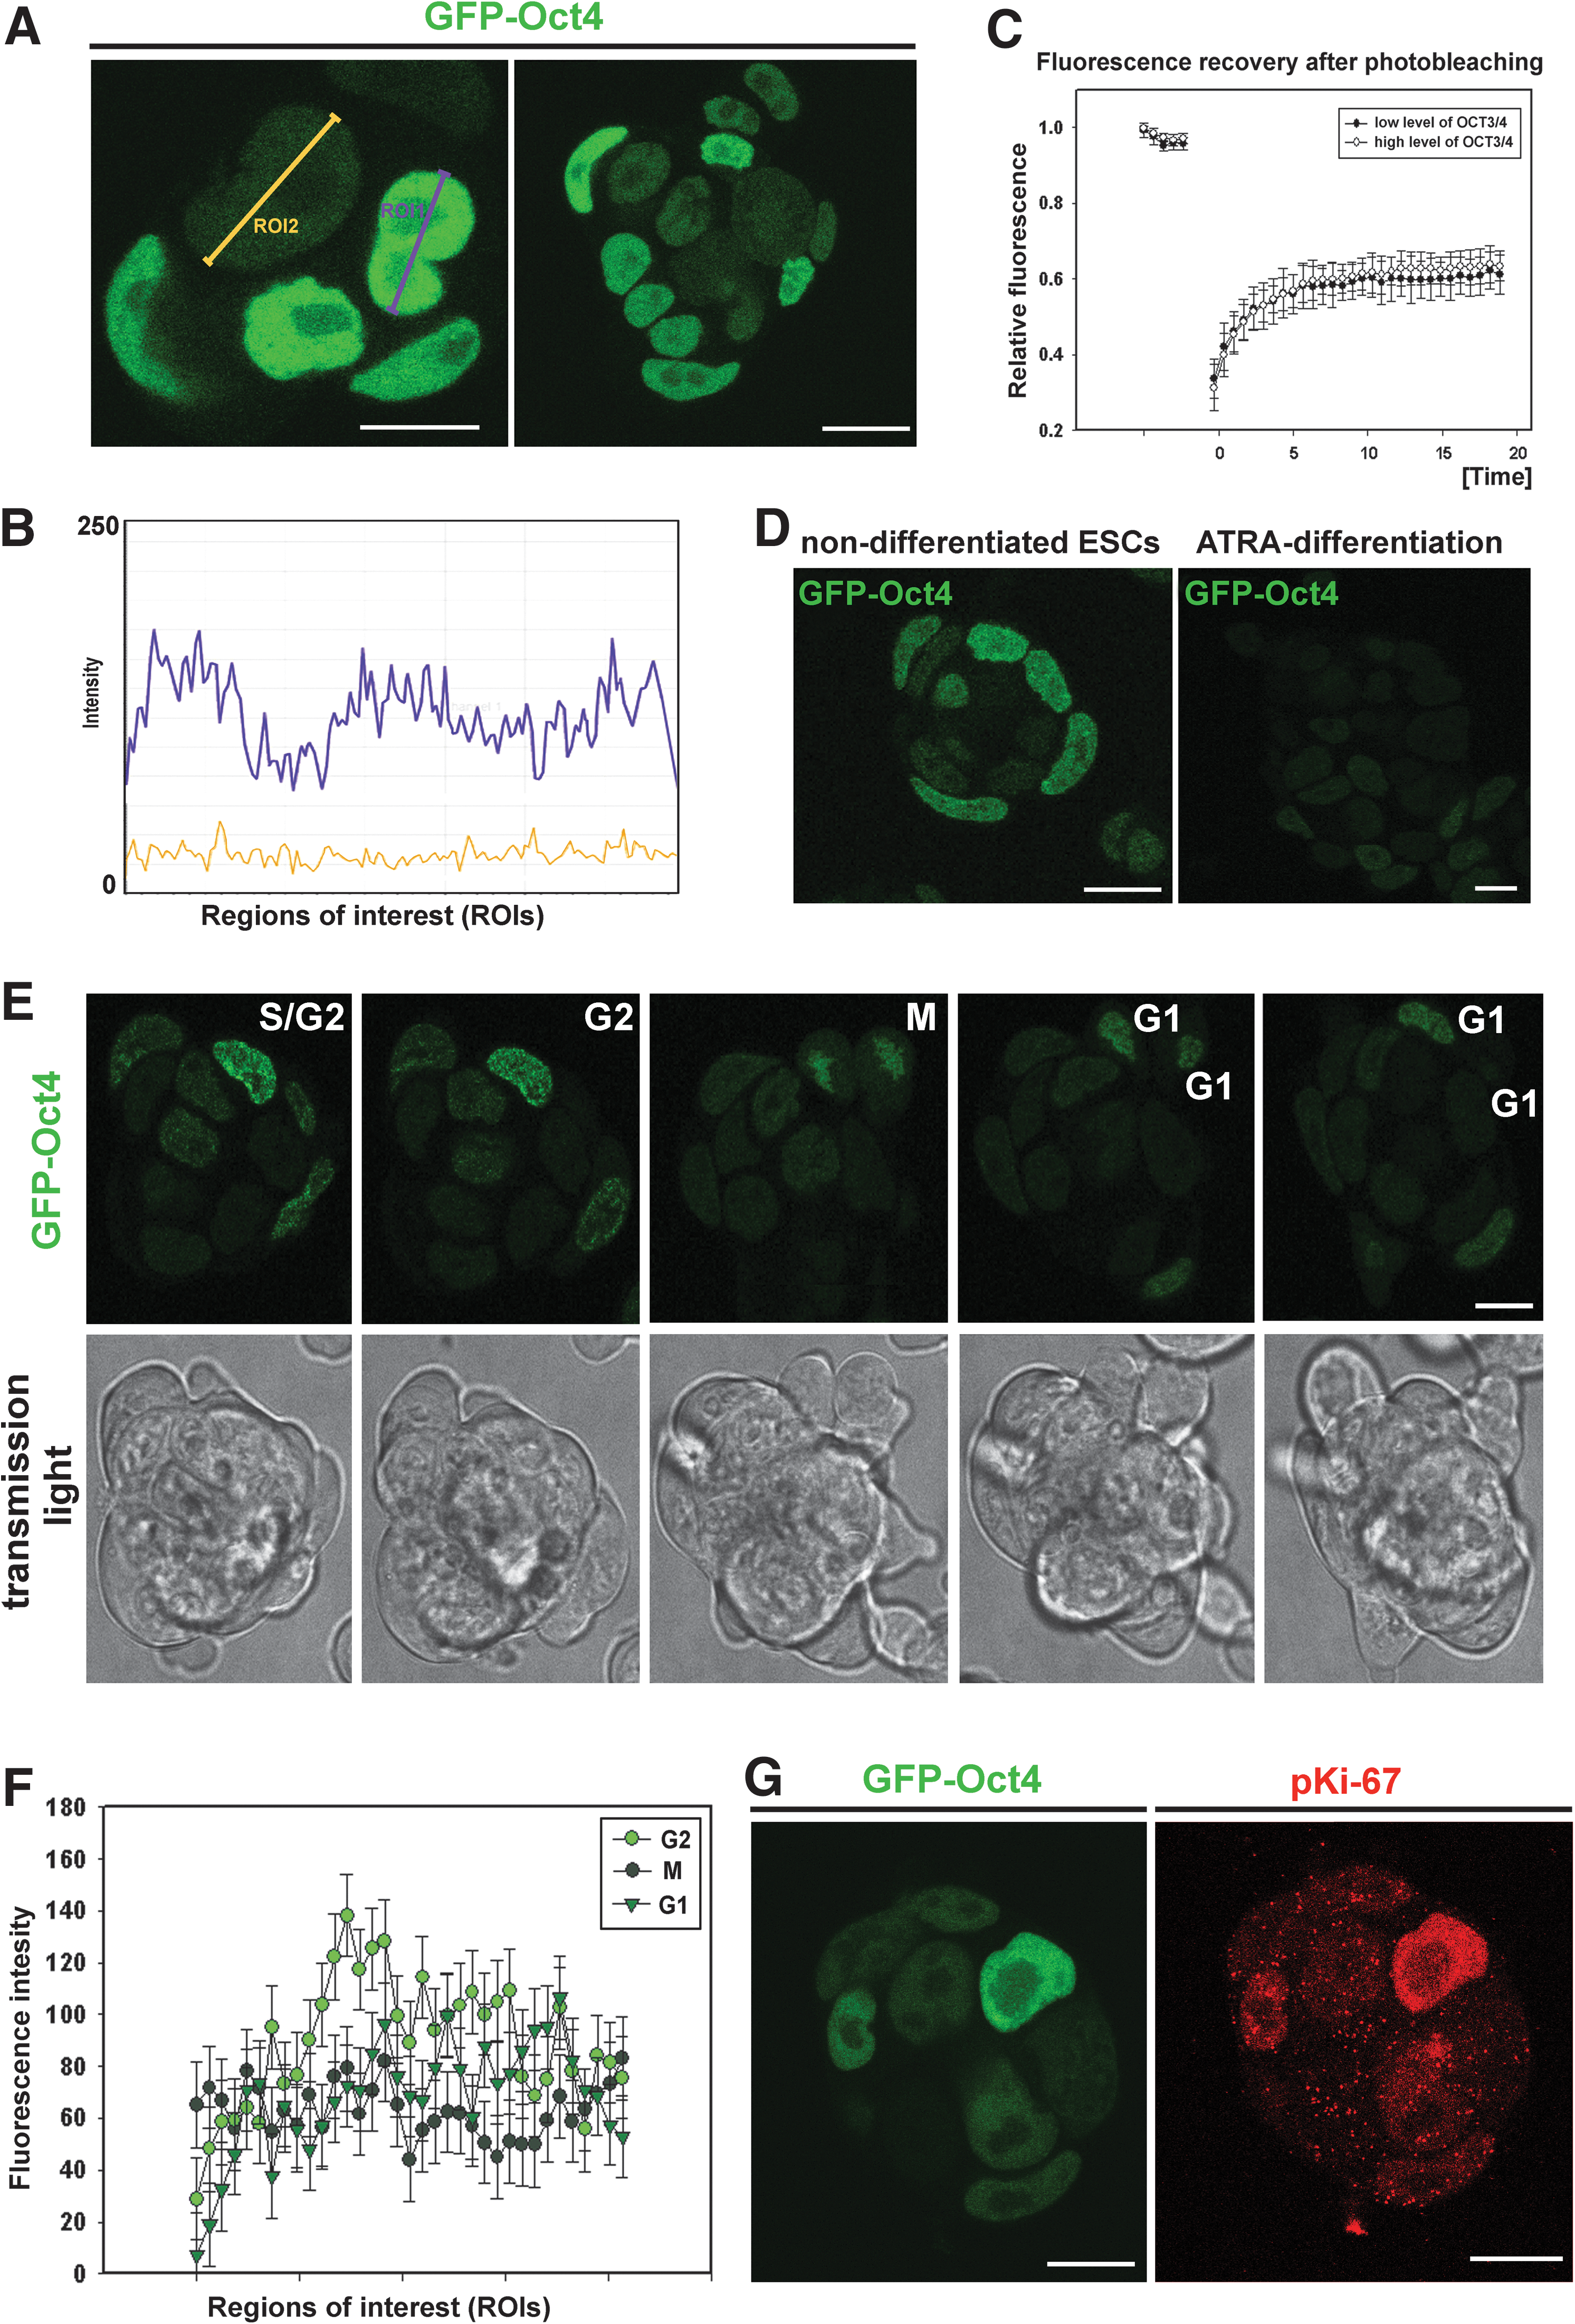
Cell cycle–dependent levels of Oct4.
Flow cytometric determination of Oct4 level versus cell cycle distribution of GOWT1 cells.
Next, we asked whether the distinct Oct4 levels reflected a loss of pluripotency. The cells were sorted according to fluorescence intensity of GFP-Oct4 and continuously cultured for another 6 days. In both low and high Oct4 populations, the fluorescence signal returned to the same level as observed in the original (maternal) population (Fig. 2Ba–Bc). Exceptions were found for cells with extreme GFP-Oct4 levels. In both ultralow and ultrahigh Oct4 cells, loss of pluripotency was observed (see red frame in Fig. 2Bd, 2Be showing differentiated cells).
Comparison of the levels of Oct4, Nanog, and c-myc proteins within mESC colonies
Using confocal microscopy, we observed that, in a majority of cases, GFP-Oct4-GOWT1 mESCs with high levels of Oct4 had low levels of Nanog and vice versa (Fig. 3A, upper panels). High levels of Nanog were detected in the most interior regions of GOWT1 mESC colonies, which was also visible in the 3-dimensional (3D) projections (Fig. 3A, lower right panel). These protein distributions reflected distinct cell cycle phases and potentially the position preferences of cells within an mESC colony. Similarly, we compared cells with high Oct4 level to those with the highest levels of the c-myc protein and found that mostly they did not overlap (see magnified regions in Fig. 3B).

Levels of Oct4, Nanog, and c-myc proteins within GOWT1 mESC colonies.
H3K27me3 is a specific marker of mESC pluripotency
In pluripotent GOWT1 mESC colonies, H3K27-trimethylation (H3K27me3) was dispersed throughout the nucleus, but peripherally positioned cells within the colony showed pronounced accumulation of H3K27me3 at the nuclear periphery. Interestingly, the cells forming the boundary of an individual colony had higher levels of H3K27me3 and showed a strong accumulation of H3K27me3 in the nuclear region that formed the notional edge of the colony (quantification in Fig. 4A). This was observed in mESC colonies cultivated for a period of 24 or 72 h (see arrows in colonies of Fig. 4A and 3D projection in Fig. 4B). Here, we have confirmed in mESCs, and recently showed in hESCs, that H3K27me3, as a repressed chromatin marker, also appears in interphase nuclei of pluripotent ES cells. It is despite the fact that nondifferentiated ESCs are characterized by more open chromatin conformation [20]. Intriguingly, western blots additionally showed stable levels of H3K27me3 in pluripotent and differentiated ESCs (Fig. 5A and [21]).
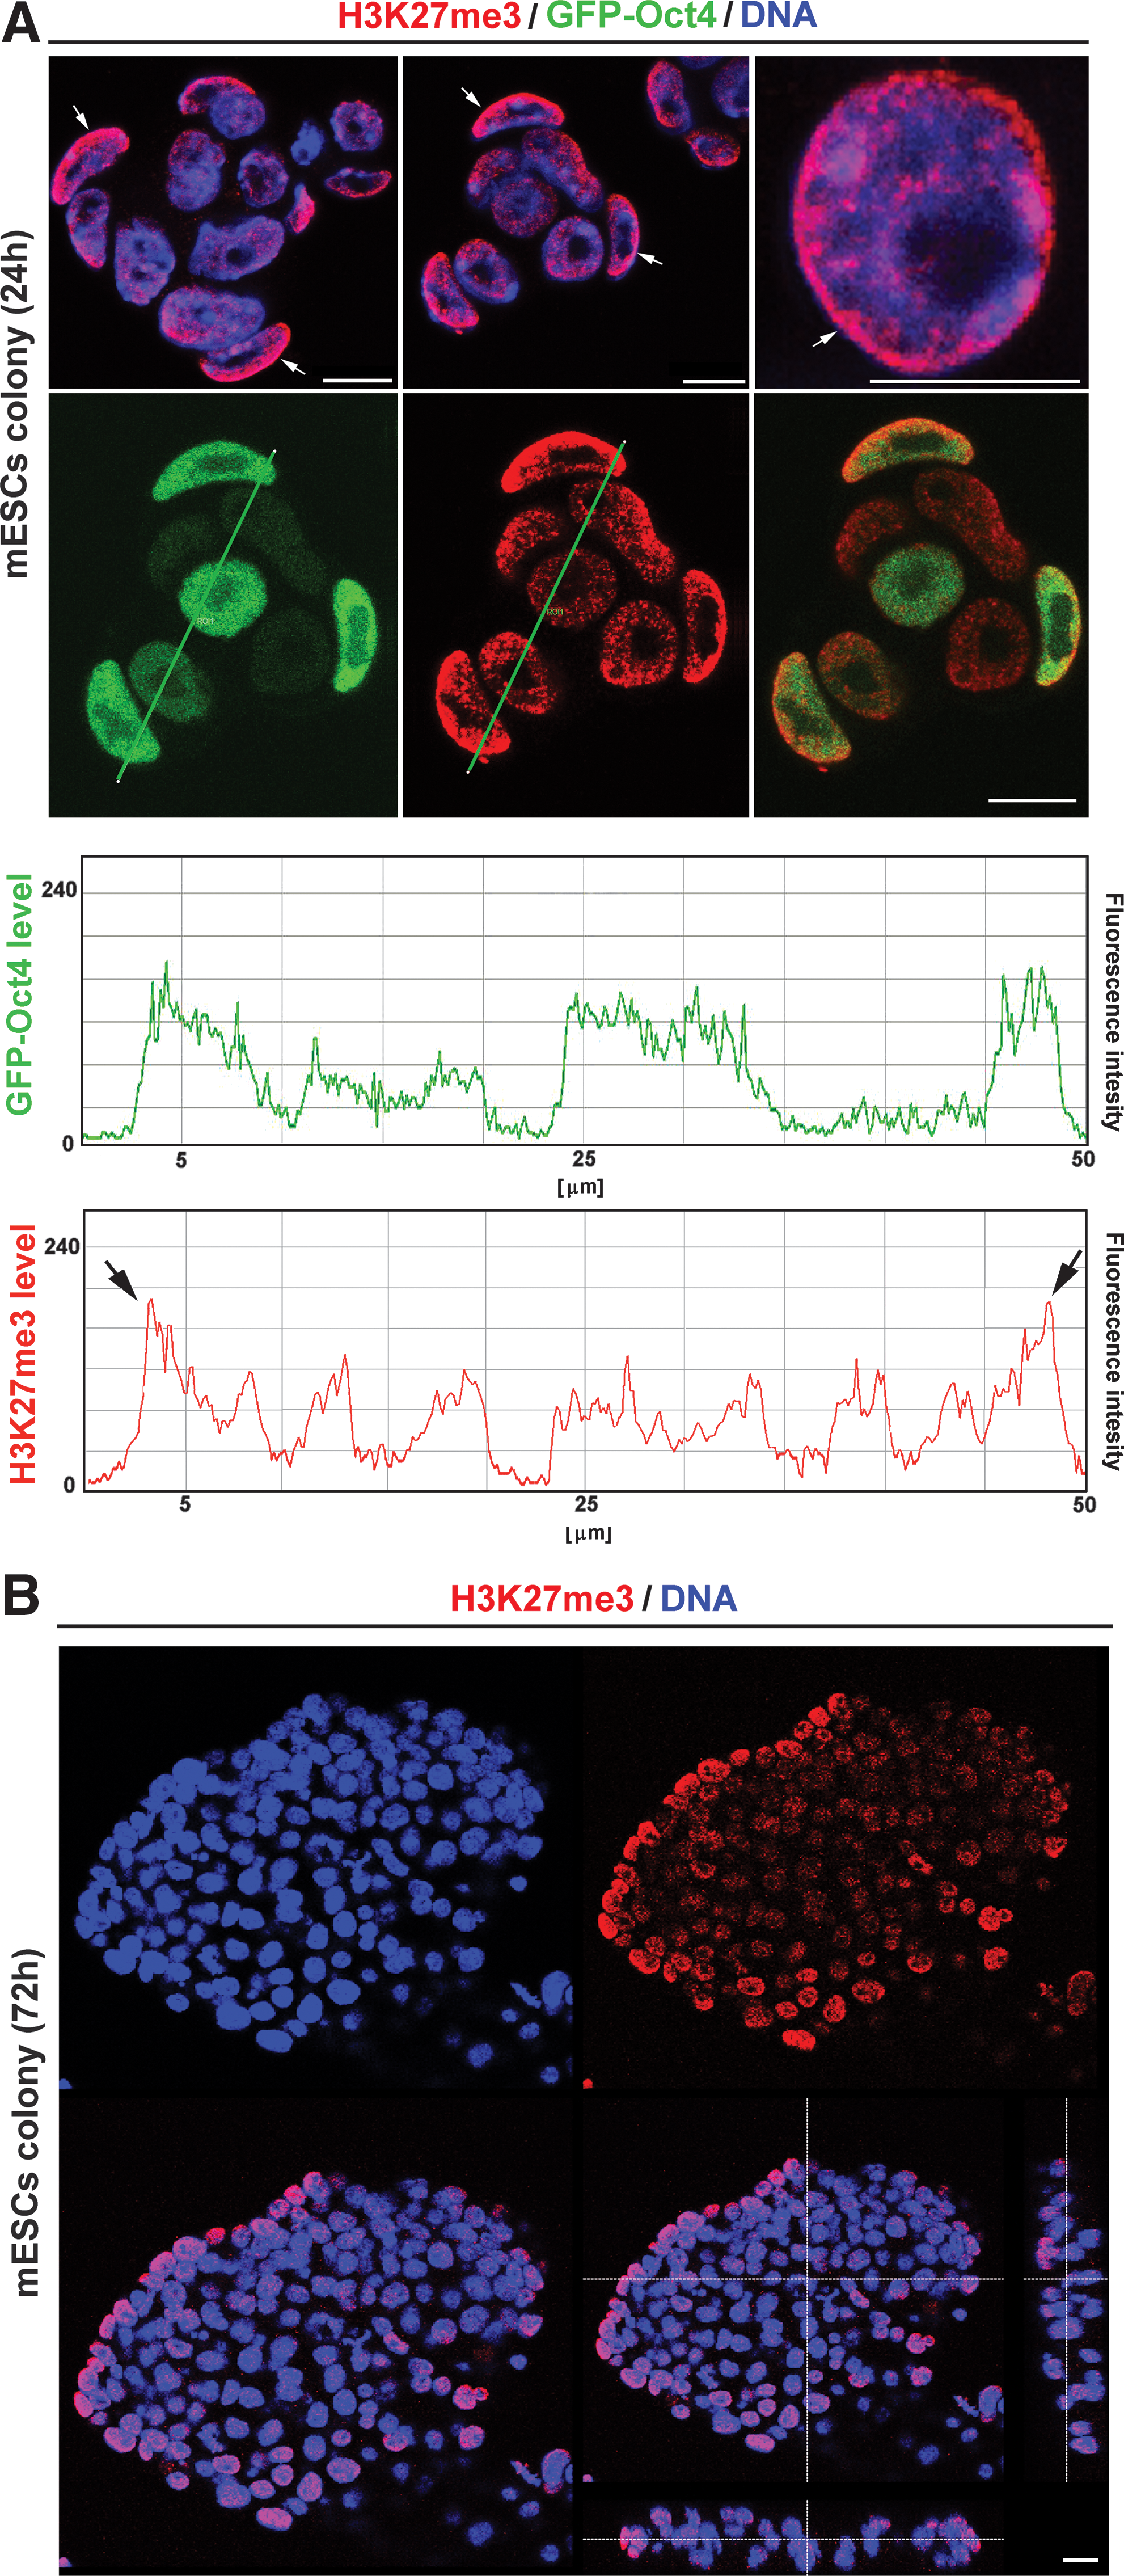
Distribution of H3K27me3 within interphase nuclei and GOWT1 mESC colonies.

Protein levels and H3K27me3 pattern in nondifferentiated and differentiated mESCs.
We have also analyzed H3K27me3 pattern during the differentiation of mESCs, which was accompanied by reduced levels of both endogenous and exogenous Oct4 (Fig. 5A). Thus, these data imply nonrandom behavior of GFP-Oct4 protein in GOWT1 cells. Confocal microscopy studies further showed that in differentiated mESCs, characterized by reduced level of GFP-Oct4, H3K27me3 was equally dispersed throughout the interphase nucleus (Fig. 5B, differentiated mESCs). However, during differentiation of hESCs, there was pronounced accumulation of H3K27me3 into foci [21] or at the inactive X chromosome in female genomes [22,23]. Here, we analyzed the male phenotype of mESCs; thus, we did not observe pronounced accumulation of H3K27me3 associated with the X chromosome inactivation (see Fig. 5B, differentiated cells).
Comparison of endogenous and exogenous pattern of Oct4
In pluripotent GOWT1 mESCs, the pattern of exogenous GFP-Oct4 [24] was identical to immunofluorescence detection of endogenous Oct4 protein (Fig. 6A). In both cases, we observed cells with both high and low level of Oct4 (Fig. 6A). In the case of GOWT1 cells, we are aware that the antibody has the ability to recognize both endogenous and exogenous protein; thus, we performed additional analysis on another mESC line, R1. In R1 colonies, we have noticed cells with both high and low levels of Oct4 (Fig. 6Ba). Similarly, some cells were characterized by high level of Nanog, relative to other cells in the colony (Fig. 6Bb). These experiments confirmed data published by Silva and Smith [25], showing highly variable levels of Nanog protein in Oct4-positive nondifferentiated cells. However, review of Silva and Smith [25] was not concerned with distinct Oct4 levels within a mESC colony, but fluctuation in Oct4 levels within mESC colony is also clearly visible in their last figure (see Fig. 2A in [25]).

Nuclear pattern of Oct4 and selected histone-related proteins in GOWT1 and wt mESC cells.
To support our conclusions, we distinguished the wild-type mESCs according to the cell cycle phases. For such analysis we used 2 wild-type mESC lines R1 and D3. After cell sorting by FACS Aria II flow cytometer, we performed western blots on detection of endogenous levels of Oct4, Nanog, cyclin A, Cdk4 and lamin B (Fig. 6C). In both cell lines tested, we have observed an increased level of Oct4 and cyclin A in G2 cells in comparison with G1 cells (Fig. 6C). In the case of cyclin A, we expected its absence in G1-phase. However, we realized that appearance of cyclin A in G1 can be explained by short duration of G1-phase in ESCs, which is distinct from somatic cells as discussed by Jirmanova et al. [26] or Burdon et al. [27]. Contrary to Oct4 and cyclin A, the levels of Nanog, Cdk4 and lamin B were stable (Fig. 6C). Thus, we used it for data normalization (see bar chart in Fig. 6C). These analysis confirmed cell-cycle dependent fluctuation of Oct4 level within the cells forming ESCs colonies. One can argue that distinct levels of Oct4 between GOWT1 and R1 cells can be influenced by exogenous expression of GFP-Oct4 in GOWT1 cells and we are aware of limited physiological relevance of green fluorescent protein (GFP) technology. However, our western blots data unambiguously confirmed cell cycle dependent fluctuation of Oct4 level even in wt mESCs (Fig. 6C).
Here, we also showed variability among mESC lines, which was clearly visible when we analyzed Oct4 and Nanog fluorescence in GOWT1 and R1 cells (see Fig. 6D). Ratio between the highest fluorescence intensity and the lowest fluorescence intensity for Oct4 in GOWT1 (or R1) was ∼15 (or ∼7); for Nanog in GOWT1 (or R1) it was ∼100 (or ∼20). Interestingly, only in GOWT1 cells, but not in R1 cell line, we have observed absence of Nanog protein in some cells within the colony (compare Fig. 3A with 6Bb). Similar phenomenon was published for wild-type mESCs by [25]. Thus, observed proteome distinctions can be caused by cultivation conditions, distinct inbred mouse strain or procedure of ESC isolation as shown by Tavakoli et al. [28] or discussed by Allegrucci and Young [29] for hESCs.
Epigenetic patterns in mESCs
Here, in addition to transcription factors, we also analyzed the level of other epigenetic markers, including H3K9me3 and subtypes of heterochromatin protein 1 (HP1) in mESCs. In this case, the level of Oct4 was not identical to the level of H3K9me3 in the individual cells of colonies. In the majority of cases, H3K9me3 was homogeneously dispersed throughout the nucleoplasm and homogeneous distribution of H3K9me3 was observed in majority of cells of the colony (Fig. 7Aa, Ac). One exception was the mitotic chromosomes that were Oct4 positive, but H3K9me3 negative (see magnified frame in Fig. 7A, M phase). In addition, some cells, particularly those located at the periphery of the mESC colony, showed an accumulation of H3K9me3 into foci or at nuclear periphery, which is indicative of a more differentiated phenotype [arrows in Fig. 7Ab, Ad, differentiated (Dif.)]. Surprisingly, HP1α protein patterns differed from H3K9me3 in their relationship to Oct4 level. As expected, cells with low levels of Oct4 typically had higher levels of HP1α and vice versa (Fig. 7B, upper panels). In the majority of cells, HP1α was homogeneously dispersed throughout the nucleus (Fig. 7B, Non-dif.), but cells with absence of Oct4 had a focal arrangement of HP1α. According to this HP1α pattern and Oct4 absence, we cannot exclude presence of some spontaneously differentiated cells within mESC colony (Fig. 7B, Dif. in the lower part of panel 7B). However, distinctions in HP1α interphase nuclear pattern were not accompanied by changes in HP1α levels during mESC differentiation (Fig. 5A) [21,30]. In the case of HP1β, western blots showed stable level of HP1β during differentiation of GOWT1 cells, but only a few cells with an absence of Oct4 were characterized by high HP1β level (see arrows in Fig. 7C). Generally, in the cells highly expressing GFP-Oct4, epigenetic markers such as H3K9me3, HP1α, and HP1β were homogeneously dispersed within interphase nuclei (Fig. 7).
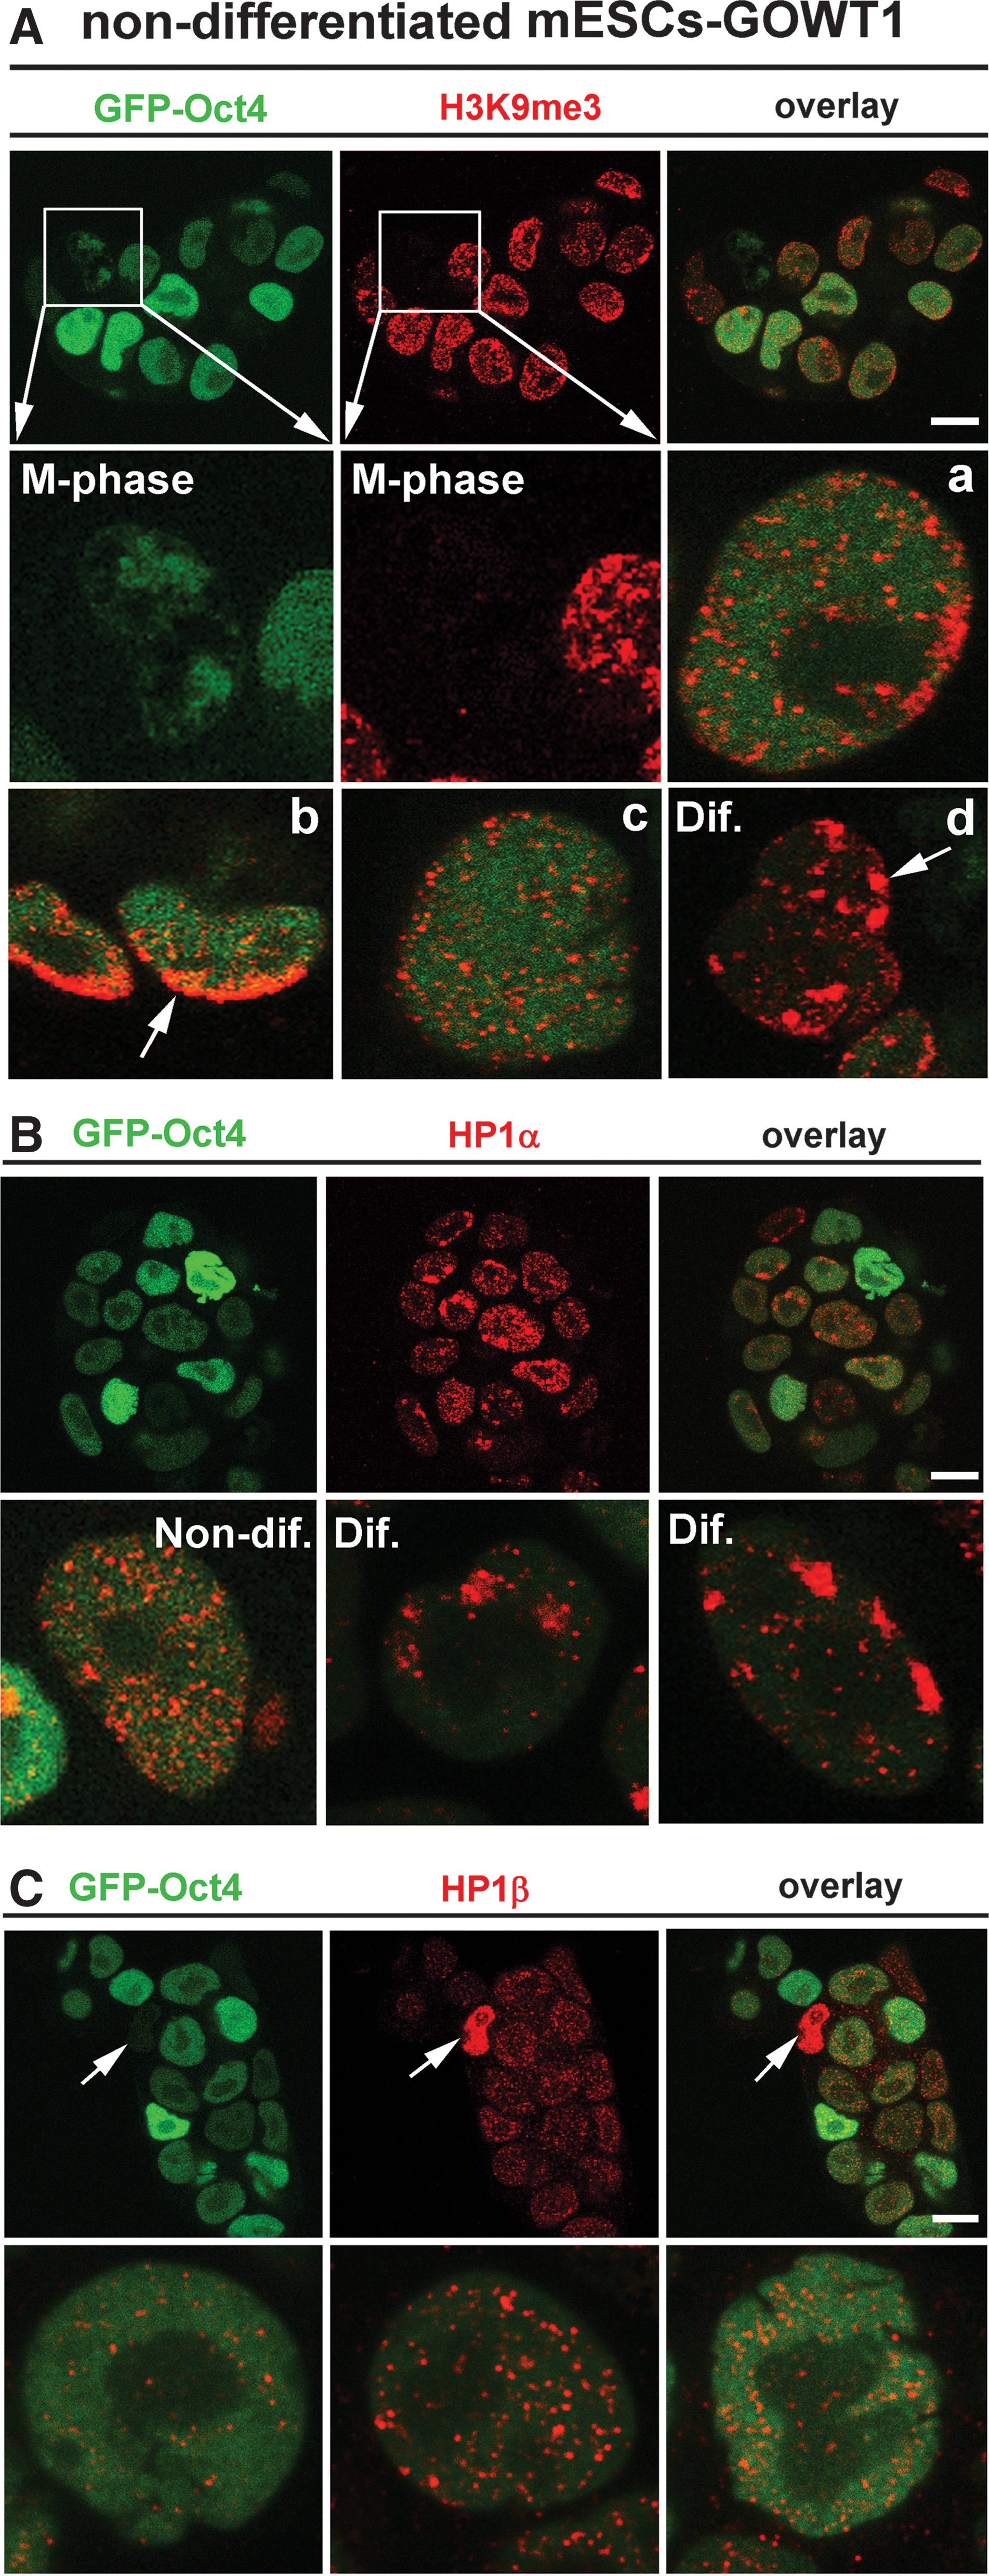
Interphase pattern of H3K9me3, HP1α, and HP1β.
Discussion
Changes in epigenetic modifications are associated with the differentiation of ESCs. However, limited information is available on the epigenetic markers, including histone signature, that control the pluripotency stage of ESCs or switch on specific differentiation pathways. As key players in the pluripotency of ESCs are considered additional epigenetic markers such as transcription factors Oct4, Nanog, and c-myc [24,31,32]. Oct4 is responsible for ESC self-renewal and pluripotency and is required for formation of the inner cell mass of blastocysts [33]. Alterations in the expression of these candidate genes promote ESC differentiation. Here, we show that, in addition to global expression of Oct4, Nanog, and c-myc, the balance of expression patterns of these proteins within particular cells of the whole ESC colony is critical for stem cell renewal. This is consistent with observations that ESCs are heterogeneous in Nanog gene expression and that the level of Nanog correlates with the probability of self-renewal or differentiation [25,34 –36]. Moreover, distinct levels of Oct4, Nanog, and c-myc within individual cells of an mESC colony (Figs. 1 and 3) are consistent with general patterns of transcription observed at the individual cellular level. As an explanation, transcription levels strongly depend on the proportion of mono-allelic and bi-allelic gene expression, which is variable among genes and between individual cells of the same cell population [37,38]. This observation is reflected in the studies of Levsky et al. [37] and Osborne et al. [39] showing that some genes have longer periods of quiescence than activity. This illustrates the fact that the transcription sites of low-expression genes, as determined by RNA-fluorescence in situ hybridization, can be observed in only 10%–15% of cells in a population. On the other hand, for highly expressed genes, such as γ-actin, 80% of cells are transcriptionally active. Differing ratios of mono-allelic and bi-allelic gene expression likely results in varying protein levels, which may be what occurs for the Oct4 gene and Oct4 protein.
From our data, it seems likely that specific levels of Oct4, Nanog, and c-myc in individual cells within an ESC colony contribute to stem cell pluripotency. When expression levels exceeded some threshold, the cells lost pluripotency and underwent differentiation. This correlates well with data published by Niwa et al. [31] showing that both extreme up- or downregulation of the Oct4 gene induces differentiation and only a specific Oct4 level has the ability to maintain ESC pluripotency. As mentioned earlier, we show the differentiation-independent fluctuation of Oct4 protein levels in individual cells of mESC colonies, which we observed in both GFP-Oct4-GOWT1 and R1 mESCs (Figs. 1 and 6). These distinctions might be influenced by cell cycle profile. It was confirmed for GOWT1 cells (Figs. 1E, F, and 2) and R1 or D3 wild-type mESCs, as well (Fig. 6Ba, C, and D). Our live cell studies showed that increased level of Oct4 protein, as a transcription factor, is required when the genome is duplicated during S phase.
We also observed heterogeneity in the distribution of epigenetic markers among ES cell lines. For example, in R1 cells, distinctions in Oct4 levels among the cells of a colony were not so pronounced as in GFP-Oct4-GOWT1 cells (compare Fig. 6A with 6Ba or see Fig. 6D). Similar distinctions were found when we compared Oct4 levels in G1/G2 phases in R1 and D3 cells (see bar chart in Fig. 6C, showing pronounced distinctions between G1/G2 Oct4 levels in D3 cells when compared with R1 cells). Another example represents Nanog-positive R1 cells that were not strictly positioned in the center of R1 mESC colonies, as published in [25] or as we observed in GOWT1 cells (compare Fig. 3A with 6Bb). These data confirm that there is heterogeneity in ESC lines, as pointed out by Hoffman et al. [40] for X chromosome inactivation, and as we have observed for some histone modifications and Oct4 levels [21].
Key roles in ESC pluripotency have been also ascribed to specific histone markers and related proteins, including H3K9-trimethylation, H3K27me3, and HP1 proteins [16,20,21]. Nuclear patterns of these markers usually reflect the level of chromatin condensation, which is high in pluripotent ESCs compared with cells with more differentiated phenotypes [20]. Cells with more differentiated phenotypes exist within hESC colonies, according to the nuclear distribution of H3K9me3, centromeric heterochromatin arrangement, and H3K27me3 nuclear pattern [21]. We now confirm this finding in the model of mouse GOWT1 cells (Fig. 7A, B). In this case, the nuclei of the cells located at the periphery of mESC colonies had increased levels of H3K27me3 (Fig. 4) and focal pattern of HP1α appeared (Fig. 7B). This may correspond to spontaneous differentiation that can marginally occur within an ESC colony. Our suggestion corresponds to the experiments of Caillier et al. [41], showing that depletion of HP1γ in ESCs decreases their resistance to differentiation. Moreover, cells with downregulated HP1γ undergo differentiation to endoderm with lower efficiency compared with maturation into neuroectoderm and mesoderm [41]. These data illustrate the importance of nuclear patterns and specific levels of HP1 protein subtypes for maintaining the pluripotency of ESCs [20]. Moreover, it is evident that the balance between pluripotent and differentiated ESCs is maintained not only by transcription factors, including Oct4, Nanog, and c-myc, but also by several epigenetic markers, including H3K9me3, H3K27me3, and HP1 subtypes [20,21,41].
Footnotes
Acknowledgments
The authors thank Dr. Hitoshi Niwa and his colleagues (Laboratory for Pluripotent Stem Cell Studies, RIKEN Center for Developmental Biology, Japan) for the GOWT1 cells stably expressing exogenous Oct4 fused to GFP. This work was supported by the following grants: AVOZ50040507, LC535, LC06027, ME 919, and Grant Agency of the Czech Republic P302/10/1022. The author group is also involved in the EU COST project TD09/05 and Marie Curie project PIRSES-GA-2010-269156-LCS. Some experiments were supported by the national COST-CZ project LD11020. The authors also thank Dr. Jiřina Procházková and Radek Fedr for flow cytometric measurements.
Author Disclosure Statement
The authors indicate that there are no potential conflicts of interest.