
Abstract
Mesoangioblasts are vessel-derived stem cells that differentiate into mesodermal derivatives. We have isolated postnatal aorta-derived mesoangioblasts (ADMs) that differentiate into smooth, skeletal, and cardiac muscle, and adipocytes, and regenerate damaged skeletal muscle in a murine model for Duchenne muscular dystrophy. We report that the marker profile of ADM is similar to that of mesoangioblasts isolated from embryonic dorsal aorta, postnatal bone marrow, and heart, but distinct from mesoangioblasts derived from skeletal muscle. We also demonstrate that ADM differentiate into myelinating glial cells. ADM localize to peripheral nerve bundles in regenerating muscles and exhibit morphology and marker expression of mature Schwann cells, and myelinate axons. In vitro, ADM spontaneously express markers of oligodendrocyte progenitors, including the chondroitin sulphate proteoglycan NG2, nestin, platelet-derived growth factor (PDGF) receptor α, the A2B5 antigen, thyroid hormone nuclear receptor α, and O4. Pharmacological inhibition of Rho kinase (ROCK) initiated process extension by ADM, and when combined with insulin-like growth factor 1, PDGF, and thyroid hormone, enhanced ADM expression of oligodendrocyte precursor markers and maturation into the oligodendrocyte lineage. ADM injected into the right lateral ventricle of the brain migrate to the corpus callosum, and cerebellar white matter, where they express components of myelin. Because ADM differentiate or mature into cell types of both mesodermal and ectodermal origin, they may be useful for treatment of a variety of degenerative diseases, or repair and regeneration of multiple cell types in severely damaged tissue.
Introduction
M
We and others have reported that mesoangioblasts derived from aorta may have neural potential [1,13]. Mesoangioblasts from embryonic dorsal aorta express neural-specific genes, but do not differentiate into neurons or astrocytes [13]. However, these cells have not been examined for their potential to differentiate into oligodendrocytes. Four of the 5 neural markers detected in embryonic mesoangioblasts have also been observed in mature oligodenrocytes [14 –17]. Therefore, the expression of these genes in mesoangioblasts may instead be indicative of oligodendrocyte potential. In support of this, we have observed ADM in peripheral nerve bundles in vivo with Schwann cell morphology. The goals of our study were to verify that ADM have the potential to become myelinating glial cells, to identify culture conditions for promoting ADM differentiation into glial cells, and to identify signaling molecule(s) involved in this process.
Materials and Methods
Stem cell isolation and culture
Clonally derived ADM were isolated as described previously from the aortic arch of mouse pups [1]. Briefly, aortic arches were isolated from 4- to 10-day-old mouse pups, and grown on gelatin-coated plates with mitotically inactivated layers of spontaneously-transformed mouse fibroblasts (STO fibroblasts) in growth medium (GM; defined below). Some explants were also grown on gelatin-coated dishes without feeder cells, in GM supplemented with leukemia inhibitory factor (LIF). Explants were broken down into single-cell suspensions after 2–6 weeks in culture and plated on gelatin-coated dishes until colonies formed. Colonies with small, round, refractile cells were selected for expansion, as described previously for isolation of mesoangioblasts [1 –3,18]. The resulting clonal populations were then screened for expression of the Sca-1 surface marker, and the potential to differentiate into smooth and skeletal muscle in vitro [1]. Two clonally derived populations that exhibited all of these characteristics were used for the in vitro and in vivo studies and fluorescence-activated cell sorting (FACS) analysis. Adipose-derived MSCs were isolated by subjecting 40 to 50 mL of liposuction lipoaspirate to enzymatic digestion. Briefly, harvested fat was digested with 0.075% collagenase in phosphate-buffered saline (PBS) for 30 min on a shaker at 37°C. Mature adipocytes and connective tissues were separated from cell pellets by centrifugation (800g, 10 min). Cell pellets were resuspended in erythrocyte lysis buffer (155 mM NH4Cl, 10 mM KHCO3, and 0.1 mM ethylenediaminetetraacetic acid), incubated for 5 min at room temperature, and centrifuged. Cell pellets were resuspended, passed through a 100-μm mesh filter (Millipore, Billerica, MA), and subjected to density gradient centrifugation (800g, 20 min) with Ficoll (GE Healthcare Bio-Sciences, Piscataway, NJ). After centrifugation, cells at the gradient interface were collected, washed with PBS, and passed through a 100-μm mesh filter. Cells were plated at a density of 2×10⁵ cells/cm2 in Dulbecco's modified Eagle's minimal essential medium (DMEM) low glucose with 10% fetal bovine serum (FBS) for expansion and passaged thrice to derive a pure population of MSC. These cells were identified as MSC by their ability to differentiate into adipocytes, chondrocytes, and osteocytes, and by expression of surface markers by flow cytometry. PC12 cells and the S16 Schwann cell line were obtained from the American Type Culture Collection (Mannassas, VA).
ADM, Chinese hamster ovary (CHO) cells, PC12, MSC, and S16 cells were maintained in a humidified incubator at 37°C in 5% CO2. CHO cells and MSC were cultured in Iscove's DMEM supplemented with 10% FBS, penicillin 0.1 U/mL, streptomycin 0.1 μg/mL, and L-glut 2.0 mM. ADM were maintained in this same medium, supplemented with 20% FBS, 0.1 mM nonessential amino acids, minimal essential medium vitamin solution from Gibco (Carlsbad, CA), and 10 ng/mL purified LIF (Chemicon International, Temecula, CA), and grown in flasks coated with 0.1% gelatin.
Aorta dissection for explant cultures and primary aorta cells
For primary aorta cells, 7–20-day-old wild-type C57Bl/6 pups were used. The ascending aorta, aortic arch, and descending aorta extending just below the heart ventricles was excised without the innominate (brachiocephalic), left subclavian, and left common carotid artery. Aortas were grown as explants for 3 days or 3 or 6 weeks without feeder cells, in medium described above, on gelatin-coated glass coverslips. Coverslips were then removed and placed in dishes with GM (detailed above), or glial medium (detailed below), for 2 days. The medium was removed, and cells were washed once with PBS, and fixed with 3.7% formaldehyde for 10 min at room temperature.
Fluorescence-activated cell sorting
Live cell samples were divided among 7 Becton Dickenson FACS tubes, pelleted, resuspended in 100 μL of PBS containing primary biotin-conjugated antibody, and incubated in the dark for 30 min on ice. Cells were washed with PBS twice, resuspended in PBS containing secondary antibodies conjugated with streptavidin-ECD (a conjugate of PE and Texas Red), and incubated in the dark for 30 min on ice. Cells were then washed twice with PBS, resuspended in 1 mL of PBS per tube, and passed through a cell strainer. Analysis was conducted using an iCyt Reflection cell sorter (iCyte Mission Technology, Champaign, IL). The percentage of ADM positive or negative for surface markers was quantified using Reflection's WinList Acquisition and Analysis software (Verity Software House, Topsham, ME).
Primary antibodies used include rat MCA2183B monoclonal antibody to CD13 (AbD Serote, Raleigh, NC); mouse anti-melanoma cell adhesion molecule (MCAM) monoclonal antibody to CD146 (Chemicon/Millipore, Billerica, MA); rat monoclonal antibody to CD34 (eBioscience, San Diego, CA); rat monoclonal antibody to Thy-1.2 (CD90.2) (eBioscience); rat monoclonal antibody to leukocyte common antigen Ly-5 (CD45) (eBioscience); rat monoclonal antibody to Ly-6A/E (Sca-1) (eBioscience); and rat monoclonal antibody to PECAM-1 (CD31) (eBioscience), all diluted 1:50. Secondary Streptavidin-ECD from Beckman Coulter (Fullerton, CA) was used for all 5 biotin-conjugated primary antibodies at a dilution of 1:50.
ADM labeling and transplantation into skeletal muscle
ADM were trypsinized, counted, and labeled with the lipophilic dye 1,1′dioctadecyl-3,3,3′,3′-tetramethylindocarbocyanine perchlorate (DiI; Molecular Probes, Carlsbad, CA) as described previously [1]. About 5×10⁶ (50 μL) DiI-labeled cells were injected into the gastrocnemius of mdx/utrn−/− mice. The contralateral gastrocnemius was injected with an equal volume of HBSS. Five weeks later, mice were euthanized, gastrocnemius muscles were isolated, and snap-frozen in isopentane cooled by liquid nitrogen. About 10-μm-thick sections of muscle were cut using a Thermo Fisher Scientific Shandon Cryotome FSE Cryostat (Pittsburgh, PA), at −17°C and mounted onto glass slides (Surgipath, Richmond, IL). All care and use of mice for these procedures were approved by the institutional animal care and use committee at the University of Illinois.
Intracerebroventricular cannulation for stem cell injection into the brain, and intracardiac left ventricular perfusion
Mice were anesthetized with ketamine and xylazine (1 mg and 0.1 mg/10g of body weight, respectively) intraperitoneally (IP), and shaved from between the eyes to the occipital lobe. Once shaved, mice were positioned with incisors hooked into the nose bar, frontal and parietal bones parallel to horizontal zero in a Kopf series 1700 stereotaxic device (Tujunga, CA), and head secured with ear bars. The surgical site was sterilized with betadine (3×) in an inside to outside circular motion. A #10 round blade was used to make a sagittal skin incision of 1 cm to reveal the bregma on the cranium. A 1/32 drill bit was used to make 3 holes in the cranium for the guide cannula and 2 anchoring screws. A 26-gauge stainless-steel guide cannula was placed in the right lateral cerebral ventricle using the following stereotaxic coordinates from the bregma: lateral 1.6 mm; anterior-posterior 1 mm; and vertical −2 mm from the dura mater. Two anchoring cranial screws were inserted in the left hemisphere, respectively, in the frontal and parietal bones. The cannula was secured with cranioplastic cement with the assistance of the 2 anchoring screws. Finally, a dummy cannula was inserted in the guide cannula to prevent infection. 500,000 DiI-labeled mesoangioblasts were injected into the lateral ventricle using an injection cannula that fit into the guide cannula. Mice were perfused and cryosectioned 5 weeks later.
Mice were perfused via a nonsurvival transcardiac procedure with buffered formaldehyde (2 mL per gram of body weight) through the left ventricle directly into the aorta. Mice were anesthetized using Sleepaway (Fort Dodge) containing 26% pentobarbital, at an anesthetic dosage of 40 mg/kg IP. After anesthesia, a reverse T incision was made to cut through the sternum of the rib cage and expose the beating heart. The perfusion catheter was inserted into the apex directed toward the left ventricle. The catheter was attached to tubing connected by a 3-way stopcock to 2 elevated bags. One bag contained cold Ringer's solution with heparin and lidocaine (1 mL/L of Ringers, respectively), and the other bag contained 0.1 M phosphate-buffered 4% paraformaldehyde. The bags were elevated to 2 m to allow gravity to drive the rate of perfusion. The caudal vena cava was severed to prevent systemic circulation. Cold Ringer's solution was first perfused into the carotid artery until the resulting fluid exiting the heart was clear. The stopcock was then used to stop the flow of Ringers solution and buffered paraformaldehyde was allowed to flow into the perfusion catheter and up the carotid arteries leading to the brain. The brain and spinal cord were then removed for analysis.
In vitro differentiation of ADM and MSC
Cells were trypsinized, counted, and plated on 0.1% gelatin-coated or 50 μg/mL poly-L-lysine-coated (Sigma-Aldrich Corp., St. Louis, MO) glass coverslips. To coat coverslips, 0.1% gelatin was added to the dishes for 15 min at room temperature and then removed, and dishes were washed with 1×PBS. For poly-L-lysine coating, coverslips were incubated with poly-L-lysine for 2 h at room temperature, removed, and allowed to dry completely. Cells were plated in GM at a density of 40,000 cells/60 mm dishes. 8–12 h later cells were washed twice with 1×PBS to remove serum, and differentiation medium was added. Two media/treatments were used: (1) differentiation medium: DMEM+5 μM Fasudil, and (2) glial medium, consisting of differentiation medium from Thermo Fisher (cat #SH30892.KT), supplemented with Fasudil, 60–400 nM L-3,5,3′triiodothryonine (T3) as indicated, 20 ng insulin-like growth factor 1 (IGF1) and 200 ng platelet-derived growth factor (PDGF). Primary, secondary, and tertiary branching was quantitated in 10 fields, randomly captured as digital images, for each condition. Error bars represent standard error.
Indirect immunofluorescence, fluorescent microscopy, and confocal microscopy
Primary antibodies used include the mouse IgM antibody to the O4 antigen (clone 81), diluted 1:50; the rabbit antibody to the chondroitin sulfate proteoglycan NG2, diluted 1:200; the mouse monoclonal antibody to βIII-tubulin (clone TuJ1), diluted 1:50; the mouse IgM antibody to the A2B5 antigen, diluted 1:50; and the Rabbit antibody to Galactocerebroside (AB142), all from the Chemicon division of Millipore, Billerica, MA. Other primary antibodies used include the rat antibody to PDGF receptor α (PDGFRα; clone APA5; BD Biosciences, San Jose, CA), diluted 1:50; the mouse monoclonal antibody to thyroid hormone receptor α (TRα; clone H2804, which does not cross-react with TRβ; Invitrogen, Carlsbad, CA), diluted 1:50; chicken antibody to Nestin (Neuromics, Edina, MN), diluted 1:100; rabbit antibody to Rho kinase 2 (ROCK2; ab71598, Abcam Inc., Cambridge, MA); the 47A mouse monoclonal antibody to fetal myosin heavy chain, diluted 1:10 (generously provided by Peter Merrifield, University of Western Ontario, London, Ontario, Canada); and mouse antibody to the phosphorylated form (Ser19) of Myosin Light Chain 2 (MLC2), diluted 1:100 (Cell Signaling Technology, Inc., Danvers, MA). Secondary antibodies were purchased from Jackson ImmunoResearch Laboratories, Inc. (West Grove, PA), and used at a dilution of 1:300.
For immunofluorescent detection of glial and neural proteins, cells were washed with 1×PBS, fixed with 3.7% formaldehyde for 10 min at room temperature, washed 3 times in PBS, and stored at 4°C until analysis. Tissue sections of the brain or skeletal muscle were stored on glass slides at −80°C before staining, and also fixed with 3.7% formaldehyde for 10 min at room temperature, and subsequently washed 3 times in PBS before incubation with primary antibodies. For detection of βIII-tubulin, TRα, and the A2B5 antigen, cells were permeabilized in 0.25% Triton X-100 for 10 min at room temperature, or 30 min for the O4 antigen, before blocking for 1 h in 1×PBS/5% HS/1% bovine serum albumin at room temperature. Tissue sections on glass slides were not permeabilized before blocking. Primary antibody diluted to the appropriate concentration in blocking solution was then added for 1 h at room temperature. Cells were washed 3 times with 1×PBS, and incubated with secondary antibody diluted in blocking solution, for 1 h at room temperature. Cells were washed 3 times with 1×PBS, and mounted onto slides (Fisher Scientific, Pittsburgh, PA) using Vectashield mounting medium containing 4′,6-diamidino-2-phenylindole (DAPI; Burlingame CA). DNA counterstaining for confocal microscopy was performed using ethidium bromide (EtBr; Sigma-Aldrich) at a dilution of 1:500. Images were acquired with a Retiga 2000R digital camera (Q-imaging, Surrey, BC) mounted on a Leica Inverted DMI 4000B microscope (Nuhsbaum, McHenry, IL), and colors were assigned and images merged using Image Pro Plus software (MediaCybernetics Bethesda, MD). Confocal images were acquired from an Olympus BX50 microscope using Olympus Fluoview confocal software. For quantitation, digital images of 10 fields were randomly captured, and cells positive for oligodendrocyte progenitors (OP) markers and the total number of cells, identified by DAPI, were counted. The same method was used for quantitation of the number of ADM with nuclear ROCK2 in vitro. To quantitate fluorescence intensity of the phosphorylated form of MLC2, 10 fields of cells were also randomly captured. Measurements were taken for each cell in the 10 fields using the line profile function of Scope Pro Plus software, with the reference calibrations for the intensity. Intensity levels from each field of cells were normalized to background intensity level for that field. To quantitate DiI-labeled cells that expressed OP markers NG2, O4, or GalC in tissue sections from the brain, all of the DiI-labeled cells in the corpus callosum, the visual cortex, or the cerebellum in each tissue section, for a total of 2 slides (4 sections per slide), were examined. Experiments were repeated at least 3 times. Error bars represent standard error.
Hematoxylin and eosin staining of skeletal muscle tissue for quantitation of peripheral nerve bundles
Tissue sections were fixed briefly in 95% ethanol for 2 min, and then placed in 70% ethanol for 2 min. Slides were then placed in running water for 5 min, in hematoxylin (Fisher Scientific) for 3 min, and then back in running water for another 5 min. The slides were then placed in Scott's solution (2 g sodium bicarbonate and 20 g MgSO4 in 1 L of water) for 3 min, in running water for 5 min, and then in eosin for 1 min and 30 s with rocking motion. Slides were taken through a series of alcohol washes, in 70% ethanol for 30 s, in 95% ethanol for 30 s, and then in 100% ethanol for 2 min. Tissues were then cleared in Xylenes for 5 min, removed, and coverslips mounted using Permount (Fisher Scientific).
Calculations for statistical significance
Statistical significance was determined by the 2-tailed Student's t-test, using GraphPad QuickCalc free online software (
Results
The ADM marker profile is distinct from skeletal muscle mesoangioblasts, endothelial cells, and pericytes
We examined the marker profile of ADM to determine whether these cells are similar to mesoangioblasts isolated from embryonic dorsal aorta, bone marrow, heart, or skeletal muscle. ADM are CD34+, Sca1+, and CD90/Thy1.1+, CD31−, CD45−, CD13−, and CD146− (Fig. 1a). The marker profile is similar for 2 different clonally derived populations of ADM, and is maintained up to 40 passages in culture (Supplementary Figs. S1–S3; Supplementary Data are available online at

Surface marker profile of ADM and other stem cell populations.
ADM differentiate into Schwann cells in peripheral nerve bundles in vivo
The skeletal muscles of mdx/utrn−/− mice, a phenotypic animal model for DMD, are heavily damaged after disease onset, resulting in loss of muscle fibers, denervation, and rupture of blood vessels. ADM labeled with the lipophilic dye DiI were injected into the gastrocnemius of 4-week-old mdx/utrn−/− mice [21] after the onset of muscle disease. In addition to regenerating skeletal muscle fibers [1], Schwann cells labeled with DiI were detected in the gastrocnemius 5 and 9 weeks after injection, identifiable by their distinct morphology within peripheral nerve bundles (Fig. 2a, b). DiI-labeled Schwann cells were present in 51.04% of peripheral nerve bundles in the gastrocnemius injected with ADM. O4, a marker of mature myelinating glial cells, was also detected in DiI-labeled Schwann cells, consistent with differentiation into the oligodendrocyte lineage (Fig. 2c, d). Axons, detected with an antibody to beta III tubulin, were also detected within the DiI-labeled Schwann cells (Fig. 2e, f), indicating that the DiI-labeled Schwann cells were functional.
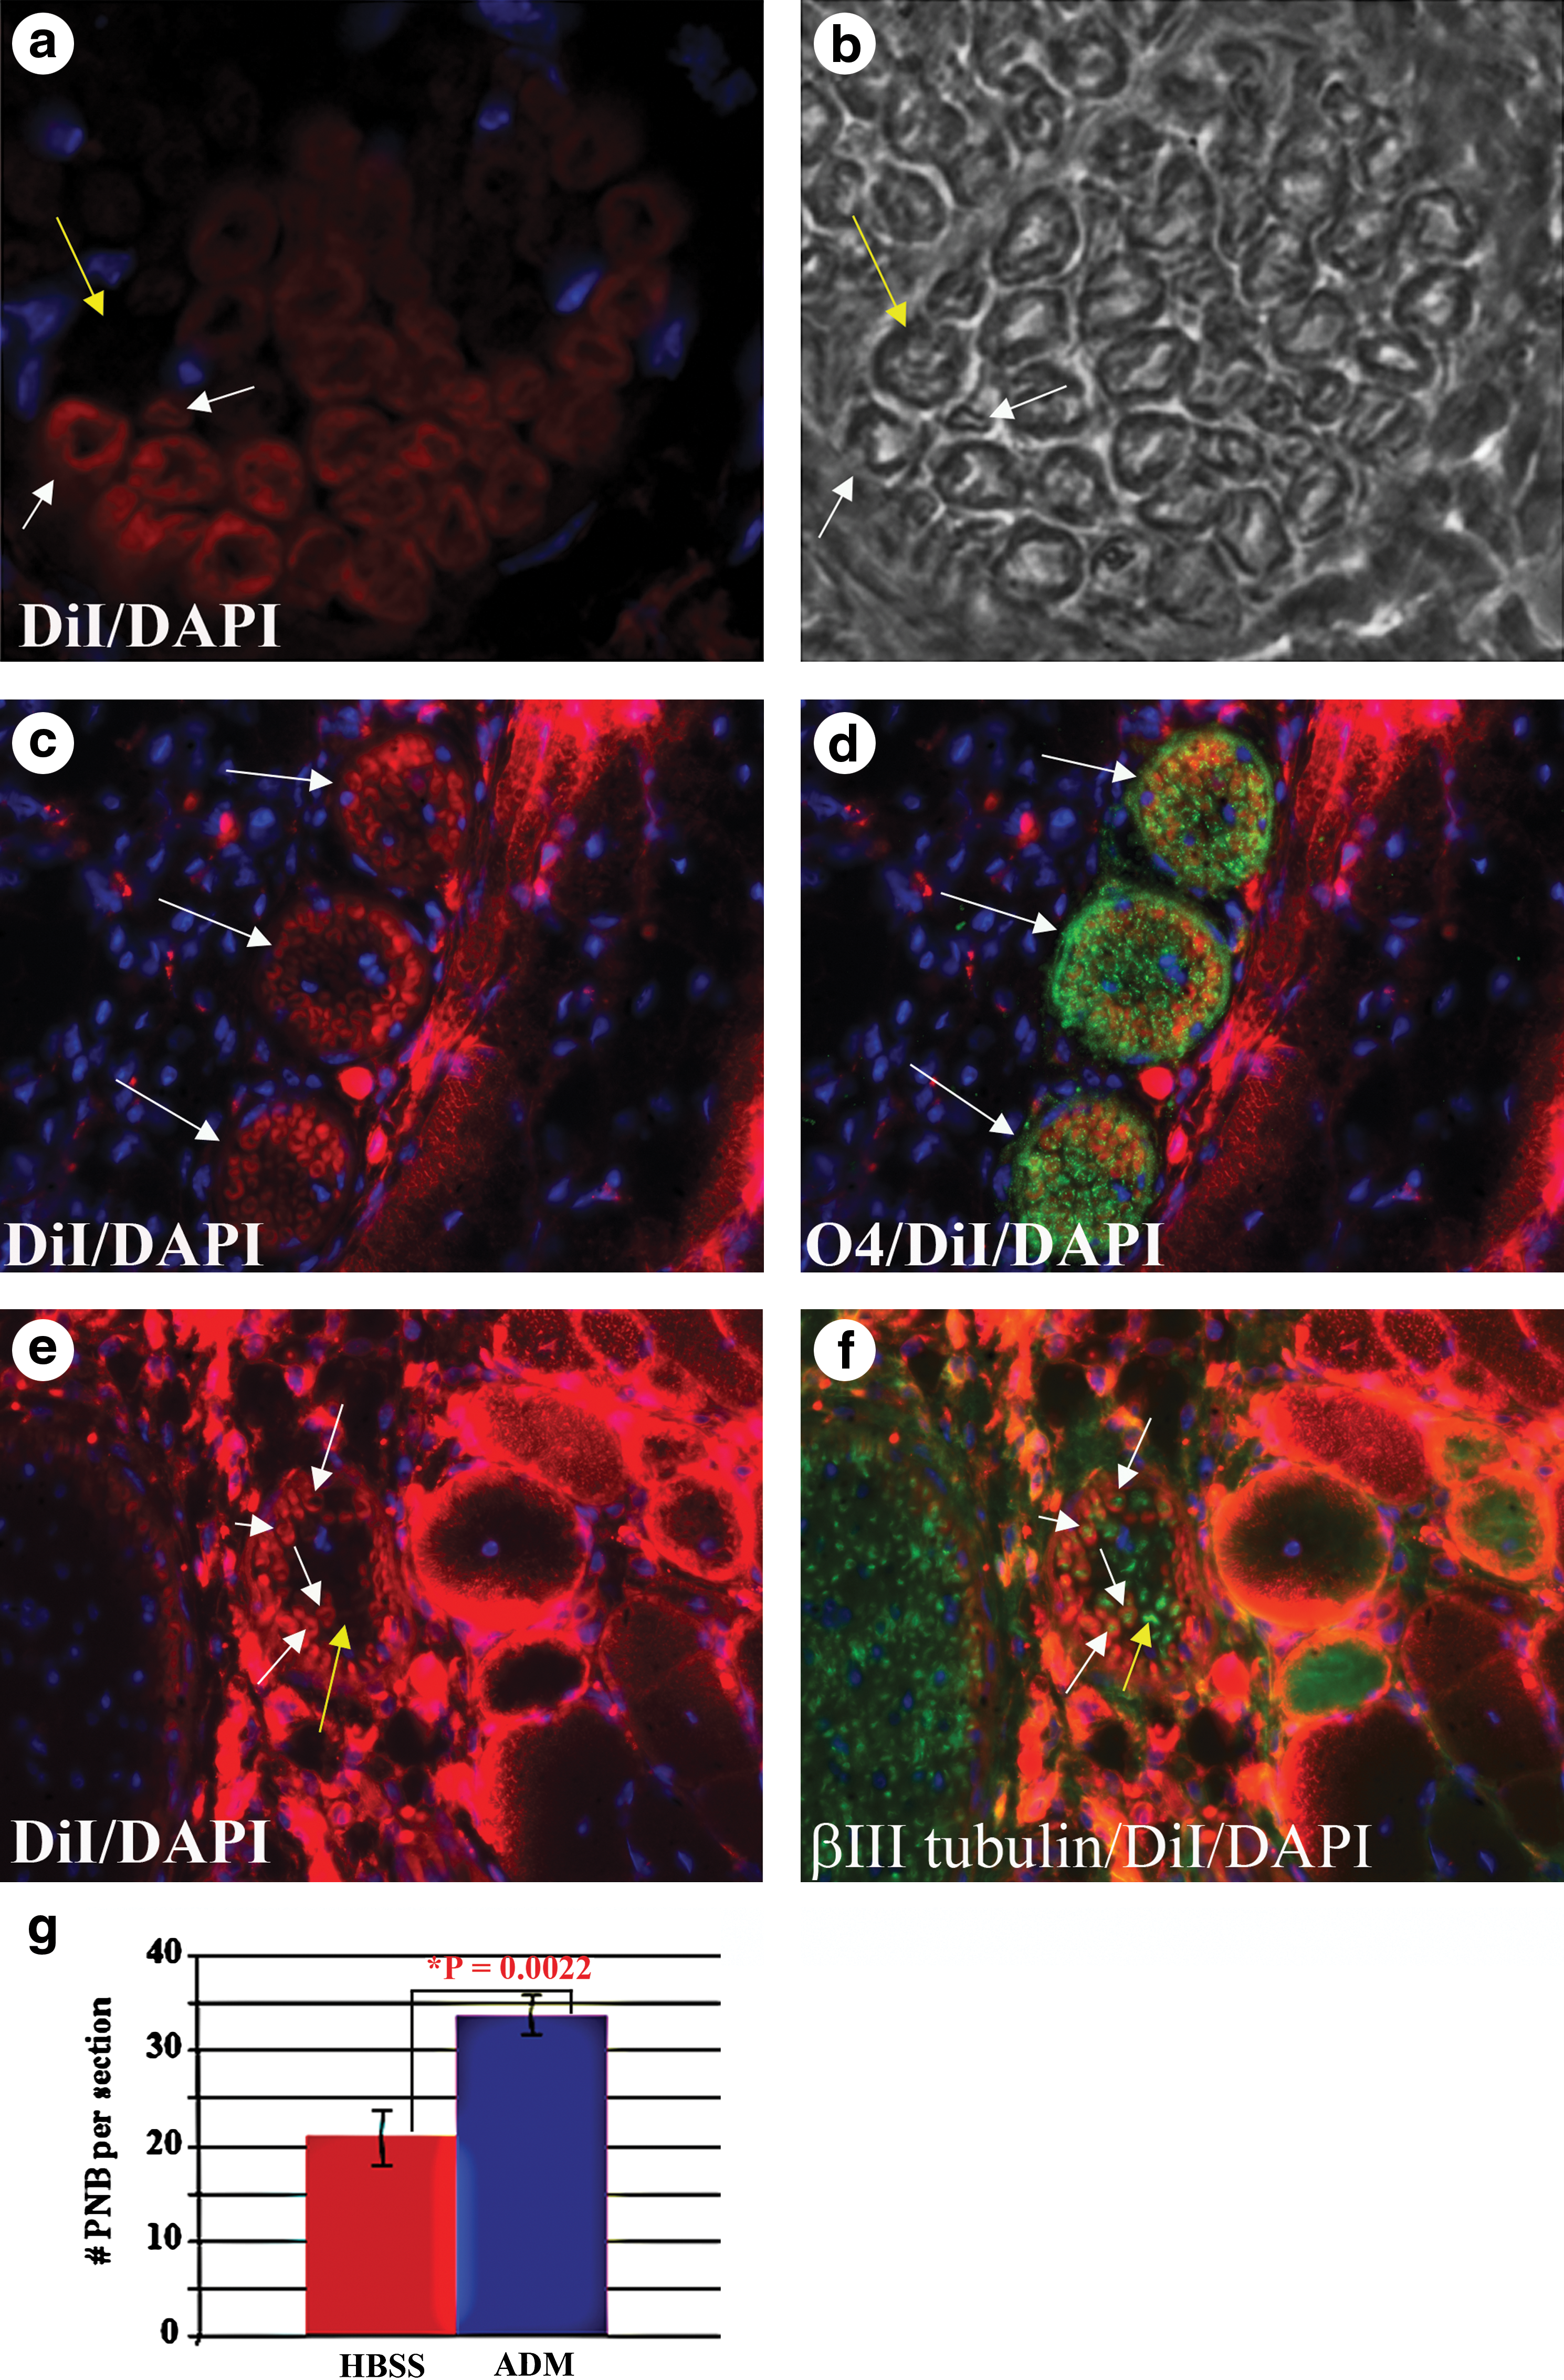
ADM differentiate into Schwann cells in peripheral nerve bundles. DiI (red)-labeled ADM were injected into the gastrocnemius of mdx/utrn−/−
mice with severe muscle disease, and DiI-labeled cells with a Schwann cell morphology were detected in peripheral nerve bundles.
DiI is not transferred from labeled cells to unlabeled cells except through cell fusion [22,23]. Although it is possible that DiI-labeled ADM fused with host Schwann cells, labeling the host cells with DiI, analysis of numbers of peripheral nerve bundles in the gastrocnemius of the mdx/utrn−/− mice revealed that there were 1.5-fold more nerve bundles in the muscle injected with ADM than in the contralateral gastrocnemius injected with saline (Fig. 2g). Although ADM may indirectly promote peripheral nerve bundle formation by release of trophic factors, but they also directly differentiate into mature functional cells in peripheral nerve bundles.
Inhibition of ROCK promotes changes in morphology, localization, and activity of ROCK
Cell culture assays were conducted to determine whether ADM have the potential to differentiate into glial cells in the absence of mature Schwann cells (Fig. 2). The tyrosine kinase ROCK promotes rearrangement of the actin cytoskeleton in neurons and glial cells in the central nervous system and prevents process extension and progenitor maturation [24,25]. Inhibition of ROCK promotes process extension and maturation of progenitors into neurons and oligodendrocytes [26 –30], and process extension and radial sorting by Schwann cells [31].
Fasudil, a specific inhibitor of ROCK, induced process extension and morphology changes in ADM, as well as in MSCs, which mature into the neural lineage in response to Fasudil [32] and were therefore used as positive controls. Branching from the cell body was observed in both ADM and MSC, although there were differences in morphology and primary branching between the 2 cell types; with a higher number of primary branches proceeding from the cell body of ADM plated on polysine (Fig. 3b, d, g), and secondary and tertiary branching (Fig. 3b, d), similar to NG2+ polydendrocytes and oligodendrocytes in the central nervous system (CNS) [33 –35]. In contrast, process formation by MSC was predominantly between 2 and 4 branches from the cell body when cultured on polylysine or gelatin substrate (Fig. 3b, g). These 2 cell populations also responded differentially to substrate. Process formation and primary branching of ADM, but not MSC, was enhanced on poly-L-lysine, a positively charged polymer commonly used to support culture of neural cells in comparison to culture on gelatin (Fig. 3g). Approximately 21% of ADM exhibit 5 or more branches when cultured on gelatin with glial medium, but 44% of ADM exhibit 5 or more branches when cultured on poly-L-lysine (P=0.0017). Some ADM did not exhibit branching, and thus the totals for ADM with 2–4 branches and ADM with ≥5 branches do not total 100% of the ADM in Fig. 3g. As another positive control for Fasudil-mediated process extension PC12 cells that spontaneously express neural proteins and differentiate into neurons in response to inhibition of ROCK [32] were used. Fasudil also induced branching in PC12 cells, but no change in morphology of CHO cells, which do not express neural proteins or differentiate into neural or glial cells (data not shown, Fig. 3e, f). The lack of response by CHO cells indicates that changes in morphology in ADM, MSC, and PC12 cells were not the result of a nonspecific stress response [36,37].
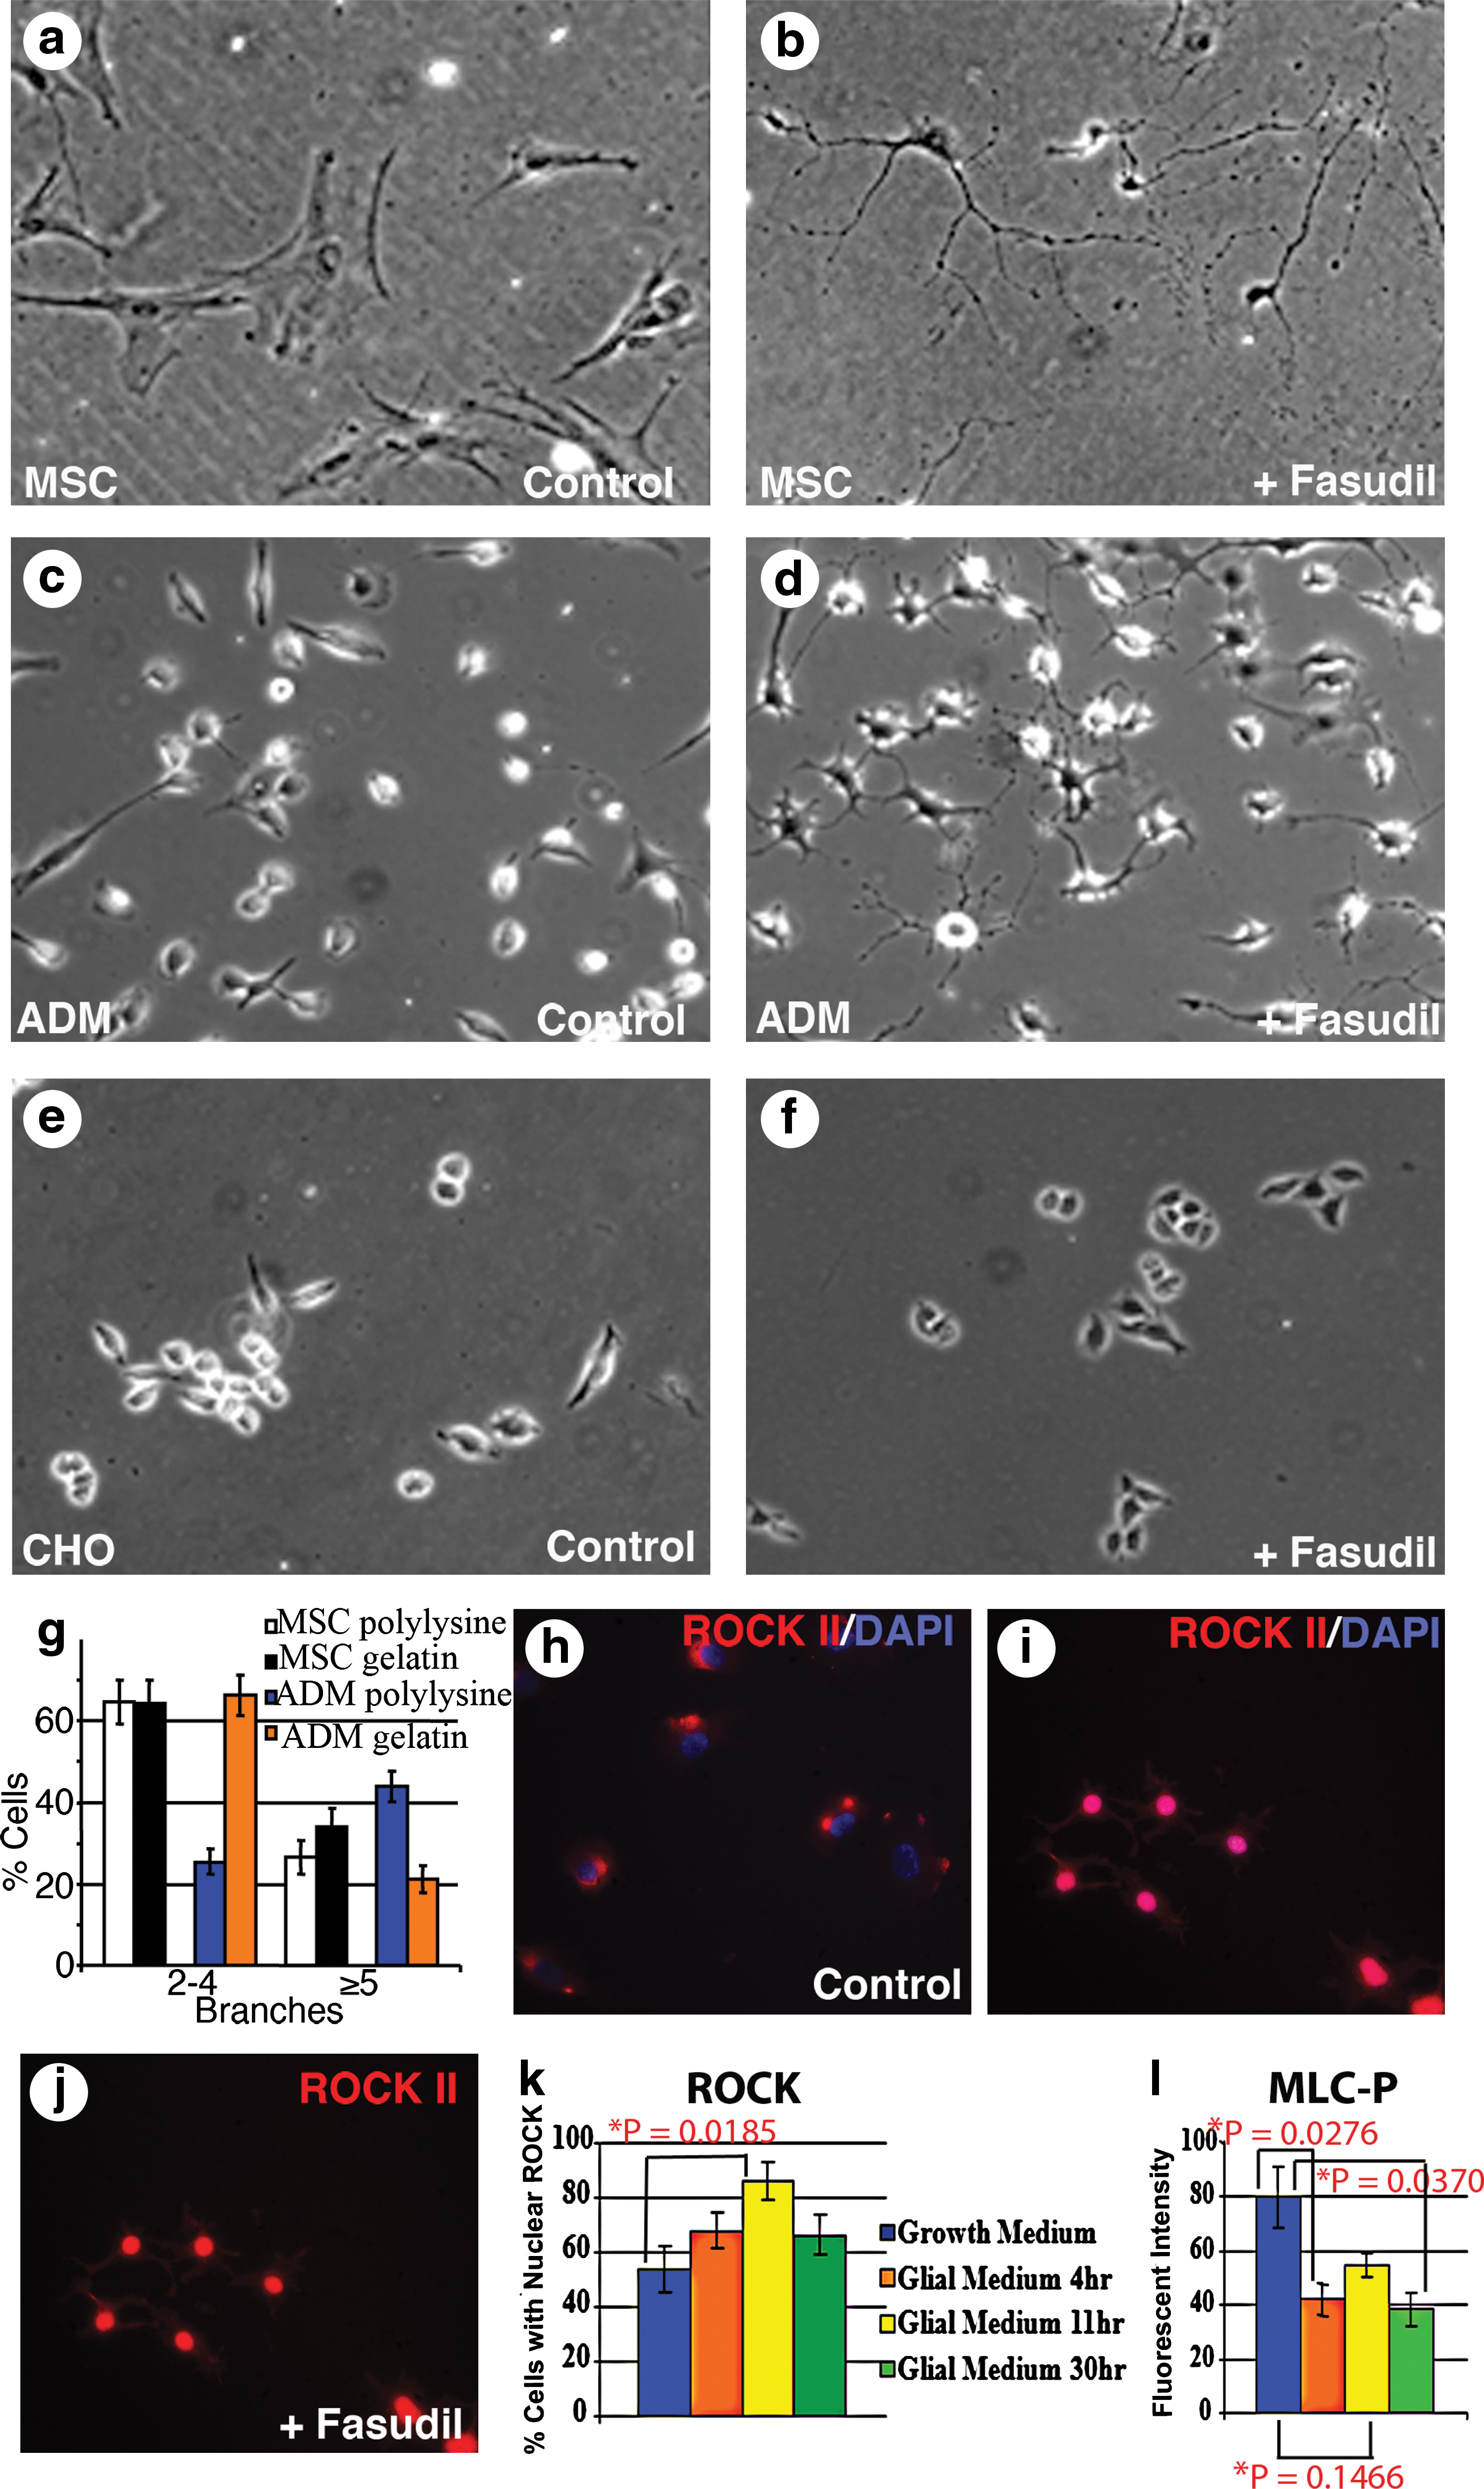
Inhibition of Rho kinase (ROCK) promotes process extension by MSC and ADM, but not CHO cells. The ROCK inhibitor Fasudil promotes process extension from the cell body of MSCs,
ROCK localization and phosphorylation of the effector MLC was used to confirm ROCK inhibition by Fasudil [38 –40]. ROCK1 transcripts are ubiquitous with the exception of the brain and muscle tissue, whereas ROCK2 is expressed in the brain, muscle, lung, and placenta [41]. Using an antibody for ROCK2 that does not cross-react with ROCK1, we confirmed that both MSC and ADM express the ROCK2 isoform (Fig. 3h–l, and data not shown). Fasudil binds ROCK, preventing RhoA/ROCK signaling. Exposure of ADM and MSC to Fasudil results in translocation of ROCK2 to the nucleus, with changes in localization corresponding to the branching morphology of ADM (Fig. 3, compare h–k). There was an increase in the percentage of ADM with nuclear ROCK from 4 to 11 h after addition of medium with Fasudil (P=0.0185). This corresponds to timing of development of branching in ADM, with primary, secondary, and tertiary branches developing by 12 h after the addition of medium with Fasudil. Nuclear localization of ROCK2 has been shown to occur during epithelial to mesenchymal transdifferentiation to regulate transcription of cell cycle regulatory proteins [42 –44], and may therefore be associated with the process of differentiation of ADM as well. Addition of medium containing Fasudil also resulted in a decrease in phosphorylation of the ROCK effector MLC (Fig. 3l).
Fasudil promotes neural differentiation of MSCs and oligodendrocyte differentiation of ADM
We examined markers of neural and glial cells to determine whether Fasudil-mediated changes in morphology in MSC, PC12, and ADM correlate with expression of cell-specific markers. We examined expression of nestin, a marker of neural [45,46] and oligodendrocyte [47,48] progenitor cells, beta III tubulin, present in mature neurons, and NG2, a marker of OP [reviewed in Ref. 35]. We also examined expression of these markers in the S16 Schwann cell line, as a positive control for glial markers and a negative control for neural markers. MSC, PC12 cells, ADM, and S16 cells all express nestin (Fig. 4a–c). In agreement with previous results [49], some adipose-derived MSC (36.87%±13.70%) and PC12 cells (6.97%±4.02%) spontaneously expressed beta III tubulin in GM (Fig. 4f, e, respectively). After treatment with Fasudil, the number of MSC expressing beta III tubulin increased to 75.34%±13.55% (Fig. 4j) and the number of PC12 cells expressing beta III tubulin increased to 45.34%±5.92% (Fig. 4i). Placenta-derived MSC also expressed betaIII tubulin in GM (21.62%±4%) and have increased levels of betaIII tubulin in medium with Fasudil (87.23%±3.33%) In contrast, <1% of ADM express beta III tubulin in either GM or in response to treatment with Fasudil (Fig. 4g, k). NG2 is detected on approximately 48.55%±5.60% of ADM in GM (4o), and at low levels in some S16 cells,and increases to 87.99%±2.75% in ADM after treatment with Fasudil (Fig. 4s). In contrast, NG2 is not detected in MSC or PC12 cells in either GM or after ROCK inhibition (Fig. 4n, r, MSC, Fig. 4m, q, PC12).
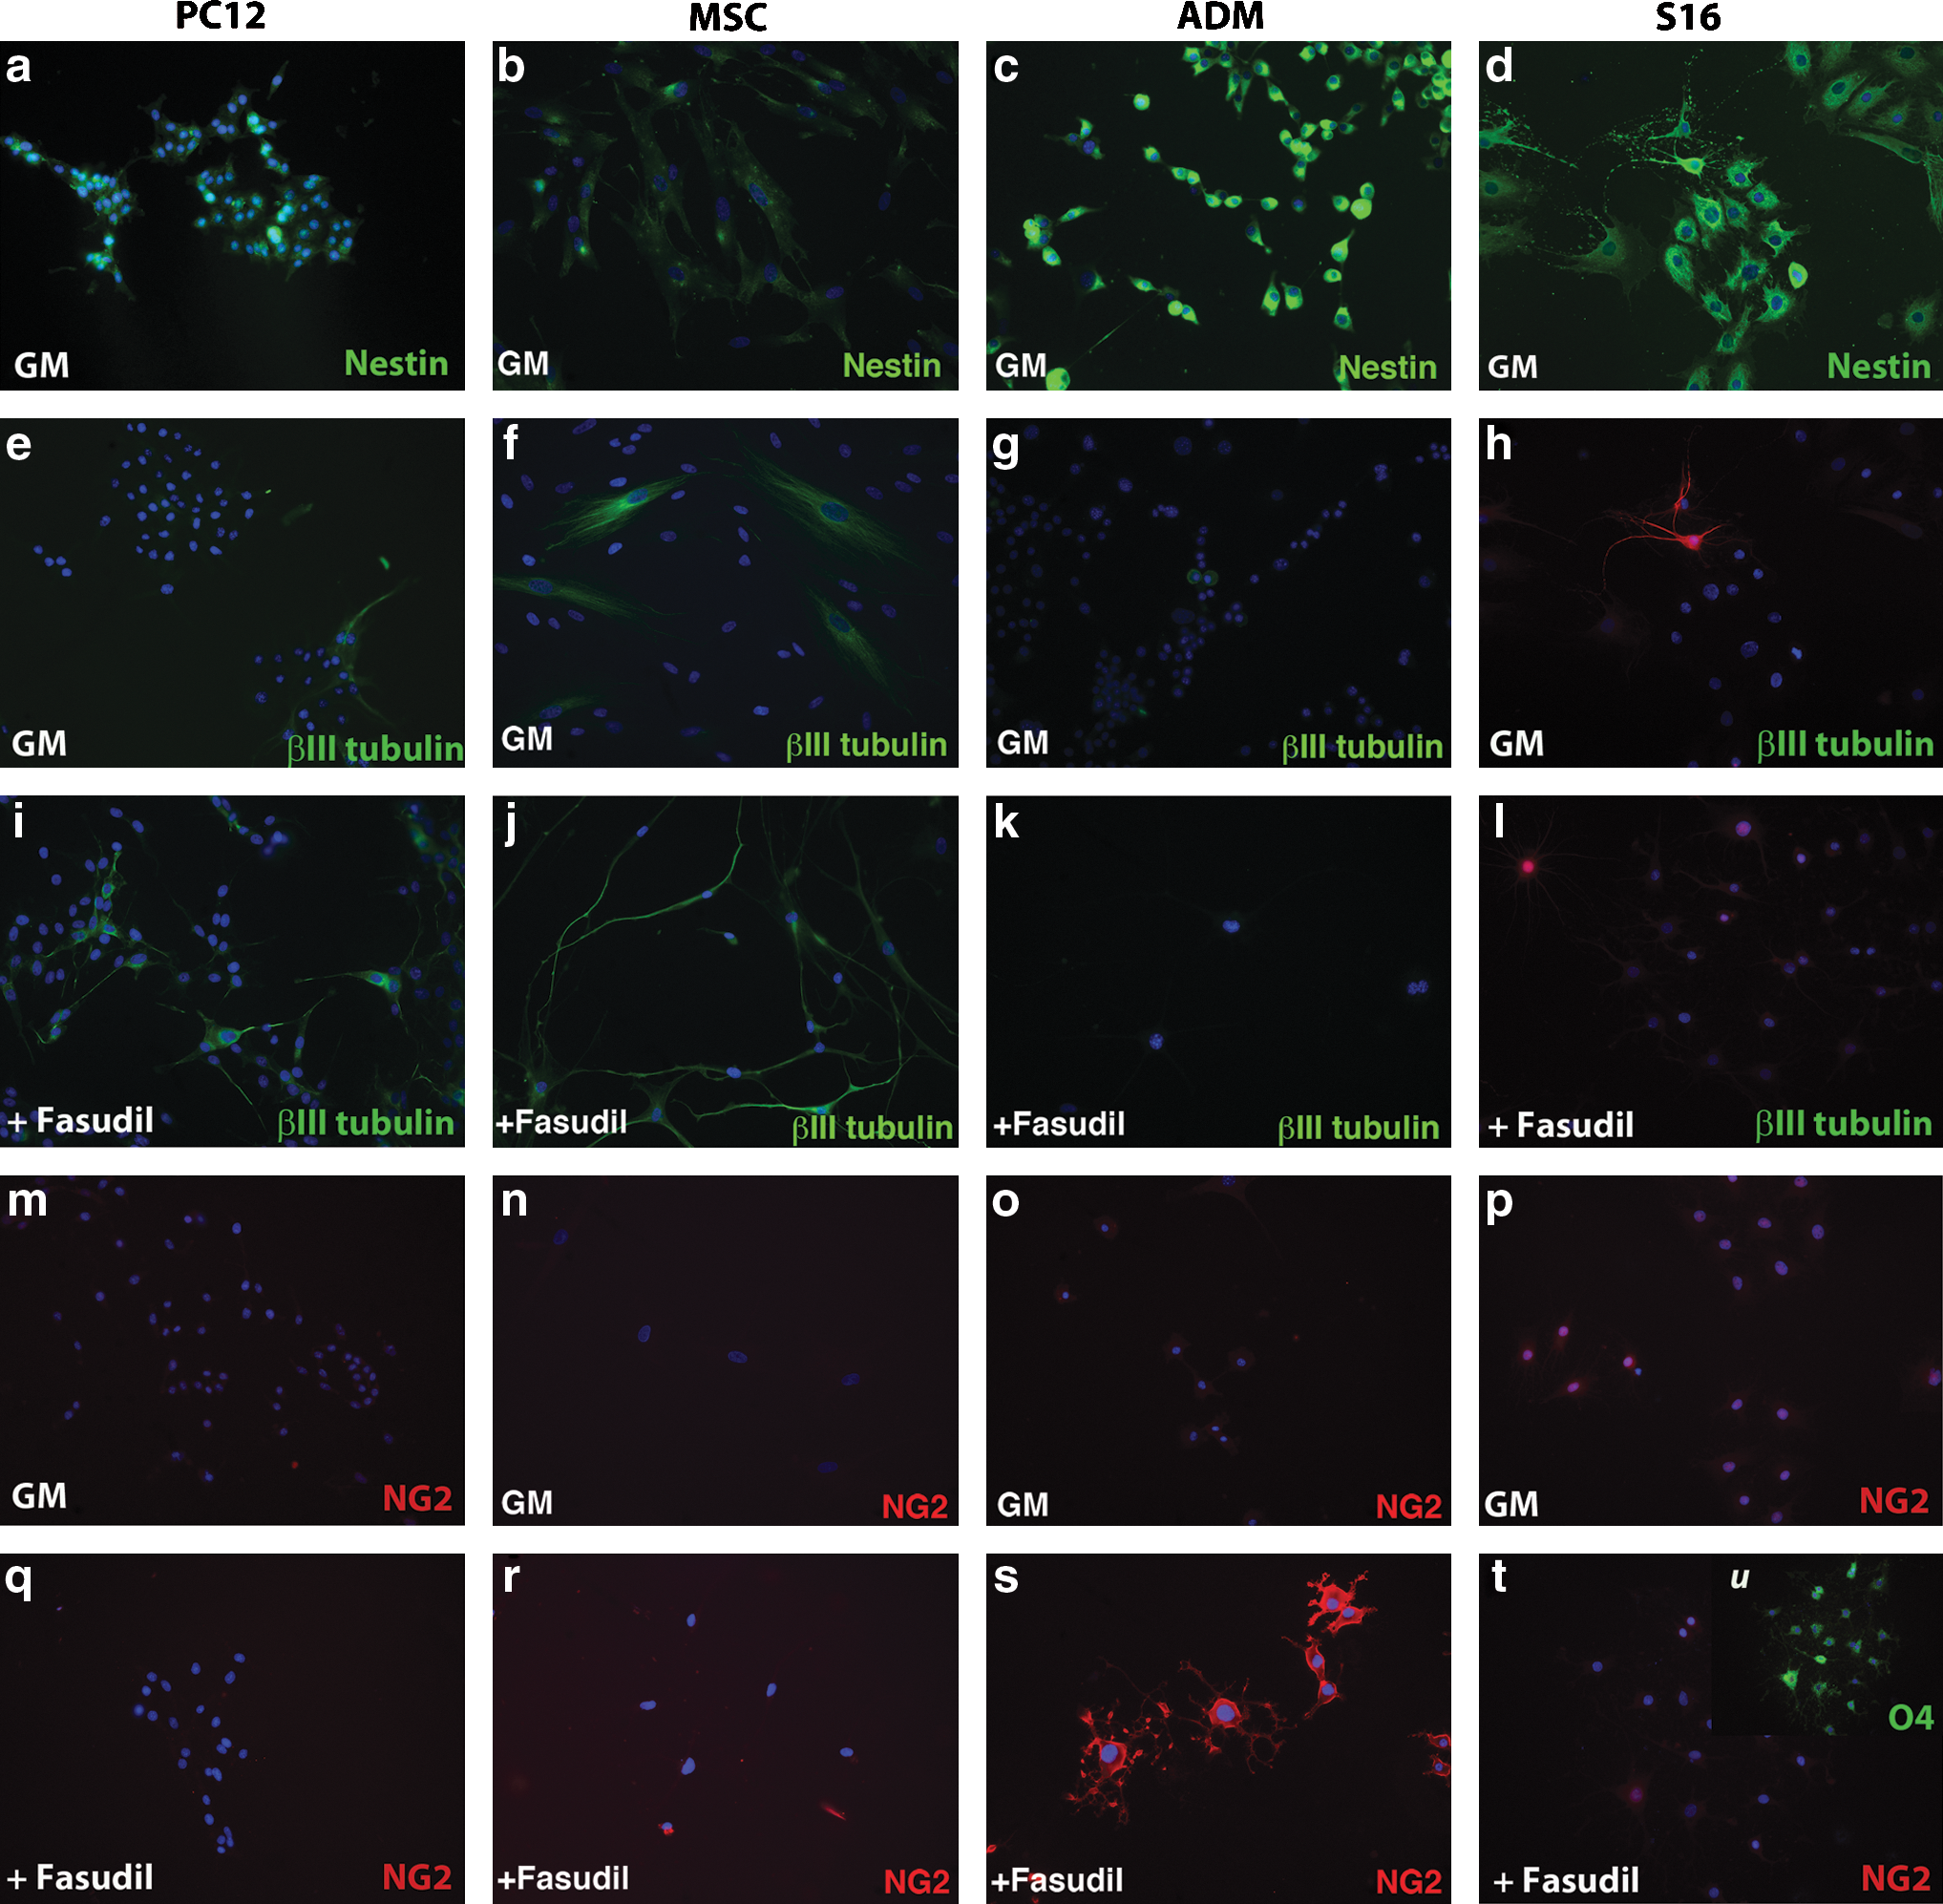
Treatment with a ROCK inhibitor promotes differentiation into the neuronal lineage by MSC and the oligodendrocyte lineage by ADM.
ADM express markers of oligodendrocyte precursor cells
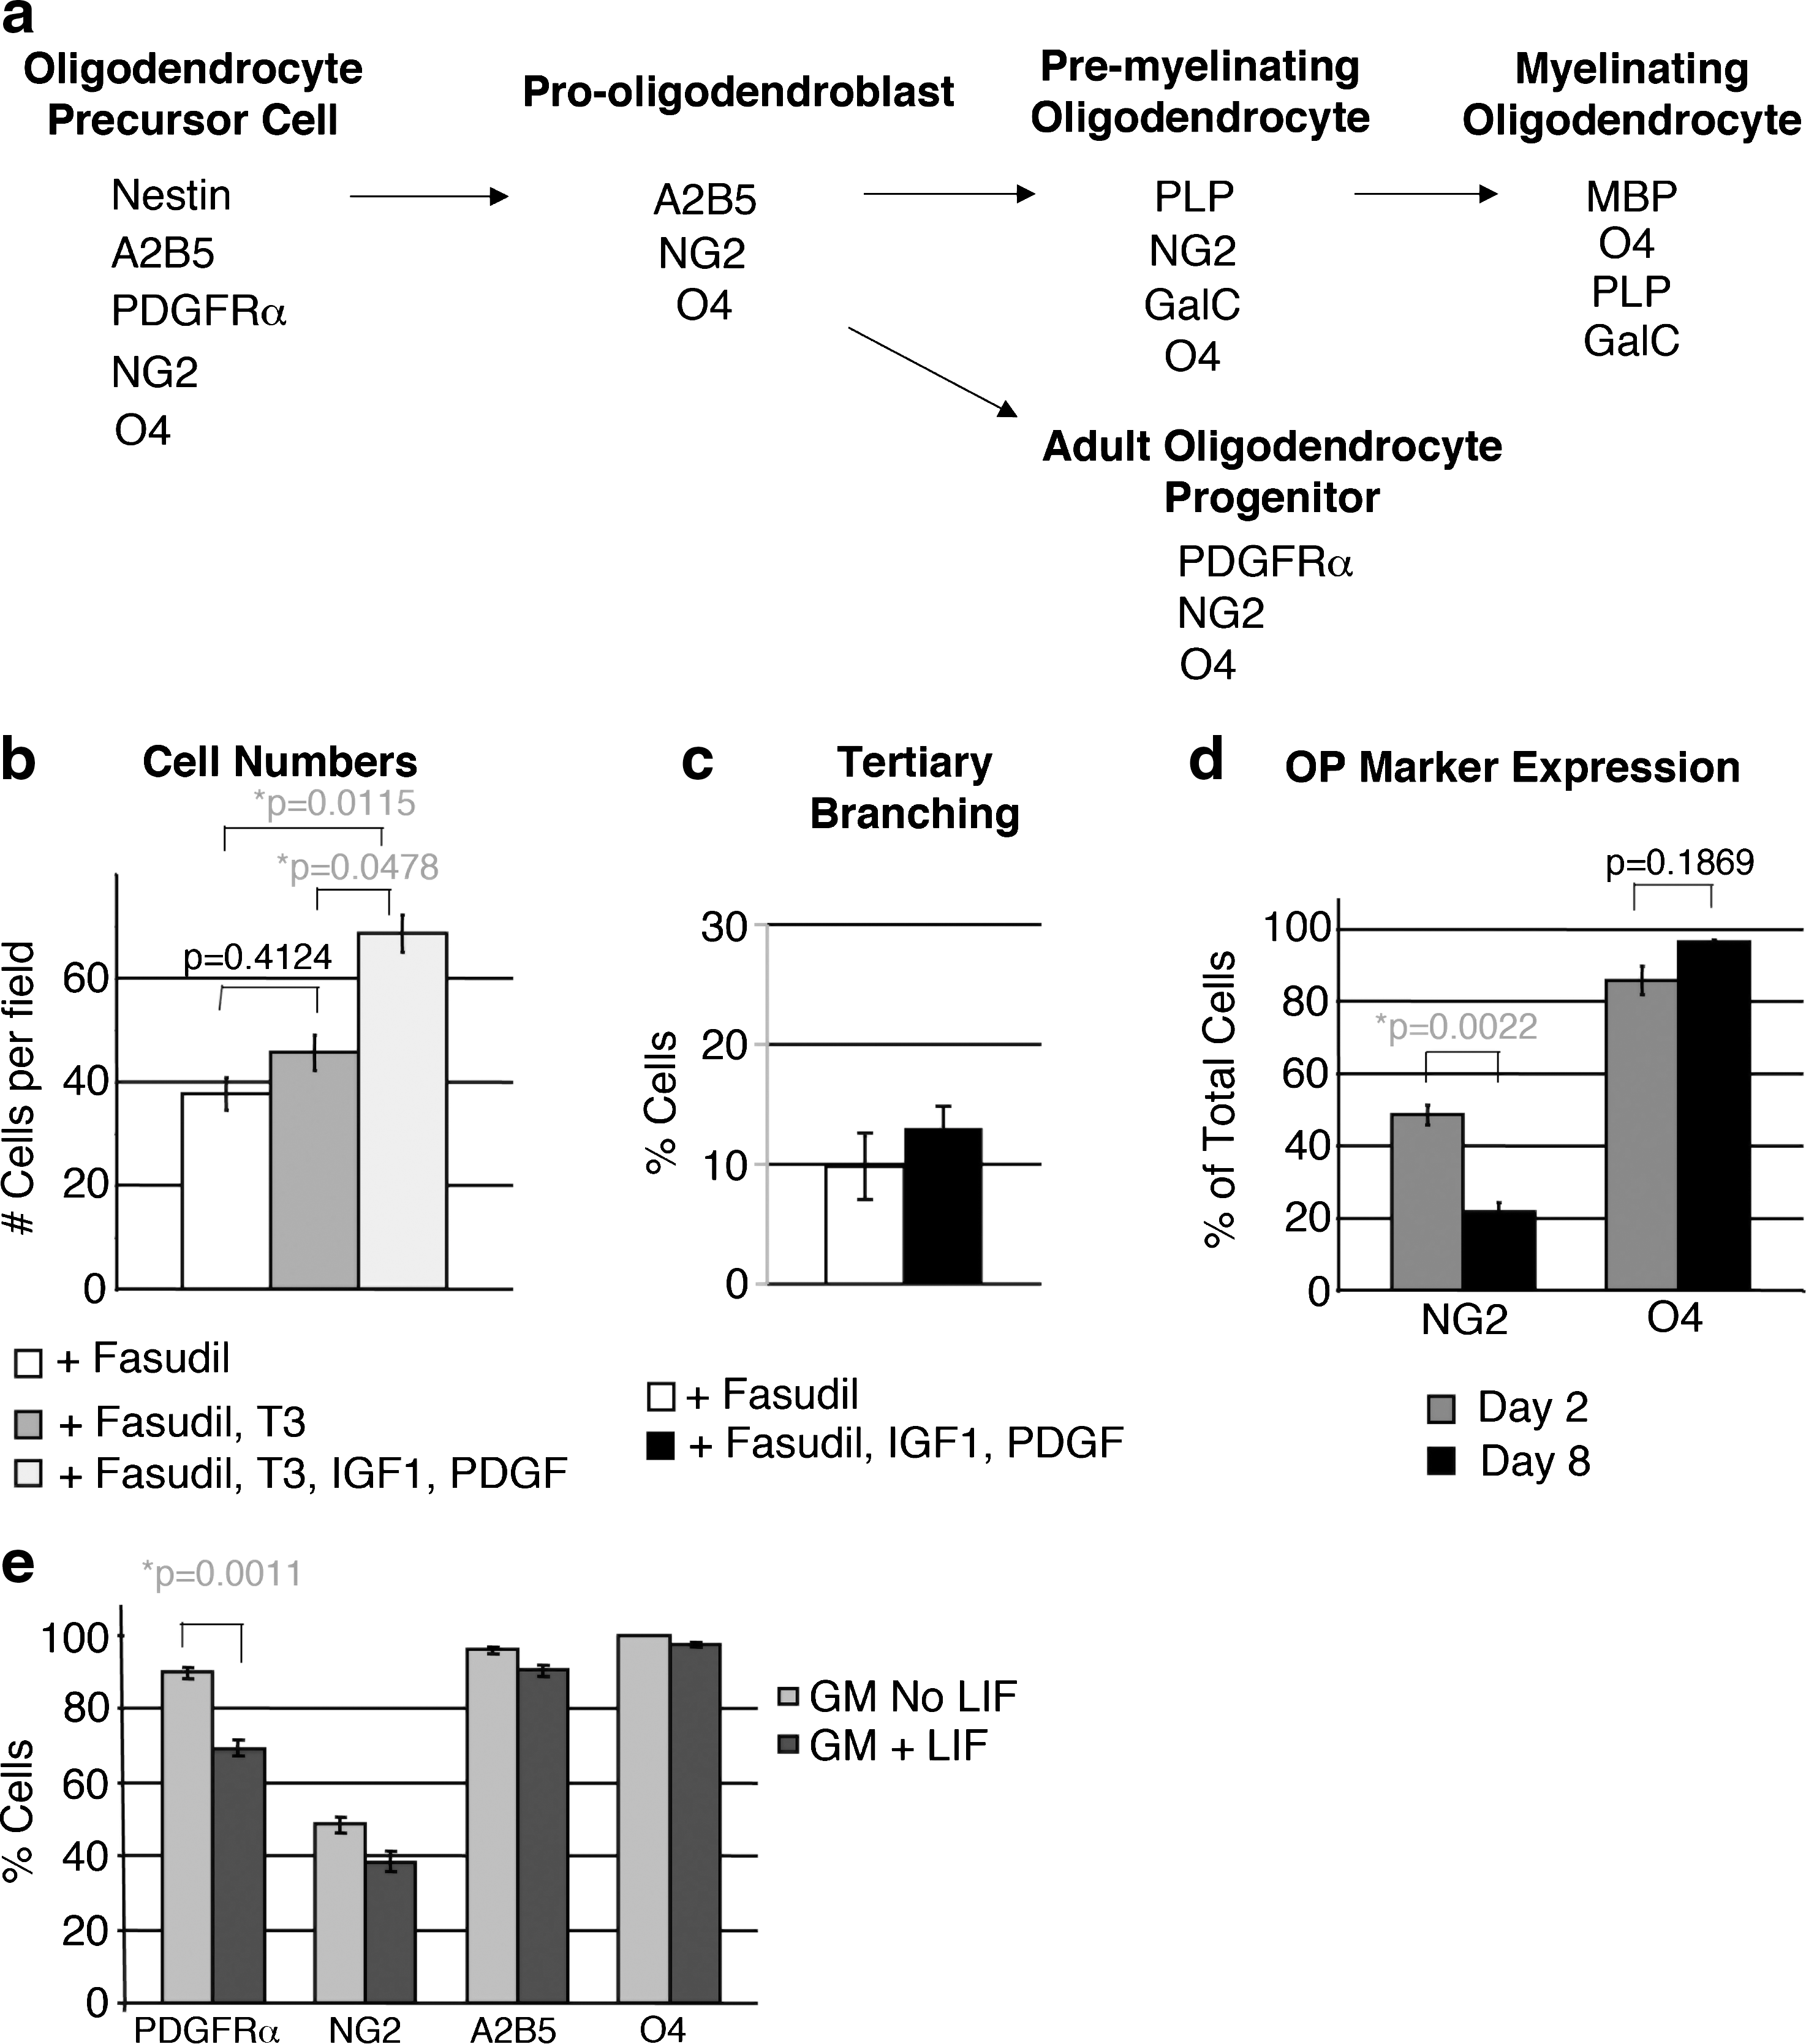
Because ADM expressed NG2 and exhibited morphology similar to OP, we examined them for expression of additional OP markers. Markers of OP are well characterized, as are corresponding changes in markers as cells progress from preprogenitors to mature oligodendrocytes [reviewed in Ref. 35]. The PDGFRα is detected on all OP cells in the central nervous system [50], and studies of PDGFRα knockout mice demonstrated that all oligodendrocytes in the CNS arise from PDGFRα-expressing cells [51]. Unlike other OP markers, the PDGFRα is only detected on oligodendrocyte progenitor cells and not on neural progenitor cells [52]. The PDGFRα was detected on 89.6% of ADM (Fig. 5a, i) in GM, in a punctuate pattern on the cell surface, similar to OP cells from spinal cord [50], and in 97.1% of ADM after addition of glial medium (Fig. 5b, i).
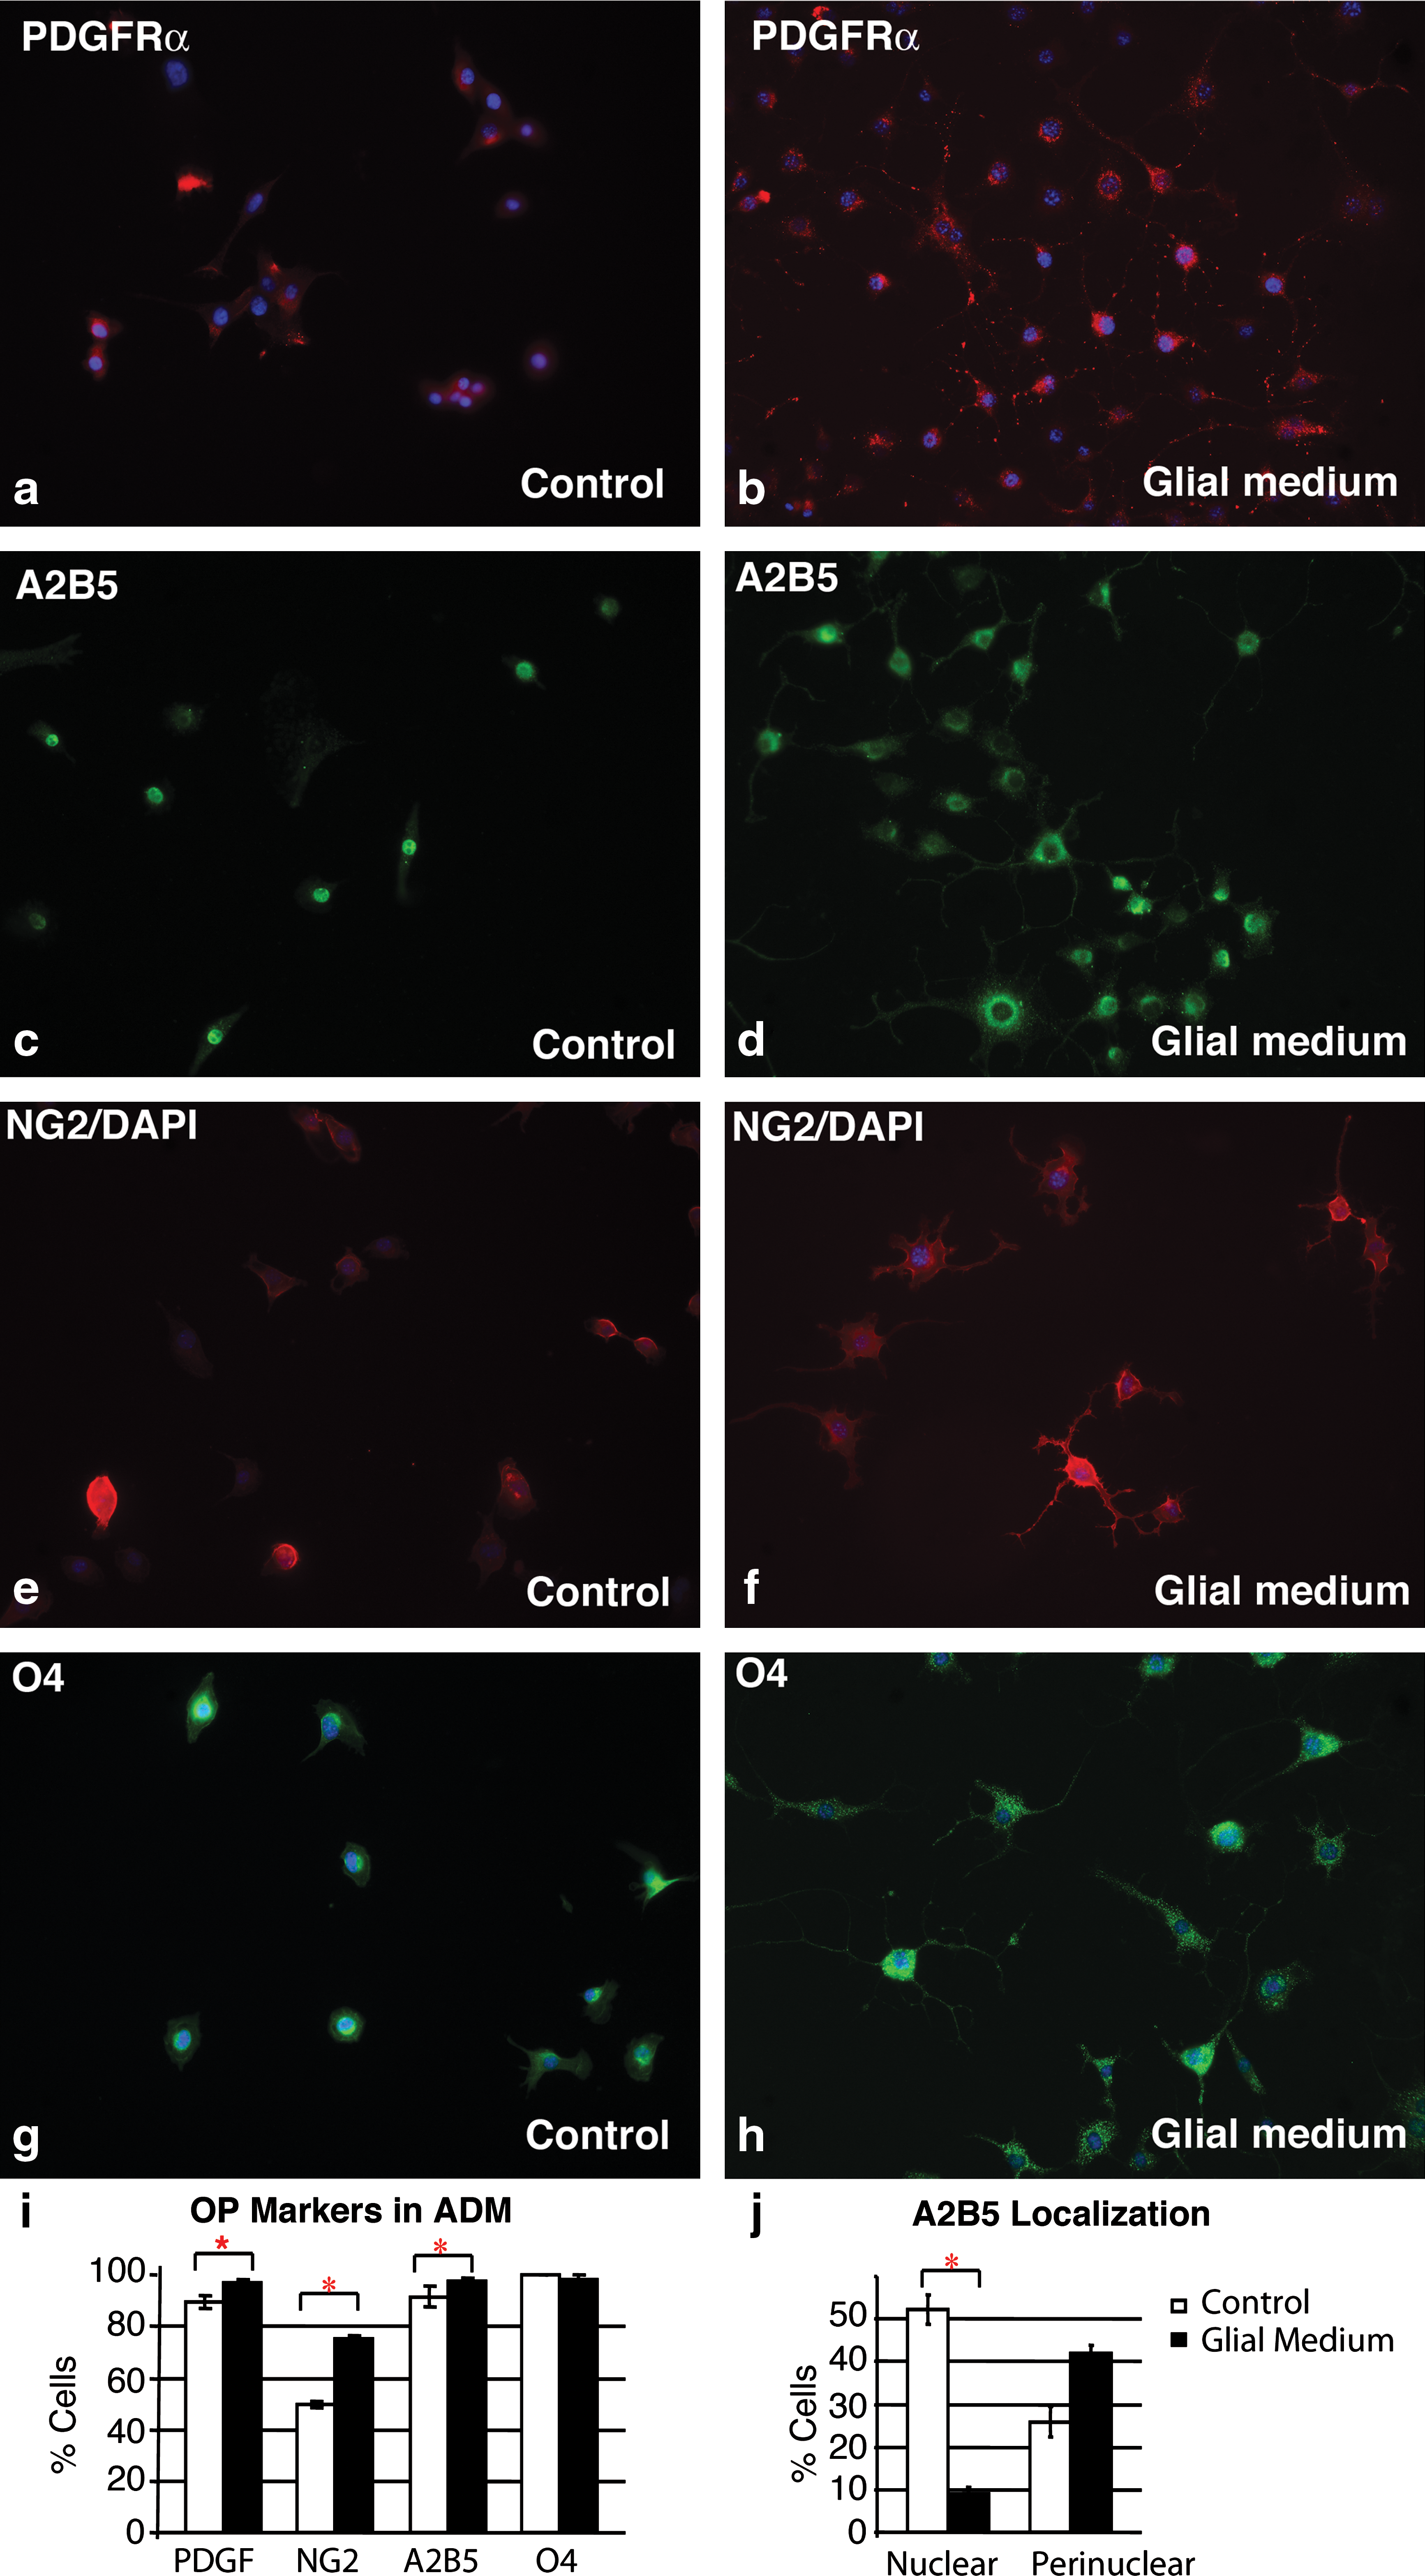
ADM express markers of oligodendrocyte precursor cells.
ADM also express the A2B5 antigen. Oligodendrocyte precursor cells were originally identified based on the expression of a class GQ, ganglioside recognized by the A2B5 antibody [34,53] in vitro and in vivo. All PDGFRα-expressing OP cells coexpress the A2B5 antigen [50]. Similar to CNS-derived OP cells, most ADM expressed both markers. ADM express the A2B5 antigen when maintained in GM (89.5%), and after addition of Fasudil (97.5%; Fig. 5c, d, i). The A2B5 antigen is localized to the nucleus in approximately 51% of ADM cultured in GM, but in only 10% of ADM after addition of Fasudil (Fig. 5c, d, j). In contrast, there was an increase in ADM with perinuclear localization of the A2B5 antigen after addition of Fasudil (Fig. 5c, d, j). Localization of the A2B5 antigen to the nucleus or the perinuclear region was not mutually exclusive; some cells expressed A2B5 in both the nuclear and perinuclear regions, or in the nuclear and cytosolic regions. Both nuclear and cytosolic patterns of localization have been observed previously in neural and glial cells [53,54], and changes in expression level and localization of other gangliosides in neural cells are involved in neurite outgrowth [55] and correlate with neural differentiation [55,56]. Our data demonstrate that the A2B5 antigen also relocalizes during oligodendrocyte differentiation.
The chondroitin sulfate proteoglycan NG2 is another marker of OP cells in vitro and in vivo, and fate tracing studies have revealed that cells coexpressing PDGFRα and NG2 proteoglycan give rise to myelinating glial cells in vivo [57]. ADM also express NG2 on the cell surface when cultured in GM (49.8%; Fig. 5e, i), and coexpress the PDGFRα (46% express both markers). Incubation of ADM with glial medium containing Fasudil caused an increase in the number of ADM expressing NG2 to 76.59% (Fig. 5f, i), and the number of ADM coexpressing the PDGFRα and NG2 to 76.59%. ADM also expressed the O4 antigen, a sulfatide present on the surface of late stage OP cells and mature oligodendrocytes. All ADM express the O4 antigen in GM, in the characteristic perinuclear pattern of OP cells and mature oligodendrocytes, and 98.18% of ADM express the antigen after treatment with Fasudil (Fig. 5g–i).
All OP markers examined were present on ADM in vitro, in GM and in glial differentiation medium. However, results in vivo were different: after injection into skeletal muscle, only ADM that were localized to peripheral nerve bundles (Fig. 2b–f), expressed markers of mature myelinating glial cells.
ADM express the TRα and exhibit increased tertiary branching with T3
The marker profile of OP cells during different stages of maturation is well characterized [reviewed in Ref. 34,35]. Oligodendrocyte progenitor cells from the central nervous system that express nestin, PDGFRα, NG2, and the antigens for A2B5 and O4 mature to oligodendrocytes in response to thyroid hormone (TH) [58 –60]. T3, the active form of TH, promotes oligodendrocyte maturation by binding nuclear receptors for TH (TR) that drive expression of oligodendrocyte-specific genes such as myelin basic protein, and repress transcription of genes that promote proliferation, such as E2F [61,62]. TRs are encoded by 2 genes, α (TRα) and β (TRβ), that bind T3. Both TRα and TRβ are present in oligodendrocyte precursors and mature oligodendrocytes, but TRα progressively decreases as OP cells mature into oligodendrocytes, and it is therefore primarily a marker of OP cells [63]. TRα was detected in the nucleus of ADM cultured in GM, in a punctate staining pattern that colocalized with DAPI (Fig. 6a, b) and EtBr (Fig. 6c–e). T3 promotes increased complexity of branching in ADM, indicating maturation into the oligodendrocyte lineage (Fig. 6f–h). Tertiary branching of ADM, but not primary or secondary branching, increased by nearly 3-fold (10% to 30%) after addition of T3 (Fig. 6g, h).

ADM express the nuclear receptor for thyroid hormone and exhibit an increase in branching complexity in response to thyroid hormone.
IGF1 and PDGF prevent decline in ADM cell numbers during differentiation and allow maturation
We observed a decline in the numbers of ADM after exposure to Fasudil, as the cells exhibited characteristics of oligodendrocyte maturation, in comparison to cells in GM. It is possible that the ADM in Fasudil-medium simply stopped cycling to differentiate and therefore were present in lower numbers than ADM in GM, which continued to cycle. However, it is also possible that ADM in Fasudil-medium were declining as a result of cell death. Programmed cell death plays an important role in CNS development [64]. Oligodendrocytes undergo programmed cell death during development unless they are exposed to factors produced by astrocytes and neurons, as a mechanism to ensure that appropriate numbers of myelinating glial cells are present as needed for functioning neurons and axons, and for establishing the correct time for oligodendrocyte differentiation [65,66]. Because IGF1 and PDGF promote survival of oligodendrocyte preprogenitors, precursors, and mature oligodendrocytes from the CNS [59,66], we examined whether addition of these factors, produced by astrocytes and neurons in vivo, prevented the decline in the number of ADM in Fasduil-containing medium in vitro. Addition of these factors to the culture medium enhanced the numbers of ADM (Fig. 7b) but did not affect branching complexity (Fig. 7c). These data indicate that IGF1 and PDGF promote cell survival or may also promote proliferation of ADM. Addition of these factors allowed extended culture of ADM in glial medium, after which they exhibited a change in OP markers consistent with oligodendrocyte differentiation or maturation (Fig. 7a, d). The proteoglycan NG2, present during the early stages of differentiation, was detected on 73.4% of ADM within 48 h of treatment with glial medium, but only on 21.7% of ADM by 8 days in glial medium with IGF1 and PDGF (Fig. 7d), consistent with maturation of ADM into oligodendrocytes [reviewed in Refs. 34,35]. In contrast, O4, expressed during the later stages of oligodendrocyte differentiation (premyelinating), and by mature oligodendrocytes (myelinating, Fig. 7a), was still detected in ADM by 8 days in glial medium in a similar number of cells (Fig. 7d).
The effect of IGF1, PDGF, and LIF on ADM expression of OP markers and maturation into the oligodendrocyte lineage.
Effect of LIF on ADM expression of OP markers
LIF promotes the generation and maturation of oligodendrocytes from OP [67]. However, LIF also promotes proliferation and prevents differentiation of mouse stem cells [68,69]. We had isolated and expanded ADM in medium supplemented with LIF because this condition promoted maintenance of stem cell marker expression and differentiation potential of the ADM in the absence of feeder cells [1]. It was therefore of interest to determine whether LIF would promote maturation of ADM, or whether maintenance of ADM in medium containing LIF had potentially guided mesoangioblasts into the oligodendrocyte lineage. Of note, ADM do not exhibit branching from the cell body when cultured with LIF [1] (Fig. 3). We examined OP markers in ADM cultured with or without LIF, and found that LIF did not significantly alter expression of OP markers, although there was a decrease in the number of cells expressing the A2B5 antigen, the PDGFRα, and NG2 when ADM were cultured with LIF (Fig. 7e). There was no change in the number of cells expressing the O4 antigen. These data indicate that LIF does not promote maturation of clonally derived ADM into the oligodendrocyte lineage.
ADM migrate to regions of white matter and express markers of mature myelinating glial cells in the brain after intracerebroventricular injection
To determine whether ADM also differentiate into myelinating glial cells in the central nervous system, we injected DiI-labeled cells into the right lateral ventricle of the brain (Fig. 8h). Nearly all detectable ADM were localized to regions of white matter in the right side of the brain 5 weeks after injection, although some donor cells also migrated to the visual cortex (Fig. 8h). Many ADM were localized within the corpus callosum (Fig. 9a–d), or had migrated to the cerebellum and were detected at the periphery of the white matter (Fig. 8a–g). ADM detected in both regions of white matter frequently expressed GalC, a component of myelin (Figs. 8c, d, f, g and 9a, c, d) and O4, a mid- to late-stage marker of oligodendrocytes (Fig. 9e). ADM localizing to these regions of white matter did not express NG2, the early-stage marker of oligodendrocytes (Fig. 9e). In contrast, ADM localized to the visual cortex expressed NG2 in the highest numbers (approximately 50% of ADM in the visual cortex, Fig. 8h), but O4 and GalC were also detected in approximately 20% of the donor cells in this region (Fig. 9e).

ADM localize to regions of white matter in the cerebellum and express GalC after intracerebroventricular injection.
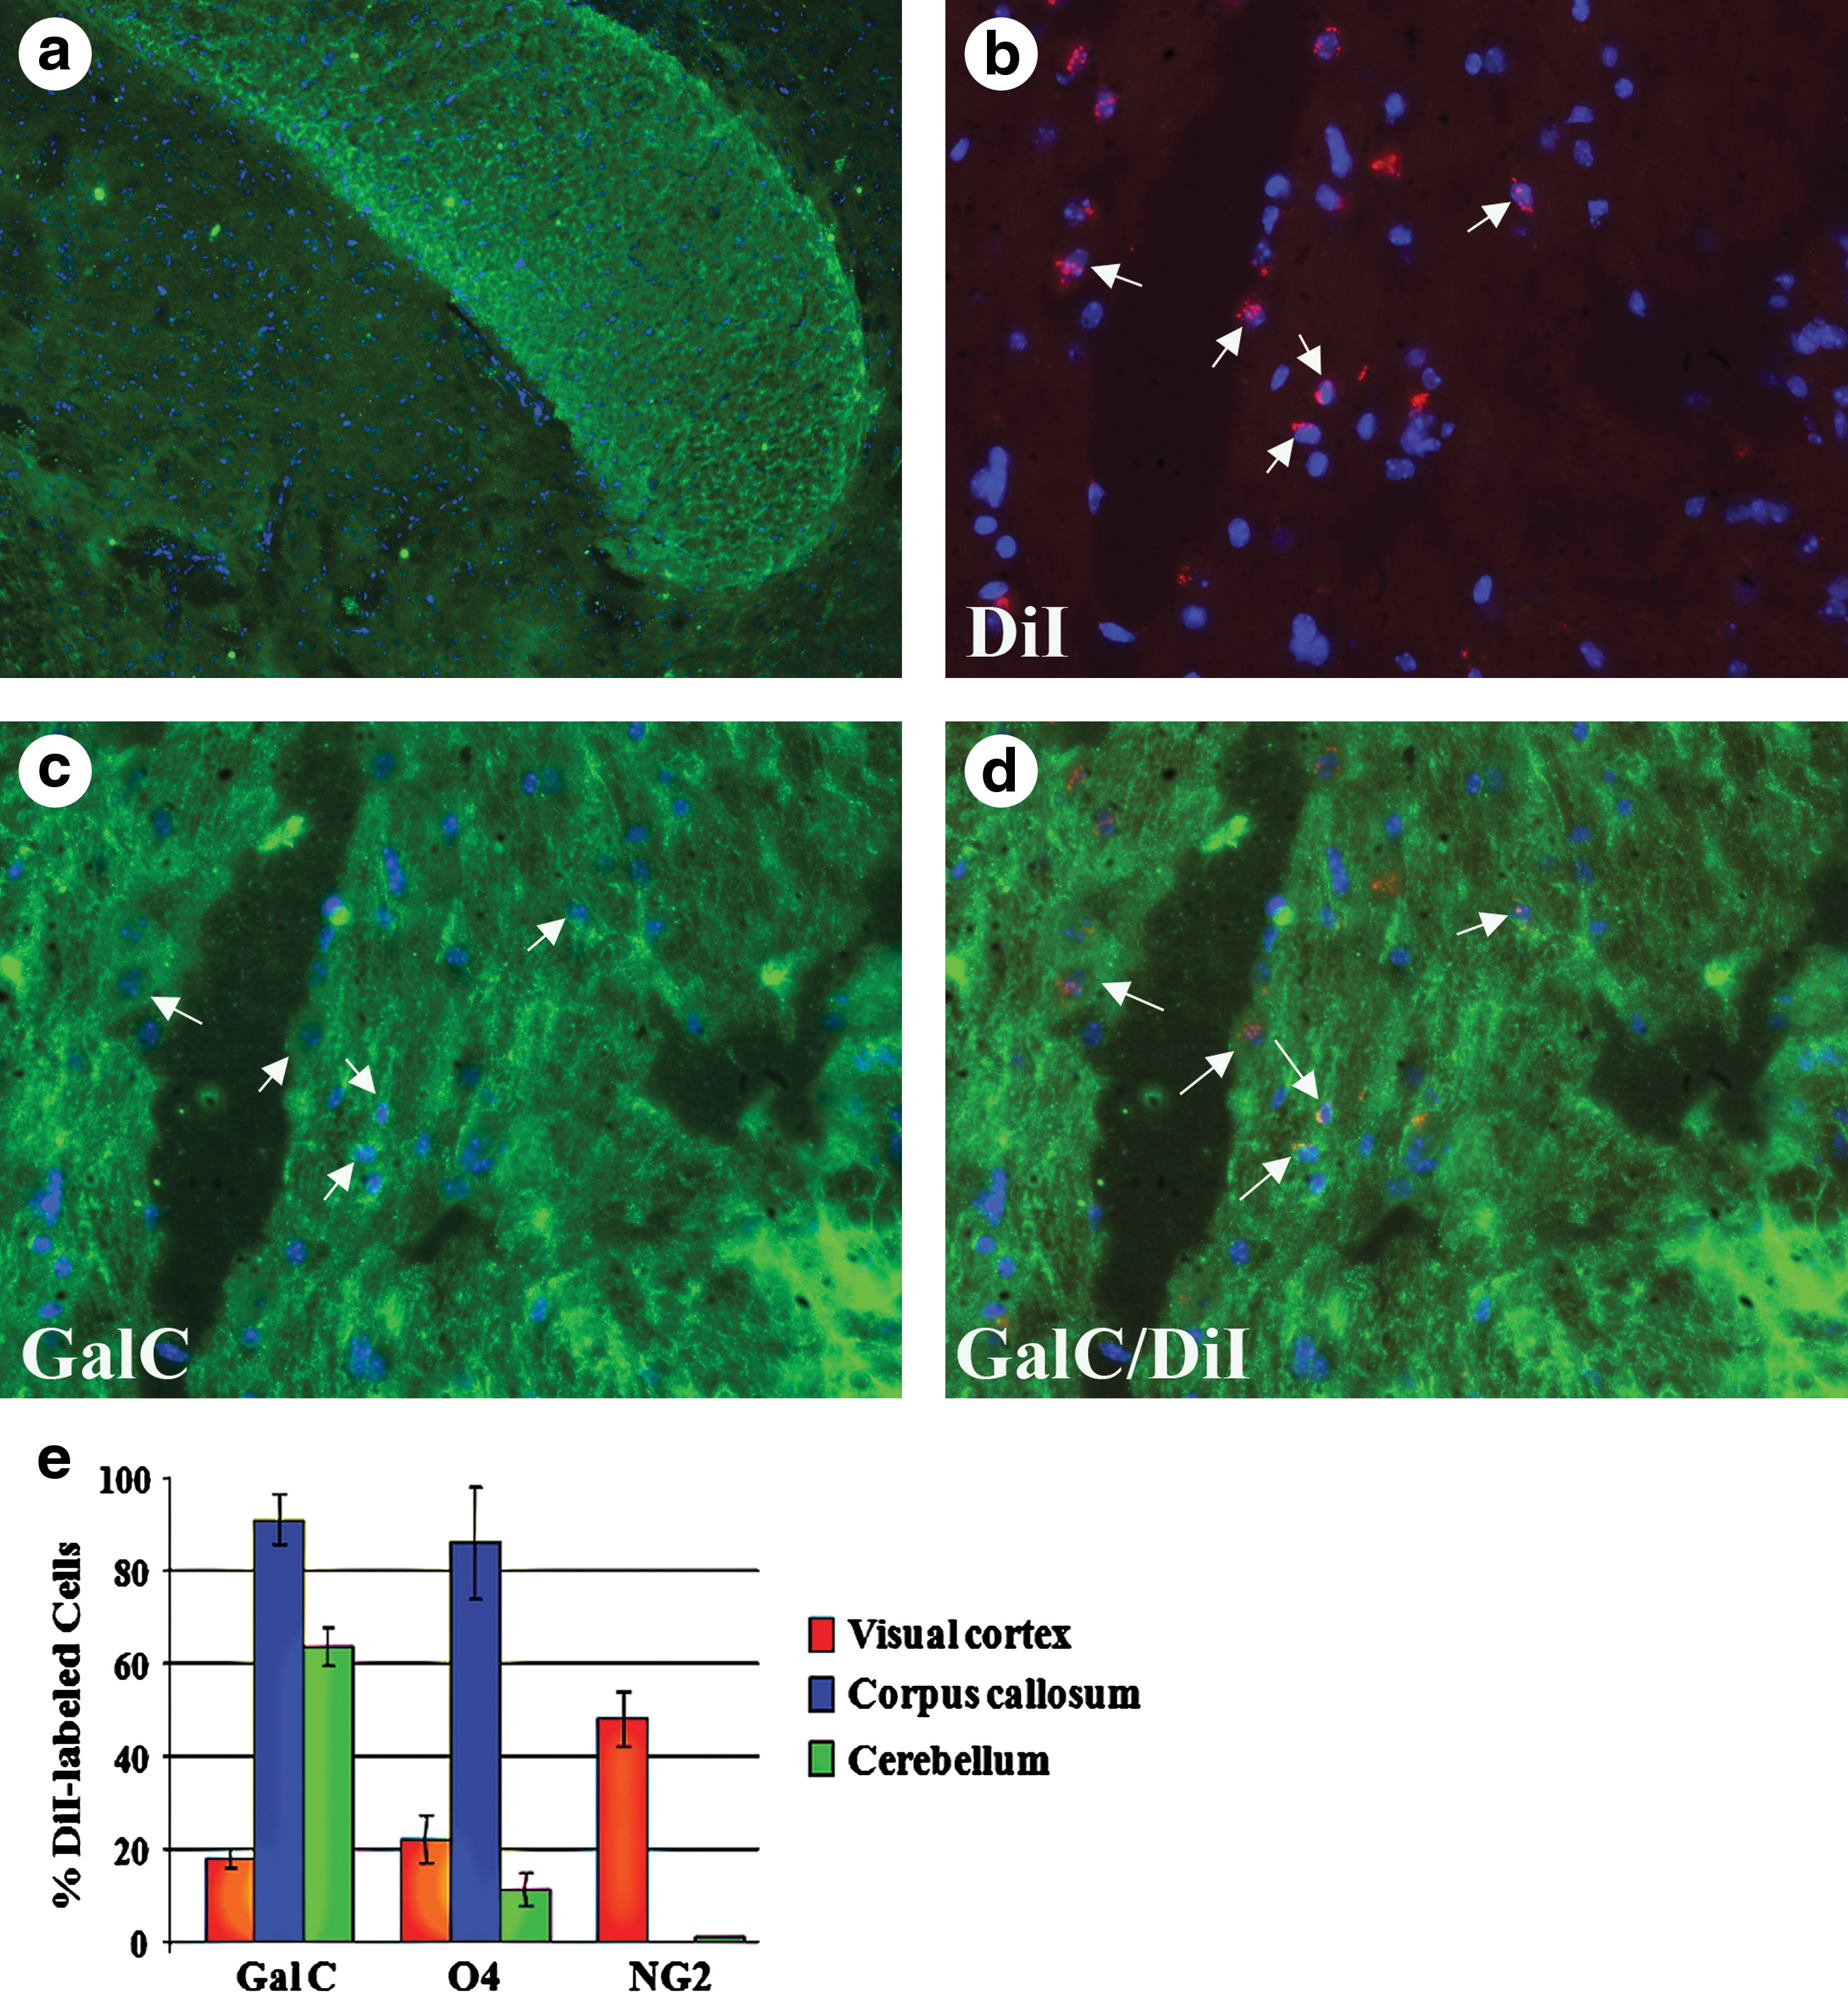
ADM localize to the corpus callosum and express GalC.
Primary aorta explant cultures contain cells expressing markers of neural- and oligodendrocyte-progenitors that exhibit branching morphology in response to fasudil
Although LIF did not promote an increase in levels of OP markers in ADM, it is possible that ADM developed oligodendrocyte potential during isolation and continued culture with LIF. We analyzed cells from aorta explant cultures for expression of OP markers and response to Fasudil. Aortic arches from postnatal mice were excised and cultured for 3 weeks (Fig. 10a–c). Small cells with morphology similar to ADM migrate out of explants within 1–2 days of excision (Fig. 10c). These cells, together with a mixture of cells after breakdown of the aorta explants, were allowed to attach to poly-L-lysine-coated coverslips, and were treated with glial medium. Cells were then fixed and stained for expression of OP markers. Cells from explant cultures expressed nestin (100% of cells from 3 explant cultures) and the PDGFRα (20–65% of cells, varying between explants cultures) in GM (d–f, j). When glial medium was added to the cells, many exhibited branching morphology, while maintaining expression of these OP markers (Fig. 10g–i). Thus, there are cells present in the aorta that express markers of oligodendrocyte progenitors, and respond to inhibition of ROCK signaling by exhibiting branching morphology.

OP markers are detectable in cells from primary aorta explants cultures.
Discussion
In viewing the marker profile of ADM and profiles reported for mesoangioblasts isolated from other tissues, it is apparent that there may be differences in these cell populations related to the tissue of origin. In particular, mesoangioblasts derived from skeletal muscle have a profile distinct from mesoangioblasts derived from aorta and other tissues (Fig. 1). The surface marker profile of stem cells has been shown to correspond to differentiation potential [70,71], and the contrasting profiles of mesoangioblasts from different tissues may therefore indicate varying differentiation potential, including differentiation into cell types of ectodermal origin such as oligodendrocytes. The influence of the tissue of origin on differentiation potential has been studied in preparations of MSCs. The source of MSCs was found to influence both gene expression and differentiation potential [9,11, 72]. In addition to influence of the tissue of origin on stem cell preparations, analysis of MSCs isolated from different sources have also indicated that variations in cell culture, isolation procedures, and substrate (matrigel, gelatin, etc.) impact surface marker profile [reviewed in Ref. 11]. As a result, these factors may also account for the variations in the marker profile of mesoangioblasts isolated from different tissues by different research groups, as well as their subsequent differentiation potential (Fig. 1b). Given these caveats to comparing the profile of the ADM in the present article with profiles in previously published data, it is difficult to determine whether mesoangioblasts from different tissues are inherently different, or whether the differences reported are due largely to variations in their isolation and culture. It will be important in future studies to establish a common methodology for isolating and identifying or classifying mesoangioblasts from different tissues, as well as distinguishing any intrinsic differences in their differentiation potential for clinical use.
Among the ADM derived in our study, there is heterogeneity visible in the cell population, detectable by FACS analysis. The majority of mesoangioblasts express Sca-1 and CD90 (95%–99%), and CD34 (78%) on their surface, and do not express CD31, CD13, CD45, or CD147 (<16%, Fig. 1). However, there is a small percentage of cells that do express CD31, CD13, CD45, and CD146, (10%–15% in low passage numbers), which is above the nonspecific background fluorescence (6.95%), indicating that subpopulations of stem cells may exist within the mesoangioblasts studied that are similar to endothelial cells (CD31+), MSCs (CD13+, CD45+), or pericytes (CD146+). Heterogeneity increases in the M25.2 subclone over extended passages (P48, Supplementary Data), with 2 general populations of cells visible. One population maintains low levels of expression of CD31, CD13, CD45, and CD146, whereas there is a second population of cells expressing higher levels of these markers. These data indicate that subpopulations may emerge over time with extended culture of clonally derived populations of cells from aorta explants.
Mesoangioblasts derived from the aorta, ADM, also express many markers of the oligodendrocyte lineage, including CD90, Nestin, NG2, A2B5, the PDGFRα, the TRα, and O4. However, the expression of some OP markers we have detected on ADM, including NG2, CD90, PDGFRα, and Nestin, are also present on cell types other than oligodendrocytes. NG2 is present on pericytes during development [73], vascular remodeling [74], and in various fetal and adult human tissues [75]. CD90 is expressed by thymocytes, and hematopoietic and MSCs, and nestin is expressed in different tissues during development, on multipotent progenitors derived from ES cells [76], and in adult stem cells of skeletal muscle [77], testis [78], and progenitor cells in the hair follicle [79]. However, these markers are also well characterized for their presence on OP and oligodendrocytes. NG2, named for an antigen on cells from the brain that exhibit both neural and glial properties (neural/glial) [80], is commonly used for detection of OP cells, now also classified as NG2-glia, or polydendrocytes [35,57,81 –83]. Nestin is expressed on CNS precursors in the brain that have oligodendrocyte potential, and CD90/Thy1 is expressed predominantly in the brain of humans [84], and is detected specifically on mature neural and glial cells [85]. CD90 is also present on neural stem cells isolated from the brain of adult rhesus macaque that differentiate into oligodendrocytes [86], and on neural stem cells isolated from human fetal brain [87]. In addition to their expression on cells from the brain, CD90 and nestin expression by stem cell populations from other tissues are also associated with oligodendrocyte potential. Human bone marrow-derived stem cells that express CD90 differentiate into oligodendrocytes in vivo and in vitro [33], and a specific subpopulation of human MSCs, derived from bone marrow, that coexpress CD90 and nestin also have the potential to differentiate into oligodendrocytes [87]. In addition, muscle stem cells that express both CD90 and nestin differentiate into oligodendrocytes [88]. Expression of the combination of NG2, CD90, and nestin, together with the A2B5 antigen, PDGFRα, the TRα, and O4 (expressed only in cells in the oligodendrocyte lineage), strongly supports the potential of ADM to mature into myelinating glial cells, and correlates with our study.
Consistent with this, ROCK inhibition initiates changes in morphology and marker expression in ADM consistent with differentiation or maturation of ADM into oligodendrocytes. Primary branching off of the cell body, and increasing process extension from the branches during maturation, also referred to as secondary and tertiary branching, correlate with differentiation of oligodendrocyte precursors and neural progenitor cells into the oligodendrocyte lineage [33,34]. These extensions have been used as an indicator of differentiation of stem cells from non-neural tissues into oligodendrocytes [33]. Treatment with Fasudil results in both primary branching and secondary and tertiary branching, or process extension, in ADM. These changes in cell morphology are similar to the effect of ROCK inhibition on other stem cells from various tissues, in which neural and glial differentiation is initiated by neurite outgrowth or process extension [28,30,32]. Inhibition of ROCK is necessary for the changes in morphology and OP markers in ADM, as addition of the other factors in the glial medium in the absence of Fasudil did not result in these changes. It is of interest that ROCK inhibition promotes morphology changes and an increase in expression of oligodendrocyte progenitor markers in ADM, while stimulating MSCs to differentiate into βIII tubulin-positive neurons (Figs. 4 and 5). These data suggest that ROCK signaling regulates both neural and glial differentiation, but that intrinsic differences in these cell populations predispose them to 1 particular lineage. These stem cell populations may therefore be useful in determining how ROCK signaling differentially regulates neuronal and glial differentiation.
Substrate may also play a role in the branching morphology that accompanies differentiation of ADM. ADM have more extensive branching when cultured on polylysine than when cultured on gelatin. Polylysine has been used extensively for neural cell culture, as it has been reported to enhance neural differentiation [89]. ADM may behave differently on polylysine and gelatin as a result of differential cell signaling evoked by attachment. Collagen and gelatin activate integrins upon cell attachment, leading to phosphorylation of FAK and signaling through Src [90]. In contrast, polylysine is a non-integrin-recognizable matrix, on which integrins are not required for adhesion and FAK phosphorylation is very weak [90,91]. Polylysine peptides stimulate phosphorylation of multiple membrane proteins in nerve cells and oocytes [92] and polylysine specifically stimulates the kinase activity of TGFβ receptors Type II and IV [93,94]. This may promote oligodendrocyte differentiation, as TGFβ promotes glial differentiation of neural precursor cells [95]. In addition to directly activating signaling pathways, polylysine also serves to absorb serum proteins and components, including extracellular matrix proteins [96] and may therefore indirectly promote differentiation and/or branching of ADM.
We have shown that ADM express OP markers in vitro, exhibit morphology of OP cells, and also localize to peripheral nerve bundles and regions of white matter in vivo, expressing markers of mature myelinating cells, and insulating βIII-tubulin-positive axons. Aorta explant cultures contain cells that already express early-stage OP markers, before expansion of clonally derived populations. The number of cells expressing OP markers increases with time of explant culture (Supplementary Fig. S4), and also may result in expression of mid-stage OP markers such as O4 by cells in the culture, although many of these O4+ cells cells do not have the characteristic cobble-stone appearance of clonally derived ADM. These data emphasize the importance of culture time and niche in directing lineage potential or commitment of vessel-derived cells. However, although ADM express OP markers in GM, they are not restricted solely to a myelinating glial cell fate. ADM simultaneously express stem cell markers, OP markers, and muscle markers after explant culture and expansion, and may be directed to differentiate into cell types othern than oligodendrocytes in culture and in vivo, indicating that they are not irreversibly committed to the glial lineage. For example, despite the fact that nearly all ADM expressed OP markers in vitro, only ADM that localized to peripheral nerve bundles or white matter expressed mature glial markers in vivo; ADM in surrounding muscle tissue differentiated into skeletal muscle fibers [1], indicating that the microenvironment in vivo influences the fate of ADM. These data indicate that injection of ADM into damaged tissue may result in tissue-directed regeneration of damaged or depleted cell types.
Approximately 51% of peripheral nerve bundles in damaged skeletal muscle contain ADM-derived Schwann cells, and there are nearly 2-fold more nerve bundles in these ADM-injected muscles than contralateral, saline-injected muscles. These data indicate that ADM participate in regeneration of nerves in skeletal muscle in animal models of muscular dystrophy, and may correspond to the global decrease observed in damaged muscle fibers in ADM-injected muscles [1]. Innervation is important for muscle fiber survival and health, and the contribution of ADM to nerves in regenerating skeletal muscle may therefore be important for stabilizing regenerated fibers and/or preventing degeneration existing myofibers.
The potential of ADM to mature into oligodendrocytes may also explain the expression of neural-specific genes, identified by microarray analysis of mesoangioblasts derived from dorsal aorta [13]. Five neural-specific genes were expressed by ADMs in a previous study: the orphan G-protein-coupled receptor family B (GPCRB), a member of the tetraspanin family of proteins (Tm4sf2), the Tumor necrosis factor-receptor-associated factor 4 (TRAF4), the ATP-binding cassette subfamily-A 1 transporter (ABCA1), and Eprhin 5 (Efna5). Of these genes, GPCRB message and protein has been localized to neurons and astrocytes in the CNS, but is also detected in brain and spinal cord white matter, and in oligodendrocytes in culture [17]. TRAF4 [16] and ABCA1 [14] are expressed by oligodendrocytes as well as neurons. Tm4sf2 and Efna5 have been detected generally in brain regions containing myelinating glial cells [15,98], and Efna5 expression is localized to glial cells in the superior colliculus, although a specific marker for oligodendrocytes was not used in the study [5]. Therefore, the expression of these genes could also be indicative of their potential to mature into oligodendrocytes.
Although these genes are detected in mature neurons, there is no evidence to suggest that ADM differentiate into the neurons. Tagliafico et al. identified expression of neural-related genes in embryonic mesoangioblasts, but were unable to differentiate ADM into either neurons or astrocytes [13]. We have also been unsuccessful in promoting ADM differentiation into neurons using a variety of culture conditions with combinations of factors known to promote neurogenic differentiation of neural stem cells, embryonic stem cells, and MSCs, and ADM in the brain or peripheral nerve bundles did not express neural markers. In addition, ADM injected into the brain expressed markers of oligodendrocytes and OP rather than neural markers, and migrated to regions of white matter, consistent with commitment to maturation into myelinating glial cells.
A similar population of endogenous stem cells that express the hematopoietic stem cell marker CD34 as well as markers of OP, including nestin, NG2, and PDGFRα, has been found migrating in a stream from the subventricular zone of the brain [97]. These cells are in close proximity to vessels, and were hypothesized to originate from vessels and contribute to mature oligodendrocytes in the forebrain, in addition to OP cells originating from a neural origin [97]. ADM may be migrating along this same stream to reach the corpus callosum and the visual cortex after injection into the lateral ventricle, and possibly toward the cerebellar white matter as well (Figs. 8 and 9). Additionally, ADM may be related to this population of cells migrating in the developing brain, as they express the same markers and also originate from vessels.
In conclusion, the multipotent nature of mesoangioblasts derived from vessels near the heart make them good candidates for treatment of severe damage to tissues, as they have the capacity to repair or regenerate multiple cell types [1]. However, additional studies are necessary to translate these results to the clinic. It will be important to determine whether ADM have the potential to generate tumors, and to explore whether ADM are immune-privileged or immunogenic when transplanted into allogeneic recipients. Additionally, isolation of ADM may pose challenges for translation to the clinic. Mesoangioblasts have been derived from tissues such as skeletal muscle and bone marrow that are more easily accessible as sources of stem cells, but have varying marker profiles (Fig. 1) and may also have differing potential for regenerative therapy. Isolation of ADM for therapy would require invasive techniques. For purposes of allogeneic transplantation, it may be possible to use aorta punches obtained during bypass surgeries for stem cell isolation. These hurdles will need to be addressed to establish the clinical potential of ADM for regenerative therapies.
Footnotes
Acknowledgments
We gratefully acknowledge Drs. David J. Miller, Mauricio Vieira, and Frederik I. Grunenfelder for scientific discussion and critical review of the article, and Dr. Federico Zuckerman for the use of the iCyte cell sorter in his laboratory. We are also grateful to Lou Ann Miller at the Center for Diagnostic Imaging at the College of Veterinary Medicine for the use of the confocal microscope, and to Mike Burton, from the laboratory of Dr. Rodney Johnson in the Department of Animal Sciences at the University of Illinois, for training L.W. in the procedure of intracerebroventricular injection. This work was supported, in part, by the Illinois Regenerative Medicine Institute, and the Veterinary Medical Scholars Program at the University of Illinois College of Veterinary Medicine.
Author Disclosure Statement
No competing financial interests exist.
References
Supplementary Material
Please find the following supplemental material available below.
For Open Access articles published under a Creative Commons License, all supplemental material carries the same license as the article it is associated with.
For non-Open Access articles published, all supplemental material carries a non-exclusive license, and permission requests for re-use of supplemental material or any part of supplemental material shall be sent directly to the copyright owner as specified in the copyright notice associated with the article.