
Abstract
The mammalian subependymal zone (SEZ; often called subventricular) situated at the lateral walls of the lateral ventricles of the brain contains a pool of relatively quiescent adult neural stem cells whose neurogenic activity persists throughout life. These stem cells are positioned in close proximity both to the ependymal cells that provide the cerebrospinal fluid interface and to the blood vessel endothelial cells, but the relative contribution of these 2 cell types to stem cell regulation remains undetermined. Here, we address this question by analyzing a naturally occurring example of volumetric scaling of the SEZ in a comparison of the mouse SEZ with the larger rat SEZ. Our analysis reveals that the number of stem cells in the SEZ niche is correlated with the number of ependymal cells rather than with the volume, thereby indicating the importance of ependymal-derived factors in the formation and function of the SEZ. The elucidation of the factors generated by ependymal cells that regulate stem cell numbers within the SEZ is, therefore, of importance for stem cell biology and regenerative neuroscience.
Introduction
I
Previous experimental work has suggested that neurogenesis within the mouse SEZ is structurally and functionally correlated with the vasculature and with the cerebrospinal fluid (CSF)/ependymal cell layer interface, with both of these elements associated with neurogenic activity in their proximity [3 –6]. Adult NSCs are directly connected to each element (CSF/ependymal cell and vessel) by their apical and basal processes, respectively. These attachments represent persistence of those to ventricular surface and basal lamina of the embryonic radial glial cells from which the adult NSC are generated. However, the relative contribution of signals from each element to the regulation of adult NSCs remains poorly defined. One way to gain further evidence as to the roles of the blood vessels and ependymal cells in the formation of the niche is to investigate how neurogenic activity and the structure of the niche change in different conditions; for example, during the early postnatal development of the SEZ [7] or in response to degenerative insults [3,8]. An alternative approach, however, is to explore evolutionary traits by directly comparing the neurogenic activity and the structure of the niche in different animal species. Here, we take the latter approach by comparing the SEZ of the mouse and the rat. These 2 species are the most widely used experimental animals; they are evolutionary [9], ecologically, and behaviorally related, but importantly, differ significantly in their brain size. By analyzing this naturally occurring example of scaling of the SEZ, we were able to show a close correlation between the number of NSCs and the size of the ependymal cell layer, thus suggesting an important role of ependymal cells in generating signals that control stem cell behavior.
Materials and Methods
Animal treatments and tissue processing
Two-month-old adult Sprague-Dawley rats and 129sv mice were used, and all experiments were performed in accordance to the United Kingdom Animals (Scientific Procedures) Act 1986. For Cytosine β-D-arabinofuranoside (AraC; Sigma) treatment, adult animals were anesthetized, and a cannula (BIK-II; Alzet) was fixed on the skull (1 mm lateral to bregma) connected to a subcutaneously implanted mini-osmotic pump (1007D; Alzet). 4% AraC or saline alone was infused for 4 and 7 days onto the surface of the brain of mouse and rats, respectively, and animals were sacrificed 2 days after the end of the infusion. Vibratome-cut (Leica) 70 μm thick brain sections were processed for immunohistochemistry using the rabbit antiphosphohistone 3 (anti-PH3; 1/500; Millipore), mouse anti-glial fibrillary acidic protein (anti-GFAP; 1/500; Sigma), rabbit anti-pan Laminin (1/200; Sigma) and rabbit anti-S100β (prediluted; Dako) antibodies, followed by incubation in appropriate Alexa-conjugated secondary antibodies (Invitrogen). Images were acquired using a Leica SP5 confocal microscope and were processed using Photoshop (Adobe) software.
Analysis of structure
Three rostro-caudal levels were chosen (Table 1, Section B and Fig. 1), and at least 5 sections were analyzed from each level. To assess GFAP and PH3 coexpression at least 3 confocal-generated optical sections from each mitotic cell (using the ×63 objective and a further ×4 digital zoom) were analyzed (Fig. 2, Supplementary Figs. S1–S3; Supplementary Data are available online at

Calculation of the volume of the SEZ.
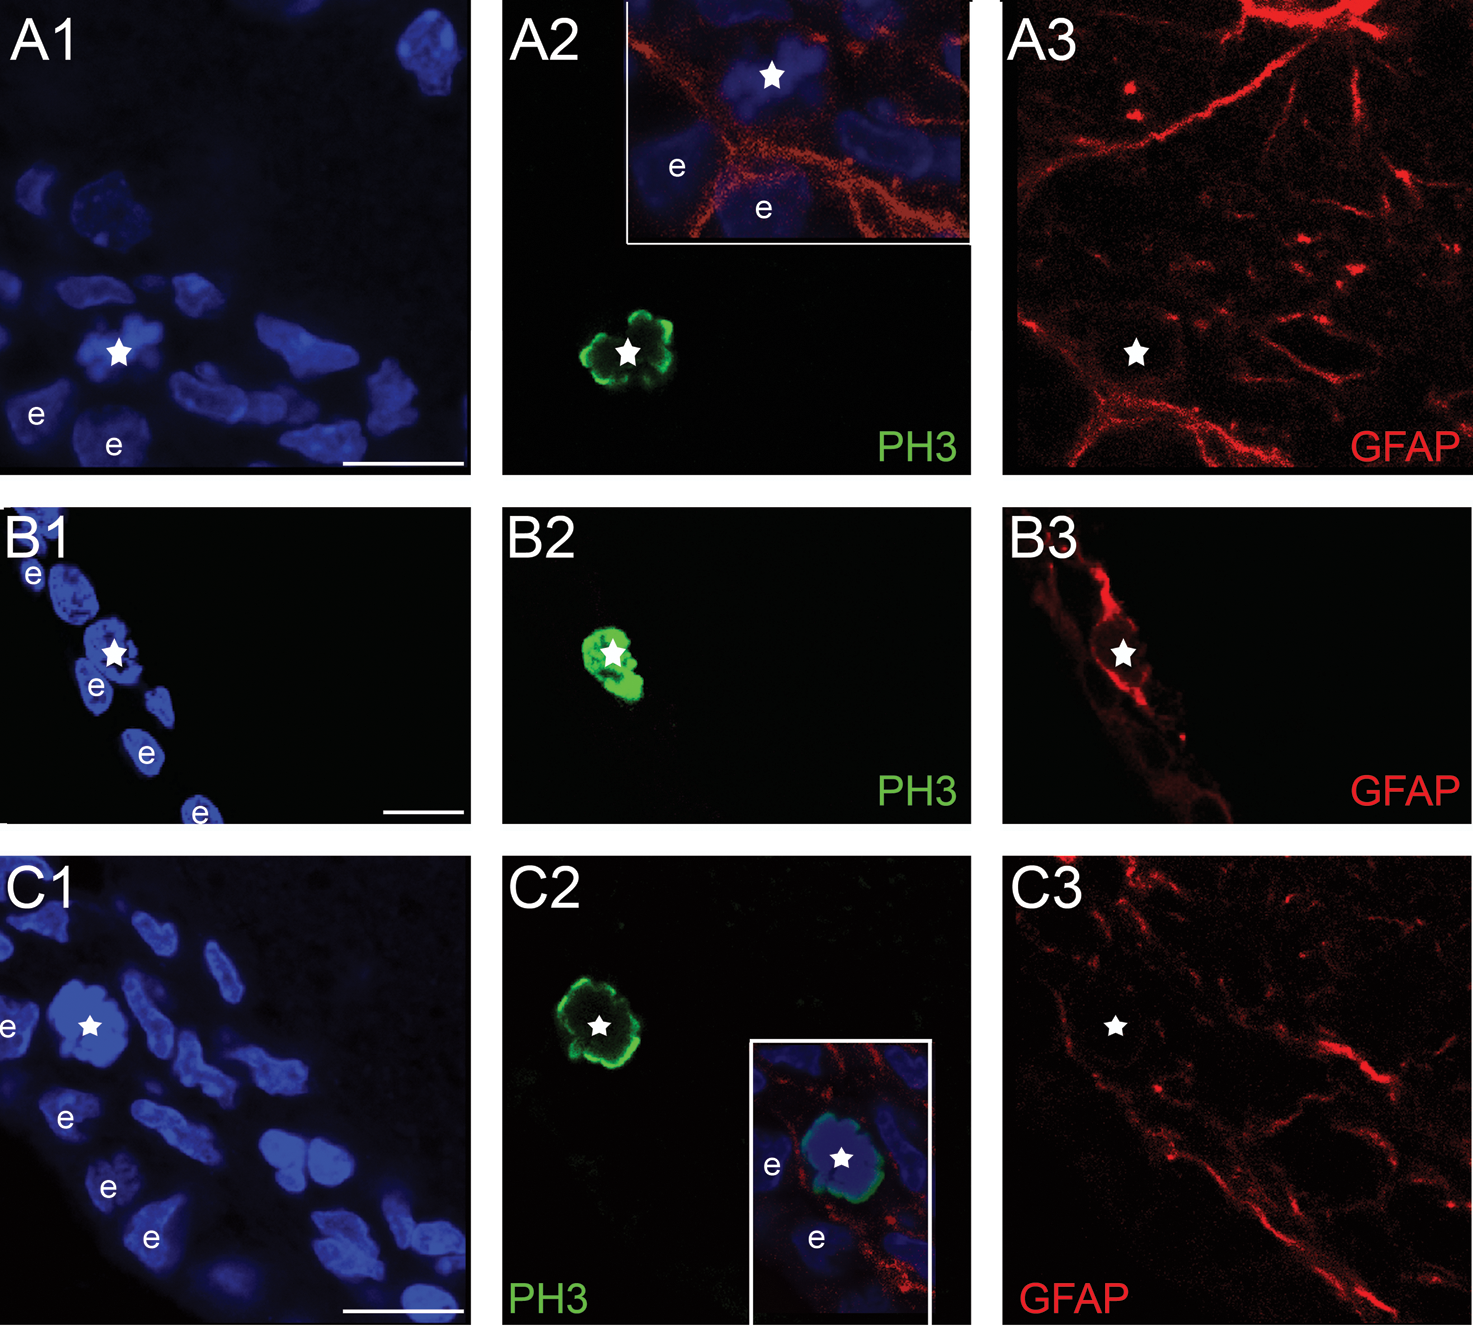
Identification of mitotic NSC and precursors. The images show parts of the SEZ from coronal sections of rat brains immunostained for GFAP (in red), to mark astrocytes and PH3 (in green), to mark cells in M phase. Panel

Comparison of the mouse and rat SEZ.
Note that although the width of the SEZ (estimated by the maximal distance from the ventricular wall where mitotic progenitors occur) is significantly higher in the rat, the periventricular distribution of mitotic NSCs is similar in the 2 species (Section A). Also, note that the distribution of mitotic cells per ventricular wall surface is similar among the 2 species (Section C).
P<0.05 using the nonparametric Kruskal–Wallis test.
SEZ, subependymal zone; NSC, neural stem cell; PH3, phosphohistone 3.
Results and Discussion
Initially, we sought to compare the size (volume) of the mouse and rat neurogenic niche by defining its dimensions and shape. The neurogenic area was defined using both histological and immuno-histological criteria, based on the observation that mitotic cells were positioned within a cell-dense zone, proximal to the ventricle, which was followed deeper in the tissue by a hypocellular, mitoses-free zone, that we considered to be outside the SEZ (Supplementary Fig. S4). Three indicative rostro-caudal levels (Fig. 1A and Table 1, Section B) were selected, and specific anatomical marks -such as the shape of the lateral ventricles and of the corpus callosum and the position of the anterior commissure were used to define the respective levels in the 2 species (n=4 and 6, mice and rats, respectively). The dorso-ventral dimensions of the mouse and rat SEZ were calculated in sections collected from these 3 rostro-caudal levels (Table 1, Section B) and were found to be comparable to data obtained by other sources [10,11]. The third dimension of the niche (the width, in a coronal section perspective; Fig. 1A) was estimated by measuring the maximal distance from the ventricular wall where neurogenic activity occurs. Dividing cells (that comprise both NSCs and daughter transit amplifying precursors and neuroblasts) were identified by immunostaining serial 70 μm-thick sections of adult brains for PH3, a marker of cells proceeding through the M phase of cell cycle, and the distance of each mitotic nucleus from the ependymal cell layer was calculated (Supplementary Fig. S1). In addition, NSCs within these dividing (PH3-positive) cells were identified as had been previously done [3] based on coexpression of the astrocytic marker GFAP (expressed by NSCs and not by downstream precursors; Fig. 2 and Supplementary Figs. S2, S3).
The mouse SEZ was found to be a compact zone, homogeneously extending 3–4 cell layers adjacent to the ependymal cell layer (Fig. 3 and Supplementary Fig. S3), with the PH3+ immunohistochemistry data showing that all dividing cells (GFAP+NSCs and GFAP− precursors) were positioned up to 22 μm from the ventricular wall (Table 1, Section A). In the rat, the PH3 immunostaining data showed that neurogenic activity occurred up to 55 μm from the ventricular wall; and so, the SEZ was predicted to extend 12–14 cell layers adjacent to ependymal cells. However, the histological analysis revealed the rat SEZ to be irregular in its width; comprising areas formed by 3–4 cell layers (similarly to the mouse SEZ) and areas consisted of up to 12–14 cell layers (Fig. 3 and Supplementary Figs. S3, S4). Another difference between the mouse and rat SEZs was that mouse ependymal cells were flat, elongated in parallel to the ventricular wall, whereas rat ependymal cells were more cuboid, in some cases bearing processes perpendicular to the ventricular wall (Fig. 3). These observations indicate that the morphology of the ependymal cell layer is modified in association with the widening of the SEZ, and rat ependymal cells (some of which bear thin and short basal processes) are morphologically intermediate between the flat mouse ependyma and the ependyma of the primate and human SEZ that exhibits long basal processes [12,13].
Based on the observations regarding the width of the SEZ as well as on the shape of the ventricular wall in the rostro-caudal and dorso-ventral axes, the mouse and rat SEZs were modeled to resemble 3-dimensional (3D) structures composed by 2 trapeziums (Fig. 1B). In addition, the volume of the rat SEZ was corrected for the irregularities of its width, as calculated from tissue sections (see Materials and Methods section). These calculations revealed that the rat SEZ was approximately 4.75 times bigger than the mouse SEZ. This estimate was very close to the previously reported difference in the size of the whole brain (the rat brain being approximately 4.33 times bigger than the mouse brain) [14], in concert with the theory that during evolution the scaling in the size of the brain between 2 species is reflected in analogous scaling in the size of brain subdivisions [15]. To further validate our result, we also made volumetric calculations for the olfactory bulbs (OBs), areas that are functionally related to the SEZ, as they are the targets of SEZ-generated cells, based on the assumption that OBs resemble cylinders (Supplementary Fig. S5, Table 1, Section B). Rat OB were estimated to be 4.67 times bigger from the mouse OB. Taken together, these results suggest that the volume of the rat SEZ neurogenic niche is scaled, as compared with the mouse SEZ, in proportion to the scaling of the whole brain.
This expansion of the rat SEZ would be predicted to have different effects on the availability of the 2 potential sources of factors that regulate NSCs. Any factors released by sources present within the entire 3D space of the SEZ, for example, those derived from the vasculature, would expand in proportion to volume, whereas those released from the ependymal cells lining the ventricle and, therefore, forming a 2-dimensional sheet would show a much smaller expansion (just as the area of each side of a cube only expands as a square of the length of each side, whereas the volume of the entire cube expands as a cube of this length). Next, therefore, we calculated the correlation between NSC numbers, SEZ volume, and area of the ependymal layer. The total number of PH3-positive NSCs was counted in each rat and mouse tissue section, and it was revealed that the rat SEZ was 4.75 times larger but contained only 2.7 times more mitotic NSCs (resulting in a 42% decrease in their density). However, when the increase in the number of mitotic NSCs in the rat was compared with the increase in the ventricular wall surface (2.66 times larger than that of the mouse), the ratio was similar in both species (Table 1, Section C).
Although these results suggest that the NSC population expands in proportion to the area of the ependymal cell layer rather than the volume of the SEZ, an alternative explanation would be that total NSC numbers do expand in proportion to SEZ volume but the balance between quiescent (nonmototic) and activated (mitotic) NSCs changes in the larger rat SEZ in such a way that our analysis based on the use of a mitotic marker to quantify NSC significantly underestimates their numbers in the rat. To address this, we used an experimental paradigm in which AraC was infused on the surface of the brain to ablate the rapidly dividing transit amplifying and neuroblast populations in the SEZ. After this, NSCs are induced to re-enter the cell cycle to regenerate their daughter populations [16] and we have previously estimated that this involves the transient mitotic activation of almost the entire NSC pool [17]. The identification of mitotic NSCs at this stage, therefore, allows an accurate approximation of the total number of NSCs residing in the SEZ. AraC was infused for 4 and 7 days (in the mouse and the rat, respectively), and animals (n=3 per species) were killed 2 days after the end of the treatment. AraC induced an identical 9-fold increase in the numbers of mitotic NSCs in both species (Table 1, Section C), thereby confirming that the proportion of quiescent NSCs in the normal SEZ is not greater in the rat than in the mouse and that our conclusions as to the correlation between NSC numbers and ependymal cells were correct. Indeed, by calculating the number of ependymal cells in these experiments, where all NSCs are activated, we estimate that the SEZ contains 1 NSC per 187 and 157 ependymal cells in the mouse and the rat SEZ, respectively (Table 1, Section C).
If NSCs are primarily regulated by cues derived from the CSF/ependymal cell layer interface, or by direct contact with the ventricular wall, then we can make a further prediction that these cells will remain near the ependymal cells in the thicker rat SEZ. To test this, we investigated the topography of NSCs in the 2 species (Table 1, Section A). In the 20 μm-thick mouse SEZ, mitotic NSCs were found largely within 10 μm of the ventricular wall. In the rat, almost all mitotic NSCs (84.62%) were located within 20 μm of the ventricular wall even, though, as described earlier, the rat niche was of irregular width with both narrow domains of an average maximal width of 23.23±2.12 μm and wide domains of an average maximal width of 55±1.1 μm (the latter accounting on average for 41.14% of the total rat SEZ volume). This cell distribution revealed that, despite the finding just described that mitotic cells were distributed throughout the increased thickness of the rat SEZ, mitotic NSCs in both species were preferentially located close to ependymal cells, irrespective of the thickness of the SEZ (average distance of NSCs from the ventricular wall: 8.9 μm in the mouse and 12.2 μm in the rat; as shown in Table 1, Section A; and as illustrated in Fig. 4).
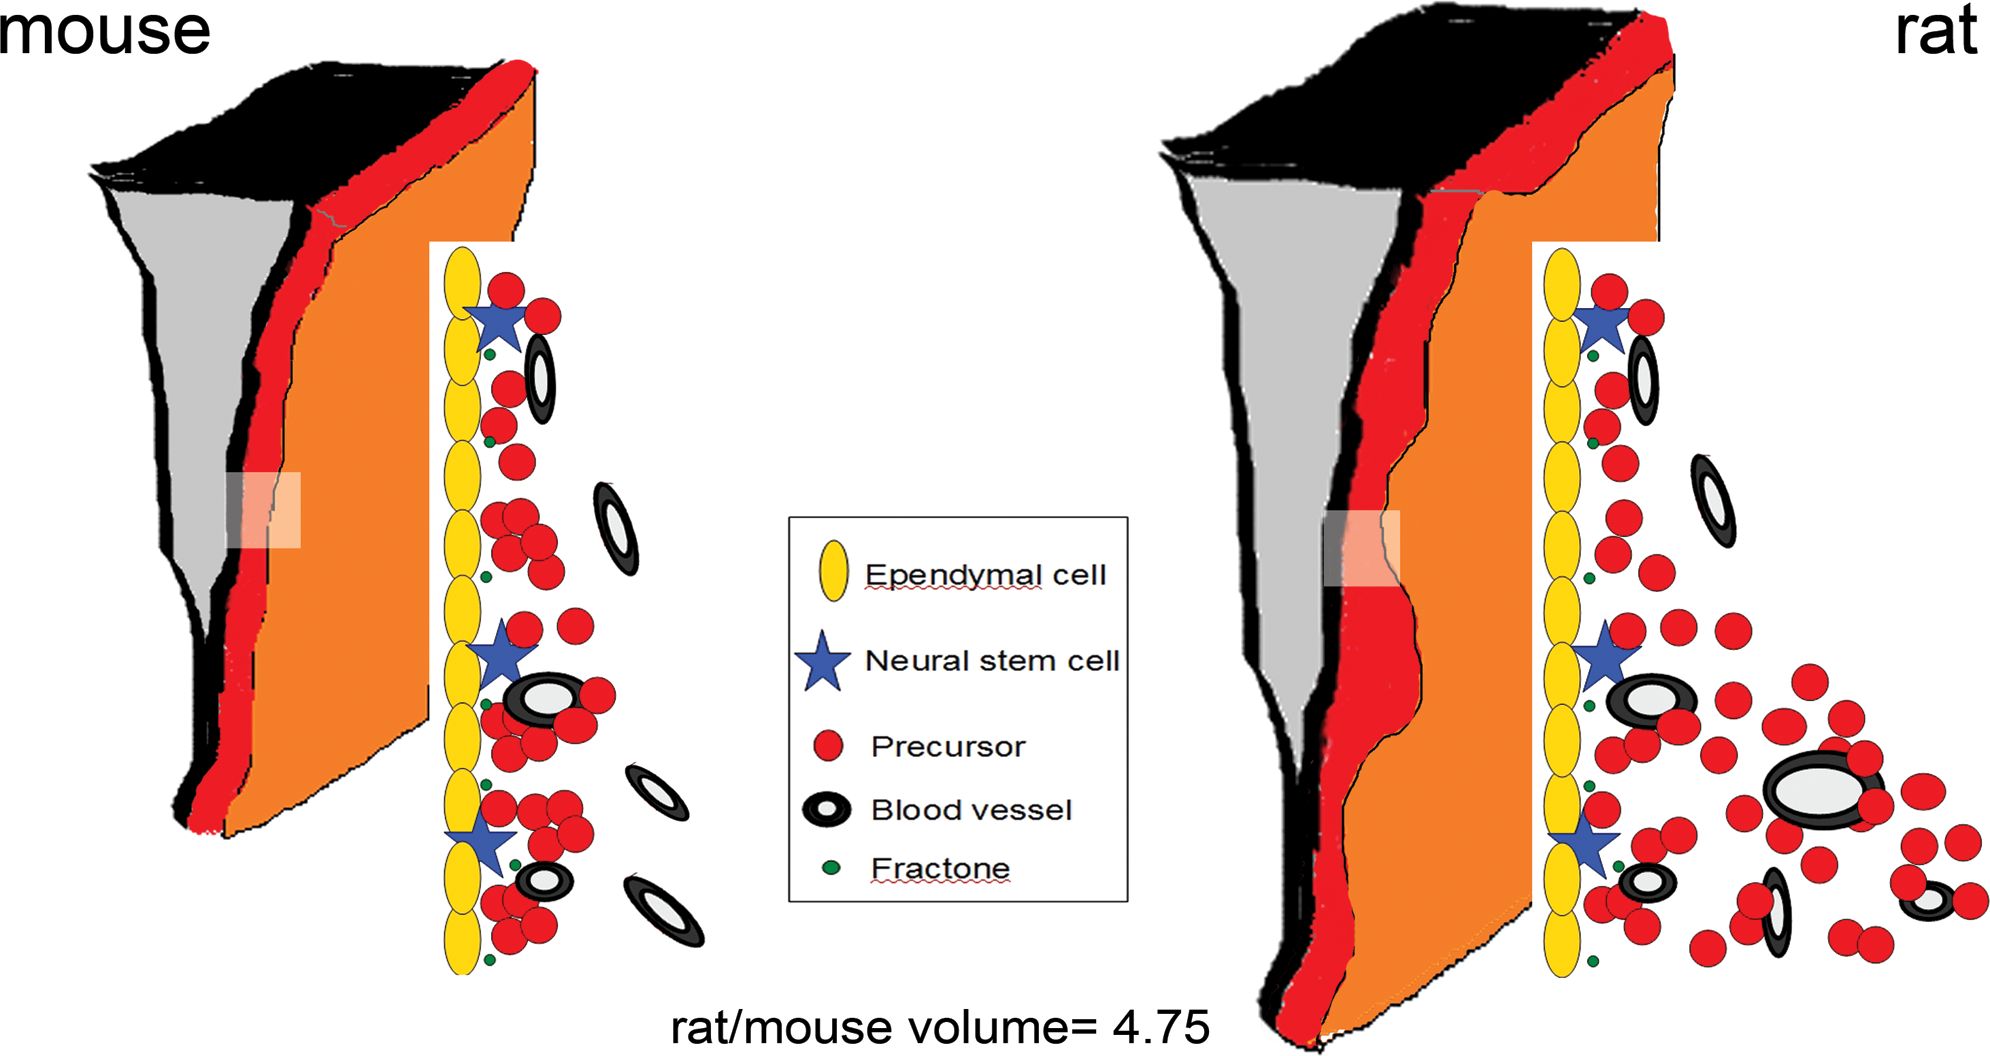
Graphic illustrations of the 3-dimensional structure of the mouse (left side) and the rat (right side) SEZ. The cytoarchitecture of equivalent parts of the mouse and rat niche (indicated by the rectangles) is also graphically illustrated. The mouse SEZ is a compact area with a homogeneous width of approximately 20 μm. In the rat, histological analysis (as shown in this figure) revealed that the width of the SEZ is not homogeneous, including thin and wide domains (with maximal width of approximately 55 μm), leading to an irregular shape. Note that NSCs remain in proximity to ependymal cells irrespective of the enlargement of the SEZ width in the rat brain (Table 1, Section A). The volume of the rat SEZ was calculated to be 4.75 times bigger than that of the mouse; however, similar numbers of NSCs are found per ependymal cell layer length. Dimensions and scales are not accurate. Color images available online at
Our results showing a correlation between NSC numbers and ependymal cell numbers (or surface area of the ependymal cell layer) and a close association between the cell bodies of the two cell populations even in a thickened SEZ argue that the ependymal cells might be providing short range cues that support the NSC. In this, they may be analogous to the hub cells present in the Drosophila gonadal niches where cell-cell interaction between hub and stem cell are required to maintain the latter in an undifferentiated state, in the SEZ providing signals that cannot be transmitted via the basal process [18,19]. However, our observations do not argue against conclusions from recent experimental work that the vasculature plays a critical role in supporting stem/precursor cell proliferation [4 –6]. Indeed, in the proximal (NSC containing) region of the rat SEZ, we observed numerous large punctae immunopositive for laminin (Fig. 3). These are indicative of the presence of specialized basal membrane structures called fractones, originally described in the mouse SEZ as extensions of the laminin-rich basement membrane material surrounding blood vessels and contacting each stem cell [20]. More recently, these have been shown to have growth factor-binding properties that might regulate stem cell behavior [21], and their presence in the proximal to the ventricle SEZ emphasizes that both ependymal cells and vessel-associated signals likely regulates NSC behavior.
In conclusion, we have investigated how the volume of the SEZ and the distribution of NSCs within it change in a naturally occurring example of enlargement of this neurogenic niche by comparing mouse and rat brains. These 2 species are very close in terms of evolution and ecology, the latter being reinforced by the use of laboratory animals exposed to similar environments (eg, ad libido food and water intake, similar light-dark cycles), thus ensuring that the analysis is not confound by potential differences in the functional utility of adult neurogenesis. The data we report lead to 3 major conclusions. First, the size of the neurogenic niche, as defined by the volume of the area in which neurogenic activity occurs, is determined by the size of the brain, thus following the evolution-conserved principle that brain subdivisions are scaled in proportion to the scaling of the whole brain [15]. Second, however, the number of NSCs contained in the niche is proportional not to its volume but to the area of the ventricular wall. The differential scaling in the size of the niche and the number of NSCs resulted in lower density of NSCs in the larger rat SEZ, a type of tissue scaling called hypermetric (ie, the size of the tissue increases faster than the number of cells) that has also been observed in the rodent cortex [22]. Third, the distribution of NSCs within the SEZ is not random, with these cells constrained in areas proximal to the ventricular wall. Together, these lead to the overall conclusion that the ependymal cell layer generates signals that have a major role in regulating adult neurogenesis and in determining the size of the NSC pool, a conclusion consistent with 2 lines of recent experimental work. First, with reports documenting the importance of ependyma-derived factors such as regulators of bone morphogenetic proteins signaling, pigment epithelium-derived growth factor, and stromal cell-derived factor 1 in the control of NSC activity [23 –25]. Second, with the evidence that adult NSCs can respond to ependymal cell loss by replacing the damaged cells [26]. They also corroborate observations in the early postnatal brain, when the maturation of adult NSCs follows the generation of ependymal cells [27], as well as in the ageing brain, where neurogenic activity is reduced in concert with the disappearance of ependymal cells [28]. Therefore, the data presented here emphasize that further studies of ependymal cell-derived signals could lead to important findings in CNS regeneration and ageing.
Footnotes
Acknowledgments
This work was funded by the National Institutes of Health–National Institute of Biomedical Imaging and Bioengineering Quantum Grant Project [1P20EB00706]. The authors would like to thank Dr. Jing-Wei Zhao (University of Cambridge, UK) and Dr. Vera Weisbecker (University of Cambridge, UK, and University of Queensland, Australia) for many stimulating discussions and critical comments.
Author Disclosure Statement
The authors have no commercial associations or conflicts of interest to disclose.
References
Supplementary Material
Please find the following supplemental material available below.
For Open Access articles published under a Creative Commons License, all supplemental material carries the same license as the article it is associated with.
For non-Open Access articles published, all supplemental material carries a non-exclusive license, and permission requests for re-use of supplemental material or any part of supplemental material shall be sent directly to the copyright owner as specified in the copyright notice associated with the article.