
Abstract
Human mesenchymal stem cells (MSCs) are easy to expand, are relatively safe, and can be transplanted in allogeneic recipients as off-the-shelf cells. MSCs can be induced to form functional peptidergic neurons and express the neurotransmitter gene, TAC1. Expression of TAC1 requires that the repressor gene, RE-1 silencing transcription factor (REST), is decreased. This study investigated the molecular pathway in TAC1 induction as MSCs differentiated into neurons and then applied the findings in a model of spinal cord injury (SCI) in zebrafish. We studied the developmental roles of the 2 cAMP response element (CRE) sites: CRE1 and CRE2. Activator protein-1 (AP-1) binding site overlaps with CRE2 (CRE2/AP-1). Reporter gene studies with the 5′ regulatory region of TAC1 containing wild-type or mutant CRE sites and, parallel studies with ectopically expressed inhibitor of cAMP proteins (inducible cAMP early repressor) indicated that CRE1 and CRE2/AP-1 are activated at days 6 and 12, respectively. Studies with protein kinase-A (PKA) and Jun N-terminal kinase (JNK) inhibitors in the reporter gene studies, chromatin immunoprecipation assay, and ectopic expression of REST indicated the following pathways: Decrease of REST activated upstream c-Jun N-terminal kinase (JNK). In turn, JNK activated ATF-2 and AP-1 for interaction with CRE1 and CRE2/AP-1, respectively. To apply the finding to SCI, we transplanted 6-day-induced MSCs in transgenic HB9-GFP zebrafish larvae with SCI, in the presence or absence of JNK inhibitors. Imaging and functional studies showed significant improvement in the fish. The repair mechanism involved the activation of JNK. The findings have long-term implications for SCI repair with MSCs.
Introduction
A
MSCs can be induced to form electrophysiologically functional peptidergic neurons that produce the neurotransmitter substance P [11,22,23]. The TAC1 gene produces substance P in neural and non-neural cells [24,25]. Substance P is encoded by the 4 transcripts of TAC1 [24]. TAC1 expression in the developing neurons is regulated at the transcriptional and translational levels. Translational regulation occurs by negative effects of specific miRNAs [2,22,26,27]. Pro-inflammatory cytokines such as interleukin-1 (IL-1) can reverse the effects of the miRNAs [23]. Transcription of TAC1 in the developing MSCs occurs when the repressor, RE-1 silencing transcription factor (REST), is decreased [11]. REST binding site overlaps with a functional NFκB binding site within the untranslated exon 1 of TAC1 [11]. It is unclear if the decrease in REST alone is sufficient to induce TAC1. This study investigated this question by focusing on 2 cAMP response elements (CRE1 and CRE2). These 2 sites are selected due to their previous roles as activators of TAC1 [28 –30]. Since CRE2 overlaps with a functional activator protein-1 (AP-1) site (CRE2/AP-1) we also investigated the effects of AP-1 [31].
MSCs and other stem cells are currently being tested in several clinical trials [32,33]. Although the results of these trials are mixed, the data thus far showed promise for MSCs. Although MSCs could replace damaged tissues, these stem cells could also protect from neural damage through the production of neurotrophic factors [34]. The immune suppressive properties of MSCs provide these stem cells with an advantage to be delivered as off-the-shelf source to any patient. However, there is still a question if the science is sufficient to plan well-controlled large scale trials. The clinical experience thus far provides strong evidence that MSCs could be a viable treatment. However, the biological properties of MSCs are complex, responding according to the microenvironment [35]. This indicates the need for concurrent testing in both in vitro and in vivo assays and to determine if the former outcome can be recapitulated in more complex system. To this end, we tested the role of TAC1 gene expression in a model of spinal cord injury (SCI) in zebrafish.
The molecular findings were applied in proof-of-principle studies using an experimental model of SCI with transgenic zebrafish (Danio rerio). Zebrafish is an ideal vertebrate model for injury repair and regeneration due to their high fecundity, optical clarity, and regenerative potential, including the generation of functional neurons after spinal cord transection [36 –40]. Multiple neurotransmitter systems in the zebrafish have been described [41 –43]. The ability to image regeneration directly in zebrafish larvae revealed that cAMP can convert a neuron that failed to regenerate across a lesion into one whose axon grows to cross the lesion [44]. That growth was associated with both regeneration of neurons and functional recovery; hence, the use of transparent zebrafish might help to elucidate the signaling pathway relevant to TAC1 activity in regeneration by MSCs. We utilized the HB9-GFP transgenic zebrafish [45] to determine if partly differentiated human MSCs can home to an SCI lesioned area of the preimmune embryos, and then assessed whether modulation of CRE activation, via Jun N-terminal kinase (JNK), could elicit functional repair of SCI.
Materials and Methods
Vectors
Reporter gene vector with the 5′ flanking region of TAC1 (pGL3-Tac1-1.2) was previously described [28]. The 1.2 kb region includes Intron 1, Exon 1, and upstream of Exon 1 (Fig. 1B). pGL3-Tac1-1.2 with mutant CRE sites were described [28,29]. Inducible cAMP early repressor (ICER) II-γ expression vector (pSV2ICER II-γ) [28] was kindly provided by Dr. Carlos Molina, Montclair State University, Montclair, NJ. pβ-gal was obtained from Clontech. REST expression vector, pCMV6-XL4-REST, and the empty vector were obtained from Origene.
CRE activation of TAC1 in the developing MSCs to neurons.
Culture of human MSCs
The method to culture MSCs was previously described [46]. Briefly, MSCs were grown from bone marrow aspirates of healthy individuals between 20 and 30 years. The use of human bone marrow aspirates was approved by the Institutional Review Board of University of Medicine and Dentistry of New Jersey (Newark, NJ). Aspirates were added to vacuum-gas plasma-treated, tissue culture Falcon 3003 Petri dishes (BD Biosciences) in Dulbecco's modified Eagle's medium (DMEM) containing 10% fetal bovine serum (FBS; D10 media). After 3 days, red blood cells and neutrophils were removed by Ficoll Hypaque density. MSCs were used after 4 passages; they were symmetric, CD29+, CD44+, CD105+, CD14−, CD34−, CD45−, prolyl-4-hydroxylase (−) [17]; generated electrophysiologically active dopaminergic and peptidergic neurons [2,3]; and differentiated into osteogenic and adipogenic cells [17].
Neuronal induction
The method of neuronal induction was previously described [47]. Briefly, at 70%–80% confluence, MSCs were subcultured in neuronal induction medium consisting of Ham's DMEM/F12, 2% FBS, B27 supplement, 20 μM retinoic acid (RA), and 12.5 ng/mL of basic fibroblast growth factor. The induced and uninduced cells were labeled for NeuN by immunocytochemistry, and colabeled with phalloidin for structure and 4′,6-diamidino-2-phenylindole (DAPI) to identify the nuclei as described [3]. Images were taken at 200×magnification with an EVOS digital microscope (Advanced Microscopy Group).
Transfection and reporter gene assay
Reporter gene vectors were transiently transfected with Effectene (Qiagen) to 50% confluent MSCs or induced MSCs, as described [23]. D6-induced MSCs were transfected after 4 days of induction, whereas D12-induced cells were transfected after 10 days. At the end of transfection, cells were scraped in phosphate-buffered saline (PBS) and then lysed by repeated freeze–thaw cycles in a dry ice/ethanol bath. Samples were centrifuged at 15,000 g for 5 min at 4°C, and then resuspended in 30 μL of 5×lysis buffer (Promega). Luciferase activities were studied with 10 μL of lysates using the Luciferase assay kit (Promega), and the data are presented as normalized values to β-gal.
Chromatin immunoprecipitation assay
Chromatin immunoprecipitation (ChIP) assay was performed as previously described [11]. Briefly, 3×10⁷ MSCs were induced for 6 and 12 days, and then analyzed with the ChIP-IT enzymatic kit (Active Motif). Parallel analyses were done with uninduced cells (day 0, D0). Chromatin was extracted and sheared DNA was confirmed on 2% agarose gel. Chromatin was immunoprecipitated with anti-c-Jun, anti-activating transcription factor-2 (ATF-2), and anti-HDAC. The enriched chromatin was subjected to polymerase chain reaction (PCR) using primers spanning the CRE1 and CRE2/AP-1 sites (Fig. 1B) with specific primers (Supplementary Table S1; Supplementary Data are available online at
Transplantation model in zebrafish SCI
HB9-GFP transgenic fish [45] were raised at 28.5°C, and maintained as described [48]. To generate SCI in the developing HB9-GFP zebrafish larvae, fish fry were anesthetized at 48–72 h postfertilization (hpf), and were subjected to a clipping spinal cord contusion, as described in the results. We chose to utilize the 48–72 h zebrafish embryonic stage for 2 reasons: (i) the undeveloped immune system at this stage would allow for xenotransplantation of human cells without the need for immune suppression; (ii) embryos demonstrate stereotyped series of locomotive behaviors through development: spontaneous movement beginning at 17 hpf, response to touch with tail-coiling around 21 hpf, and swimming at ∼27 hpf, resulting in forward movement [49]. The locomoter behaviors are affected by SCI, and do not require hindbrain and other supraspinal tissues [50], allowing us to investigate the effects of MSCs on spinal cord regeneration.
MSCs (D6) were labeled with Q-Tracker 605 Cell Labeling kit (Invitrogen) per manufacturer's instructions. Equal numbers of MSCs with various treatments were transplanted in 48 hpf larvae by injections of 100 cell/larva into the spinal cord after 2–12 h of SCI. The total numbers of injected MSCs were determined to closely recapitulate the cell doses recently used for cell therapy in human SCI (range, 0.1–10×106 MSC/kg). Accordingly, we calculated a cell dose of 10–1,000 MSCs/zebrafish larva based on the average weight of the larva, and the size of the lesion. We first performed several trial injections in SCI larvae with escalating cell doses of 10 to 1,000 uninduced and induced MSCs. Cell doses of 500 or higher resulted in a significant increase in mortality, whereas cell doses of 100 cells/larva did not affect the survival of injected larvae. Therefore, all experiments were performed with 100 cells, which resulted in reproducible effects. The numbers of injected MSCs were confirmed by parallel injections on glass slides. Slides were fixed, stained with Giemsa, and cells were counted. After cell injections, wounds were sealed with histoacryl (Braun), and the fish were kept isolated in the dark for 12 h with prophylactic antibiotics, and then kept after surgery for 2 weeks at 33°C. All fry with any sign of necrosis were omitted from analysis.
Fry were monitored, and their locomotor functions were assessed. Spontaneous movements, touch-evoked coiling, and swimming (STS) movements were recorded using a digital high speed video camera attached to a fluorescent microscope (Zeiss). All recordings were performed at 28.5°C, and touch was evoked to the embryo tail by tapping using a blunt spatula. A single-touch stimulus trial consisted of up to 5 touches separated by at least a minute, and a tail flip was considered a positive response. All responses were pooled to yield a percentage response. Movies were recorded at a rate of 25 frames/s for 3–5 min, and were acquired using Axiovision software (Zeiss). The movies were then analyzed, and each embryo movement was scored to calculate the number of movements/min.
Zebrafish locomotor and sensory activity
To develop readout for the effects of MSCs in zebrafish, a quantitative functional test of locomotor activity that exploits the natural behavior of zebrafish to swim was employed. Previous reports in zebrafish and xenopus embryos provided a framework to study the zebrafish locomotor functions using STS behaviors [50 –52]. Investigators blinded to the type of therapy measured the total distance moved by undisturbed fish during 5 min trial periods by automatic video tracking, and compared the cell therapy treated fish to the control fish. Pain as a measure of sensory response was evaluated by repeated trials of pinprick to the side of the tail, and scoring a positive response by moving away.
The functional score, adapted from the ASIA scale of human SCI, was normalized to each group of control fish. The normal fish response was considered a full 50 point score.
Statistical analyses
Statistical analyses were performed by Student's t-test, analysis of variance (ANOVA), Tukey–Kramer multiple comparisons, and Mann–Whitney U test, with P<0.05 considered as significant.
Results
Distinct timeline activation of TAC1 by CRE1 and CRE2
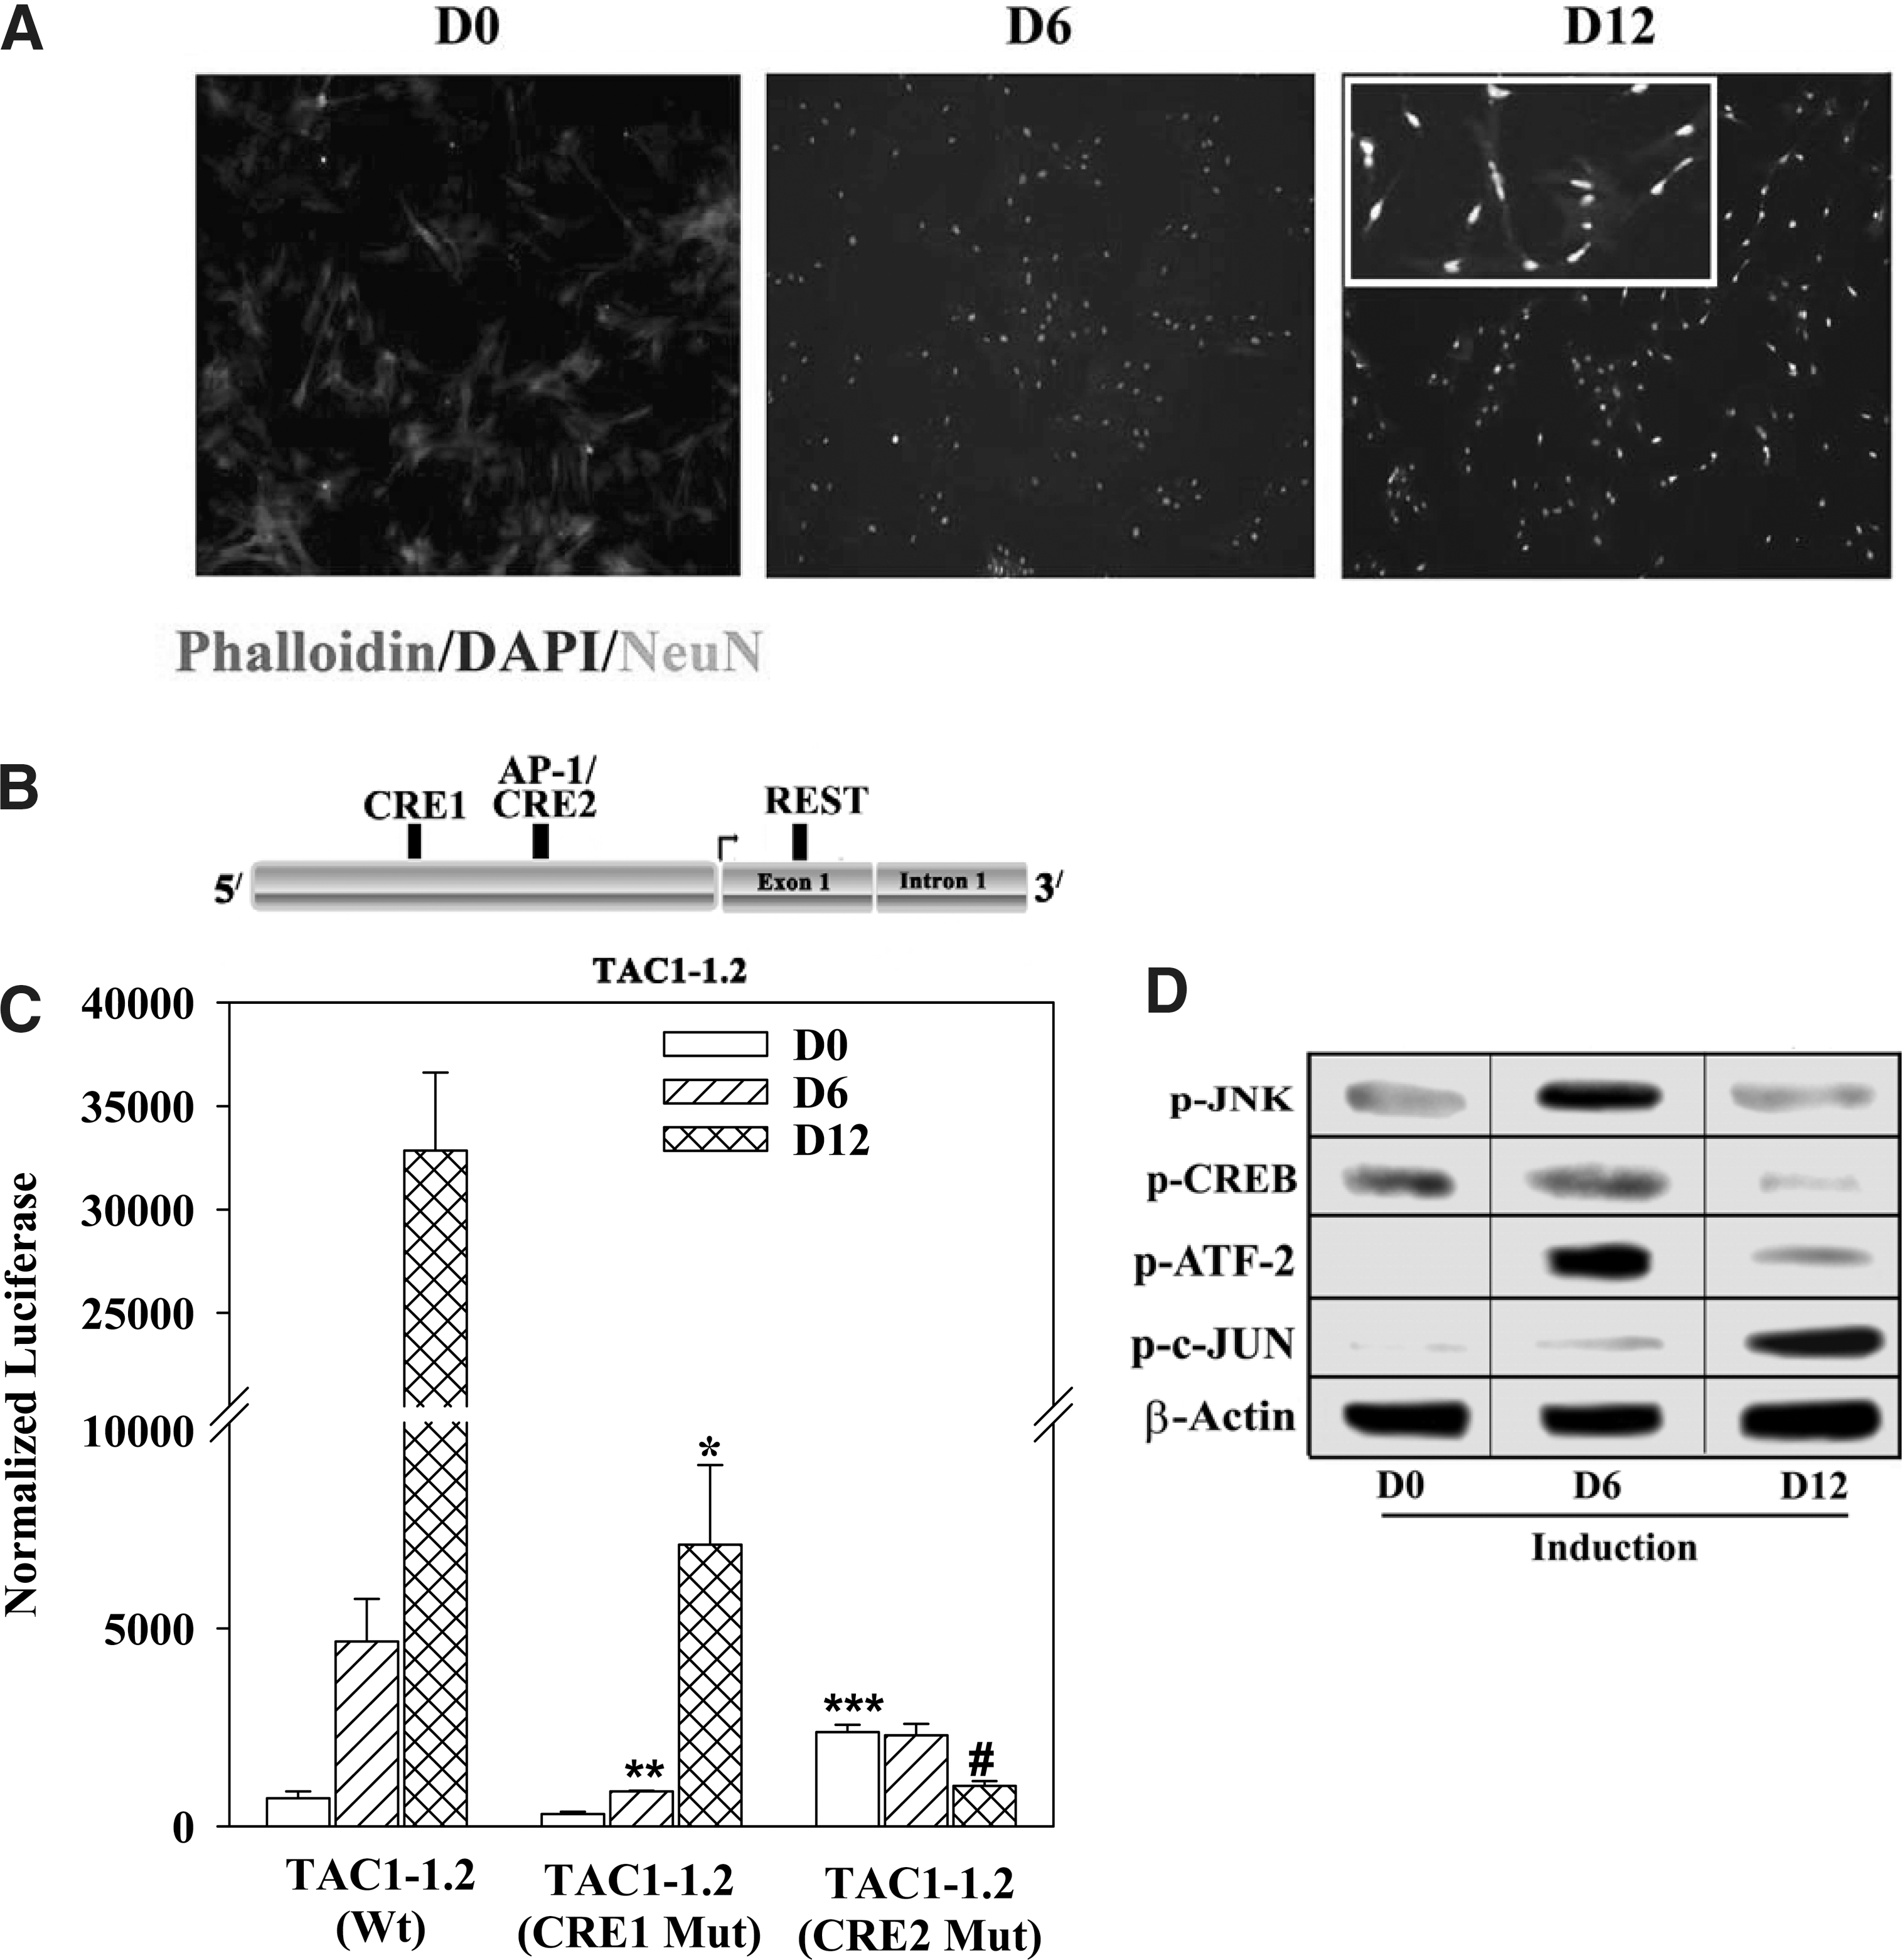
To study the developmental regulation of TAC1, we performed timeline analyses in MSCs induced to form peptidergic neurons [2,47]. NeuN was expressed at 12 day induced MSCs (Fig. 1A), which is consistent with the generation of electrophysiologically functional neurons at this time period [2,47].
The roles of CRE1 and CRE2/AP-1 (Fig. 1B) were studied with reporter gene studies in which induced MSCs were transfected with pGL3-Tac1-1.2 containing wild-type (Wt) or mutant CRE (Mut) sites [28] (Fig. 1B). The studies were performed with MSCs, uninduced (D0) and induced for 6 (D6), and 12 (D12) days. ANOVA compared D0 with D6 and D12 (Wt) and the results indicated significant (P<0.05) increase in luciferase during induction (Fig. 1C, left group). Student's t-test comparison between D6 and D12 (Wt) indicated significant (P<0.01) increase in luciferase at D12. Similar analyses for CRE1 Mut indicated comparable results, but with significantly (P<0.05) lower levels of luciferase as compared with Wt CREs (Fig. 1C, middle group). Together, the results indicated an activator role for CRE1.
In the studies with CRE1 Mut, CRE2 was available for activation. We therefore analyzed similar studies for CRE2 in which this region was mutated. Student's t-test comparison between uninduced cells for CRE2 Mut, CRE1 Mut, and Wt indicated significant (P<0.05) increase in luciferase for CRE2 Mut (Fig. 1C, open bars). This suggested a repressor role for CRE2 in uninduced MSCs. We next performed Student's t-test comparison between D6 with CRE2 Mut, CRE1 Mut, and Wt. There was a significant (P<0.05) decrease in luciferase with CRE1 Mut as compared with CRE1 Wt (Fig. 1C, diagonal bars). Together, these studies with D6-induced cells further supported a repressor role for CRE2 on CRE1 activation. ANOVA at D12 for CRE2 Mut with CRE1 Mut and Wt indicated a significant (P<0.05) decrease, indicating an activator role for CRE2 at late stage differentiation. Together, at D6, CRE1 appeared to be the dominant activator and at D12, CRE2. The results also indicated a repressor role for CRE2 on CRE1.
CRE-binding proteins in uninduced and induced MSCs
Western blots for CRE-binding proteins were performed with whole cell extracts from D0, D6, and D12 cells. Extracts were studied with antibodies specific for phosphorylated (p)-CREB (p-CREB), p-ATF-2 and p-c-JUN, an AP-1 subunit. The latter was included because AP-1 binding site overlaps with CRE2 site in TAC1 [31]. We also included JNK because it could be an upstream activator of c-Jun and ATF-2 [53,54].
The results showed increases in both p-JNK and p-ATF-2 at D6, and an increase in p-c-JUN with D12 extracts (Fig. 1D). The bands for p-CREB were similar at D0 and D6, but significantly reduced at D12. Supplementary Fig. S1 showed the normalized band densities based on bands for β-actin. The experimental antibodies were specific for the phosphorylated forms of the proteins. To accurately compare the different treatment groups, it was necessary to normalize with bands for β-actin to prevent differences in loading extracts. Together, the results indicated p-JNK at all time points with an increase at D6; activated c-Jun was detectable at D12 with concomitant decrease in p-ATF-2 and p-CREB. These findings show distinct timeline changes in each CRE binding protein (Supplementary Fig. S2), suggesting that the developmental activation of CRE1 and CRE2 could occur by distinct signaling pathways.
Negative effects of ICER on reporter gene activation
The role of CRE1 and CRE2 were validated by cotransfecting pGL3-Tac1-1.2 with a negative regulator of cAMP signaling, ICERIIγ [55]. ICER competes with p-CREB and p-ATF-2 for binding to CRE sites. At D6 and D12, luciferase levels were significantly (P<0.05) decreased in pSV2ICER II-γ transfectants as compared D0 (Fig. 2A, hatched bars). Vector control for D6 and D12 showed significantly (P<0.05) more luciferase as compared with D0 (Fig. 2, open bars). This is consistent with untransfectants (Fig. 1C, left group of bars), indicating that the vector alone in Fig. 2 did not show any untoward effect. In summary, this section confirmed functional roles for the CRE sites in TAC1 regulation.

Effect of ICER II, JNK, and PKA on pGL3-Tac1-1.2 activity. MSCs, uninduced (D0) or induced with neuronal induction media for 6 (D6) and 12 (D12) days. Cells were cotransfected with pGL3-Tac1-1.2 and pSV2ICER II-γ
Effects of JNK and PKA in TAC1 activation
We repeated the reporter gene assay with JNK and PKA inhibitors due to their ability to activate CRE-binding proteins [31,53,56]. The reporter gene studies were repeated for D0, D6, and D12 with wild-type CRE sites, in the presence or absence of 10 μM of JNK inhibitor (SP600125) or 2 μM of PKA inhibitor (H89). Control studies contained vehicle. The optimal levels of JNK and PKA inhibitors were determined in dose–response studies (not shown). JNK inhibitor caused a significant reduction in luciferase in uninduced (D0; P<0.05), D6 (P<0.01) and D12 (P<0.001) as compared with vehicle (Fig. 2B). PKA inhibitor resulted in significant (P<0.01) decreases for D0 and D6 and significant increase (P<0.01) for D12 as compared with vehicle (Fig. 2C). Since PKA should not affect AP-1 and this site overlaps with CRE2 (Fig. 1B), the findings indicated that PKA is linked to CRE1 at D6 and AP-1 to CRE2 at D12.
JNK inhibitor and ICER on reporter gene activation
We investigated an upstream role of JNK in the activation of CRE sites using reporter gene analyses. CRE activation was blocked with pSV2ICER II-γ. Since TAC1 was not expressed in uninduced MSCs (D0; Figs. 1 and 2) [23], we focused on D6 and D12. At both time points (Fig. 2D, E) luciferase levels were significantly (P<0.01) decreased with pSV2ICER II-γ and JNK as compared with JNK inhibitor or ICER transfectants. These results suggested that JNK could be upstream activator of AP-1 and CRE binding proteins.
ChIP for c-JUN and ATF-2 to TAC1 in induced MSCs
The results described thus far indicated that the TAC1 gene was developmentally regulated. Previous studies with gel shift assays indicated that CRE and AP-1 could interact with the TAC1 gene [28,31]. These reports provided firm evidence for the ability of CRE and AP-1 to bind TAC1; however, the timeline of these interactions during development of MSCs to neurons remains undetermined. We therefore performed ChIP assay to determine if AP-1 and ATF-2 bind to genomic CRE1 and CRE2/AP-1 on TAC1, respectively. We first immunoprecipitated the DNA-binding proteins with anti-ATF-2 and anti-c-JUN (AP-1) and then determined if the precipitates were in complex with gDNA by PCR, using primers (Supplementary Table S1) spanning the CRE sites (Fig. 3A).
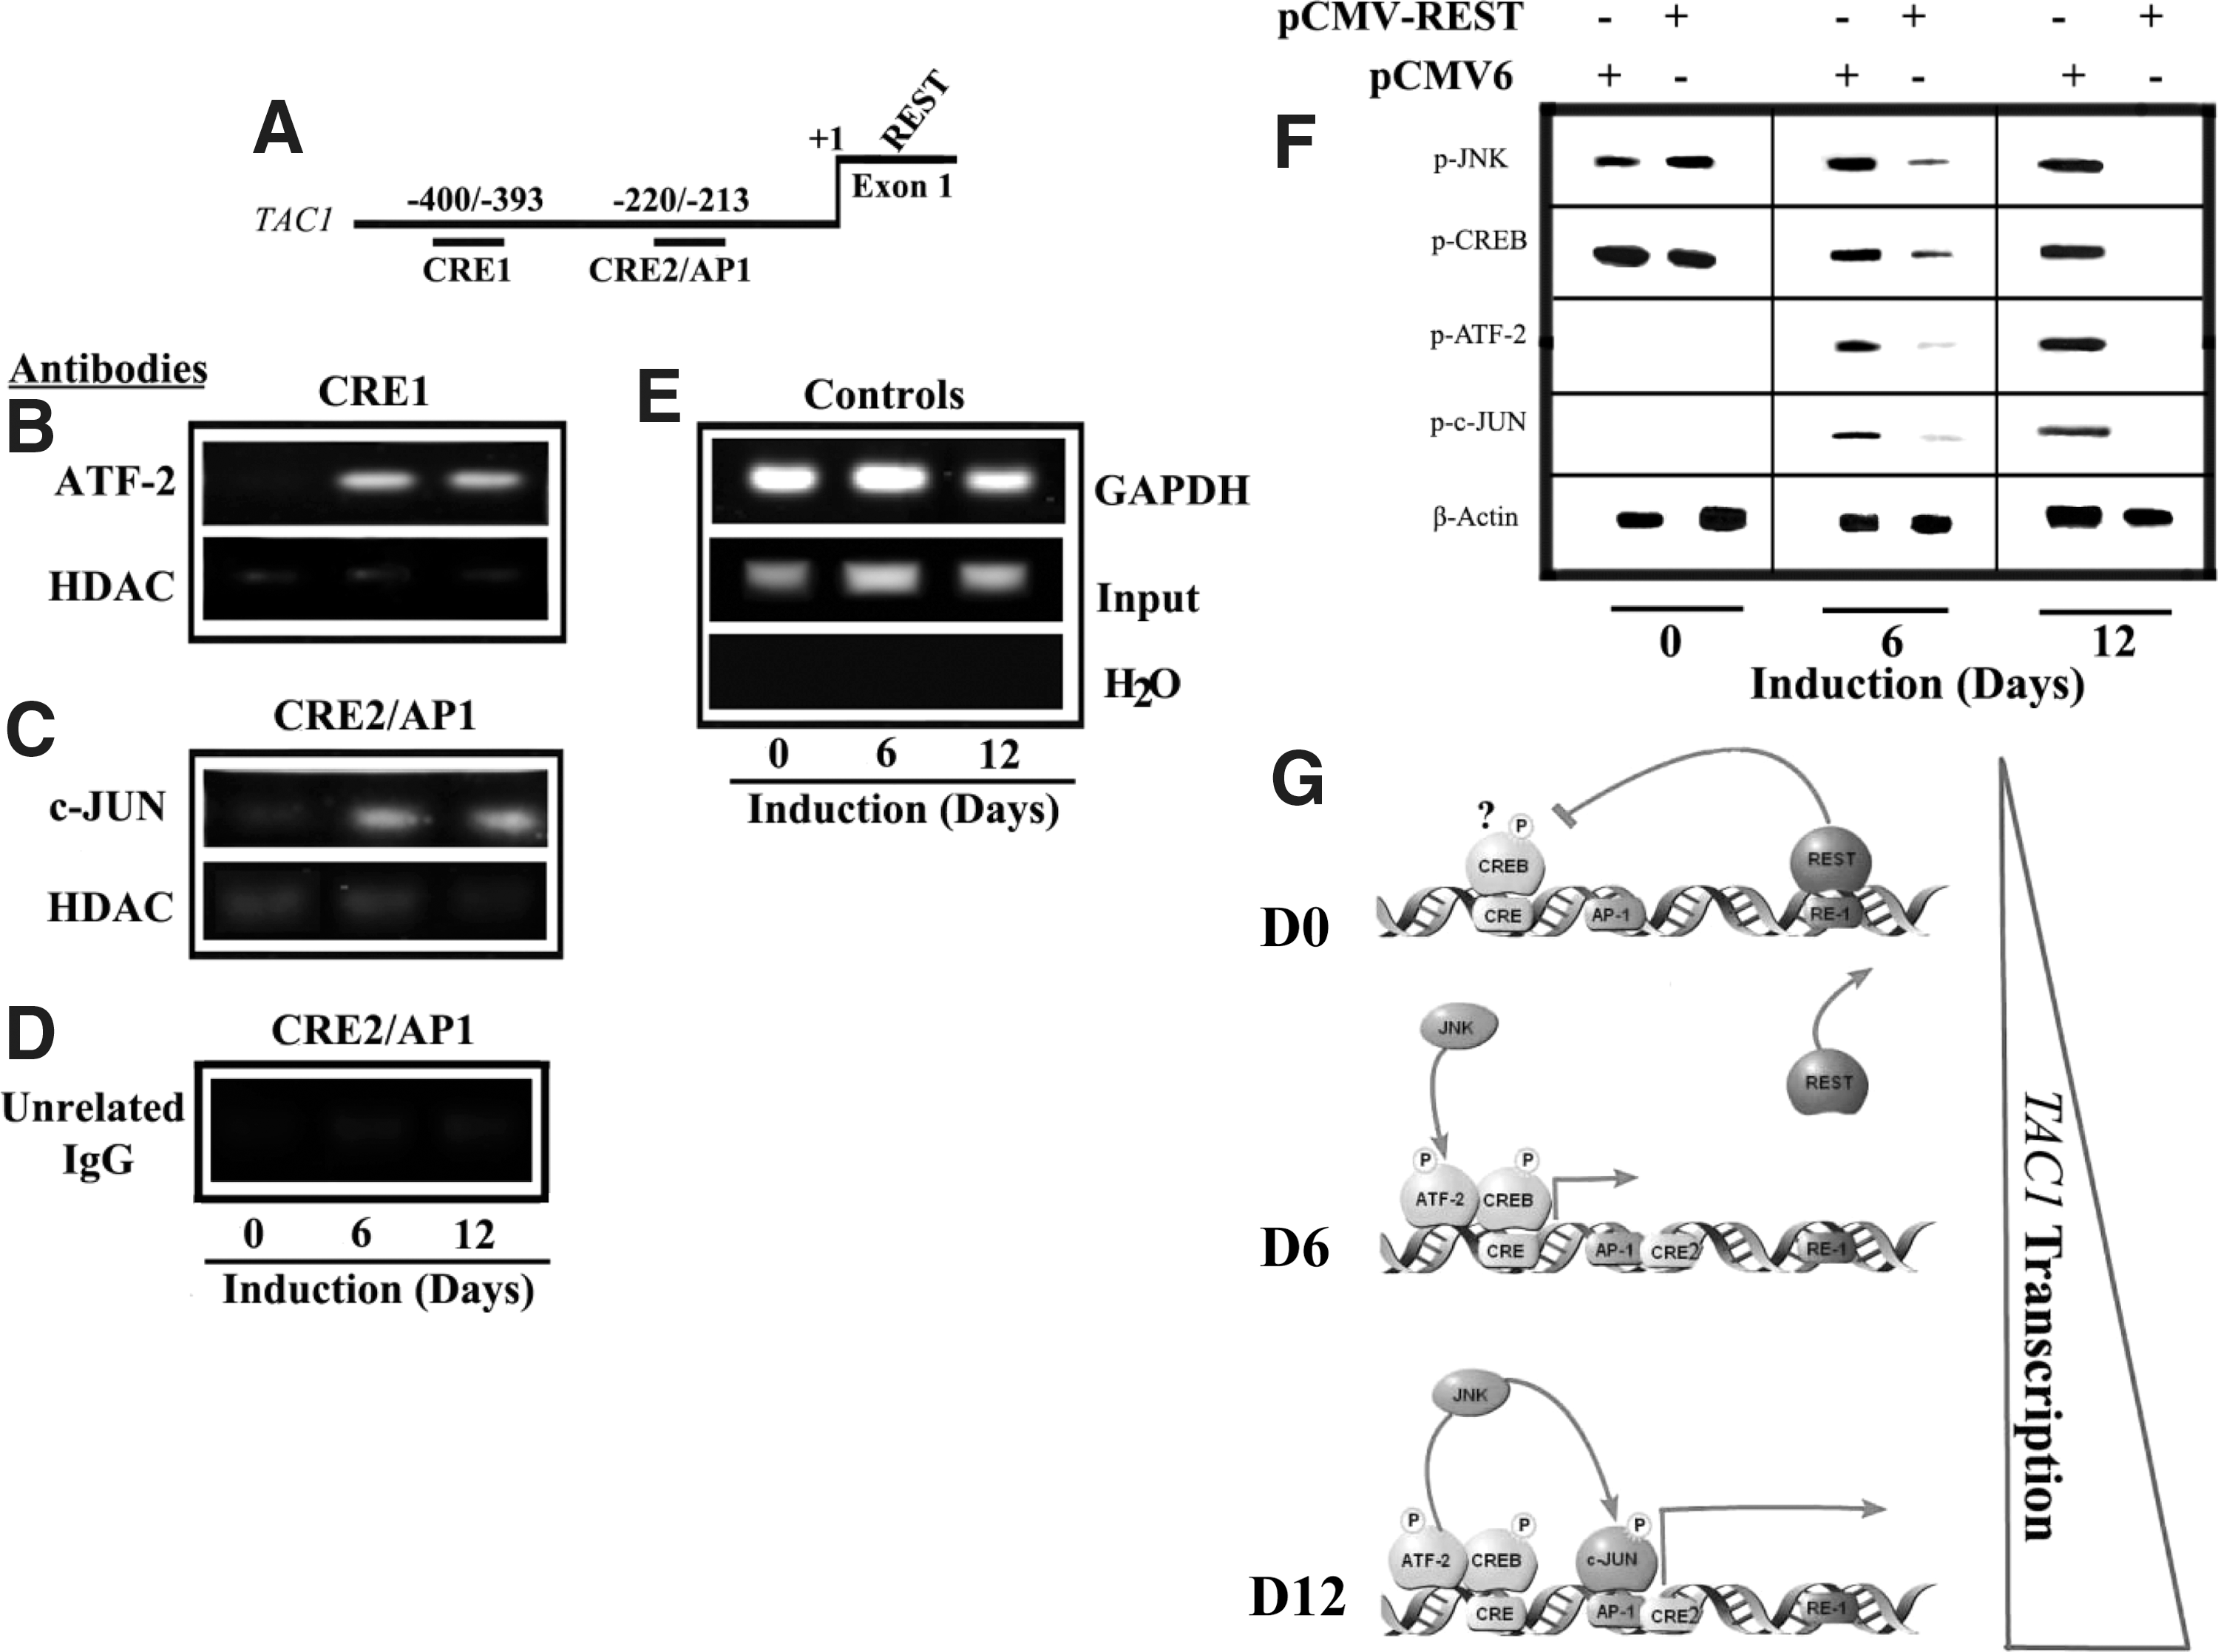
ChIP assay for ATF-2 and AP-1 in the 5′-regulatory region of TAC1 and role of REST. The relative positions of CRE1 and CRE2/AP-1 regions within the TAC1 gene are shown
There were strong bands with CRE1 primers in anti-ATF-2 precipitates at D6 and a lighter band at D12 (Fig. 3B). Precipitation with anti-HDAC resulted in weak bands within the same area, indicating that the gDNA was accessible. The presence of p-CREB in uninduced MSCs (D0; Fig. 1D) is consistent with a weak band for anti-HDAC precipitation. Precipitation with anti-ATF-2 showed low to undetectable band for each time period with primers spanning CRE2/AP-1 region (not shown). Together, Fig. 3B showed ATF-2 interaction with the CRE1-TAC1.
We next repeated the ChIP assay with anti-c-JUN, which is a subunit of AP-1 and then performed PCR with primers spanning the CRE2/AP-1 site (Supplementary Table S1). We observed bands at D6 and D12 cells, but not at D0 (Fig. 3C). These findings were consistent with the presence of c-JUN at D6 and D12 (Fig. 1D). PCR with anti-c-JUN precipitate showed a light to undetectable band with primers spanning CRE1 (not shown). The specificity of the reaction was determined with an unrelated IgG (Fig. 3D). Positive controls were performed for GAPDH and Input DNA (Fig. 3E). The ChIP studies, in combination with the findings in Fig. 1D, are summarized in Fig. 3G. The cartoon shows the relevant binding proteins at specific time points on the TAC1 gene during neuronal development.
The data indicated that p-CREB interact with CRE1 in D0 MSCs (Figs. 1D and 3A, G). p-ATF-2 was increased at D6 and reduced at D12 (Fig. 1D) and, interacted with the CRE1 site at D6 and D12 (Fig. 3A). The presence of p-CREB at D6 made it likely that the CRE1 site could be occupied by ATF-2 and/or p-CREB (Fig. 3G). Since only anti-c-JUN amplified the CRE2/AP-1 site with concomitant weak bands for anti-HDAC (Fig. 3C), we deduced that AP-1 interacted with CRE2/AP-1 at D6 and D12 (Fig. 3F). There was reduced p-c-JUN at D6 as compared with D12 (Fig. 1D), but detectable bands at both time periods in the ChIP assay. Therefore, it is likely that AP-1 might interact with CRE2 at both D6 and D12.
Role of REST in the expression of CRE activators
The decrease in REST was important for the induction of TAC1 in induced MSCs [11]. In this section we asked if the decrease in REST was required for the activation of JNK, CREB, ATF-2, and c-JUN. REST was ectopically expressed in D0, D6, and D12 MSCs and then studied for the activator proteins by western blots. Parallel studies were performed with vector transfectants. Since REST is already expressed in uninduced MSCs (D0) [11,57], ectopic expression did not affect changes in p-JUN, p-CREB, and p-JNK (Fig. 3F, lanes 1 and 2). In contrast, there was significant reduction in the phosphorylated forms of all proteins at D6 (Fig. 3F, 2 middle lanes) with more pronounced changes at D12 (Fig. 3F, left 2 lanes). In summary, the results indicated that REST decrease is required for the activation of JNK, c-JUN, CREB, and ATF-2.
Zebrafish neural regeneration after SCI and MSCs transplant
The next set of studies applied the molecular findings in a model in which we generated SCI in the developing HB9-GFP zebrafish larvae. The larvae were anesthetized with MS-222 (Tricaine) and subjected to a spinal cord contusion. A small incision was made under a stereomicroscope at the side of the fish to expose the vertebral column, which was then subjected to a clipping contusion between somites 15 and 17 at a level halfway between the dorsal fin and the end of the tail, caudal to the brainstem/spinal cord transition zone. This type of contusion represents an SCI lesion equivalent to a thoracic SCI in mammals. We selected day-6-induced MSCs (D6) since D12 MSCs are fully differentiated into electrophysiologically responsive neurons, and therefore it will not be possible to determine if developmental processes are involved in the SCI repair mechanism [2]. Additionally, we hypothesized that partly differentiated MSCs might retain beneficial anti-inflammatory and immune-modulatory functions that would positively improve the SCI repair process.
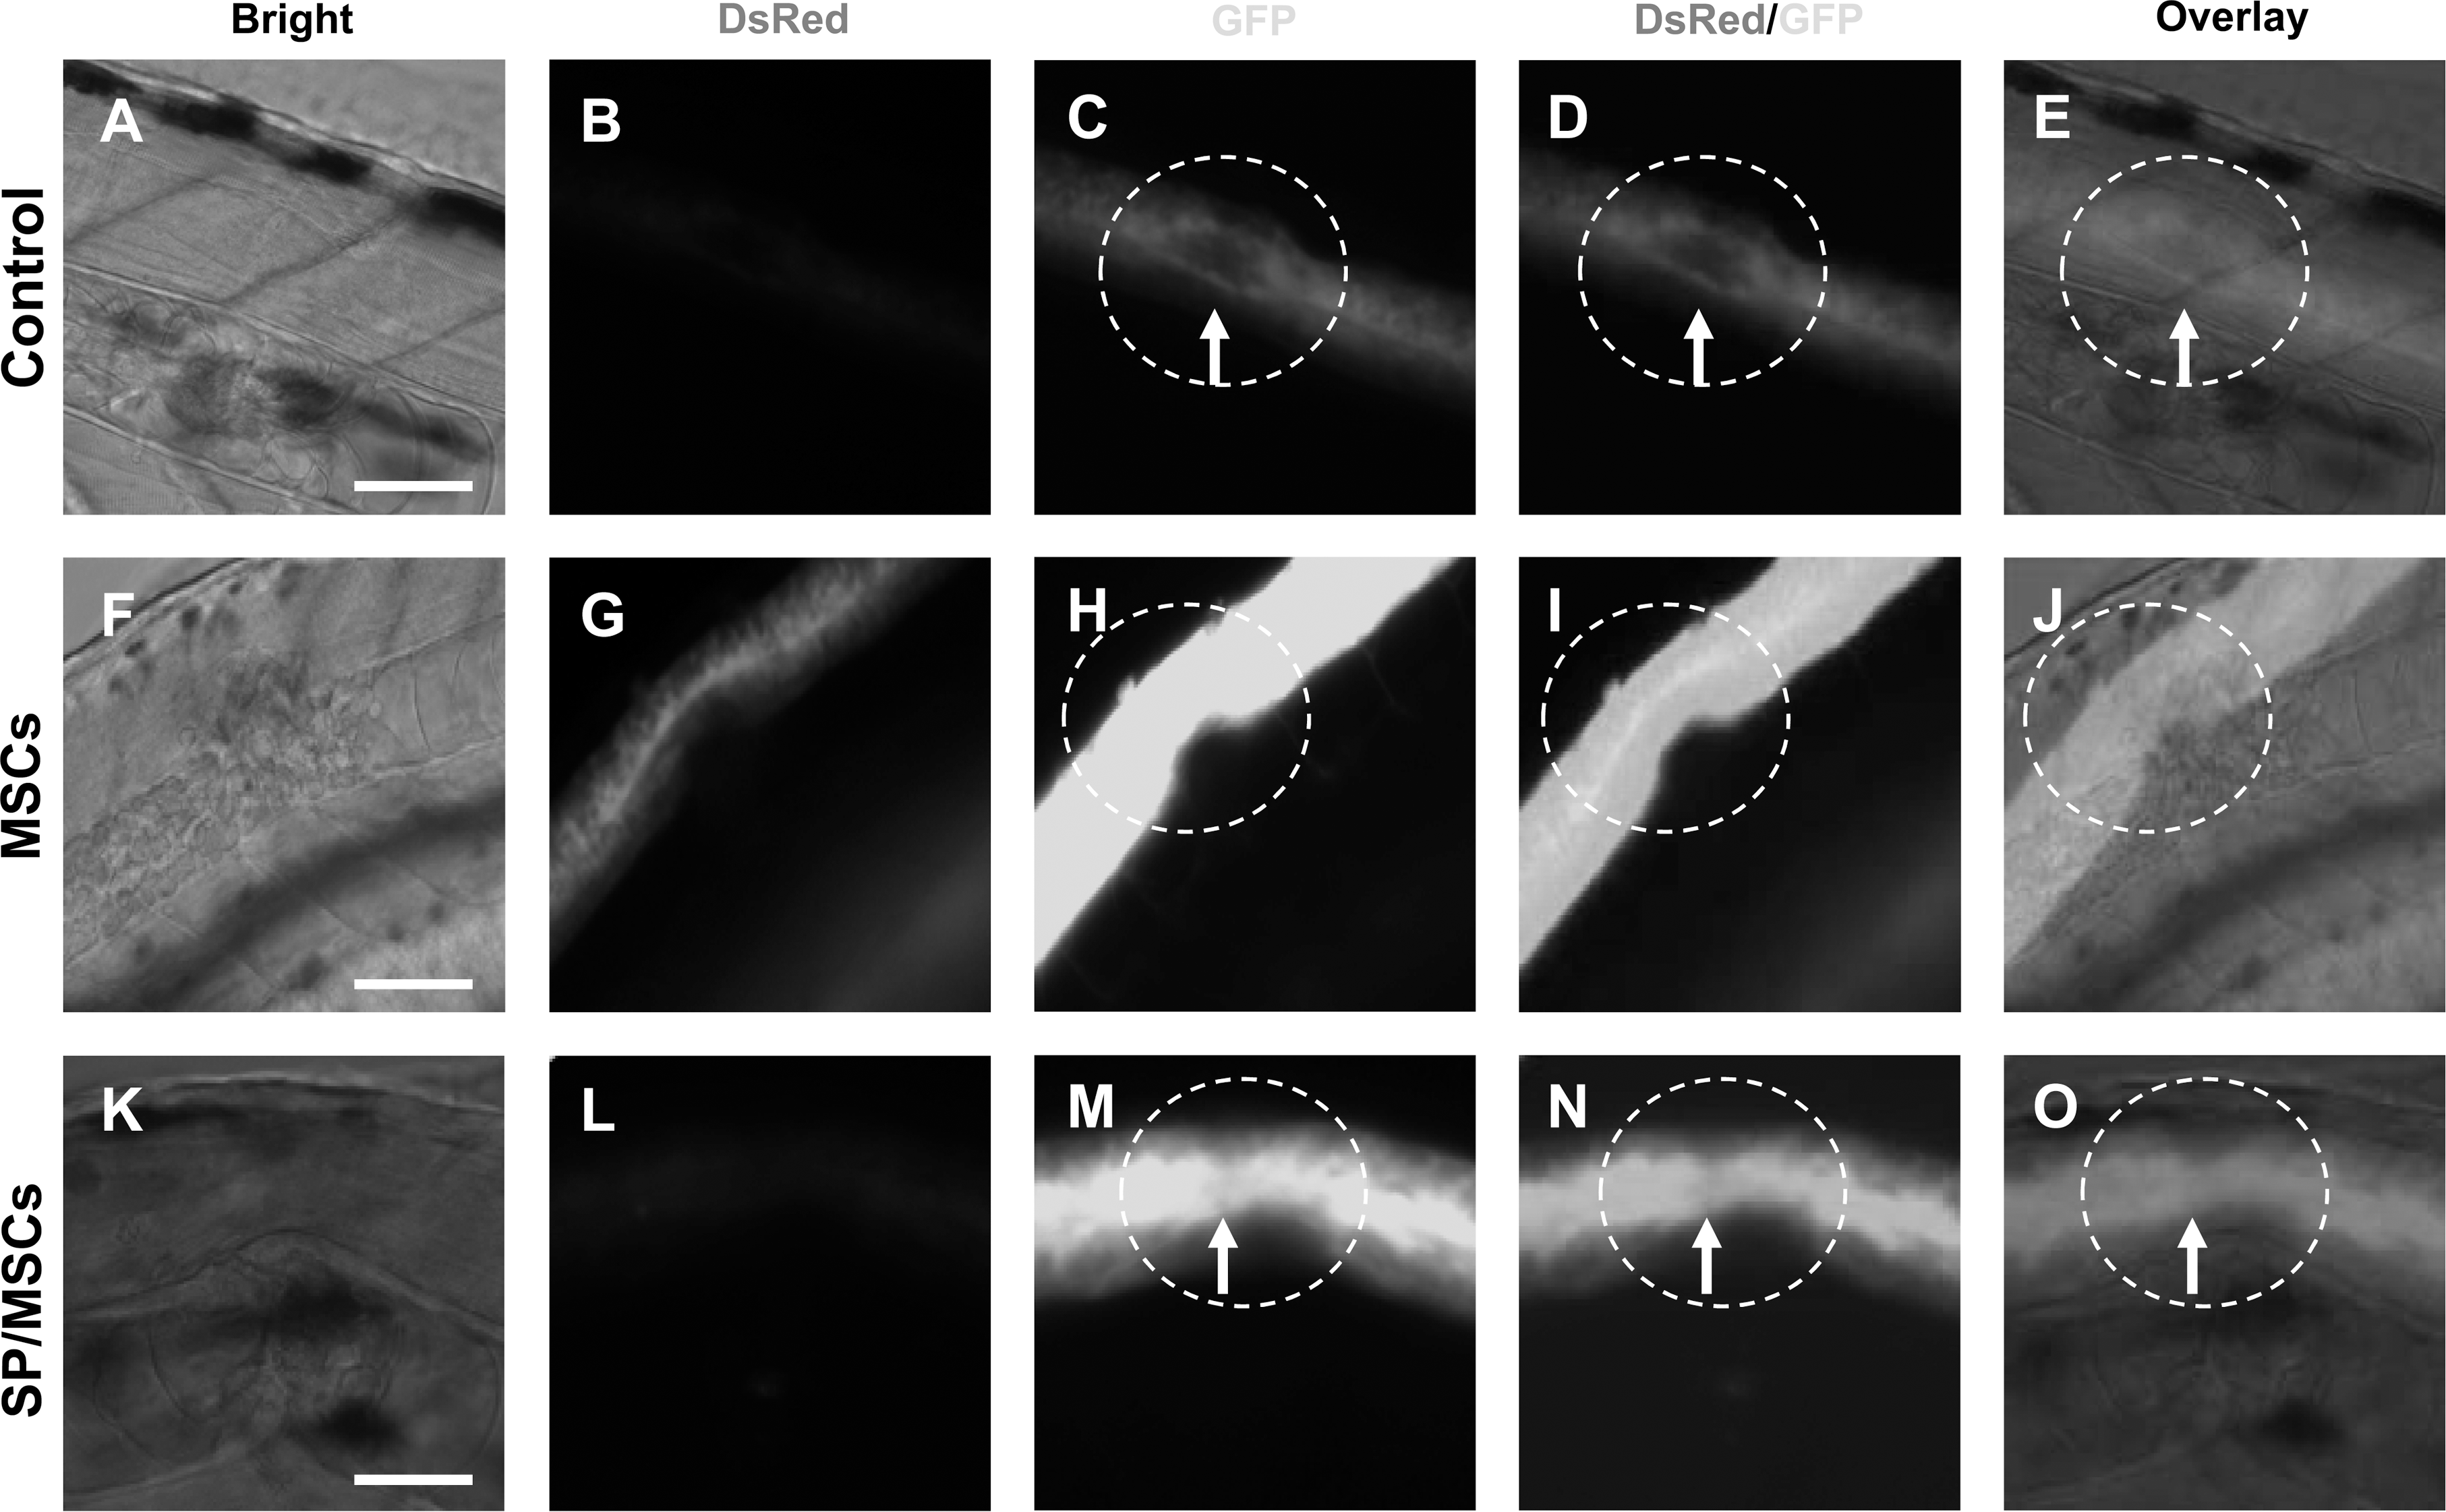
D6 MSCs were labeled with quantum dots (QDs) and injected into the spinal cord below the injury site with a microinjector. After 24 h of SCI, vehicle (PBS)-injected fish demonstrated inflammatory swelling and edema at the injury site (Fig. 4A–C), and a vacuolated lesion at their spinal cord (Fig. 4B, C, white arrows). Fish subjected to the same contusion SCI and transplanted with MSCs demonstrated better wound healing as evidenced by disappearance of the inflammatory swelling and skin repair in a significantly larger number of MSCs transplanted fish compared with controls (Fig. 4D as compared with Fig. 4A). The transplanted QD-labeled MSCs were found at the site of the injured cord, indicating homing to the injury site (Fig. 4E and F, red arrows). QD-labeled cells were seen throughout the spinal cord (Fig. 4I–K). Higher power images of the spinal cord in D6 MSCs-transplated fish (Fig. 4G–K) demonstrate that the gap of SCI (Fig. 4G, H) contained QD-labeled cells with extended filopodia (Fig. 4I–K, insert and arrows) from below the cord to the area of the contusion. These data demonstrate that D6-induced MSCs home to the site of injury after transplantation into the spinal cord of SCI fish, and suggest that MSCs might contribute to the repair process.

Quantum dot (QD)-labeled MSCs integrate into the injured cord after SCI. QD-labeled D6 MSCs are shown in the bright field, DsRed field at wavelength 605 nm, and in overlay images. Spinal cord contusion was performed on 48 h postfertilization (hpf) HB9-GFP transgenic embryos (n≥20 embryo/group in 3 independent experiments).
One week after the SCI, vehicle-transplanted fish demonstrated cavitation of the contusion injury site, and significantly less green fluorescent protein (GFP) fluorescent intensity, suggesting limited neural regeneration in these HB9-GFP fish (Figs. 5A, 6C–E, insets). This contrasts to D6 MSC-transplanted HB9-GFP fish, which showed both increased GFP fluorescence intensity suggestive of neural regeneration, with substantial numbers of MSCs-derived DsRed+cells connecting the ends of the lesion boundaries (Fig. 5B). The cells that coexpressed DsRed and GFP showed filopodia and projections (Fig. 6G, I) that penetrated across the lesion site, suggesting axonal differentiation into the spinal circuitry of the HB9-GFP fish.

Inhibition of JNK, but not MEK, modulates the effects of MSCs on zebrafish SCI repair
QD-labeled DsRed+cells are detected after MSCs transplant in SCI.
Since JNK inhibitor reduced luciferase activity in D6-induced MSCs (Fig. 2), we transplanted D6 MSCs that were pretreated with the JNK inhibitor for 24 h. The results showed a significant decrease in the numbers of QD-labeled cells in the injured cord (Fig. 6L), and less efficient repair and bridging of the contusion gap (Fig. 6M–O).
Functional recovery of SCI with D6 MSC
To analyze the functional effects of D6 MSCs transplanted in the SCI fish, we established a quantitative neurological activity test in zebrafish embryos (Supplementary Table S2). The kinetic parameters of zebrafish locomotor behavior included STS, and the sensory behavior included response to pinprick in the tail. We measured the total moving distance of undisturbed fish, and those exposed to an intense beam of light during 5 min trial periods using video recording. Intact embryos responded to a touch stimulus by coiling the tail and swimming away from the touch stimulus (Supplementary Movie S1). The initial tail coil was followed by a second tail flip, and then episodes of continued, alternating movements of more than 4 coils. Light touch was applied with a blunt spatula to the tail over the yolk extension. Although it is difficult to accurately reproduce the precise timing and magnitude of the touch stimulus using this method, it evoked a more reliable response than applying a pulse of embryo water (data not shown).
One day after SCI, the total distance the larvae moved, and moving away from the source of light were strongly reduced to 7.5% (7+2 cm/5 min, n=18) of that in the intact fish larvae (130+30 cm/5 min, n=20). Larvae with SCI demonstrated significantly lower rates of spontaneous movements and diminished touch-evoked coiling (Supplementary Movie S2), and were not able to swim. Intact larvae responded to bright light stimulation by swimming away from the fixed source of light using the well-described C-like bend away movements [51], followed by alternating, lower amplitude tail flips that allowed the larva to propel and swim away from the light stimulus. Larvae with SCI were not able to swim, and only responded by moving their pectoral fins (Supplementary Movie S3). In some cases, larvae with SCI executed few C-like tail flip, followed by alternating, lower amplitude tail flips that was not strong enough to propel the embryos in the water. Swimming behavior composed of longer duration tail flips was only observed in 7% of the touch stimulus trials in SCI fish as compared with 90% of the trials in intact larvae, and the duration of the propelling second tail flip was significantly reduced (Supplementary Table S2). The response to pain showed wide variations among the groups of larvae, but improvement after D6 MSCs transplant was reflected in the modest increase of larvae response to pinpricks in the tail region after MSCs transplant compared with vehicle indicating an enhanced sensory recovery.
The recovery of SCI larvae after MSCs transplants was demonstrated by the increase in response to touch, the initial flip duration, and swimming behavior (Supplementary Table S2 and Supplementary Movie S4) that was reflected in progressive increase of the STSP functional score at days 1, 4, and 7 after transplants (Fig. 7). Once again, pretreatment of MSCs with the JNK inhibitor resulted in significantly lower improvement of both swimming behavior (Supplementary Movie S5), and neurological functional scores, further confirming the requirement of the JNK pathway activity for the functional response of induced MSCs in the repair of SCI. JNK pathway activity requirement in MSCs development to neurons appears to be specific, since pretreatment of MSCs for 24 h with the mitogen activated protein kinase (MEK)/ERK inhibitor U0126 did not significantly attenuate MSCs induced recovery (Fig. 5C). Moreover, bathing of the SCI larvae in 10 μM of either the JNK or the MEK/ERK inhibitors without cells showed no recovery with similar outcome as vehicle treatment (Supplementary Table S2), suggesting that the presence of D6 MSCs at the sites of injury is an integral factor in the enhanced the neural recovery process.
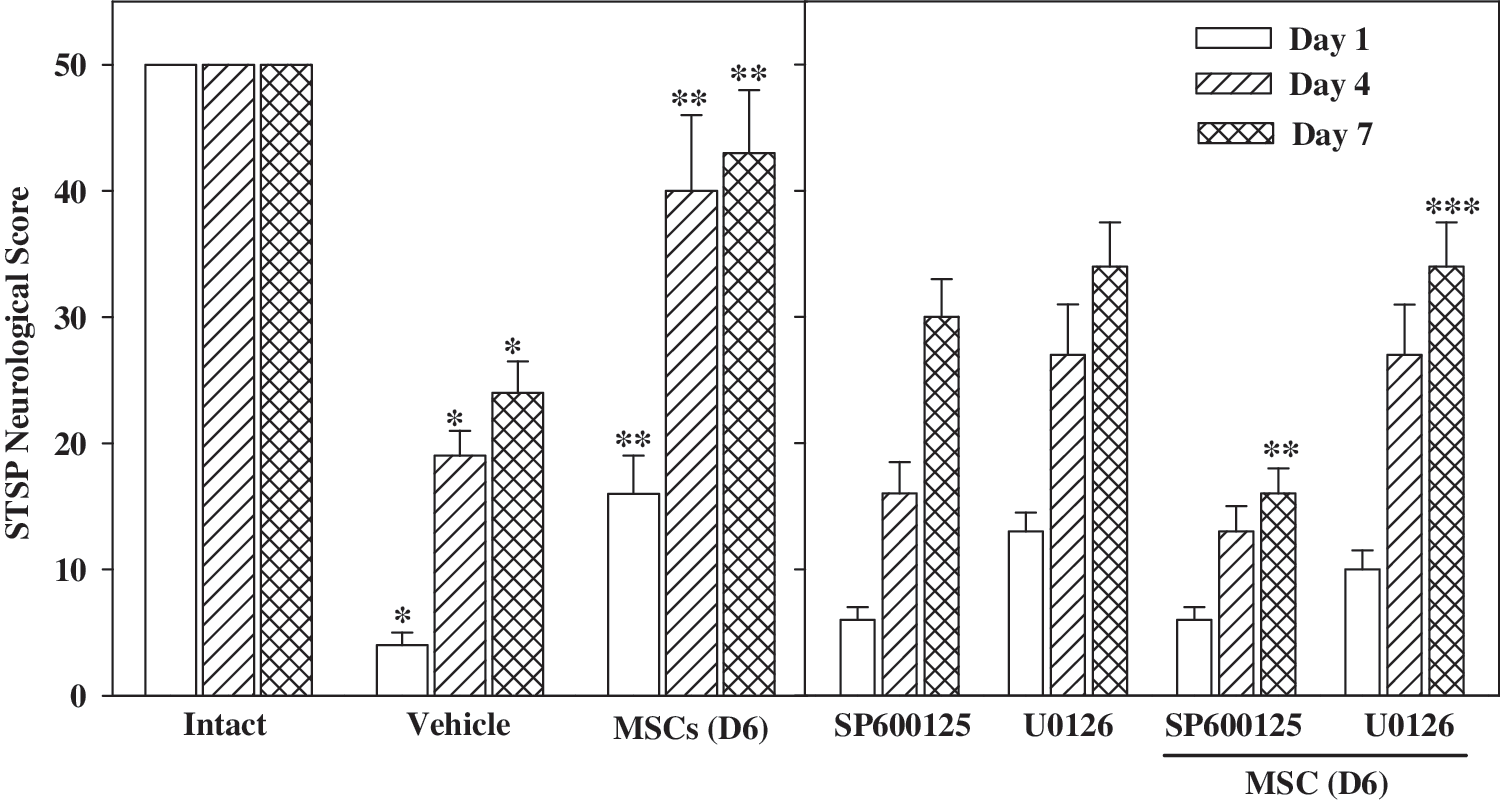
MSCs improve locomotor and sensory function after transplantation in zebrafish SCI. The neurological STSP scores of 50 points describe 3 locomotor parameters: spontaneous movements, touch-evoked coiling, and swimming (STS) scores, with 10 points each, and a sensory parameter of pain (P) with 20 points. Intact fish were used as a reference in the assays with a 100% score of 50 points. Assays were performed first on control or vehicle-treated larvae, and the drop in scores after SCI was established. Scores are displayed as the mean+standard error of the mean, using at least 12 injected larvae per assay. SCI larvae with SP600125-treated MSCs (SP600125/D6 MSC) demonstrated significantly lower scores than any other MSCs transplanted treatment at days 1, 4, and 7 (*P<0.01). The scores from these larvae were also significantly lower than D6 MSC (**P<0.005), and D6 U0126-MSC-treated larvae (***P<0.005), respectively. STSP, spontaneous movement, touch-evoked coiling, swimming, and pain.
Since zebrafish demonstrate some spontaneous recovery within 48 h of SCI [44], we compared GFP intensities 1 week after the injury, as a measure of axonal regeneration in the HB9-GFP transgenic fish, in MSCs transplanted fish compared with nontransplanted SCI fish, and intact controls. Improvements were seen with MSCs that enhanced the fish spontaneous recovery as measured by GFP intensities of 43%±4% in PBS-treated fish versus 67%±18% in SP600125-pretreated MSCs, and 87%±7% with D6 MSCs transplants (representative GFP intensities are demonstrated in Fig. 6C, H, and M). It is worth noting that the locomotor scores recorded at 4 days post-SCI and transplant were twice higher than those recorded for fish with spontaneous recovery at 1 week, indicating that MSC therapy not only augment the fish recovery after SCI, but also accelerate the recovery time.
Discussion
We reported on the molecular mechanisms of TAC1 expression during the development of MSCs to peptidergic neurons. The results indicated developmental roles for the 2 CRE sites within TAC1 With upstream activation of JNK (Figs. 1 –3). The significance of these findings was tested in pilot studies, using an experimental model of SCI in zebrafish. In these studies, JNK activation was shown to be critical for SCI repair.
Multiple lines of evidence indicated that CREB interacted with CRE1 in uninduced MSCs (D0; Figs. 1D and 3). The role of p-CREB at D0 is unclear since TAC1 is not expressed in uninduced MSCs, due to the presence of the repressor, REST [22,23]. The presence of p-ATF-2 in the induced MSCs (Fig. 1D) was functional with respect to its interaction with CRE1 at D6 and D12 (Fig. 3B). AP-1, on the other hand, interacted with CRE2/AP-1 site (Fig. 3C). JNK activation is required for downstream activation of ATF-2 and AP-1 (Figs. 2B and 3G). Since ATF-1 and AP-1 are developmentally relevant, the results indicated that the activator role of JNK changes with time. Studies with a PKA inhibitor indicated that the CRE1 might exert a negative effect on CRE2/AP1 at D12 (Fig. 2C).
The molecular studies are relevant to the translation of MSCs, in particular, neural repair, to regulate the neurotransmitter gene, TAC1. This is particularly relevant if the MSCs are placed within a microenvironment of tissue injury with inflammatory mediators that can affect TAC1 expression as well as neurogenesis [23]. Indeed, MSCs and their generated neurons can respond to inflammatory mediators, in particular cytokines, via specific receptors [23,26]. This study has added to other studies that report on the role of cytokines, such as IL-1, in MSC-mediated neurogenesis [11,23]. The developmental specification in TAC1 expression can be extrapolated to predict the molecular responses by MSCs and the early differentiated cells to cytokines within a microenvironment of tissue injury. As an example, if a cytokine causes a rapid decrease in REST, this could result in the activation of CRE binding proteins and c-JUN (Fig. 3F) to induce TAC1 expression. Further studies with animal models are required to determine if such a case would be an advantage or disadvantage.
Figure 3G summarizes the in vitro studies and incorporated REST as a repressor of TAC1 expression [11]. At D6, activated JNK phosphorylates ATF-2 and CREB. It is likely that PKA also activates CREB since PKA inhibitor reduced luciferase level (Fig. 2C). The pathway at D12 is different since JNK inhibitor reduced luciferase levels (Fig. 2E), with an increase in c-JUN (Fig. 1D) for AP-1 binding to CRE2/AP-1.
The significance of the findings was studied with the HB9-GFP transgenic zebrafish as recipients for D6 MSCs transplants after SCI. In these fish, primary motor neurons are labeled with strong neuron-specific expression of GFP under the control of the regulatory elements of the zebrafish hb9 gene. HB9 is a transcription factor that is expressed in motor neurons in all vertebrates, and is required for early stages of spinal cord motor axon development [58]. Zebrafish transgenic lines that express enhanced GFP (EGFP) under the regulation of a mouse Plp promoter exhibited strong EGFP expression in oligodendrocytes and their precursors [59]. This suggests that there is biochemical conservation in pathways regulating oligodendrocytes and Schwann cells that are highly comparable between zebrafish and mammals [60]. Although there is some variation, there is enough conservation of predicted proteins to suggest that the zebrafish orthologues function similar to mammalian proteins. Further, the coexpression of all 3 myelin-associated genes in zebrafish oligodendrocytes precedes the appearance of compact myelin, providing further evidence for a comparable function in myelination [61]. In this study, we performed overall functional responses by D6-induced MSCs and showed that the protection occurred by a mechanism involving JNK. At this time, the precise mechanism of repair in the fish is unclear. The functional improvement could occur by the generation of new cells and/or enhancement of endogenous repair. Plans are in place to perform more robust immunohistochemical labeling with engineered MSCs in which specific genes are knocked down to further elucidate the mechanisms of repair.
Here we established a novel SCI and transplant model in the zebrafish larvae. An early effort to identify the parts of the nervous system responsible for swimming movements indicated that the early spontaneous movements of swimming and touch responses can occur without the brain, even at later stages [50]. Therefore, zebrafish are like other vertebrates, in which isolated spinal cord maintains some ability to produce reflex motor and sensory responses, and rhythmic motor output. Therefore, SCI in the preimmune zebrafish larvae allowed us to study the effects of human MSCs xenotransplant into the cord without immunosuppression that might influence neural regeneration. TAC1 expression and cAMP response likely play multiple roles in the signaling pathways driving neuron regeneration, either spontaneously in the permissive environments or through MSCs transplants. cAMP can promote neurite growth [62], act as an axon guidance cue [63], and attenuate the effects of the inhibitory Nogo receptors at the sites of injuries [64]. Thus, the regulatory processes of TAC1 expression in MSCs and their generated neurons are likely to contribute in many of cellular interactions through multiple mechanisms that regulate neuronal regeneration at sites of injury. The challenge for future studies is to elucidate the precise mechanisms by which human MSCs contribute to neural regeneration in vivo when transplanted at the SCI site.
In summary, we show a developmental pattern of regulation of TAC1 expression in MSCs that are subjected to neuronal induction with peptidergic agents, and that enhance the sensory and locomotor recovery after SCI in zebrafish larvae. The 2 major sites, CRE1 and CRE2/AP-1, are activated, depending on the developmental stage. Upstream of these sites is JNK, which shows specific activation of both pathways. In addition, PKA also activates CRE1, which binds to CREB and ATF-2. These studies provide a better molecular understanding of MSCs and their derived neurons in translational science.
Footnotes
Acknowledgments
This work was supported by the FM Kirby Foundation, FPU grant AP2005-4921 to T.E.K, UMDNJ Foundation grant 562547, and the Cancer Institute of New Jersey CCSG Developmental Award 562579 to H.E.S.
Author Disclosure Statement
No author of this article has any commercial association that might create a conflict of interest in connection with submitted article.
References
Supplementary Material
Please find the following supplemental material available below.
For Open Access articles published under a Creative Commons License, all supplemental material carries the same license as the article it is associated with.
For non-Open Access articles published, all supplemental material carries a non-exclusive license, and permission requests for re-use of supplemental material or any part of supplemental material shall be sent directly to the copyright owner as specified in the copyright notice associated with the article.