
Abstract
Induced pluripotent stem cells (iPSCs) are somatic cells that have been reprogrammed to a pluripotent state via introduction of defined transcription factors. iPSCs are a valuable resource for regenerative medicine, but whether iPSCs are identical to embryonic stem cells (ESCs) remains unclear. In this study, we performed comparative proteomic analyses of human somatic cells [human newborn foreskin fibroblasts (hFFs)], human iPSCs (hiPSCs) derived from hFFs, and H9 human ESCs (hESCs). We reprogrammed hFFs to a pluripotent state using 4 core transcription factors: Oct4 (O), Sox2 (S), Klf4 (K), and c-Myc (M). The proteome of hiPSCs induced by 4 core transcription factors was relatively similar to that of hESCs. However, several proteins, including dUTPase, GAPDH, and FUSE binding protein 3, were differentially expressed between hESCs and hiPSCs, implying that hiPSCs are not identical to hESCs at the proteomic level. The proteomes of iPSCs induced by introducing 3, 5, or 6 transcription factors were also analyzed. Our proteomic profiles provide valuable insight into the factors that contribute to the similarities and differences between hESCs and hiPSCs and the mechanisms of reprogramming.
Introduction
I
Although iPSCs possess enormous therapeutic potential, there are several hurdles that must be overcome before iPSCs can be used for patient-specific cell therapies, including the tumorigenic potential of c-Myc, the use of retroviral infection, and the low efficiency of iPSC derivation [7,8]. The critical issue is whether iPSCs are identical to ESCs. It is generally accepted that iPSCs closely resemble ESCs morphologically, molecularly, and developmentally [9 –12]. Similarities between iPSCs and ESCs have been identified by microarray studies, high-throughput sequencing, and analysis of DNA methylation status. However, there have been no detailed reports about comparative analyses at the proteomic level [13].
Proteomics can provide a global, systematic, and comprehensive approach to the identification of the biochemical processes, pathways, and networks involved in various physiological states at the protein level. Although nongel-based approaches, such as stable isotope labeling with amino acids in cell culture (SILAC) and surface-enhanced laser desorption/ionization (SELDI), have been used mainly for quantitative proteomic analysis [14 –16], 2-dimensional electrophoresis (2-DE) coupled with mass spectrometry (MS) is a well-established and reliable method for investigation of differential protein expression.
The purpose of this study was to perform a detailed analysis of the proteomes of somatic donor cells, human iPSCs (hiPSCs) derived from the corresponding somatic cells, and human ESCs (hESCs) to validate the usefulness of hiPSCs at the proteomic level. From the data of comparative proteomic analysis, we suggest that hiPSCs and hESCs are very similar at the proteomic level, strengthening the usefulness of hiPSCs. However, several proteins with differential expression pattern between hiPSCs and hESCs were detected.
Materials and Methods
Generation of hiPSCs
Human newborn foreskin fibroblasts (hFFs; CRL-2097; ATCC) were grown in Dulbecco's modified Eagle's medium (DMEM) containing 10% fetal bovine serum (Invitrogen), 1% nonessential amino acids (NEAA; Invitrogen), 1 mM
Maintenance of hiPSCs and hESCs
Undifferentiated hESCs (H9; WiCell Res. Ins.) and established hiPSCs were routinely maintained on γ-irradiated MEFs in hESC culture medium consisting of 80% DMEM/F12 medium, 20% knockout serum replacement (Invitrogen), 1% nonessential amino acids (NEAA; Invitrogen), 1 mM
ALP staining
ALP staining was performed using a commercially available ALP kit according to the manufacturer's instructions (Sigma). Images of ALP-positive cells were recorded using an HP Scanjet G4010. Bright-field images were obtained using an Olympus microscope (IX51; Olympus).
Polymerase chain reaction analysis
Total RNA was isolated from cells using the RNeasy Mini Kit (Qiagen) and reverse-transcribed using the SuperScript First-strand Synthesis System Kit (Invitrogen) according to the manufacturers' protocols. Semiquantitative reverse transcriptase (RT)-polymerase chain reaction (PCR) was performed using the Platinum Taq SuperMix kit (Invitrogen) under the following conditions: 3 min at 94°C, followed by 30 cycles of 30 s at 94°C, 30 s at 60°C, and 30 s at 72°C, and a final extension for 10 min at 72°C. Glyceraldehyde-3-phosphate dehydrogenase (GAPDH) was used as an endogenous control. Quantitative real-time PCR was performed using the Power SYBR Green PCR Master Mix (Applied Biosystems) and the ABI 7500 Real-Time PCR System (Applied Biosystems). After activating Taq polymerase at 95°C for 15 min, the reactions were denatured at 95°C for 15 s and annealed and elongated at 60°C for 1 min; this process was repeated for 50 cycles. The PCR products were separated using a 1.5% agarose gel containing ethidium bromide and visualized with a Gel Doc EQ system (Bio-Rad). All experiments were performed in triplicate, and the cycle threshold (CT) value for each target gene was determined using the software provided by the manufacturer and normalized to the expression level of GAPDH. The primer sequences used in the present study are shown in Supplementary Table S1 (Supplementary Data are available online at
Immunocytochemistry
Cells that had been cultured on gelatin-coated 4-well Lab-Tek chamber slides (Nunc) were fixed with 4% paraformaldehyde, permeabilized in phosphate-buffered saline (PBS)/0.2% bovine serum albumin (BSA)/0.1% Triton X-100, and blocked with 4% normal donkey serum (Molecular Probes) in PBS/0.2% BSA for 1 h at room temperature. After blocking, the cells were incubated with the respective primary antibodies [anti-Oct4 (Santa Cruz Biotechnology), anti-Nanog, anti-SSEA4, and anti-Tra1-60 (R&D Systems)] diluted in PBS/0.2% BSA. After washing, the cells were incubated with FITC- or Alexa 594-conjugated secondary antibodies (Invitrogen) in PBS/0.2% BSA for 1 h at room temperature. The chamber slides were analyzed using an Olympus microscope or an Axiovert 200M microscope (Carl Zeiss).
Karyotype analysis
Long-term-maintained hEBs were processed for chromosomal G-band analysis by GenDix Inc. A representative image was captured by ChIPS-Karyo (Chromosome Image Processing System; GenDix, Inc.).
Isoelectric focusing and 2-D gel electrophoresis
The cell lysates were obtained from hFFs (passage 3), hiPSC lines (passages 15–20), and H9 hESCs (passage 33). Cell lysates (150 μg of protein) were mixed with rehydration buffer [9 M urea, 4% 3-[(3-cholamidopropyl)-dimethylammonio]-1-propane sulfonate (CHAPS), 2 M thiourea, 40 mM dithiothreitol (DTT), and 2% immobilized pH gradient (IPG) buffer]. Protein samples were directly applied to IPG strips (pH 3–10, 13 cm) and rehydrated for 14 h at room temperature. Next, isoelectric focusing was performed using the Multiphor II (GE Healthcare) apparatus. The initial voltage was maintained at 300 V for 1 min and then linearly increased from 300 to 3,500 V within 1.5 h. The voltage was maintained at 3,500 V for 8 h. The plate temperature was kept constant at 25
Staining and image analysis
After electrophoresis, the gels were fixed, and the protein spots were visualized by silver staining (PlusOne Silver Staining Kit; GE Healthcare). The 2-DE images were scanned and processed with Progenesis SameSpots v3.0 software (Nonlinear Dynamics Ltd.). Spot volumes were normalized based on the total spot volume of each gel. Protein spot intensity was defined as the normalized spot volume, that is, the ratio of the single spot volume to the total of the spot volumes on the 2-DE gel (total spot normalization). Computer analysis facilitated the automatic detection and quantification of protein spots and matches among gels of somatic cells, hiPSCs, and hESCs. Spots displaying reliable and significant differences (greater than 2.0-fold, P<0.05) were selected for MS analysis.
In-gel digestion and identification by liquid chromatography–MS/MS
Spots of interest were manually excised from 2-DE gels and destained with chemical reducers to remove the silver [18 –20]. Briefly, 50–100 mL of the freshly prepared reducing solution (1:1 mixture of 30 mM potassium ferricyanide and 100 mM sodium thiosulfate) was added to the gel plugs and mixed. After the brown color disappeared, the gel plugs were rinsed with water and incubated in 200 mM ammonium bicarbonate for 20 min. Subsequently, the gel plugs were cut into small pieces, washed with water, and dehydrated repeatedly with acetonitrile (ACN) until the pieces appeared opaque and white. Next, the gel pieces were dried in a vacuum centrifuge for 30 min, and the proteins were digested with 20 ng/mL of sequencing grade-modified trypsin (Promega) for 16–24 h at 37°C. Digested peptides were extracted with extraction solution (50% ACN and 5% trifluoroacetic acid [TFA]), and the extracted peptides were dried using a vacuum drier. Samples were then subjected to MS analysis.
Peptides were analyzed using a Synapt High Definition Mass Spectrometer (Waters) equipped with a nanoACQUITY Ultra Performance LC system (Waters). A volume of 2 μL of the peptide solution was injected onto a 75 m×100 mm Atlantis dC18 column (Waters). Solvent A consisted of 0.1% formic acid in water, and Solvent B consisted of 0.1% formic acid in ACN. Peptides were initially separated using 100 min gradients and electrosprayed into the mass spectrometer (fitted with a nanoLockSpray source) at a flow rate of 300 nL/min. Mass spectra were acquired from m/z 300–1,600 for 1 s, followed by 4 data-dependent MS/MS scans from m/z 50–1,900 for 1 s each. The collision energy used to perform MS/MS was varied according to the mass and charge state of the eluting peptide. (Glu1)-Fibrinopeptide B was infused at a rate of 350 nL/min, and an MS scan was acquired for 1 s every 30 s throughout the run. A database search was performed with MASCOT (Matrix Science) using the following parameters: NCBInr.08.03.26 database, Homo sapiens species, and maximum number of missed cleavages by trypsin set to 1. The mass tolerance ranged from±50 to±100 ppm. The peptide modification allowed was carbamidomethylation in the fixed modification mode.
Target validation using western blot analysis
Protein samples (20 μg) were separated on a 13% SDS–polyacrylamide gel electrophoresis gel and transferred to a nitrocellulose membrane using standard procedures. The membrane was blocked with 5% (v/v) skim milk in TBS-T buffer [20 mM Tris-HCl (pH 7.6), 0.1369 M NaCl, and 0.1% Triton X-100] and then incubated with the primary antibody for 12 h on a rocking platform at 4
Bioinformatic data analysis
Differentially expressed proteins were evaluated by Ingenuity Pathway Analysis (IPA; Ingenuity System). IPA is a software application that enables the identification of the biological mechanisms, pathways, and functions matching a particular dataset of proteins. IPA is based on a database obtained by abstracting and interconnecting a large fraction of the existing biomedical literature according to a strict algorithm. This database integrates protein functions, cellular localizations, small molecules, and disease interrelationships. The networks are displayed graphically as nodes, representing individual proteins, and edges, representing the biological relationships between nodes. Networks are ordered by score and optimized to include as many differentially expressed proteins as possible. A P score [ie,−log(P value)] for each possible network is computed. Therefore, networks with scores of 2 or higher have at least 99% confidence of having not been generated by random chance alone.
Statistical analysis
Experimental differences were tested for statistical significance using analysis of variance and Student's t-test. P values less than 0.05 were regarded as statistically significant.
Results and Discussion
Generation of hiPSCs
The hiPSCs used in this study were derived from hFFs by retroviral overexpression of Oct4 (O), Sox2 (S), Klf4 (K), and c-Myc (M). Reprogrammed hiPSCs exhibited an hESC-like morphology and strong ALP activity (Fig. 1A). hiPSCs were positive for Oct4, Nanog, SSEA-3, and Tra-1–61 proteins, as determined by immunohistochemistry (Fig. 1B). Quantitative real-time RT-PCR analysis showed that the expression of pluripotency markers, including Oct4, Sox2, Nanog, hTERT, Rex1 and TDGF, were markedly increased relative to donor somatic cells, which had pluripotency marker expression levels that were comparable to those of H9 hESCs (Fig. 1C). Semiquantitative RT-PCR analysis indicated that the hiPSCs silenced the expression of the retroviral transgenes (Oct4, Sox2, Klf4, and c-Myc) (Fig. 1C). The pluripotency of hiPSCs induced by 4 core transcription factors (OSKM-hiPSCs) was further confirmed by in vivo teratoma formation assays. As shown in Fig. 1D, the teratomas contained well-defined structures arising from all 3 germ layers. In addition, the hiPSCs retained a normal karyotype during in vitro culture (Fig. 1F).
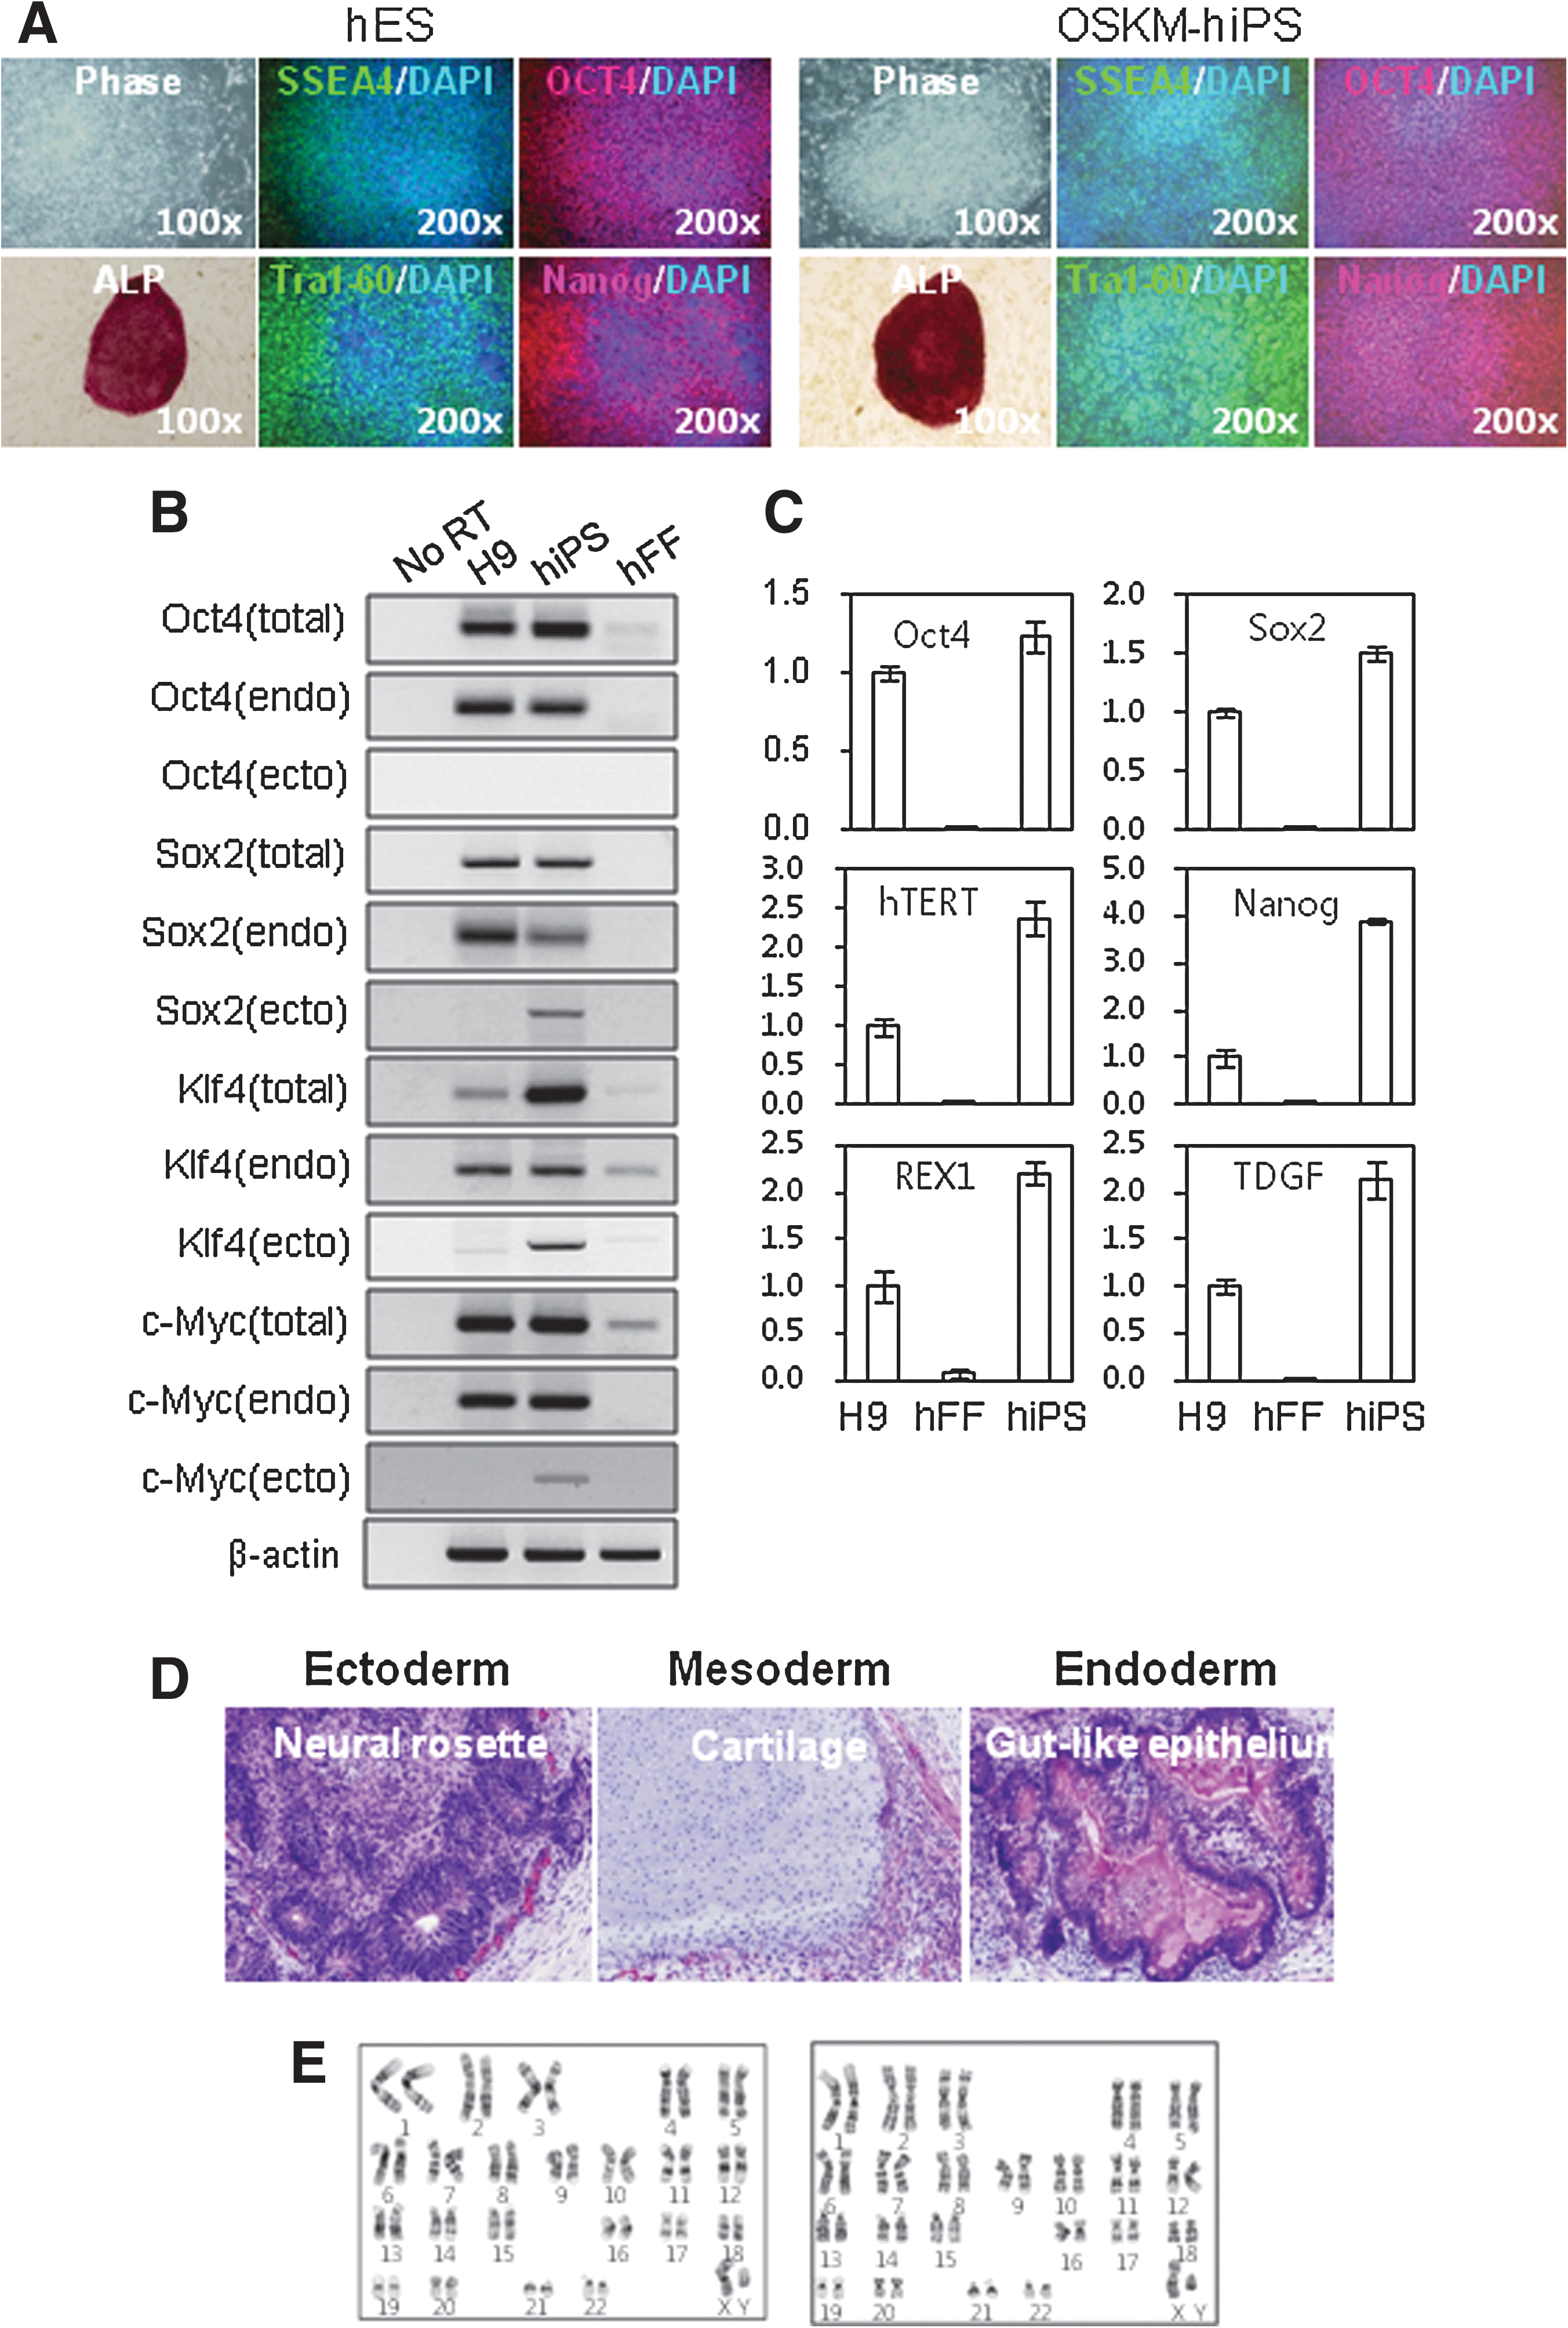
Characterization of hiPSCs derived from hFFs.
Proteomic analysis of donor cells, hiPSCs, and hESCs by 2-DE
To establish the proteomic profiles of hFFs, OSKM-derived hiPSCs, and hESCs, protein lysates from these cells were separated by 2-DE (Fig. 2). Experiments were performed in triplicate. More than 1,800 protein spots were detected on gels after silver staining, automatic spot detection, background subtraction, and volume normalization. In 3 sets of experiments, protein spots displaying significant changes (greater than 2-fold changes when comparing somatic fibroblast cells to hESCs, somatic fibroblast cells to hiPSCs, and hiPSCs to hESCs) were scored and identified (Supplementary Fig. S1 and Table 1). In total, 65 spots were scored. Forty-three of which exhibited changes between the hFF donor cells and OSKM-hiPSCs (Figs. 2 and 3A), demonstrating that the proteomic pattern of the donor cells could be altered by introducing 4-core pluripotency transcription factors. Among the 43 spots, 18 also changed in the same pattern in hESCs. For spot no. 299 (identified as serpin peptidase inhibitor, clade B, member 9 by MS analysis), decreased expression was detected in OSKM-hiPSCs, whereas increased expression was detected in hESCs. Spots showing differential expression patterns between hESCs and OSKM-hiPSCs were also detected (Figs. 2 and 3A). Of 15 spots showing differential expression patterns, 7 spots were increased and 8 spots were decreased in OSKM-hiPSCs compared with hESCs. In addition to OSKM-hiPSCs, we further analyzed the proteomic profiles of hiPSCs induced by 3 factors (Oct4, Sox2, and Klf4), 5 factors (Oct4, Sox2, Klf4, c-Myc, and SV40 large T antigen), and 6 factors (Oct4, Sox2, Klf4, c-Myc, SV40 large T antigen, and hTERT) (Fig. 2). The global expression intensity map generated from the proteomic data clearly demonstrated that hiPSCs induced by the introduction of 5 factors possess the proteomic pattern closest to that of hESCs (Fig. 3B). On the other hand, OSKM-hiPSCs showed the proteomic pattern with lowest similarity to hESCs. iPSCs have been reportedly obtained from primary skin fibroblasts derived from a healthy adult donor via the aid of 2 additional factors, hTERT and SV40 large T antigen [10]. However, the detailed roles of hTERT (the catalytic subunit of human telomerase) and SV40 large T antigen in reprogramming remain unclear. Thus, identifying proteins that are differentially expressed in hiPSCs that are induced by 5 and 6 factors when compared with other hiPSCs, donor cells, and hESCs would be valuable in understanding the detailed roles played by hTERT and SV40 large T antigen in the generation of iPSCs (Table 2). For example, like H9 ESCs, Far upstream element binding protein 3 (FUBP-3; spot no. 1257) and Cu/Zn-superoxide dismutase (spot no. 416) are highly expressed (>2-fold) in only hiPSCs induced by the introduction of 6 factors among iPSCs. This may be caused by the introduction of hTERT.
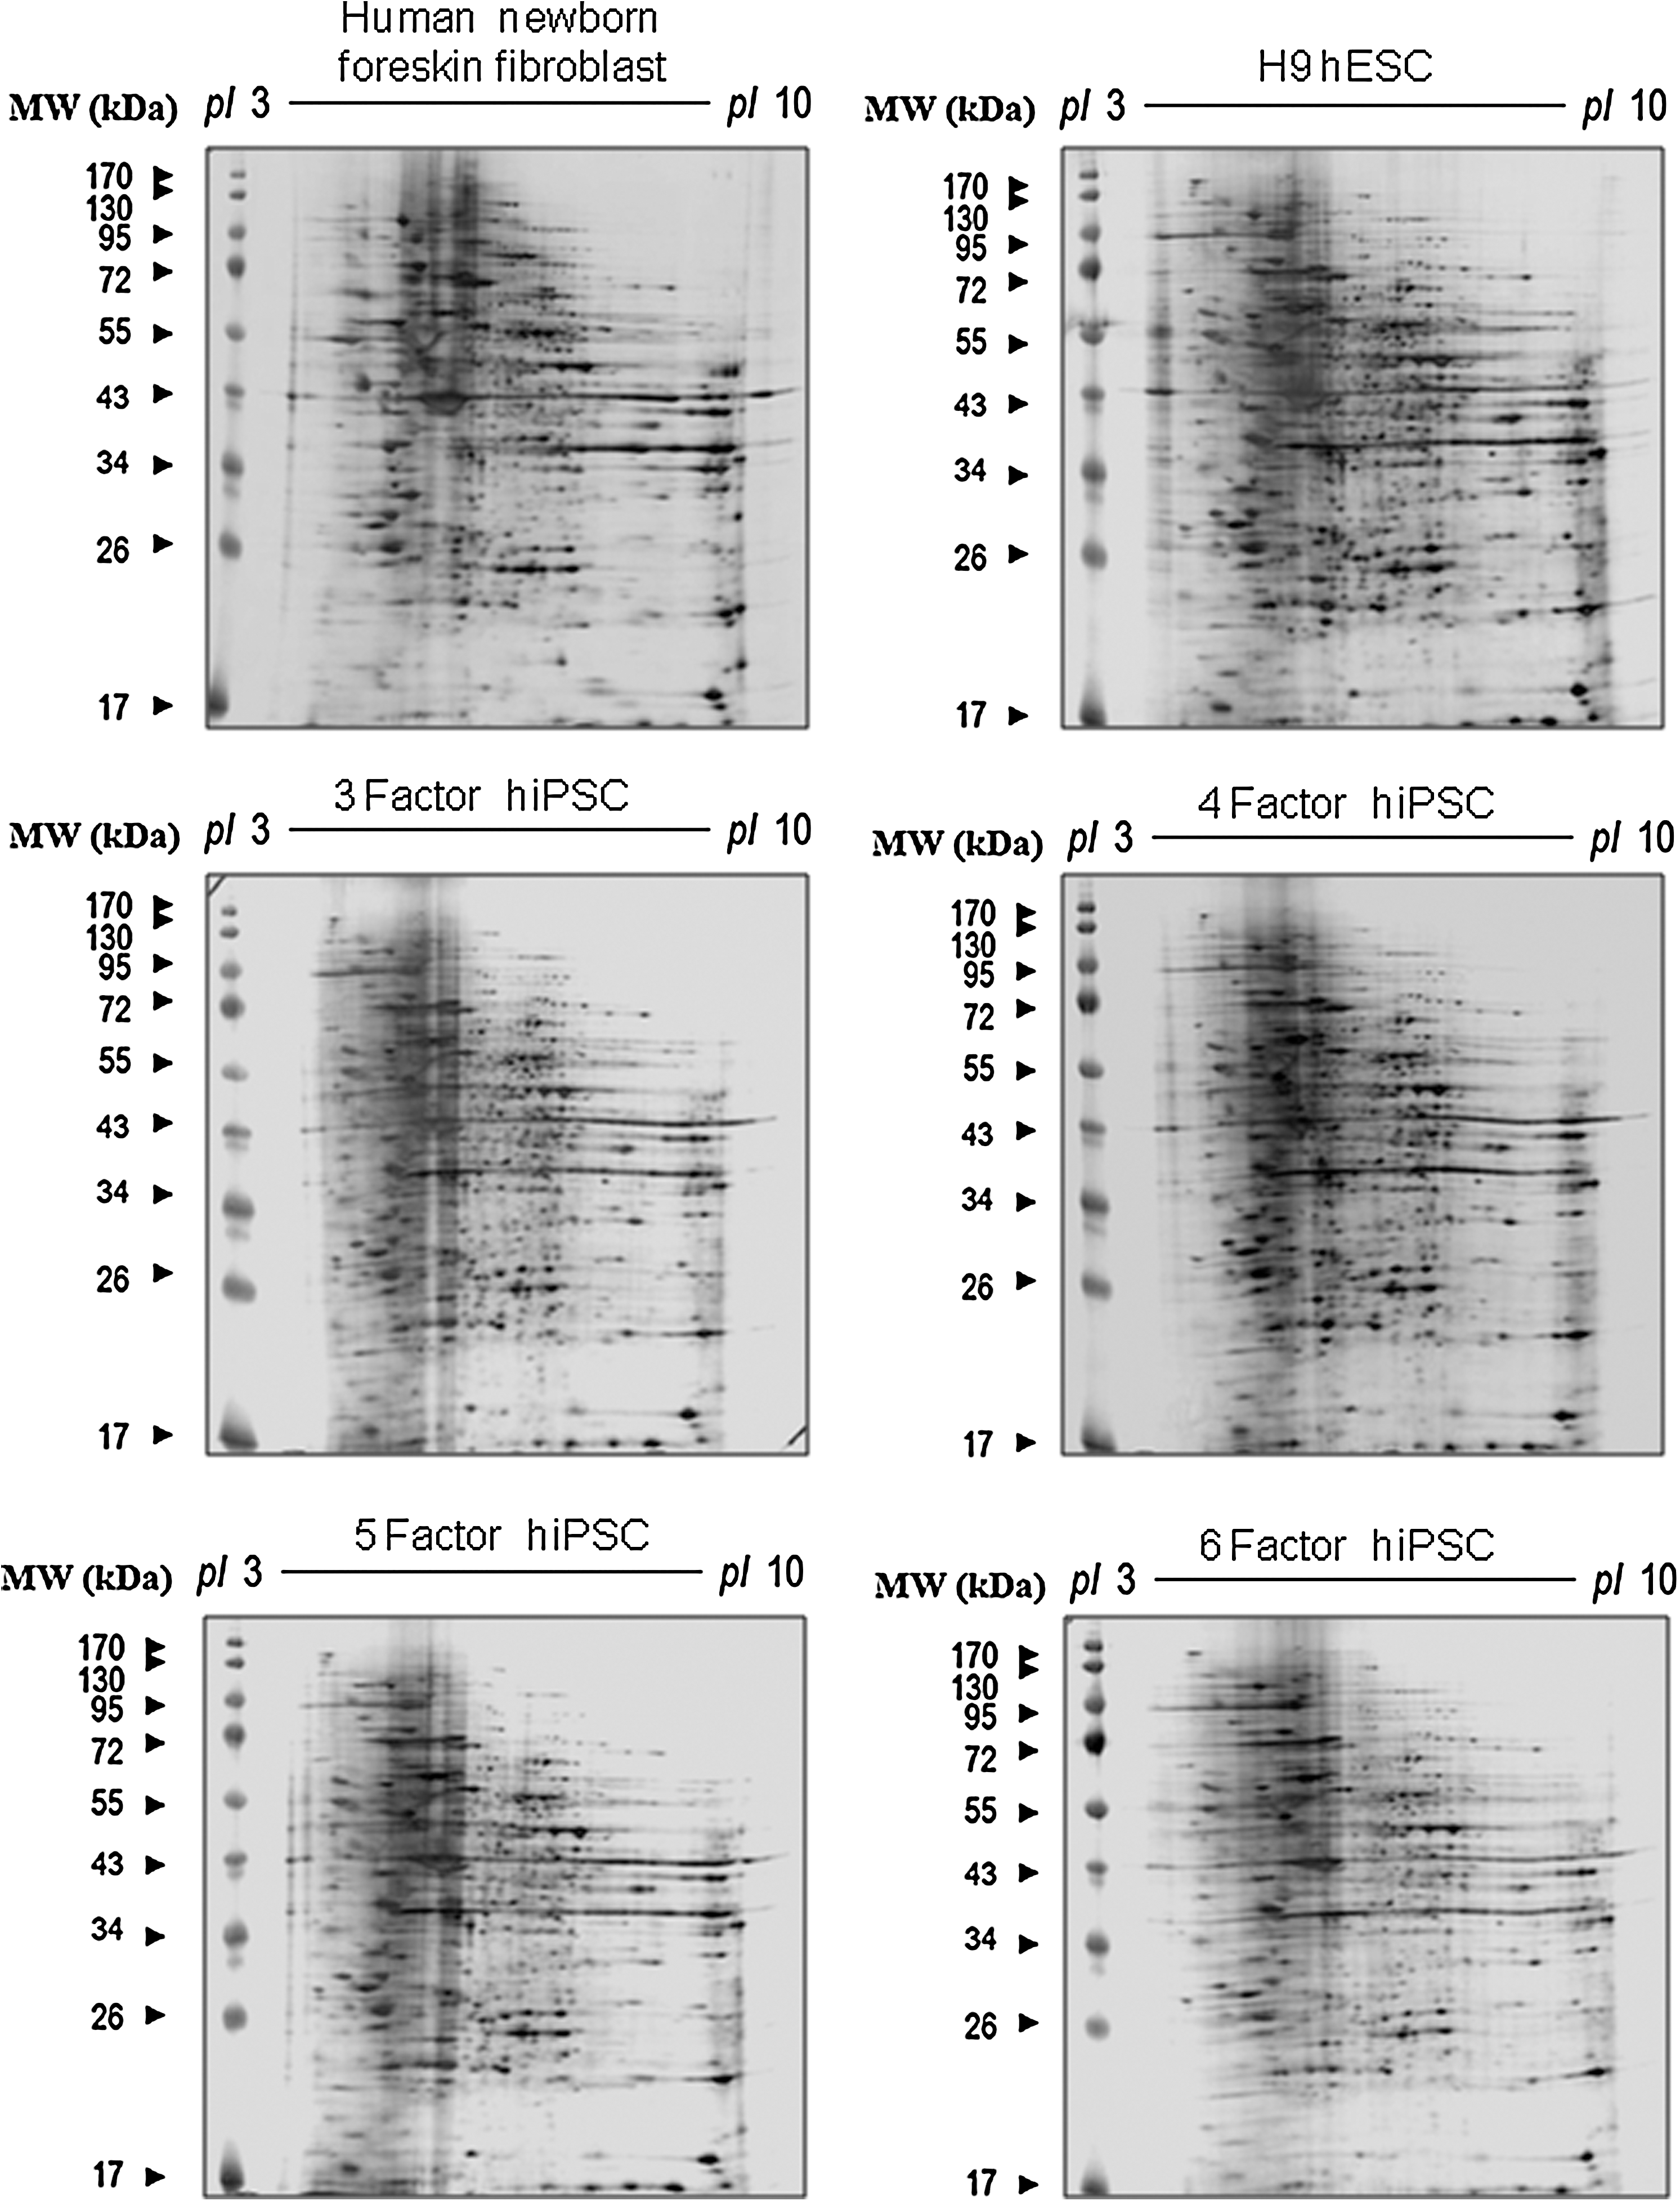
Representative 2-DE gel images of proteins from donor cells, hESCs, and OSKM-hiPSCs. Total protein lysates were separated on pH 3–10 nonlinear immobilized pH gradient (IPG) strips in the first dimension, followed by 13% sodium dodecyl sulfate–polyacrylamide gel electrophoresis in the second dimension and subsequent visualization by silver staining. Protein spots that were differentially expressed compared with donor are indicated with circles (downregulated) or rectangles (upregulated). Spots were identified by liquid chromatography–mass spectrometry/mass spectrometry as outlined in Table 1. Negative control, hFF; positive control, H9 hESC; 3 Factor hiPSC, hiPSCs induced by Oct4, Sox2, and Klf4; 4 Factor hiPSC, hiPSCs induced by Oct4, Sox2, Klf4, and c-Myc; 5 Factor hiPSC, hiPSCs induced by Oct4, Sox2, Klf4, c-Myc, and hTERT; 6 Factor hiPSC, hiPSCs induced by Oct4, Sox2, Klf4, c-Myc, hTERT, and SV40 large T antigen; IPG, immo-bilization pH gradient.
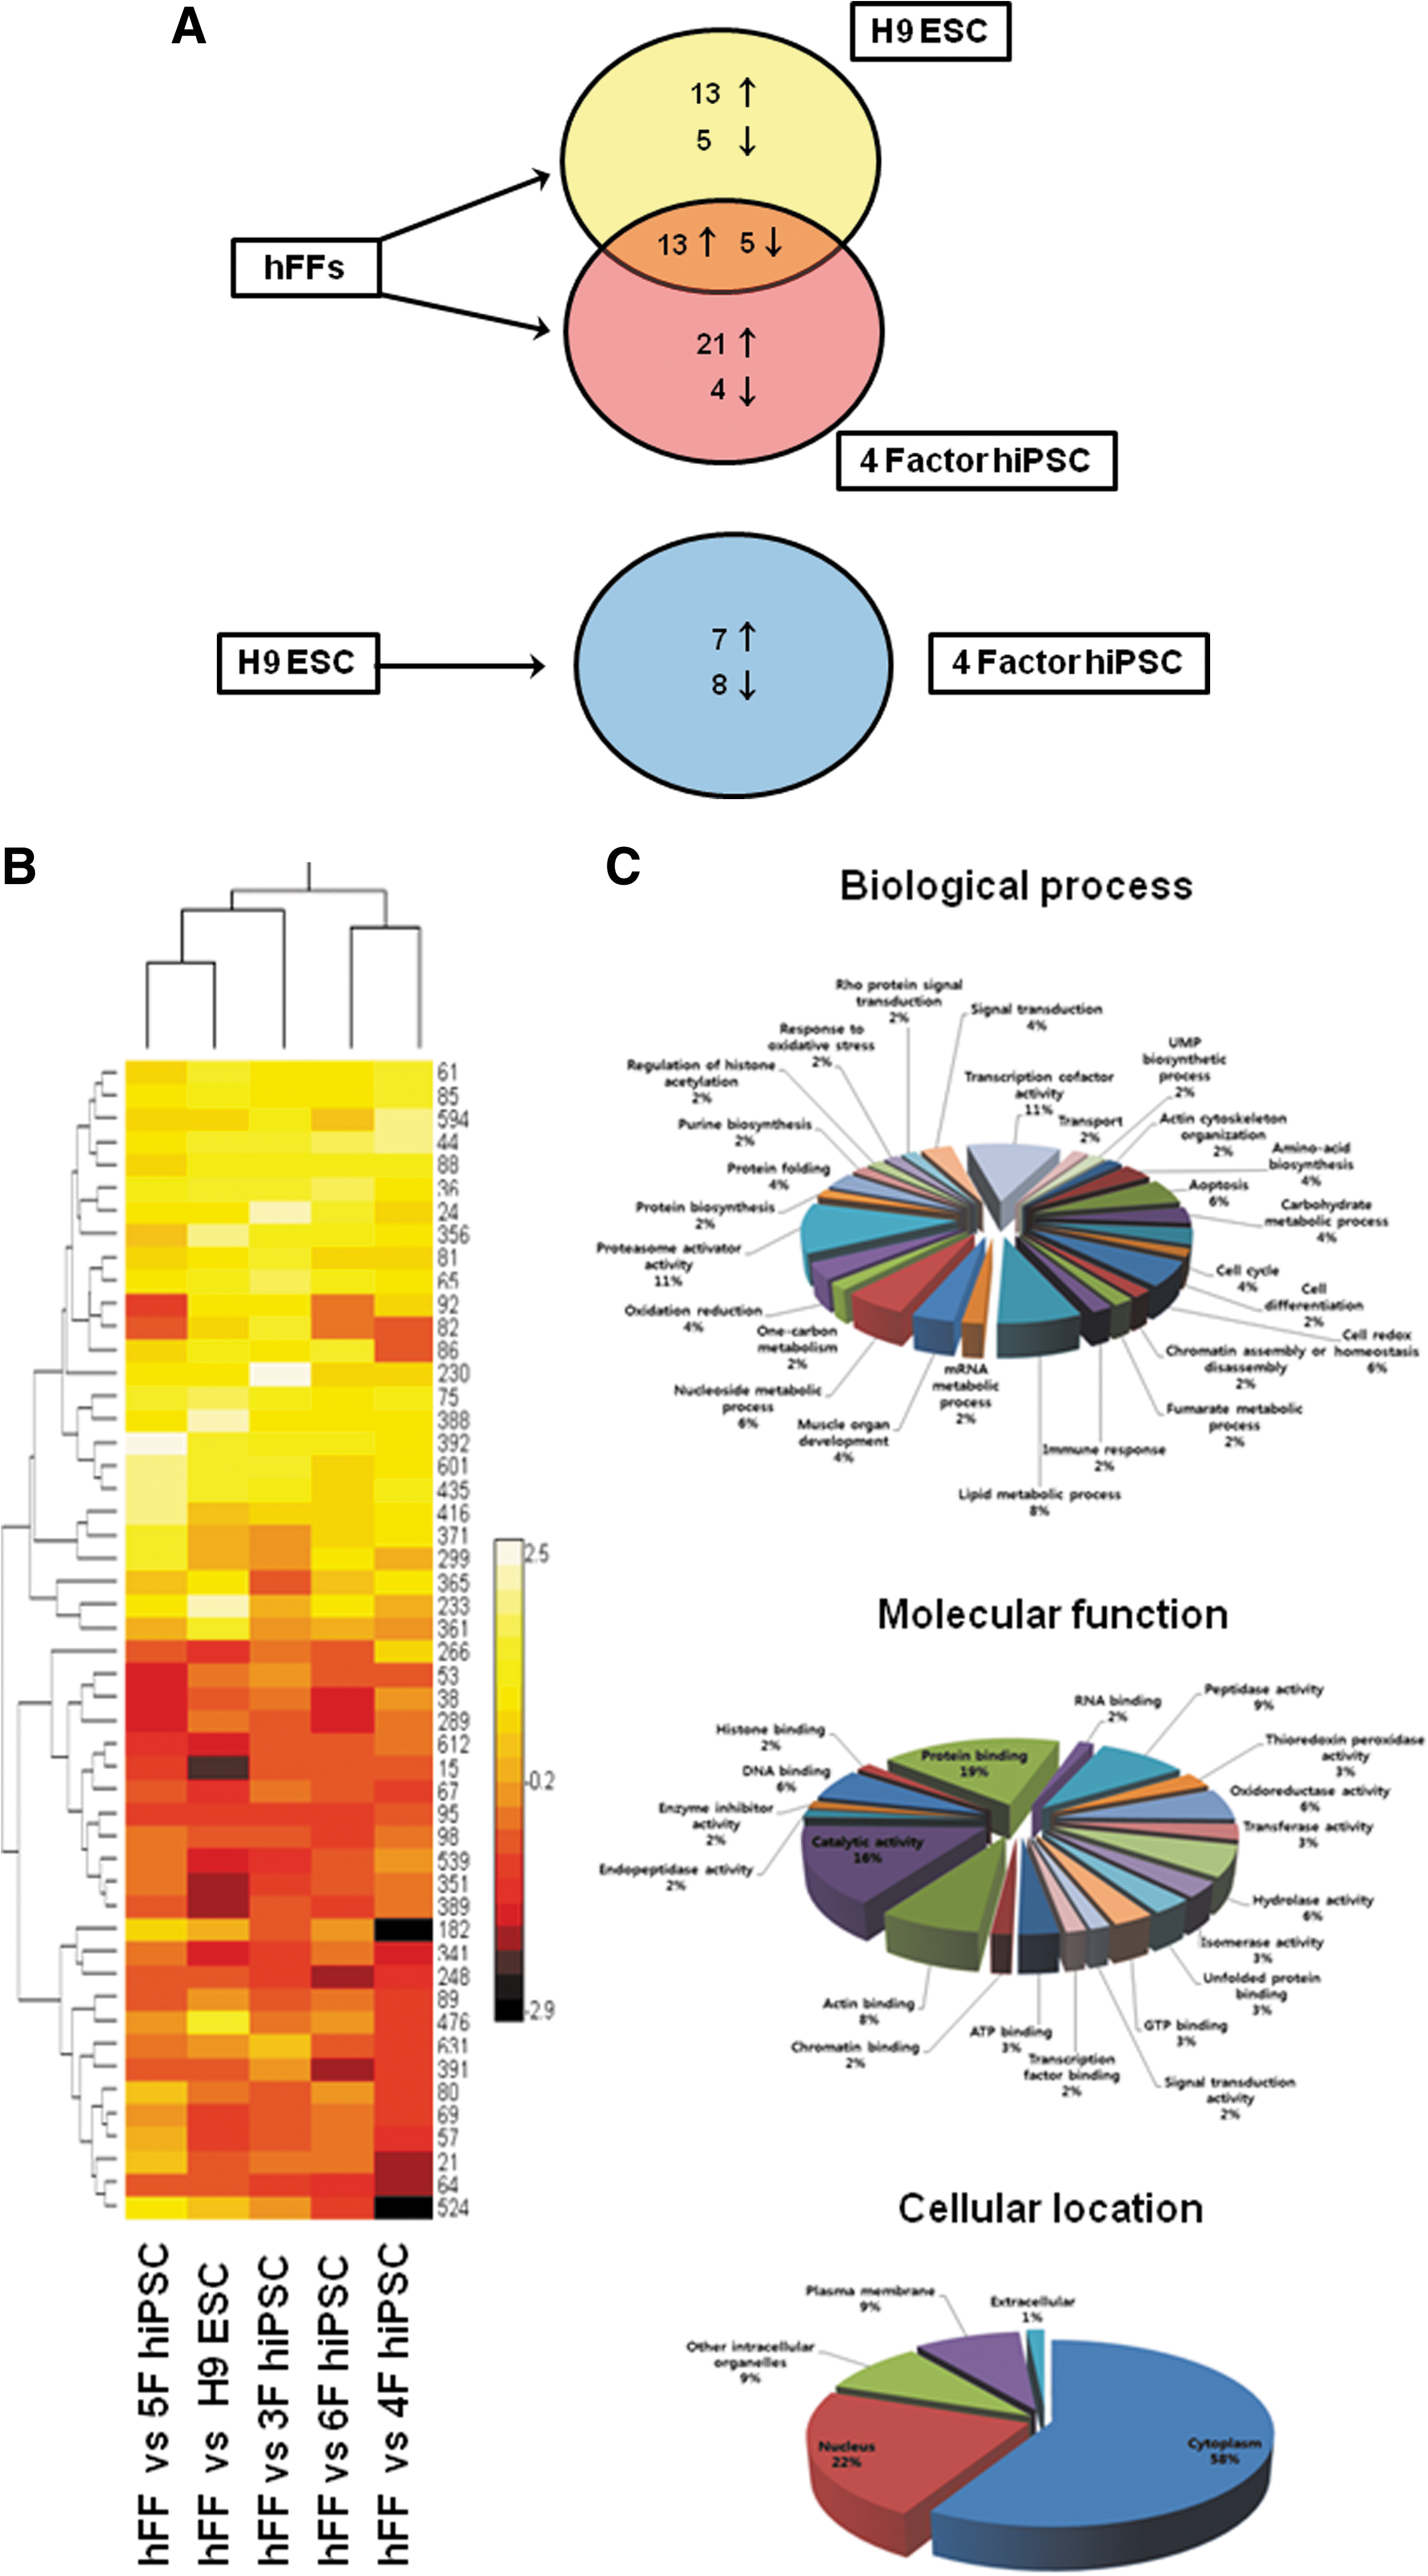
Bioinformatic analysis of the identified proteins.
ESC, embryonic stem cell; hFF, human newborn foreskin fibroblast; iPSC, induced pluripotent stem cell.
hiPSC, human iPSC.
Identification and classification of differentially expressed proteins by liquid chromotography–MS/MS
The spots with differential expression patterns among hFFs, hESCs, and OSKM-hiPSCs were identified. A total of 65 proteins were identified by MS analysis (Table 1). The proteins identified were classified according to their biological process, molecular function, and cellular location (Fig. 3C). The proteins were classified into various functional groups, implying that significant changes occur during reprogramming and many proteins may contribute to the pluripotency of hESCs and hiPSCs.
Among the identified proteins, a number of proteasome subunit proteins were differentially expressed. The proteasome has been implicated in the dynamic control of factor binding to transcriptionally active promoters [21]. Tissue-specific gene loci are maintained in a state that is competent for future expression but remains inactive at the pluripotent stage. At that stage, stable binding of transcription factors and RNA polymerase II to specific sequence elements is inhibited by the proteasome [22]. The upregulation of several proteasome subunits in hESCs and hiPSCs compared with donor cells would therefore be expected, and this observation further supports our experimental design in profiling the proteomes of hFFs, hESCs, and hiPSCs.
Validation of proteins by western blot analysis
Western blotting was used to validate the 2-DE results and assess the expression changes of several proteins that showed differential patterns (Fig. 4). With the exception of molecular chaperones and proteins involved in the cytoskeleton, we tested all possible identified proteins by western blot analysis using commercially available antibodies. Generally, the western blot results correlated well with the 2-DE data (Table 1 and Fig. 4).
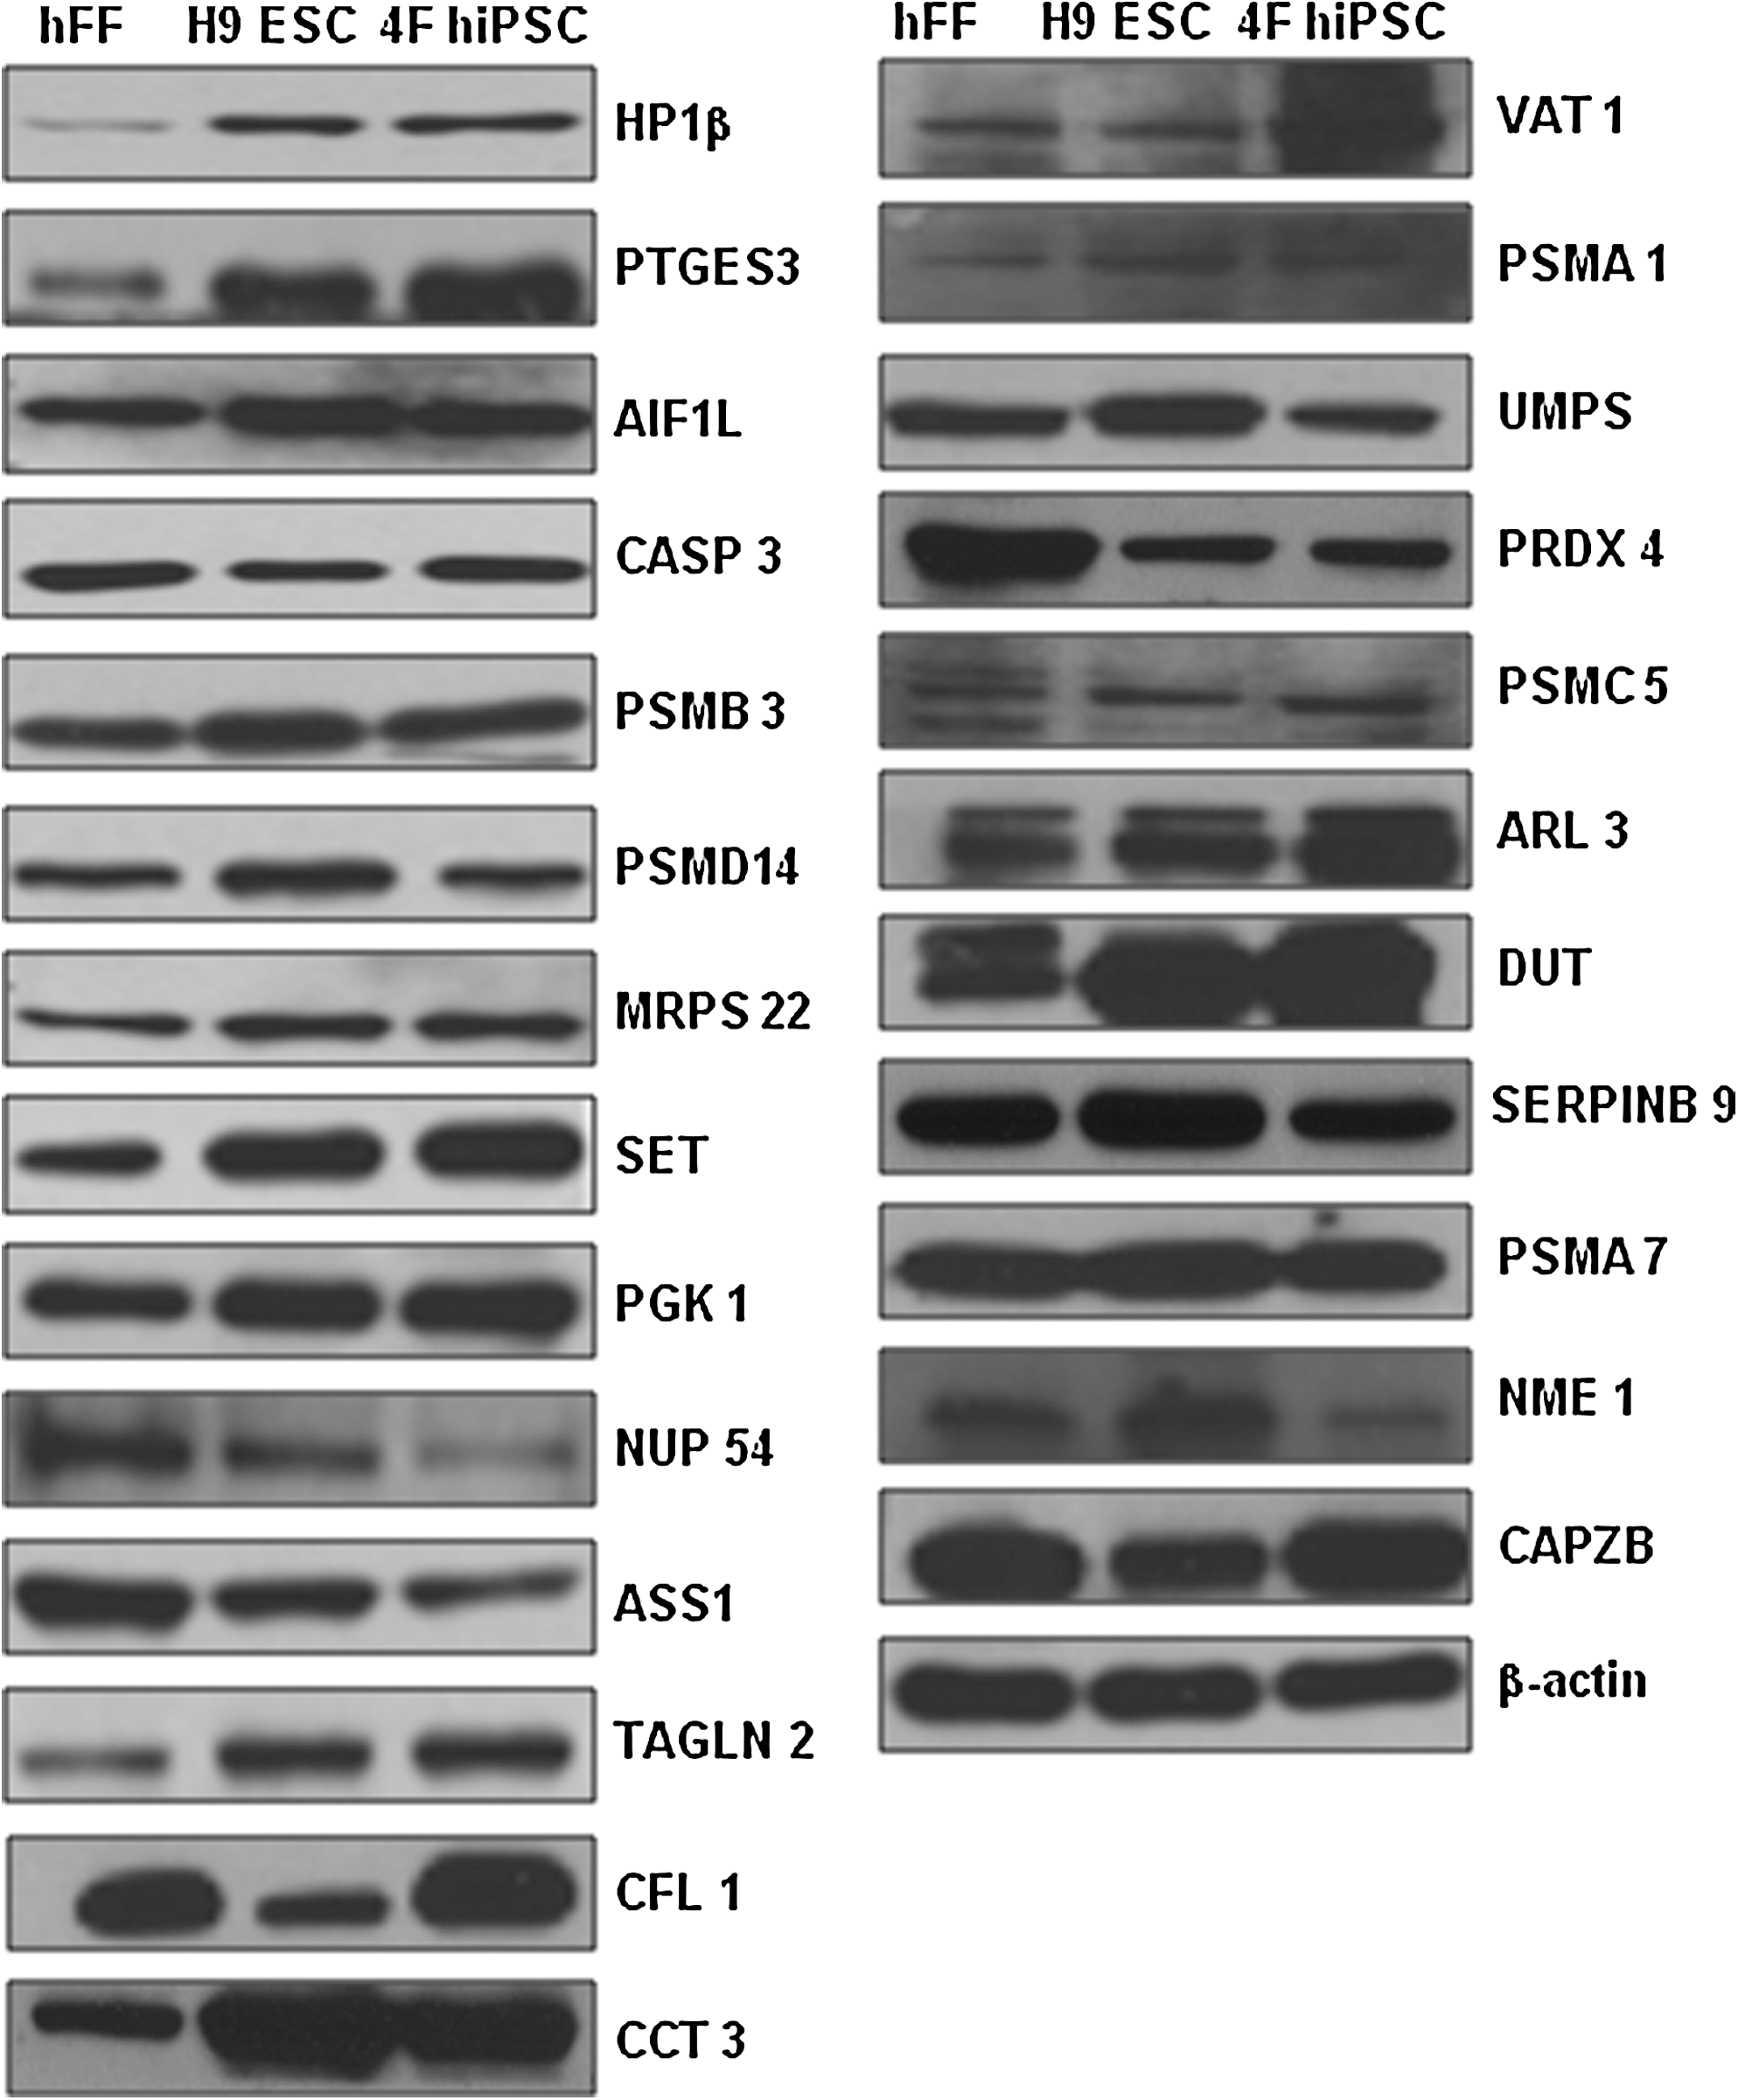
Validation of 2-DE results by western blot analysis. Western blot confirmation of the expression patterns of heterochromatin protein 1β (HP1β), prostaglandin E synthase 3 (PTGES3), ionized calcium binding adapter molecule 2 isoform 1 (AIF1L), caspase 3 preproprotein (CASP3), proteasome beta 3 subunit (PSMB3), 26S proteasome-associated pad1 homolog (PSMD14), mitochondrial ribosomal protein S22 (MRPS22), SET, phosphoglycerate kinase 1 (PGK1), nucleoporin 54 kDa (NUP54), argininosuccinate synthetase 1 (ASS1), transgelin 2 (TAGLN2), cofilin 1 (CFL1), γ subunit of CCT chaperonin (CCT3), vesicle amine transport protein 1 (VAT1), proteasome α1 subunit isoform 2 (PSMA1), UMP synthase (UMPS), thioredoxin peroxidase (PRDX4), 26S proteasome subunit p45 (PSMC5), ADP-ribosylation factor-like 3 (ARL3), deoxyuridine 5′-triphosphate nucleotidohydrolase (DUT), serpin peptidase inhibitor, clade B, member 9 (SERPINB9), proteasome subunit HSPC (PSMA7), nonmetastatic cells 1 protein (NME1), and F-actin capping protein β subunit (CAPZB). β-Actin was employed as a loading control.
Among the identified proteins, heterochromatin protein 1-β (HP1β) was significantly upregulated in hESCs and hiPSCs, compared with donor cells (Fig. 4). HP1β is a highly conserved nonhistone protein and a member of the heterochromatin protein family. The N-terminal chromodomain of HP1β can bind histone proteins, and the C-terminal chromo shadow-domain is involved in heterodimerization and interactions with a variety of chromatin-associated nonhistone proteins. This protein plays a crucial role in the epigenetic regulation of chromatin structure and DNA repair [23,24]. A variety of epigenetic changes take place during the reprogramming process [25,26]. The differential expression pattern of HP1β in our experiments suggests that HP1β may be involved in chromatin remodeling during reprogramming.
ESCs and iPSCs have lower levels of mitochondrial mass and oxidative phosphorylation and higher levels of lactate production than mature or differentiated cells. Further, hypoxia significantly enhances reprogramming efficiency [27], implying that ESCs and iPSCs preferentially use nonoxidative glycolysis as a main energy source [28 –30]. In our experiments, several glycolytic enzymes, including GAPDH, phosphoglycerate kinase 1, triose phosphate isomerase 1, and lactate dehydrogenase B, were differentially expressed in hESCs and hiPSCs relative to hFFs, indicating that glycolytic metabolism is the main energy generation system in hESCs and hiPSCs. Notably, a more dramatic increase in GAPDH was detected in OSKM-hiPSCs than in hESCs. GAPDH is a multifunctional protein with multiple intracellular localizations and plays key roles in diverse cellular processes independent of its traditional role in glycolysis; these processes include DNA repair, membrane fusion and transport, cytoskeletal dynamics, and cell death [31 –33]. Therefore, the detailed role of GAPDH in the reprogramming process is likely to be complex.
Decreased expression of nucleoporin p54 (Nup54) was detected in both hESCs and hiPSCs compared with hFFs. Developmental signal transduction involves nucleocytoplasmic transport and occurs through nuclear pore complexes. A nuclear pore complex consists of approximately 30 distinct proteins (nucleoporins or Nups). Recent studies have shown distinct roles for different FG-Nups, which have repetitive stretches of Phe-Gly residues [34,35]. Further, it was reported that the composition of the nuclear pore complex is also important during cell differentiation in the developing mouse embryo [36]. In conjunction with our proteomic data, these reports suggest that the composition of the nuclear pore complex may be critical to the reprogramming process. More extensive experiments will be necessary to elucidate the involvement mechanism of Nups in reprogramming.
The protein SET (also known as protein phosphatase 2A inhibitor) was significantly increased in both hESCs and hiPSCs (Fig. 4 and Table 2). SET binds to histones as a subunit of the INHAT (inhibitor of acetyltransferase) complex [37]. The binding of the INHAT complex to histones suppresses their acetylation and thereby induces transcriptional repression. The overexpression of SET inhibits DNA demethylation, resulting in gene silencing [38]. Additionally, SET binds and blocks the DNase activity of NM23-H1, a tumor metastasis suppressor [38]. SET also plays a role in hematopoietic differentiation [39]. The dramatically increased levels of SET in hESCs and hiPSCs may reflect its role in reprogramming, although the details of role are unknown.
Protein network analysis of identified proteins
The proteins displaying patterns of differential expression among hFFS, hESCs, and OSKM-hiPSCs were analyzed in silico using the IPA software [40,41]. Data from the comparison of donor cells and hESCs are represented in Fig. 5A, and data from the comparison of donor cells and OSKM-hiPSCs are depicted in Fig. 5B. There are similarities between hESCs and OSKM-hiPSCs, but subtle differences were also detected (Fig. 5C), providing insight into the reprogramming process and differences between hESCs and OSKM-hiPSCs.

Protein network analysis using Ingenuity Pathway Analysis (IPA) software. Proteins are represented as nodes, and the biological relationship between 2 nodes is represented as an edge (line). All edges are supported by at least 1 reference from published sources or from information stored in the Ingenuity Pathways Knowledge Base (IPKB). The node indicates up or down regulation. Nodes are displayed using several shapes that represent the functional classes of proteins.
FUBPs bind to an upstream element of the c-myc promoter and regulate the level of c-myc mRNA [42,43]. The c-Myc protein is part of the basic helix-loop-helix leucine zipper family of transcription factors and is involved in cell growth, proliferation, differentiation, and apoptosis [42]. Further, c-Myc participates in the dedifferentiation process and is widely used as a key reprogramming factor [1 –5]. Omission of c-Myc during reprogramming significantly lengthens the time required for reprogramming and dramatically decreases reprogramming efficiency [44]. However, c-Myc induces tumor formation in half of the chimeric mice generated from iPSCs [1,45]. Therefore, the alternative gene of c-myc is highly needed to overcome these obstacles of c-Myc during reprogramming process. In our proteomic analysis, 3 FUBP family protein members were differentially expressed (Table 1). FUBP-1 and FUBP-3 were significantly upregulated in hESCs compared with somatic cells. On the other hand, increased FUBP-1 levels and decreased FUBP-2 levels were detected in hiPSCs. Moreover, only FUBP-3 expression was significantly enhanced in hiPSCs compared with hESCs (Fig. 5D). The target genes of FUBPs are influenced by the absolute and relative intranuclear stoichiometries of individual FUBPs [46]. Therefore, it is estimated that absolute and relative amount of FUBPs may also be important in the regulation of c-Myc expression during the reprogramming process. In consistent, expression of FUBP-1 mRNAs was upregulated in pluripotent hESCs and hiPSCs compared with hFFs (Fig. 5E). Importantly, it was confirmed that the expression of FUBP-1 proteins was notably increased in hFFs at 1 and 3 weeks after OSKM transduction (Fig. 5F). The result from protein network analysis clearly showed differences in FUBPs among hFFs, hESCs, and OSKM-hiPSCs (Fig. 5G). Therefore, we suggest the possibility that FUBPs or FUBP-upregulating molecule(s) may be used as reprogramming factors.
Concluding Remarks
We performed a comparative proteome analysis of hESCs, hiPSCs, and their corresponding donor cells (hFFs). Through this approach, we identified many proteins that may be directly or indirectly involved in reprogramming. The identified proteins are involved in various biological processes, including transcription cofactor activity, proteasome activator activity, lipid metabolic processes, cell redox homeostasis, and nucleoside metabolic processes, indicating that significant physiological changes occur during reprogramming. Further, we identified several proteins with differential expression patterns between hESCs and hiPSCs. In future studies, we will perform a detailed investigation of the roles of the identified proteins during reprogramming and examine whether they can be effectively utilized to induce or regulate reprogramming at will. In combination with our proteomic analyses, further characterization of these proteins should provide valuable new insights into the mechanism of reprogramming.
Footnotes
Acknowledgments
The authors are grateful to Drs. Sang J. Chung, Jae Ho Kim, Sayeon Cho, Jeong-Ki Min, and Doo Byung Oh for their careful reading of the manuscript. The authors also thank Eun-Young Kim and Eonryung Kim for technical assistance and helpful discussions. This work was supported by the KRIBB/KRCF research program (NAP), the National Research Foundation (NRF) of Korea (No. 2010-0020305), and the KRIBB.
Author Disclosure Statement
No competing financial interests exist.
References
Supplementary Material
Please find the following supplemental material available below.
For Open Access articles published under a Creative Commons License, all supplemental material carries the same license as the article it is associated with.
For non-Open Access articles published, all supplemental material carries a non-exclusive license, and permission requests for re-use of supplemental material or any part of supplemental material shall be sent directly to the copyright owner as specified in the copyright notice associated with the article.