
Abstract
Multiple surface markers have been utilized for the enrichment of bone marrow mesenchymal stromal cells (MSCs) and to define primitive stem cells. We classified human bone marrow-derived MSC populations according to tissue nonspecific alkaline phosphatase (TNAP) activity. TNAP expression varied among unexpanded primary MSCs, and its level was not related to colony-forming activity or putative surface markers, such as CD105 and CD29, donor age, or gender. TNAP levels were increased in larger cells, and a colony-forming unit-fibroblast assay revealed that the colony size was decreased during in vitro expansion. TNAP-positive (TNAP+) MSCs showed limited multipotential capacity, whereas TNAP-negative (TNAP−) MSCs retained the differentiation potential into 3 lineages (osteogenic-, adipogenic-, and chondrogenic differentiation). High degree of calcium mineralization and high level of osteogenic-related gene expression (osteopontin, dlx5, and cbfa1) were found in TNAP+ cells. In contrast, during chondrogenic differentiation, type II collagen was successfully induced in TNAP− cells, but not in TNAP+ cells. TNAP+ cells showed high levels of the hypertrophic markers, type X collagen and cbfa1. Mesenchymal stem cell antigen-1 (MSCA-1) is identical to TNAP. Therefore, TNAP+ cells were sorted by using antibody targeting MSCA-1. MSCA-1-positive cells sorted for TNAP+ cells exhibited low proliferation rates. Expression of cell cycle-related genes (cyclin A2, CDK2, and CDK4) and pluripotency marker genes (rex1 and nanog) were higher in TNAP− MSC than in TNAP+ MSC. Therefore, TNAP− cells can be described as more primitive bone marrow-derived cells and TNAP levels in MSCs can be used to predict chondrocyte hypertrophy or osteogenic capacity.
Introduction
H
Several isolation techniques for selection of MSCs with high self-renewal capacity in BM population have been developed [5,6]. These methods include the use of monoclonal antibodies that recognize the MSC surface markers STRO-1 [7] or Sca-1 [8]. Osteogenic precursors were present in the STRO-1+ population of human BM [9], whereas the committed osteoblastic cell line MC3T3-E1 did not express STRO-1 [10]. However, STRO-1+ cells also have myofibroblastic and adipocytic features [11]. In another study, cells from human BM stroma-expressing melanoma cell adhesion molecule (MCAM)/CD146 were capable of transferring the hematopoietic microenvironment to heterotopic sites upon transplantation [12].
Alkaline phosphatase (ALP) is expressed in a wide variety of tissues, including the kidney, bone, and liver [13,14]. There are 4 different tissue-specific forms of the enzyme: intestinal, germ cell, placental, and tissue nonspecific [15]. Although the precise role of each enzyme in cellular events is unknown, tissue nonspecific ALP (TNAP) is considered to be a general osteoblast marker. TNAP is also a marker for activated B cells [16], 3T3-L1 preadipocytes [15], murine BM preadipocytes [17], and embryonic stem (ES) cells. ES cells are characterized by a high level of intracellular TNAP, and TNAP activity decreases as the cells differentiate [18,19]. During osteogenic differentiation, BM-derived MSCs (BMSCs) are changed morphologically from spindle to cuboidal-shape and this alteration is associated with a significant increase in TNAP activity. Most studies of TNAP activity in MSCs have shown that it is expressed during early osteogenic differentiation. It has been known that mesenchymal stem cell antigen-1 (MSCA-1), known as identical to TNAP, plays an important role as an MSC selection marker in endometrium [20]. Although TNAP activity was observed in undifferentiated MSCs [21,22], very little is known about why TNAP activity is correlated with differentiation efficiency and gene expression. Therefore, the aim of this study was to characterize the relationship between TNAP activity of undifferentiated BMSCs and their capacity to be differentiated into osteocytes, chondrocytes, and adipocytes. Additionally, we observed the expression of osteogenic-related genes and pluripotency markers in TNAP-positive (TNAP+) and TNAP− cells. This study suggests that TNAP activity can be used as a predictive marker designating the differentiation potential of BMSCs.
Materials and Methods
Cell culture
BM aspirates were obtained from the posterior iliac crests of 52 iliac bone-grafted patients (Age average: 51.27; Male:Female=23:29) between 20 to 72 years of age, after the approval of the Institutional Review Board (IRB). The patients were healthy donors without comorbid medical illness and regular drug use. BMSCs were isolated from unfractionated human BM aspirates (2–3 mL) by mixing with 10 mL of growth media [Dulbecco's Modified Eagle's Medium-low glucose (DMEM-LG; Invitrogen, Grand Island, NY) containing 10% FBS (Gibco, Grand Island, NY)]. Aspirated cells were cultured for 7 days in growth media and nonadherent cells were removed. On day 7 postprimary culture (passage 0), the MSCs were detached by using 0.05% trypsin/EDTA (Invitrogen) and were used in a colony-forming unit-fibroblast (CFU-F) assay with TNAP staining, hereafter referred to as a CFU-F and TNAP activity assay. For the clonal selection of MSCs, each clone was isolated by using a cloning cylinder (Bellco, Vineland, NJ). In primary culture of BMSCs, it is difficult to control cell seeding density. For this reason, we equally controlled the cell seeding density at 7 days of primary culture in BMSCs obtained from all donors. In brief, primary BMSCs (passage 0) obtained from BM aspirates were cultured up to 7 days in standard culture condition (2×10⁵ cells per 10 cm2 culture dish), and thereafter the cells were re-seeded at clonal density (1×10² cells per 10 cm2 culture dish). Under clonal culture condition, cells were sparsely spread out at a distance from those surrounding cells. These cells eventually led to the formation of a colony, and cloning cylinders were covered above colony-forming cells. The single clone-derived colonies were selectively detached with 0.05% trypsin/EDTA and then cultured in growth media for 12 days. The cells were used for TNAP activity, reverse transcription-polymerase chain reaction (RT-PCR), and differentiation assays.
Cord blood MSCs were isolated and cultured as previously described [23]. As control cells for differentiation assay, primary osteoblasts and preadipocytes (3T3-L1) were used. Primary rat osteoblasts were isolated from calvaria and cultured in DMEM containing 10% FBS.
CFU-F and TNAP assay
CFU-F and TNAP assays were performed on 52 different donor samples. On day 7 after primary culture (passage 0), BMSCs (1×10³) were seeded into 10 cm culture dishes and cultured in DMEM containing 20% FBS for 12 days. The medium was changed twice a week, and crystal violet (CV) and TNAP stains were performed on each donor population at day 12. For CV staining, cells were fixed with methanol:acetone (2:3), stained with 20% CV (Merck, Darmstadt, Germany) for 10 min, and washed with distilled water. To detect TNAP level, cultures were fixed in citrate buffer:acetone (2:3) and stained for 30 min in the dark with 0.3 mM alkaline dye containing Fast violet B/Naphtol AS-MX phosphate alkaline solution (Sigma, St. Louis, MO). After washing with distilled water, nuclei were stained with Mayer's hematoxylin solution for 5 min. The numbers of TNAP+ colonies were visually assessed.
TNAP activity
Cells were incubated in lysis buffer (0.5% triton X-100, 0.4 mM Tris-HCl (pH 7.5), 4.5 mM NaCl) for 30 min at 37°C, and the supernatant was harvested by centrifugation 13,000 rpm at 4°C for 10 min. TNAP enzyme activity was measured in triplicate cultures by using the TNAP substrate kit (Sigma) according to the manufacturer's instructions. Absorbance at 405 nm was measured with a spectrophotometer. TNAP activity was normalized to the total protein in each sample, as determined by the Bradford assay, and was expressed as μmol/mL of mg of total protein.
Osteogenesis
Cells were cultured in osteogenic medium comprised of DMEM supplemented with 10% FBS, 0.1 μM dexamethasone, 50 μg/mL ascorbic acid, and 10 mM β-glycerophosphate (Sigma) for 14 days. For von Kossa staining, after fixation in 1:1 acetone:methanol, freshly prepared 3% silver nitrate (wt/vol) (Sigma) was added to the cell preparation, and incubated in the dark for 30 min. To detect calcium contents, the cells were washed twice with phosphate buffered saline (PBS) before the addition of 800 μL of 0.5 N acetic acid and incubation at room temperature for 12 h. After incubation, 300 μL of fresh reagent (O-Cresolphthalein Complexone, ethanolamine/boric acid, and hydroxyquinol; Sigma) was added to 50 μL of sample supernatants, and absorbance was measured at 560 nm. Standards were prepared from a CaCl2 solution; the results were obtained in triplicate and expressed as mg/ml calcium equivalents per μg of total protein.
Adipogenesis
Cells were cultured in an adipogenic medium containing DMEM supplemented with 10% FBS, 1 μM dexamethasone, 0.5 mM IBMX, 200 μM indomethacin, and 5 μM insulin. After 14 days, cells were analyzed by Oil Red-O staining. For quantitative analysis, absorbance was detected at 500 nm after de-staining with isopropanol for 30 min.
Chondrogenesis
Total 1×10⁵cells were seeded into each well on the 12-well plates for monolayer culture or 10 μL of suspended cells (8,000 cells/μL) were dotted on the center of each well on the 24-well plates for micromass culture. Cells were maintained for 14 days in chondrogenic medium [DMEM-high glucose containing insulin-transferrinselenium-A (Gibco), 50 μg/mL ascorbic acid, and 10 ng/mL TGF-b3 (R&D Systems, Minneapolis, MN)]. At day14, cells were washed thrice with PBS and stained with 0.1% Safranin O solution (Sigma) for 30 min to proteoglycans (predominantly aggrecan) synthesis.
Semi-quantitative RT-PCR
Total RNA was isolated by using an RNeasy kit (Qiagen, Valencia, CA) and reverse-transcribed by using an Omniscript kit (Qiagen). The primer sets used for gene amplification were derived from the Gen Bank sequence database (Table 1). cDNAs were amplified in a total volume of 50 μL containing 1×PCR buffer, 0.4 μM of each primer, 0.2 mM dNTP mix, and 1 U of Taq DNA polymerase (Qiagen) at optimal temperature and cycles (Table 1). PCR products were seperated on a 1.5% agarose gel with ethidium bromide. The density values for the PCR products were normalized to GAPDH values to yield a semi-quantitative assessment.
PCR, polymerase chain reaction; S, sense primer; AS, antisense primer; bp, base pair.
Real-time quantitative PCR
Real-time quantitative PCR was performed to determine changes in mRNA expression of cell cycle-related genes, osteogenesis-related markers, and pluripotency-related transcription factors. Primer sets used were validated by and purchased from Bioneer (Bioneer, Daejon, South Korea,
Cell proliferation
Cell proliferation was determined by MTT assay in 24-well plates. Culture medium was removed, 400 μL of fresh medium and MTT solution (0.5 mg/mL; Sigma) were added, and the samples were incubated at 37°C for 4 h. The upper medium was then carefully removed, and the intracellular formazan was solubilized by adding 800 μL of dimethyl sulfoxide (Sigma). The absorbance of formazan was measured thrice at 570 nm.
Flow cytometry
Cultured cells were harvested with 0.02% EDTA and washed twice with PBS containing 1% FBS and 0.05% sodium azide [fluorescence activated cell sorting (FACS) buffer]. The single cells were labeled for 20 min 4°C in FACS buffer with the following conjugated antibodies: W8B2 (antibody directed against MSCA-1)-APC (Miltenyi Biotec, Inc., Auburn, CA), CD105/R-PE (Ancell Corporation, Bayport, MN), and CD29-FITC (Ancell Corporation). After washing with FACS buffer, the cells were analyzed on a fluorescence-activated cell sorter (Beckman Coulter, Fullerton, CA).
Fluorescence-activated cell sorting and size-dependent cell sorting
In order to select TNAP+ or TNAP-negative (TNAP−) cells in a living state, we used W8B2-APC conjugated antibody against MSCA-1 antigen known as an identical marker to TNAP [20]. Cells were labeled with W8B2-1-APC and fractionated into MSCA-1− and MSCA-1+ populations using an FACS cell sorter (Beckman Coulter). To classify cells by size within a heterogeneous MSC population, cells were harvested with 0.05% trypsin/EDTA and washed twice in PBS. Cells were resuspended in prewarmed PBS and sorted into small, middle, and large populations. Sorted cells were used for differentiation assay, cell proliferation assay, TNAP activity, TNAP staining, and real-time quantitative PCR.
Statistical analysis
All data represent the analysis of 3 independent experiments performed in triplicate. Comparisons between the 2 groups (undifferentiated cells vs. differentiated cells) were analyzed by Student's t-test. Values of P<0.05 were considered to be statistically significant.
Results
TNAP expression in osteogenic, chondrogenic, and adipogenic differentiation
To analyze changes in TNAP expression of MSCs during osteogenic, chondrogenic, and adipogenic differentiation, we first checked changes in TNAP expression of fully differentiated MSCs (passage 3) by TNAP staining. The ability for BMSCs to differentiate into all 3 cell types (osteogenic, chondrogenic, and adipogenic cells) was confirmed by von Kossa (Fig. 1b), Oil Red-O (Fig. 1d), and Safranin-O staining (Fig. 1f). We observed that TNAP expression was higher in BMSCs differentiated into osteogenic (Fig. 1a) and adipogenic lineage (Fig. 1c) than BMSCs differentiated into chondrogenic lineage (Fig. 1e). This finding suggests that TNAP is not restricted to osteogenic differentiation, and that it might be involved in adipogenic differentiation of BMSCs but not in chondrogenic differentiation.
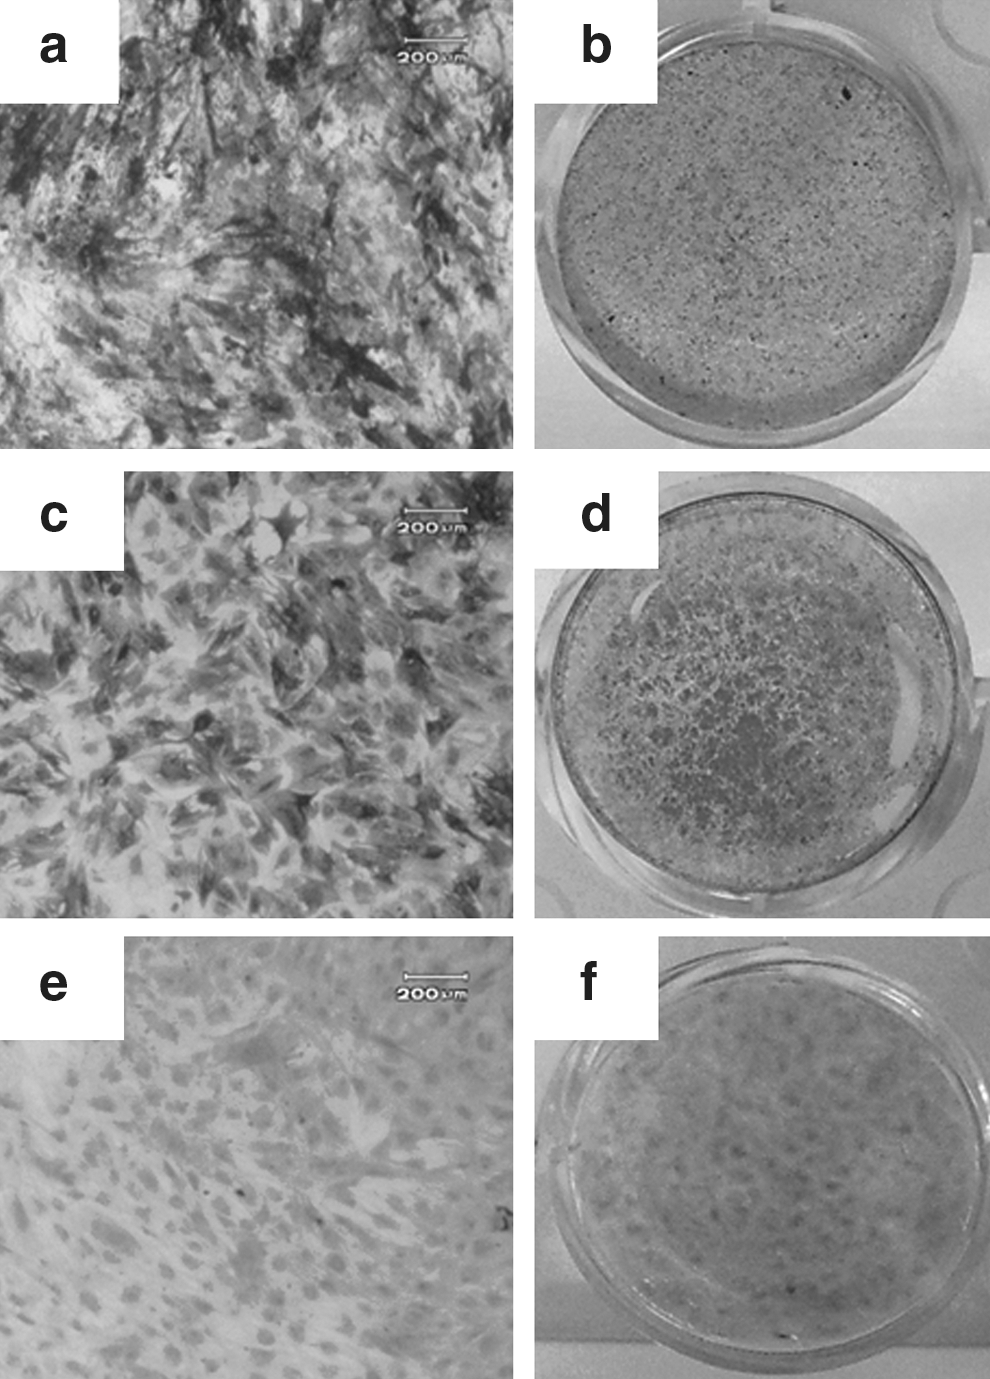
Tissue nonspecific alkaline phosphatase (TNAP) expression in 3 lineage differentiation. The changes of phenotype during osteogenic, adipogenic, and chondrogenic differentiation were evaluated by TNAP staining (left panel), von Kossa staining (upper right panel), Oil Red-O staining (middle right panel), and Safranin-O staining (lower right panel). Bone marrow-derived mesenchymal stromal cells (BMSCs) at passage 3 were seeded into 12-well plates and were induced to differentiation for 14 days under each differentiation condition.
Variety of TNAP expression among donor populations in CFU-F and TNAP activity assay
To determine the difference in TNAP expression among different donors, we performed CFU-F and TNAP activity assay in primary BMSC (passage 0) from each donor (Fig. 2). At day 7 of primary culture, the human BMSCs were allowed to attach to new culture dishes and were cultured for 12 days in medium containing 20% serum. There was no difference in colony-forming activity as detected by CV staining, but TNAP activities varied among BMSCs from different donors, including TNAP+, TNAP-mixed (TNAP+/−), and TNAP− (Fig. 2A). To quantify TNAP staining, we also measured TNAP activity in 9 representative BMSC samples from BM- and UCB. TNAP activity of each donor was matched with the TNAP-stained BMSC samples and was negative in UCB-derived BMSCs (Fig. 2B). TNAP activity was not correlated with age or gender of the donor.

Variability in TNAP activities among donor population.
With regard to expression of representative BMSC surface markers, such as CD105 and CD29, no difference was observed between TNAP+ and TNAP− donors, 76% and 77%, respectively (Fig. 2C). Cell size was also comparable between the 2 groups. The percentage of cells with large granularity and cell size was much higher in BMSCs from TNAP+ donors (71.2%) than those from TNAP− donors (47.2%; Fig. 2D).
Differentiation potential of cells sorted according to cell size
We found that TNAP activity varied between cells from each donor even under the same culture conditions. To determine the correlation between TNAP expression and differentiation efficiency, cells were sorted into 3 cell populations based on cell size (F1∼F3). Subsequently, expression and activity of TNAP was determined for each group. Both TNAP expression and activities were cell size-dependent. More TNAP+ cells were found in fractions containing large cells (F3, >25–30 μm) than in the small cell group (F1, 5–10 μm; Fig. 3A, C, and D).
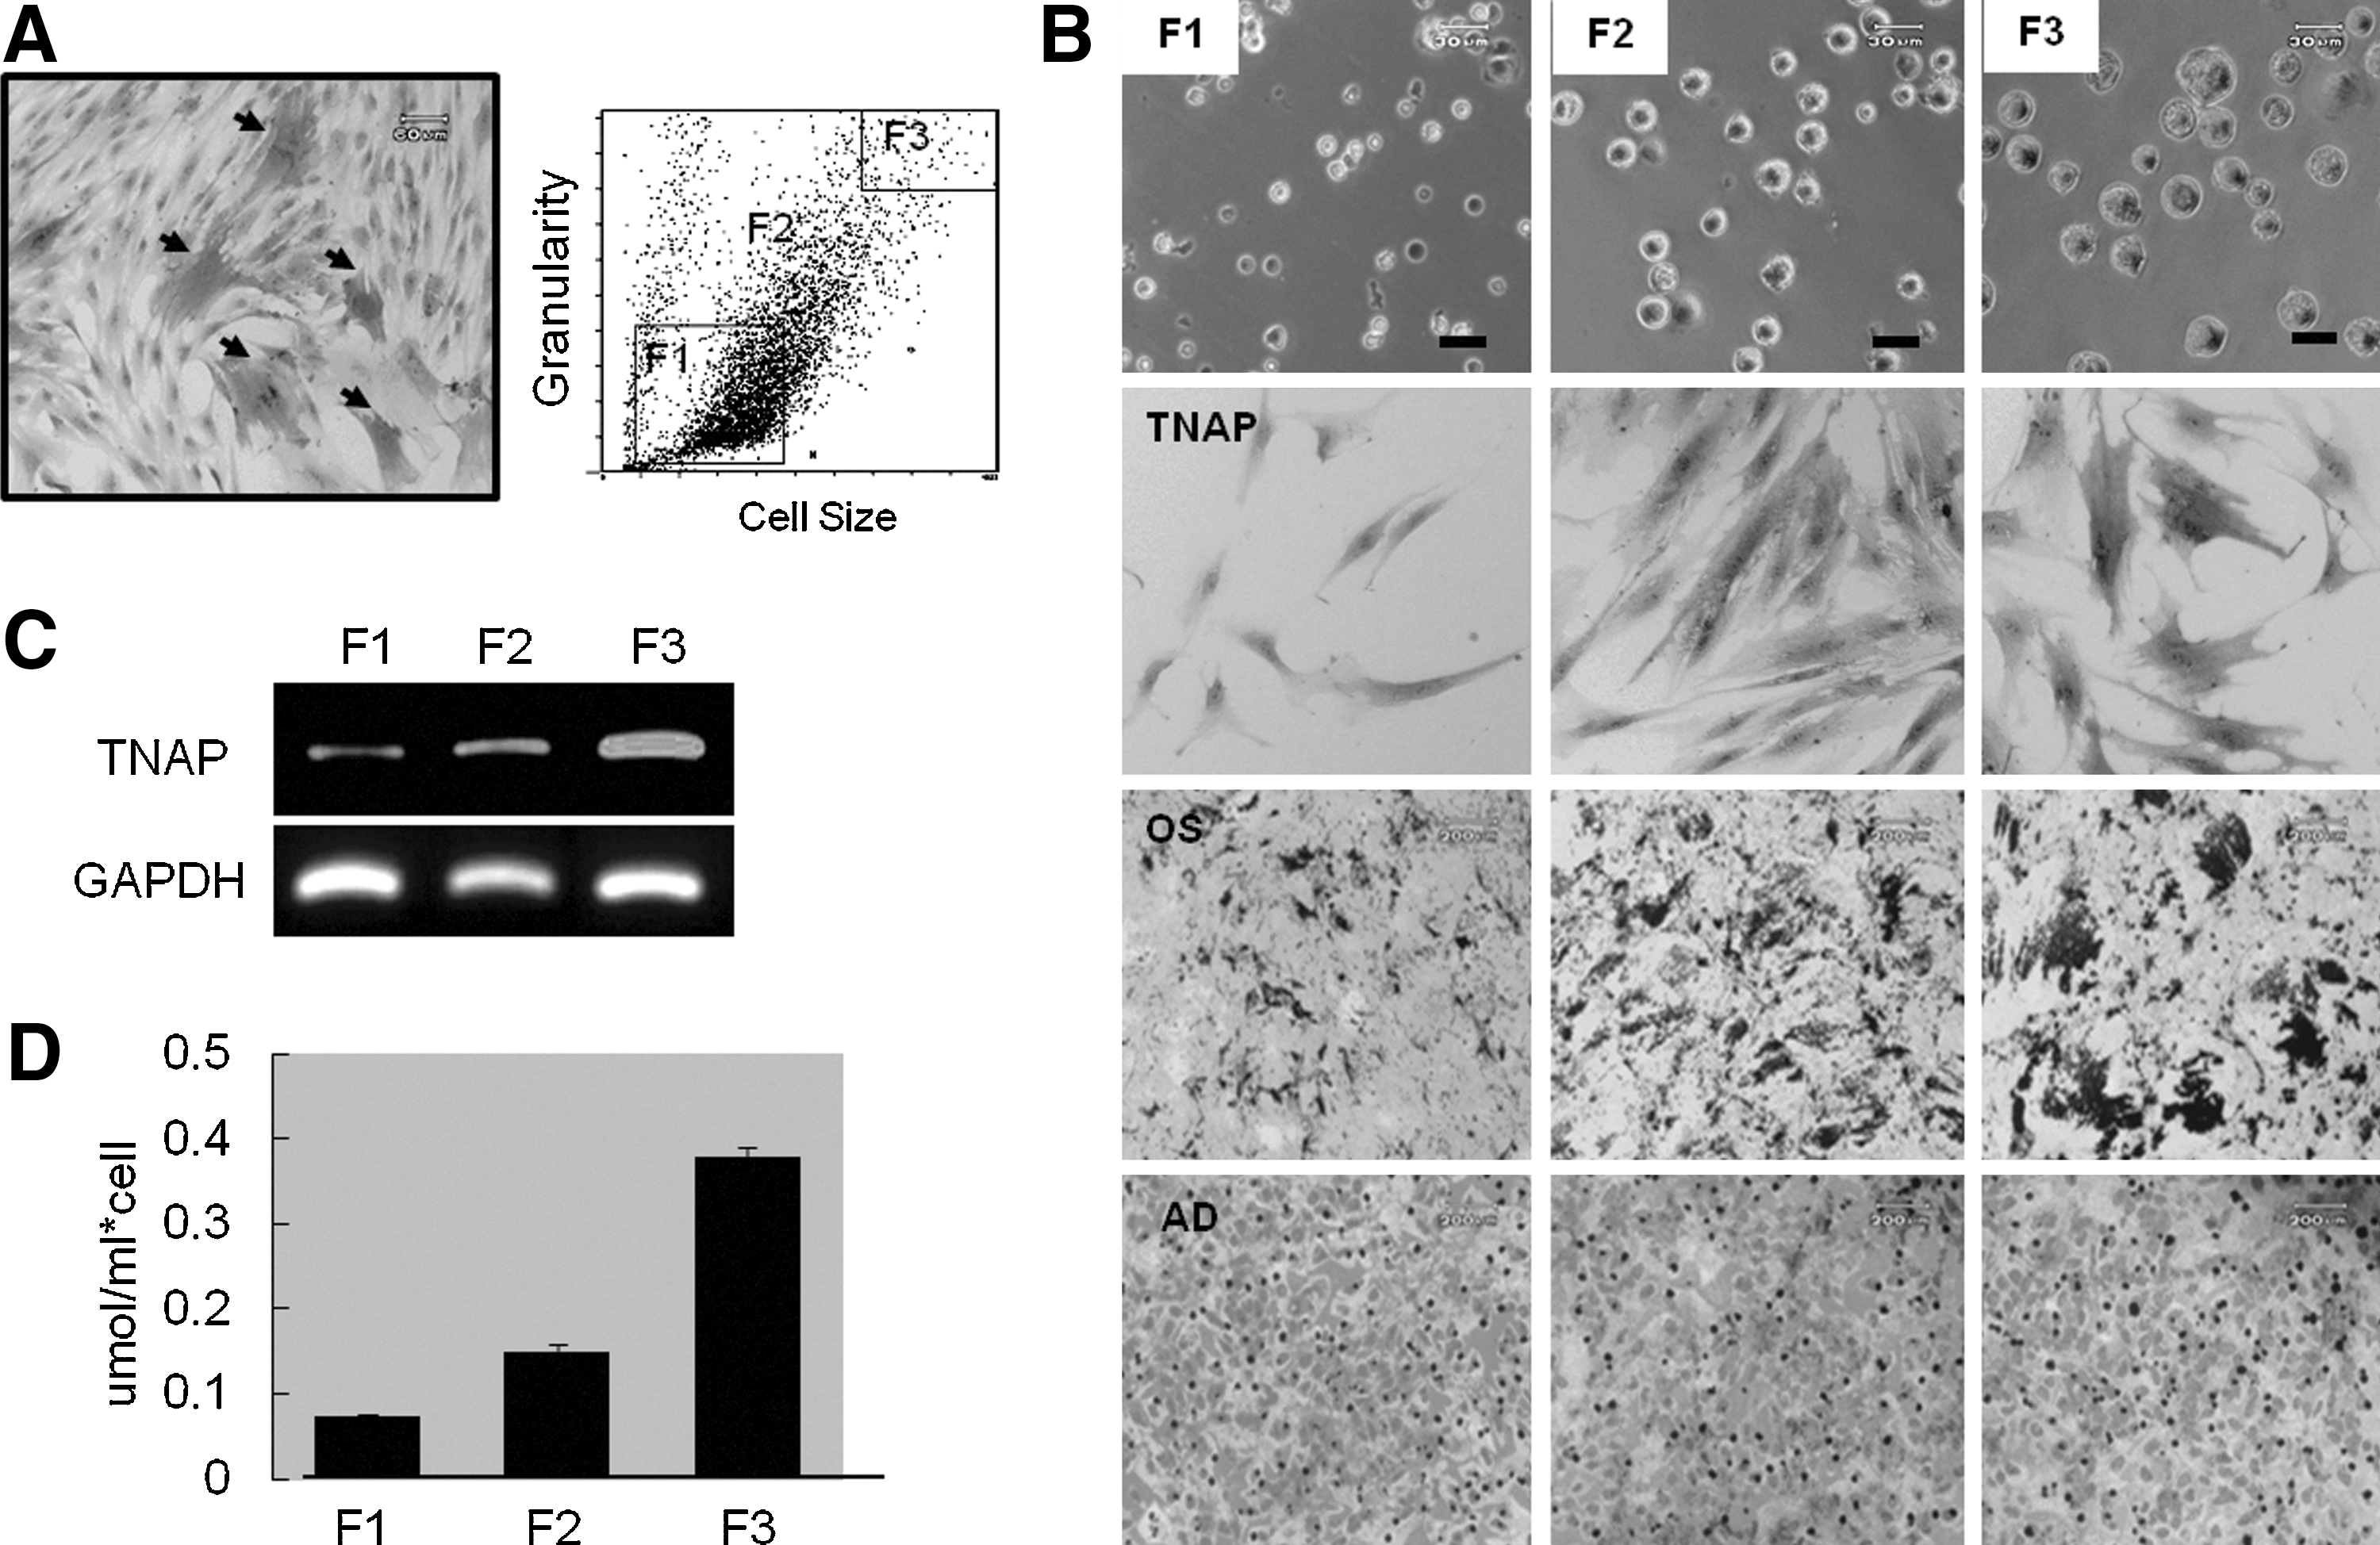
Differentiation potential of cells sorted by size via FACS.
As revealed by von Kossa staining, osteogenic differentiation efficiency increased in a TNAP-dependent fashion (Fig. 4B), whereas adipogenic differentiation was strongly induced in all groups and not the TNAP-dependent.
Differentiation potential of clonal cells according to TNAP activity.
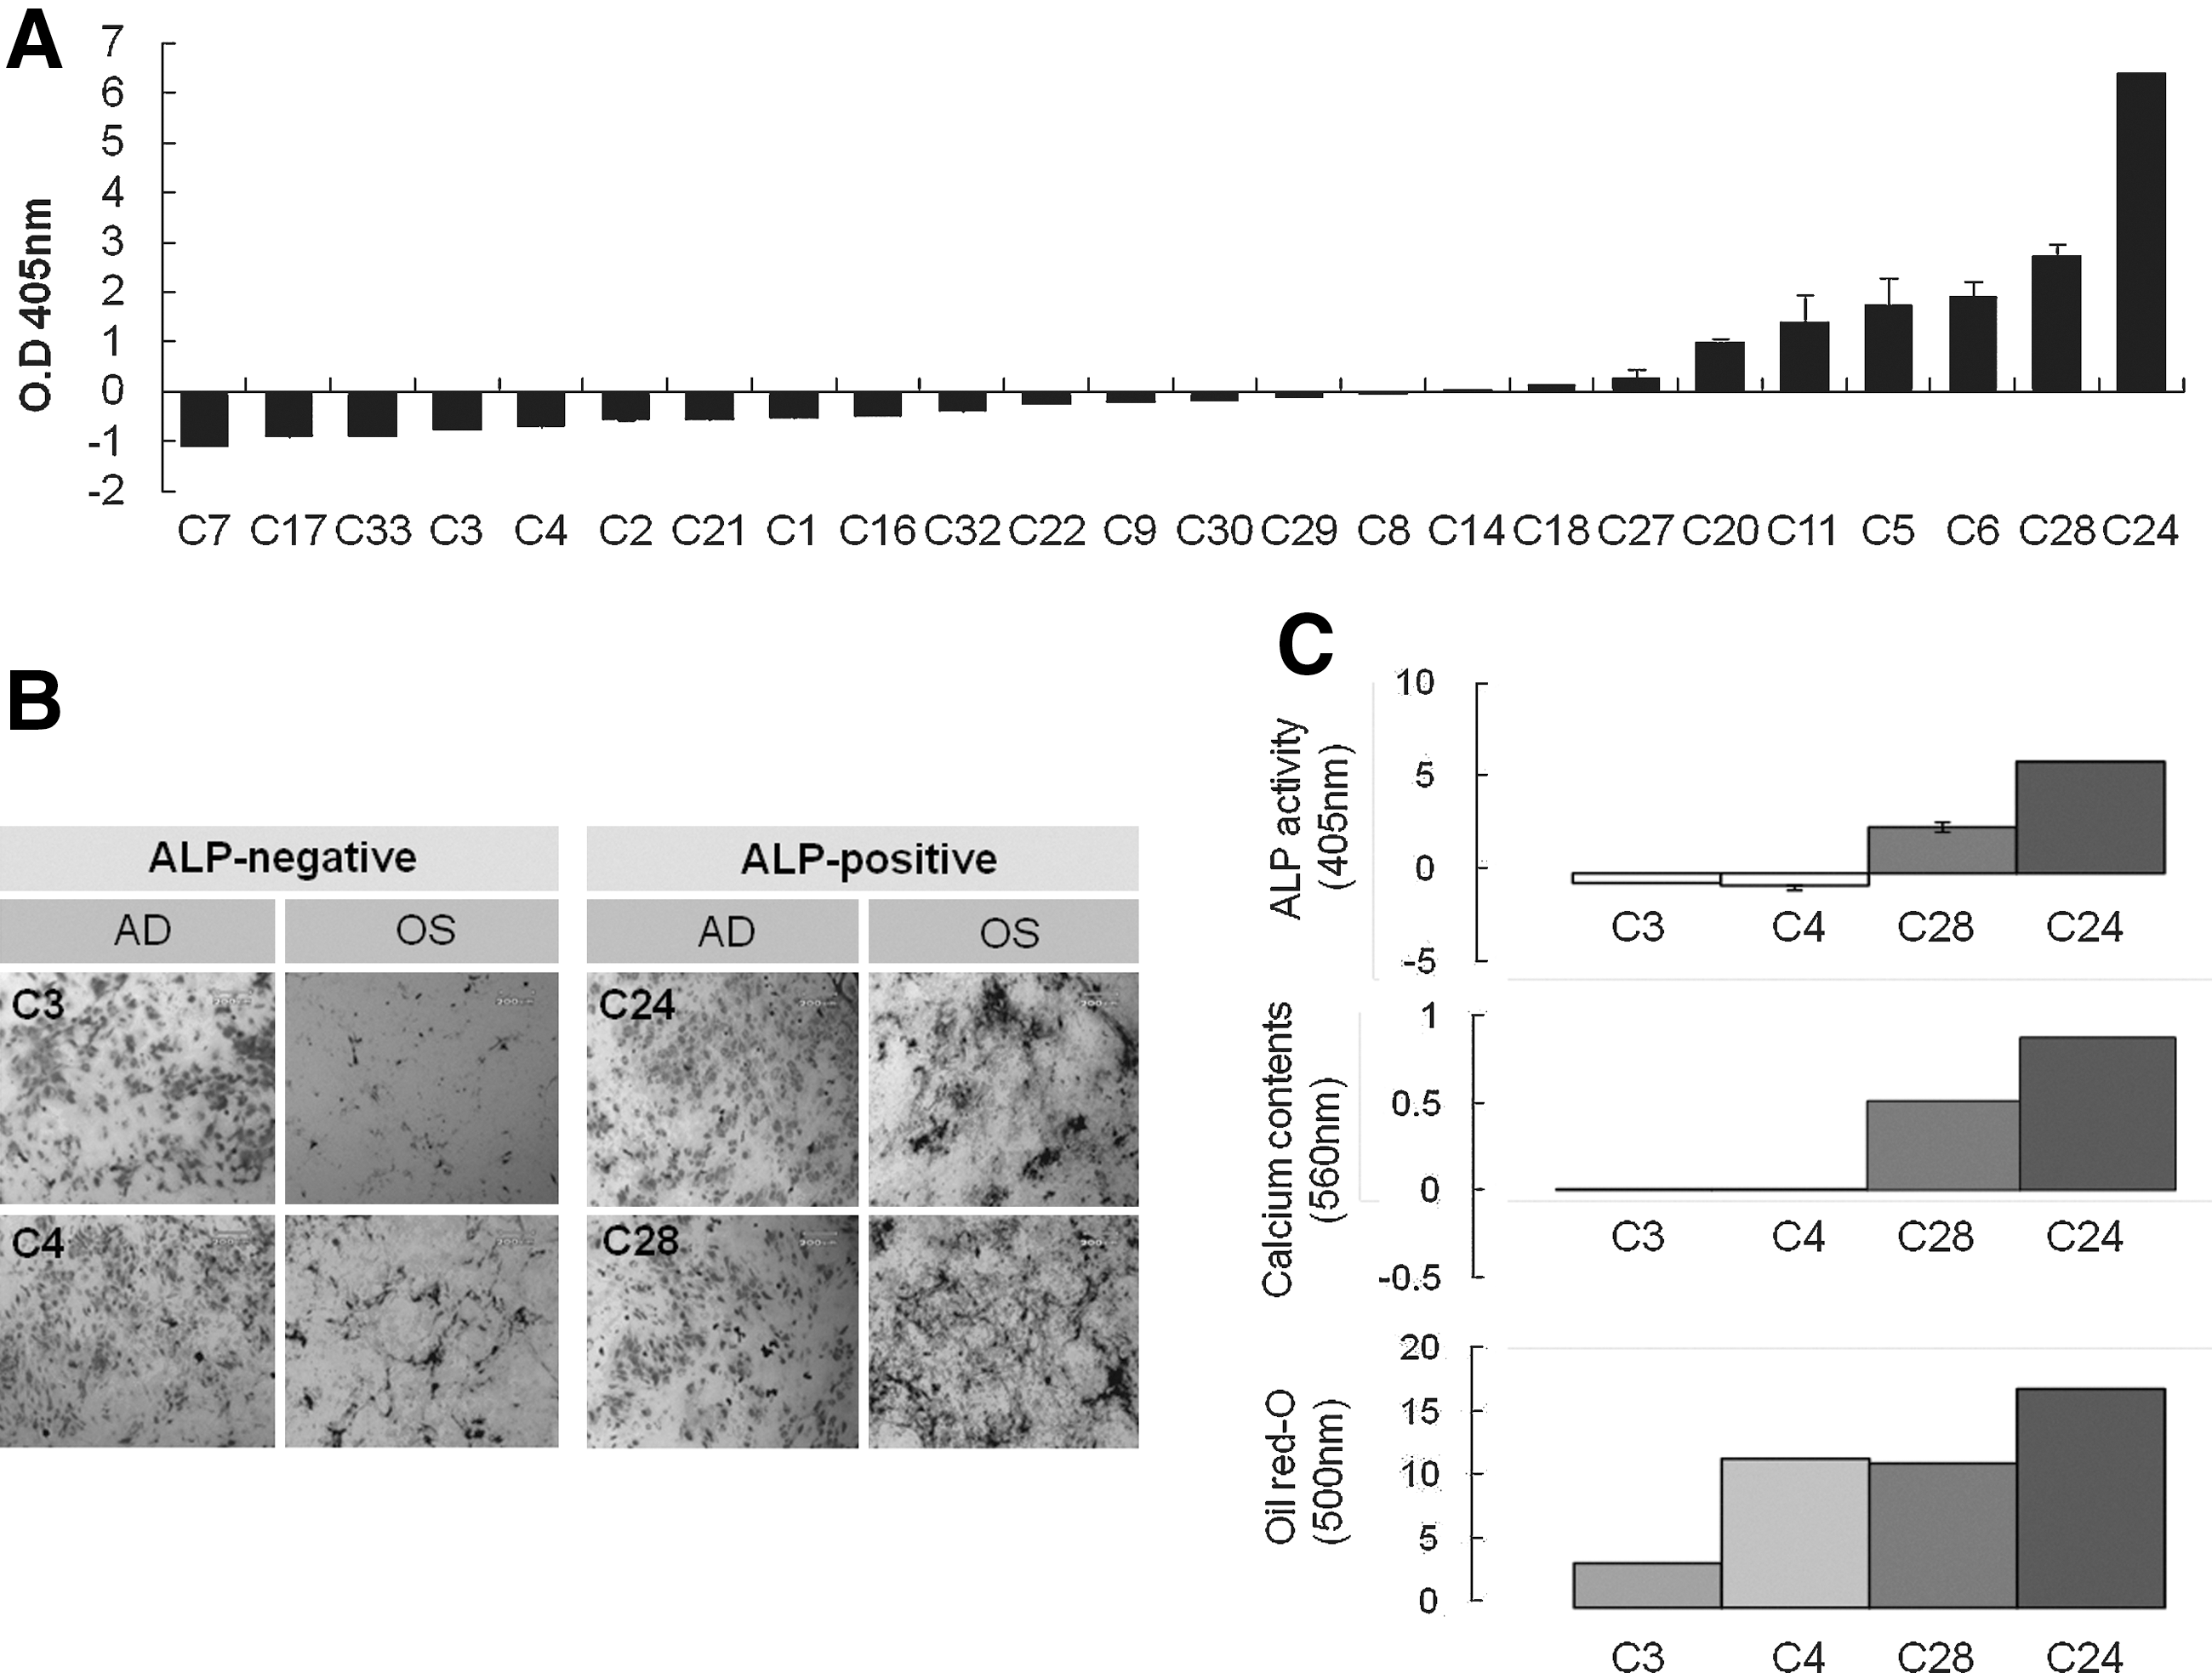
Differentiation potential in clonal cells according to TNAP activity
To exclude donor variation, 32 clones from a single donor were randomly selected and examined for TNAP activity, which varied between the clones (Fig. 4A). These experiments were repeated in 3 donors. To compare the differentiation efficiencies of TNAP− and TNAP+ clones, TNAP+ (C28 and C24) and TNAP− clones (C3 and C4) were treated to induce osteogenic- and adipogenic differentiation (Fig. 4B).
The majority of clones could be induced into osteogenic differentiation and osteogenic efficiency was higher in the TNAP+ clones than in the TNAP− clones. In quantification assay, calcium content clearly demonstrated that there was a positive correlation between the TNAP level and the ability to undergo osteogenic differentiation (Fig.4C). In contrast, the efficiency of adipogenic differentiation was similar in the TNAP+ (C28 and C24) and TNAP− clones (C3 and C4), and seemed not to be TNAP-dependent.
TNAP activity and differentiation potential of UCB-MSCs
To assess TNAP activity in MSCs derived from another source, the CFU-F and TNAP activity assay was performed on UCB-MSC. We showed that TNAP activity in UCB-MSC was very low compared with BMSCs in Fig. 2. UCB-MSC was treated to undergo osteogenic, adipogenic, and chondrogenic differentiation. In contrast to BMSCs, UCB-MSCs did not express TNAP (Fig. 5b), but they did possess colony forming ability (Fig. 5a) and were able to differentiate into all 3 cell lineages, osteogenic (Fig. 5c), chondrogenic (Fig. 5d), and adipogenic (Fig. 5e). This finding suggests that, unlike BMSCs, there is no correlation between the TNAP activity and differentiation capacity in UCB-MSCs.
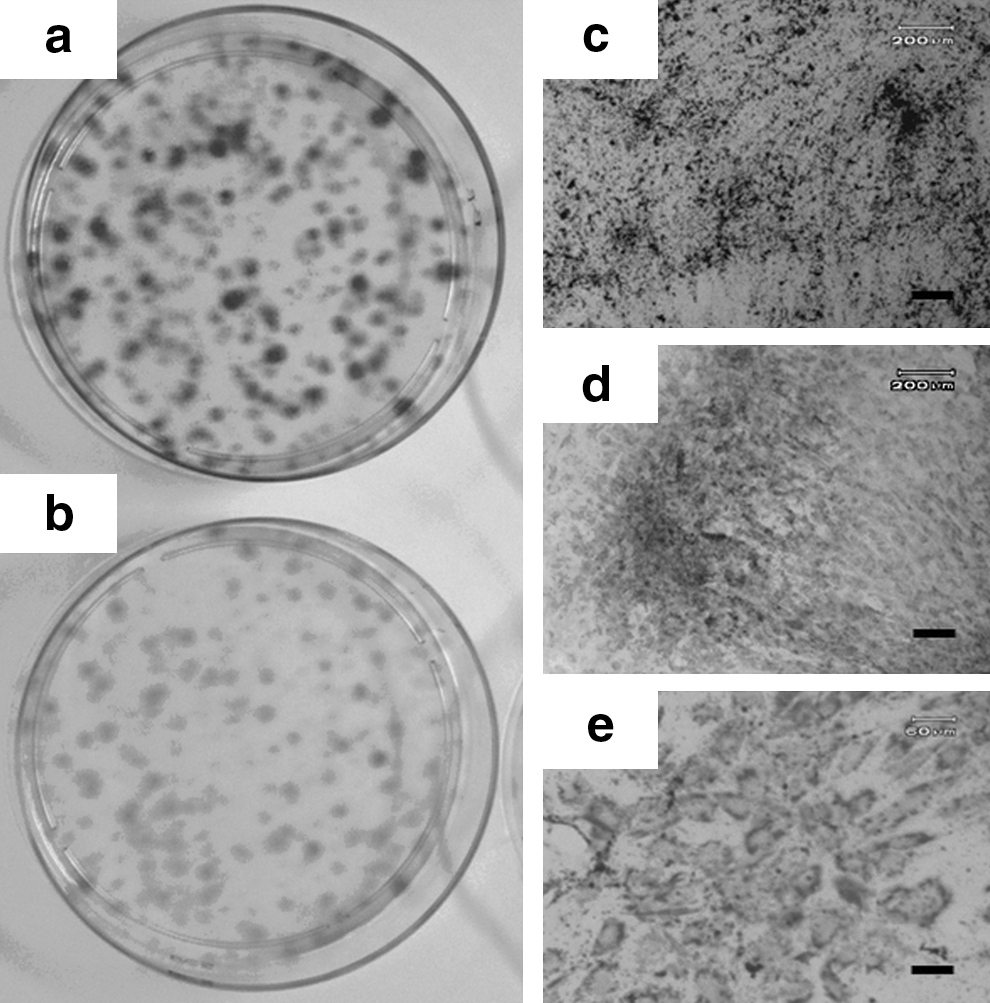
TNAP activity and differentiation potential of UCB-MSCs.
Three-lineage differentiation potentials in osteoblast, preadipocyte, and TNAP−/TNAP+ BMSCs
To further examine the TNAP expression in mesenchymal lineage cells (osteoblasts, preadipocytes, and chondrocytes), CFU-F and TNAP activity assays were performed with osteoblasts, preadipocytes, and chondrocytes. All cells showed colony-forming activity, but TNAP activity was only present in osteoblasts (data not shown). To evaluate whether TNAP-expressing BMSCs had characteristics similar to osteoblasts, we next compared the multipotentiality of TNAP− clone, TNAP+ clone and specific lineage-committed cells (osteoblasts and adipocytes). TNAP+ BMSC were bipotential for osteogenic and adipogenic cells, whereas TNAP− BMSCs were multipotential for osteogenic, adipogenic, and chondrogenic differentiation (Fig. 6). Osteoblasts did not differentiate into other cells types, such as adipocytes or chondrocytes, in any differentiation condition. Preadipocytes, which were negative for TNAP staining, showed weak chondrogenic potential via Safranin-O staining. Although TNAP was increased when cells were in osteogenic conditions, calcium deposition was not detected by von Kossa staining in preadipocytes (Fig. 6). Our data suggest that TNAP-expressing BMSCs showed a limitation in multipotential differentiation capacity, and that TNAP+ BMSCs within the heterogeneous population of BM are different from differentiated osteoblasts.
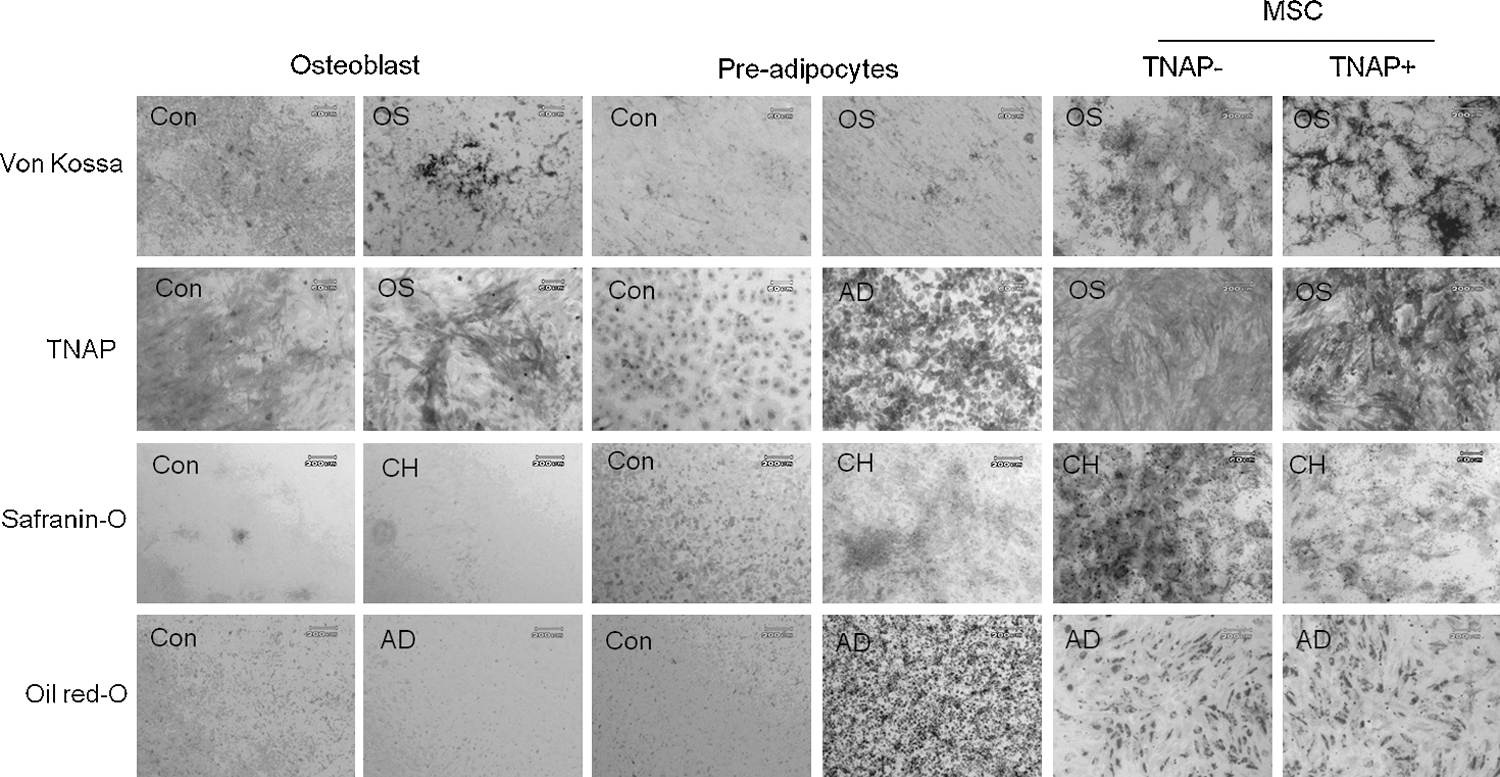
Differentiation potential of osteoblast, preadipocyte, and TNAP−/TNAP+ BMSC clones. The potential for 3-lineage differentiation was examined for osteoblasts, preadipocytes (3T3-L1), and TNAP−/TNAP+ BMSC clones. Each cell was seeded on 12-well plates and differentiated into 3-lineage cells for 14 days. Con, undifferentiated control; CH, chondrogenic differentiation.
Gene expression in TNAP−/TNAP+ BMSCs according to passage and during osteogenic and chondrogenic differentiation
We investigated the expression of osteogenic-related genes (osteopontin, osteocalcin, osterix, dlx5, and cbfa1) in expanded BMSCs between passage 1 and passage 3. At early passages 1, TNAP− BMSCs (P1) expressed several osteogenic-related genes, such as cbfa1, osterix, Msx2, and DEC-1 (Fig. 7A). However, these cells changed to TNAP+ cells and their osteopontin, osteocalcin, dlx5, and DEC-1 mRNA expression were increased at passage 3 (P3). CFU-F and TNAP activity assays showed that TNAP expression was increased in both TNAP− and TNAP+ BMSCs, and colony-forming activity and colony size were reduced after 3 passages, suggesting that BMSCs were spontaneously committed into osteoblastic lineage during in vitro expansion; this occurred regardless of how strongly the BMSCs expressed TNAP prior to expansion in vitro. TNAP+ cells expressed high levels of cbfa1, dlx5, and osteopontin, whereas TNAP− cells expressed high levels of Msx2 and osterix (Fig. 7B). When both cell types were induced to undergo osteogenic differentiation, they exhibited similar mRNA expression patterns on day 5. Expression of the transcription factors msx2 and osterix decreased during osteogenesis, whereas expression of the transcription factors dlx5 and cbfa1 increased. We also examined the expression of chondrogenic genes and proteoglycans (via Safranin-O staining) during in vitro chondrogenic differentiation. We detected higher type II collagen levels in TNAP− BMSCs compared with TNAP+ BMSCs. In contrast, type X collagen and cbfa1, were shown to be induced in hypertrophic tissue and detected in osteoarthritic cartilage, were increased in TNAP+ BMSCs (Fig. 7C). In Safranin-O staining, proteoglycan synthesis was higher in TNAP− BMSCs than in TNAP+ BMSCs, suggesting that TNAP could be used as a marker predicting chondrocyte hypertrophy during in vitro chondrogenesis.
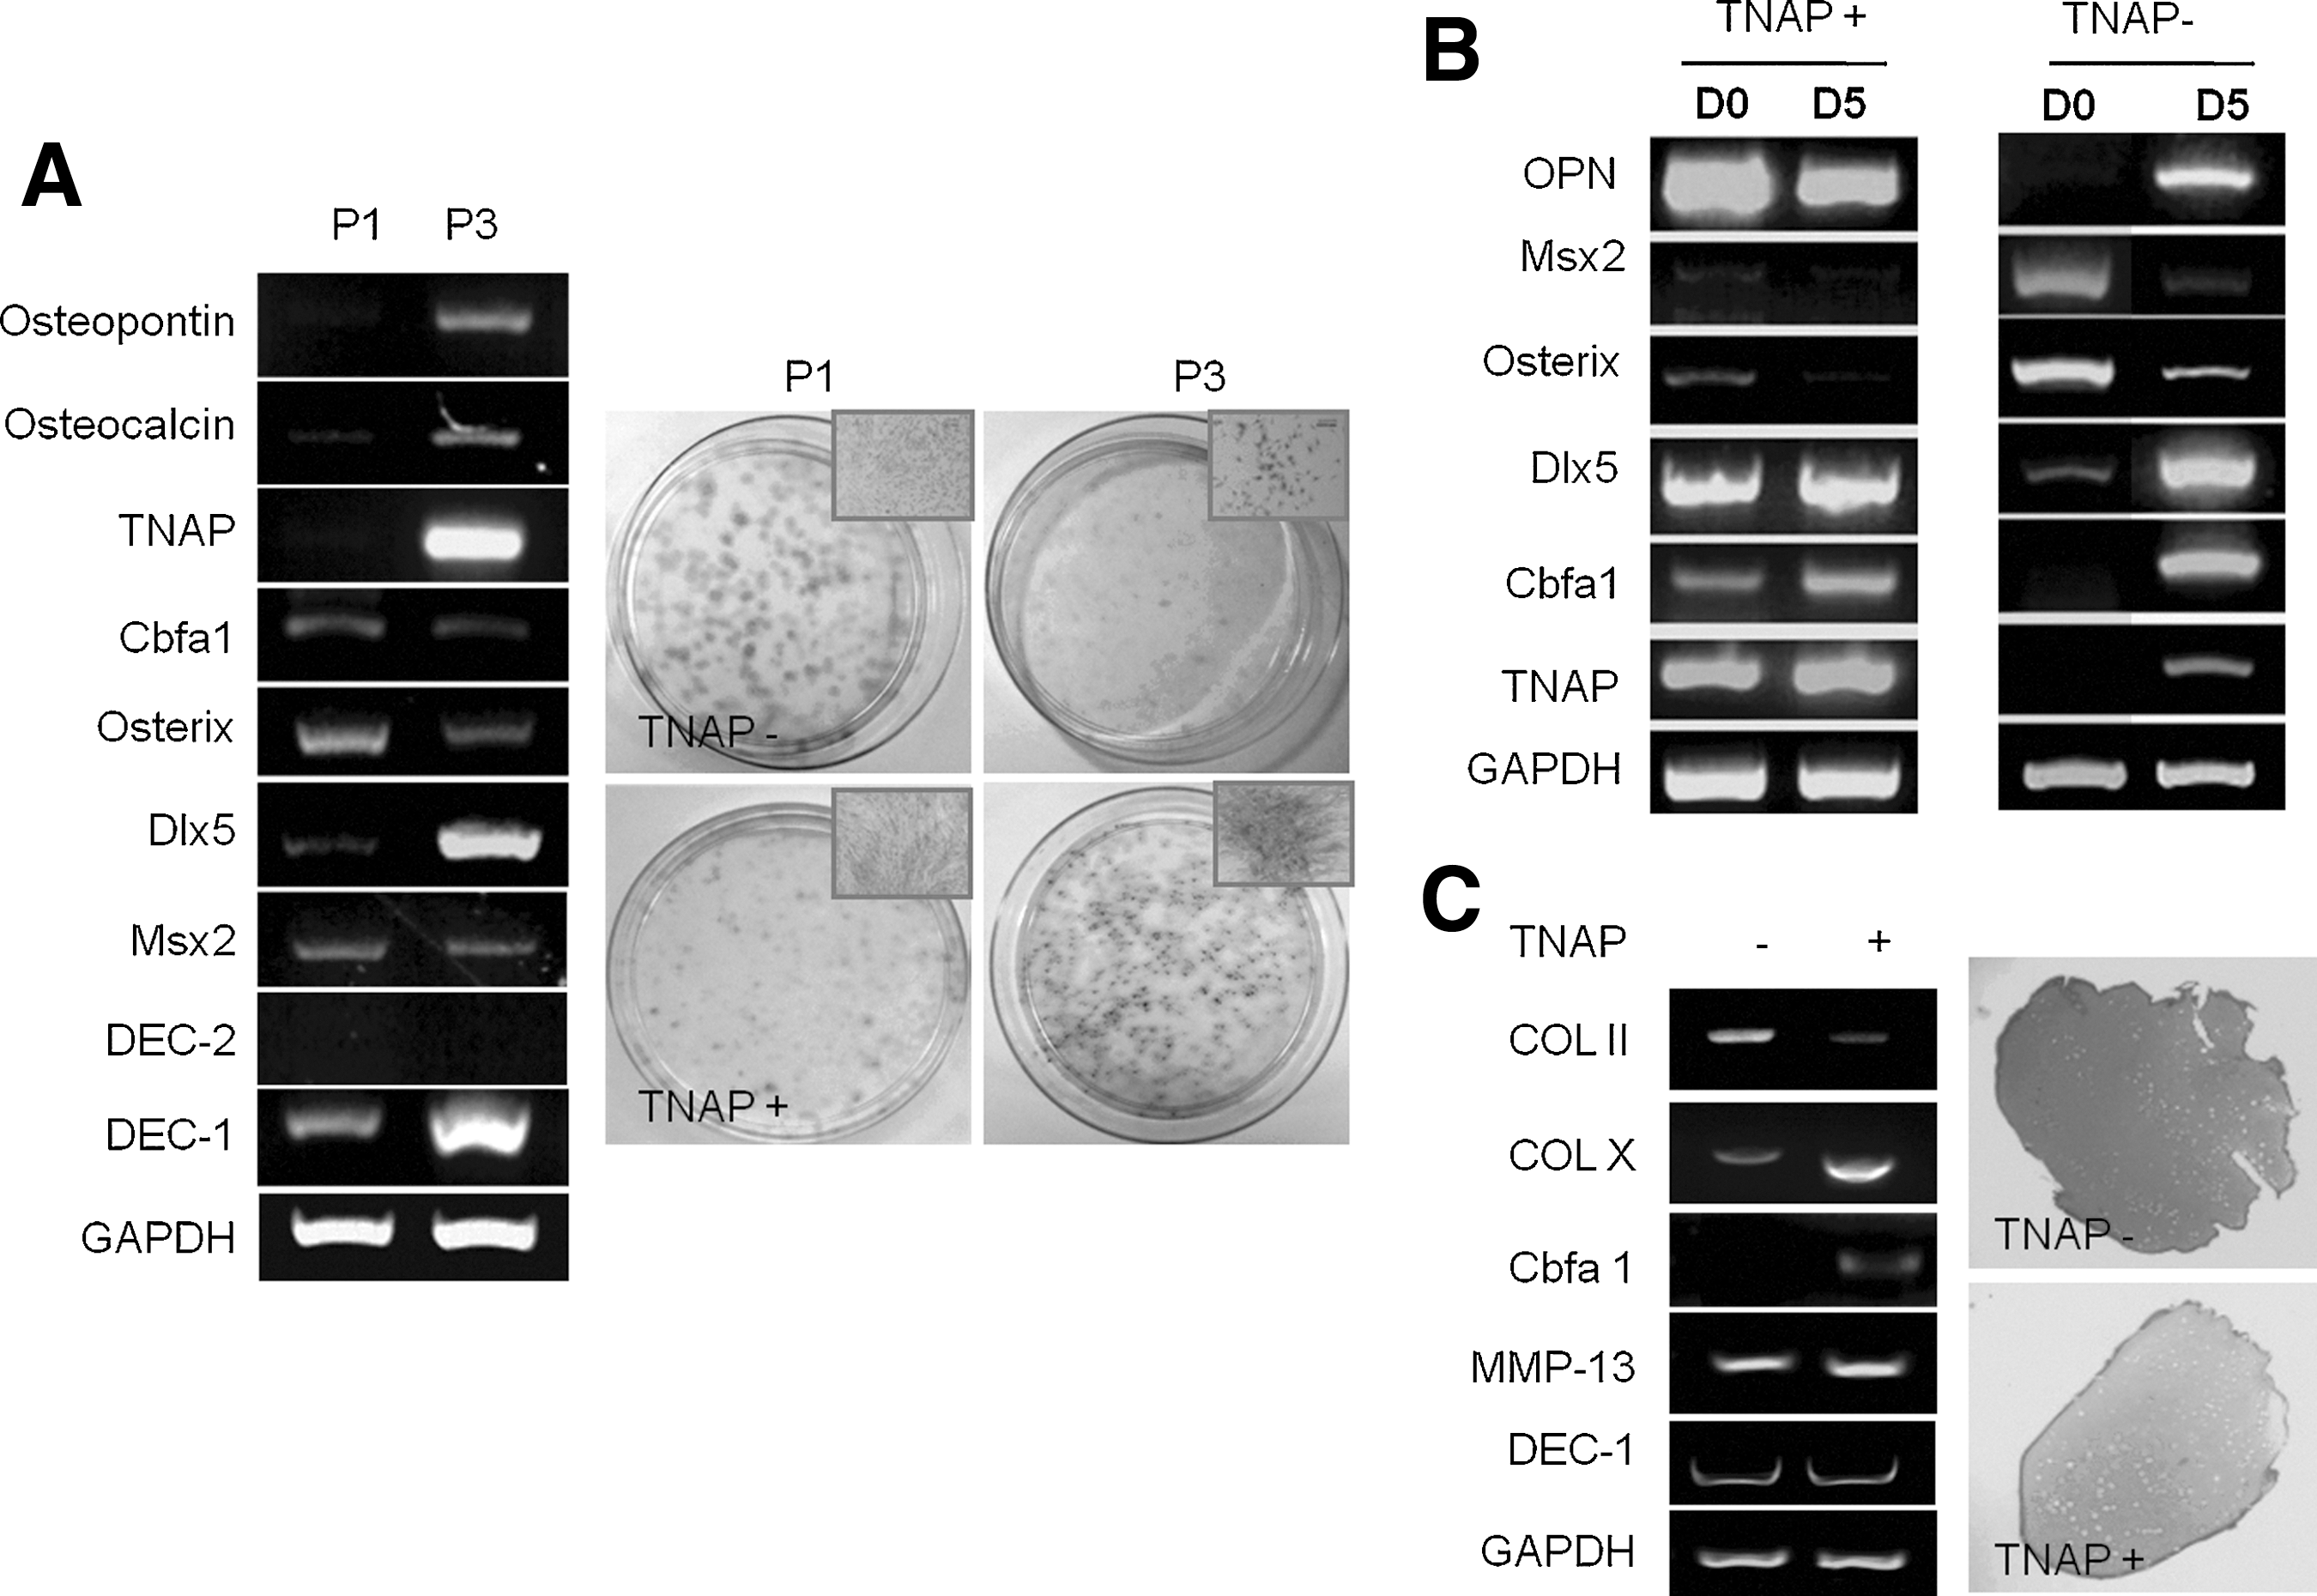
Gene expression in TNAP−/TNAP+ BMSC clones according to passage and during OS and chondrogenic differentiation.
Difference in cell proliferation and cell cycle-related gene expression in TNAP−/TNAP+ BMSCs
FACS analysis of MSCA-1 expression showed differences in TNAP level in 2 donors, 3.87% in TNAP− donor and 31.4% in TNAP-mixed donor (Fig. 8A). Therefore, we sorted TNAP− or TNAP+ cells from a TNAP-mixed donor using W8B2 antibody directed against MSCA-1 in an FACS cell sorter (Fig. 8B). In cell proliferation assay, TNAP+ sorted cells exhibited low proliferation rates compared with TNAP− sorted cells (Fig. 8B). These results are consistent with our results that proliferation rate of TNAP− BMSC was higher than that of TNAP+ BMSC (data not shown). In real-time quantitative PCR, mRNA expression of cell cycle-related genes, cyclin A2, CDK2, and CDK4, was increased in TNAP− BMSC (Fig. 8C), suggesting that TNAP− BMSCs have a proliferative capacity.
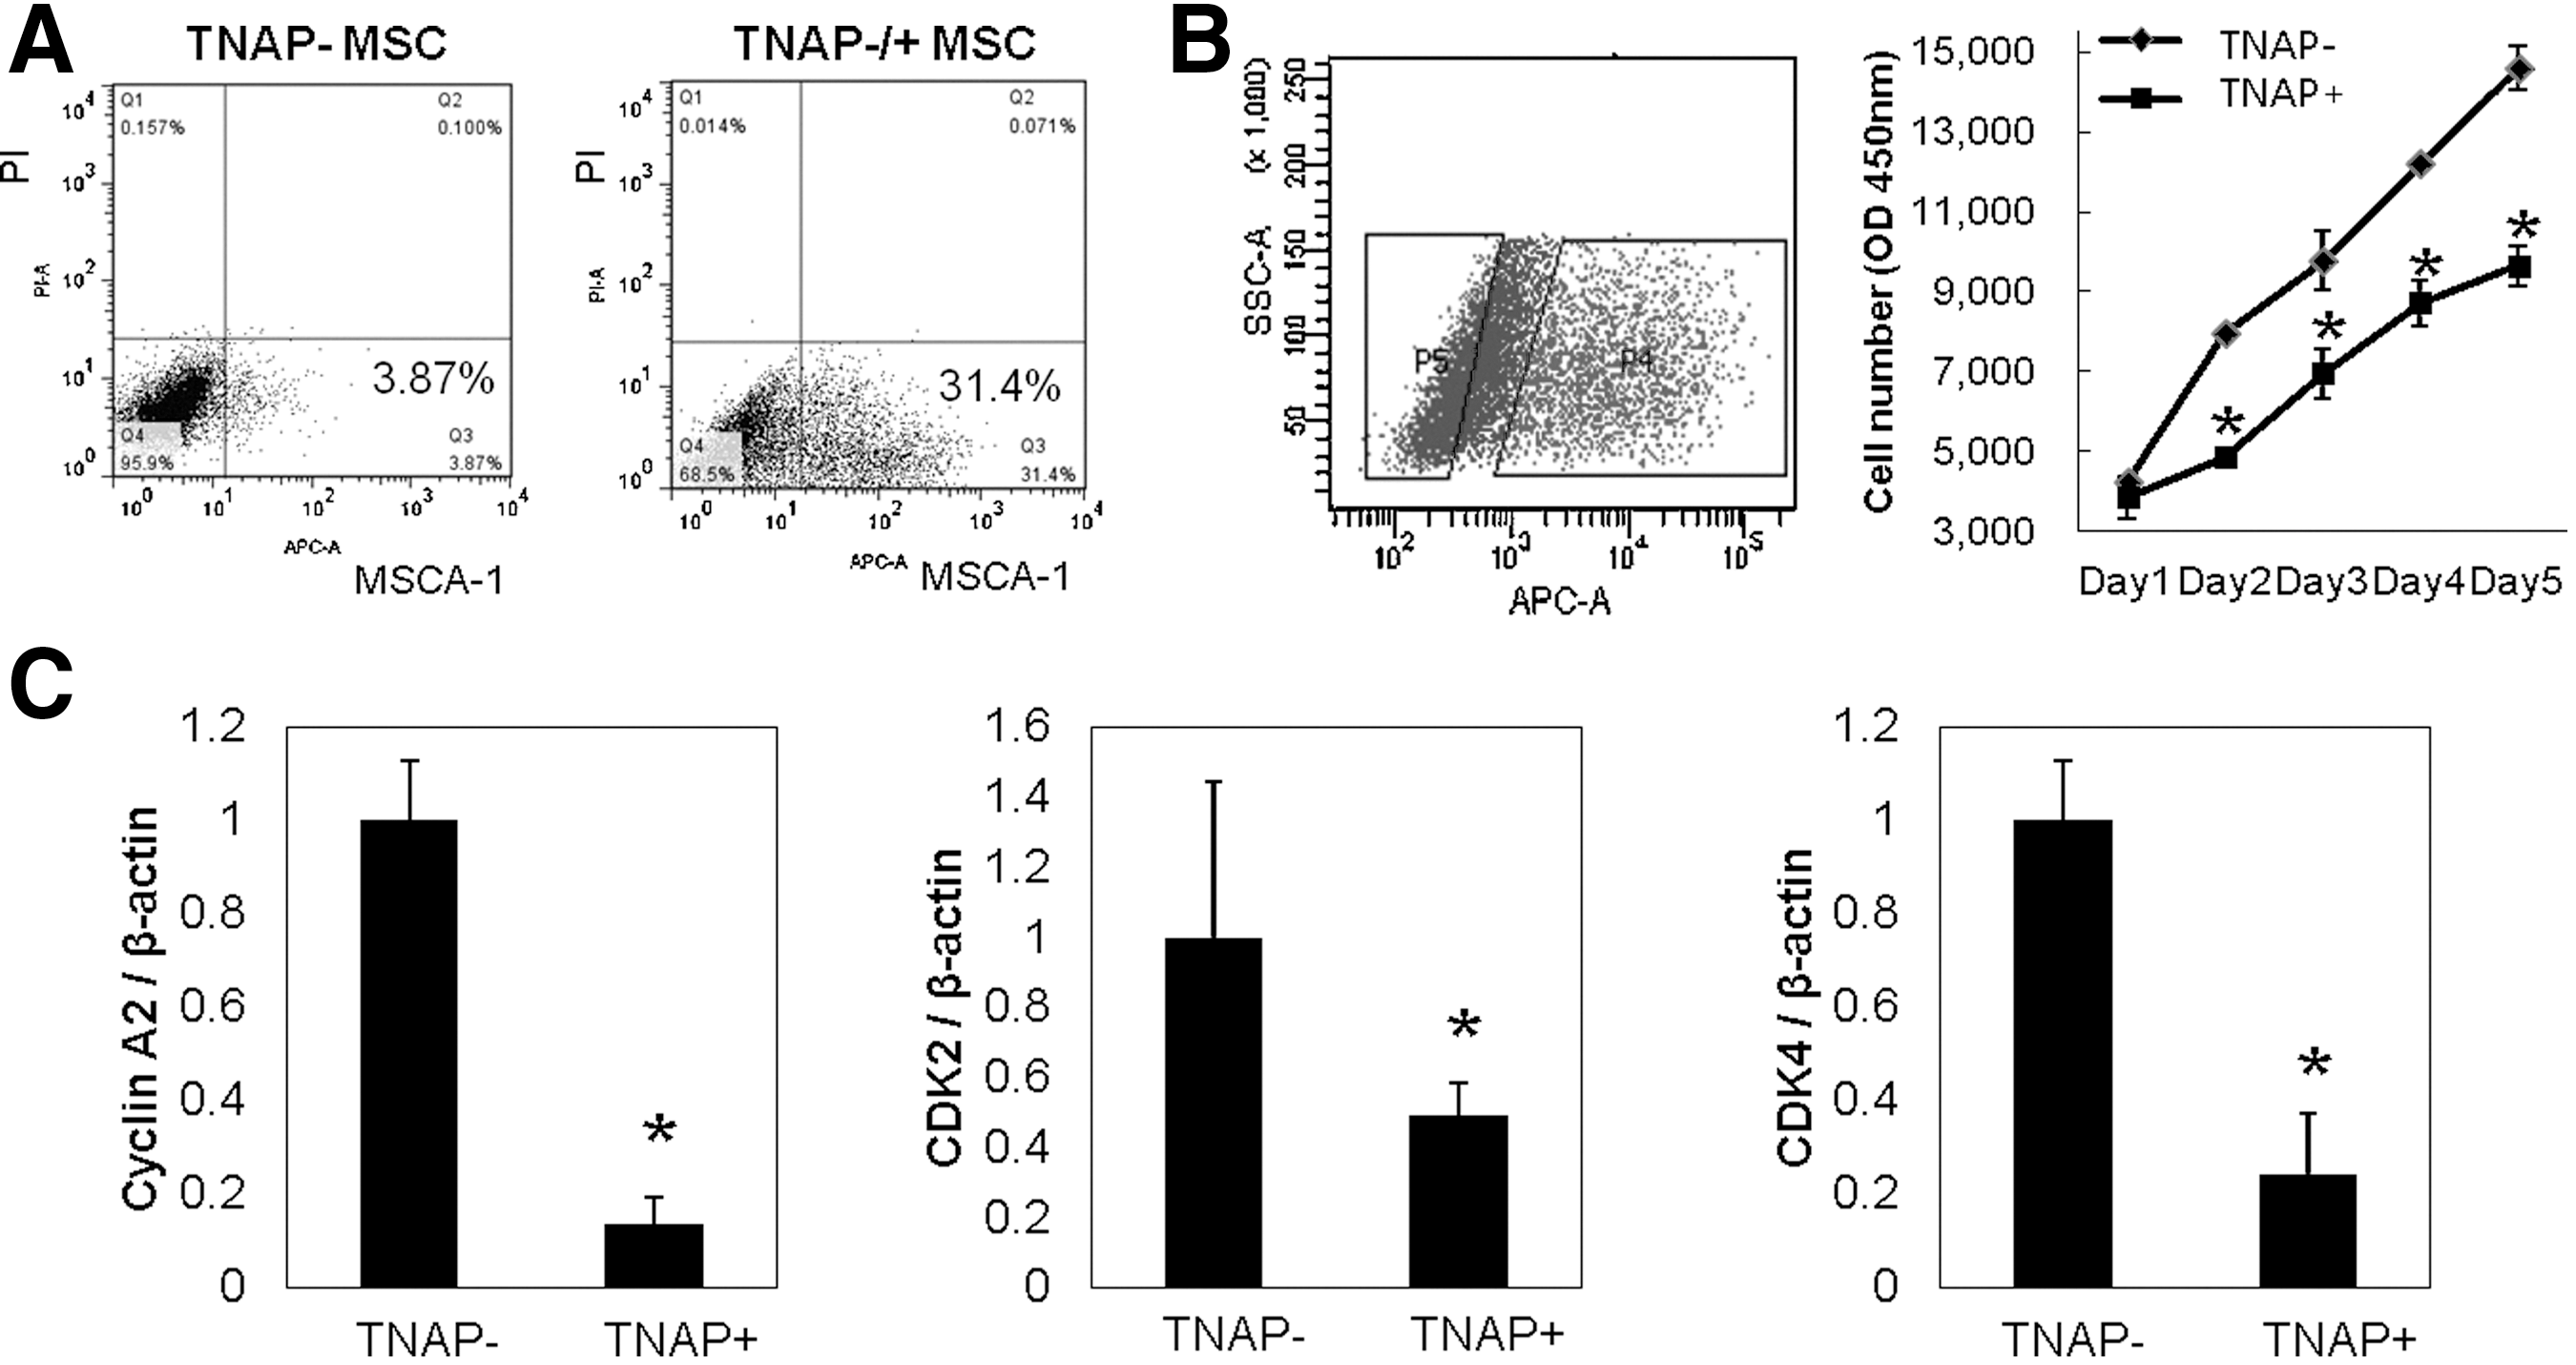
Cell proliferation and gene expression in mesenchymal stem cell antigen-1 (MSCA-1) negative/-positive BMSCs.
Difference in osteogenenesis-related genes and pluripotency marker expression between TNAP− and TNAP+ cell
We showed that TNAP− BMSCs were more primitive cells with multipotentiality and high cell proliferation capacity. In BMSCs sorted with W8B2 antibody directed against MSCA-1, mRNA expression of osteogenesis-related genes (cbfa1, dlx5, and osteopontin) and pluipotency marker genes (rex1 and nanog) was confirmed between TNAP− and TNAP+ cells (Fig. 9).
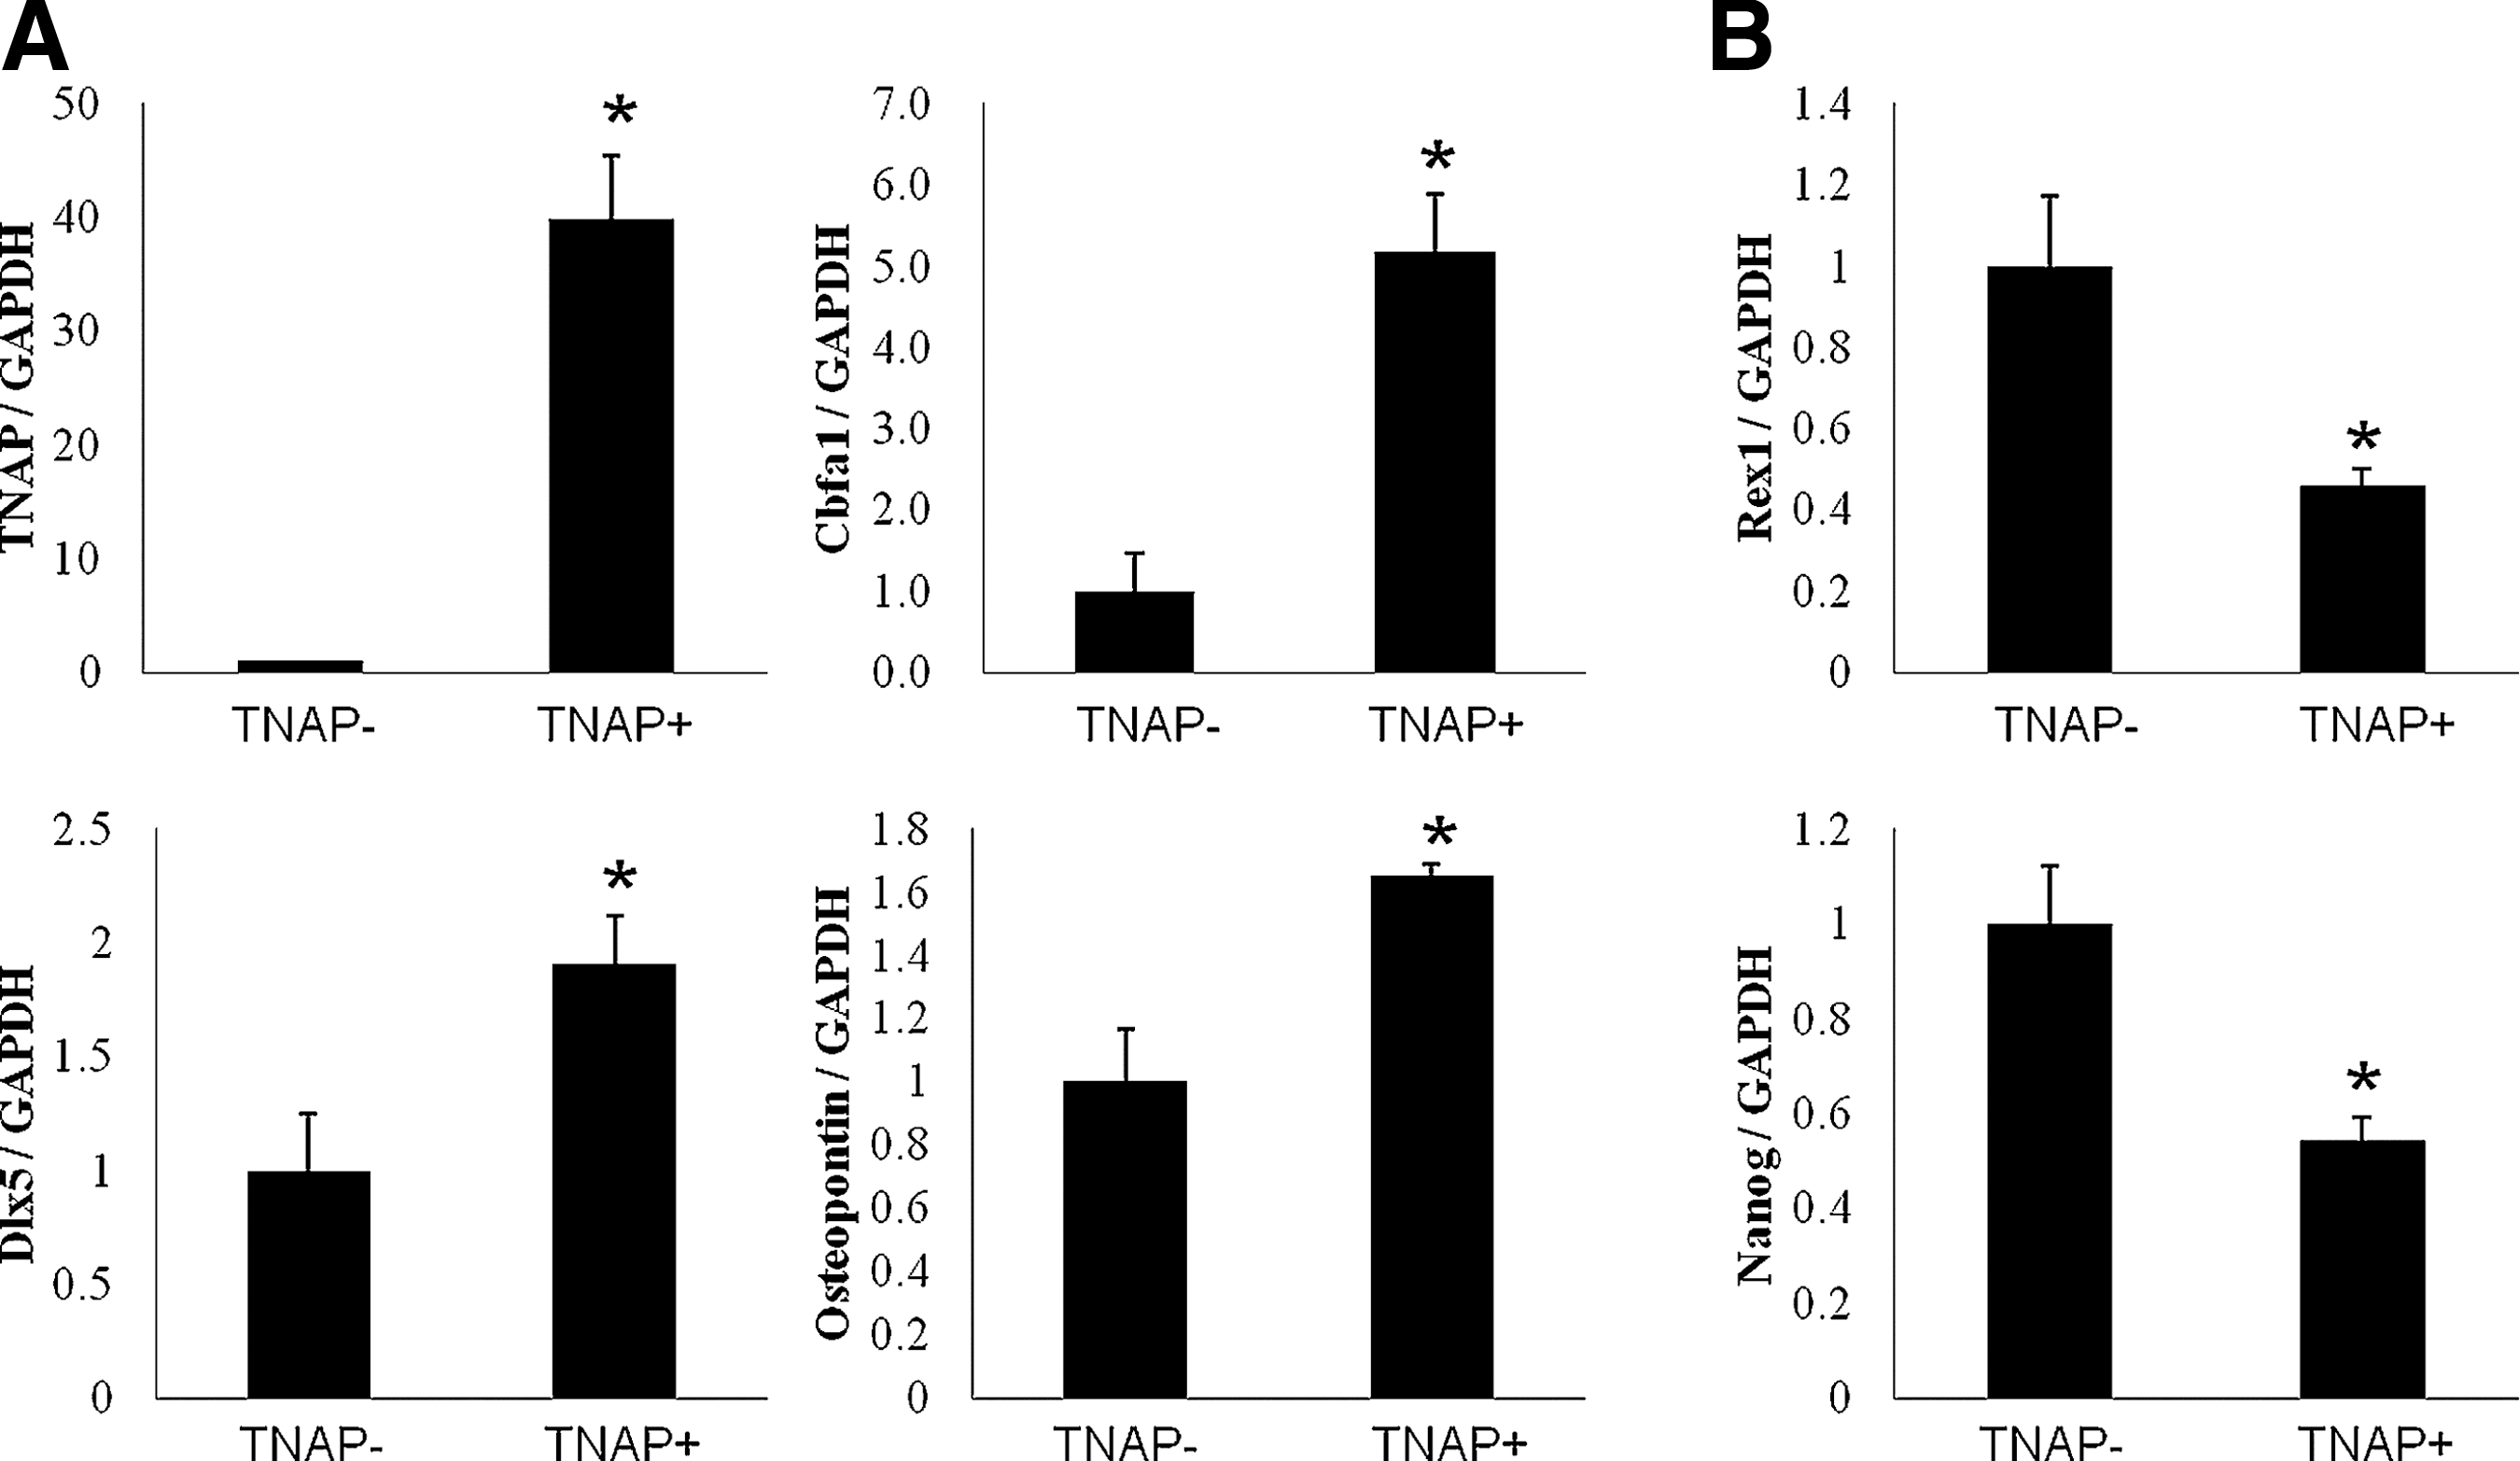
MSCA-1-dependent gene expression of osteogenic and pluripotency markers in BMSCs. TNAP-mixed BMSCs at passage 3 were sorted by W8B2 antibody and used for real-time quantitative PCR.
The mRNA expression of TNAP was correlated with MSCA-1 marker expression. Osteogenesis-related genes, Cbfa1, dlx5, and osteopontin, are increased in TNAP (cells sorted by W8B2 antibody)-positive cells compared with TNAP (cells not sorted by W8B2 antibody)-negative cells (Fig. 9A). However, the mRNA expression of rex1 and nanog was decreased in TNAP+ cells compared with TNAP− cells (Fig. 9B). Overall, these results indicate that TNAP− cells were more primitive cells with higher proliferation capacity and higher expression of pluipotency marker genes than TNAP+ cells.
Discussion
Most MSCs tend to progressively lose their multipotency and proliferation capacity during in vitro cultivation. These situations cause problems that are time- and cost-consuming during development of a therapeutic system. TNAP expression is commonly accepted as a marker of ES cells and osteoblasts, but there is no unequivocal evidence describing a correlation between TNAP expression and the differentiation potential of adult MSCs. Here, we present evidence that early TNAP activity in unexpanded BMSCs shows various patterns among donors and is unrelated to both age and gender. However, TNAP levels were positively correlated with cell size and granulation, passage number, osteogenic potentiality, and expression of osteogenic-related genes. A recent study showed that high TNAP activity was present in samples from patients over 65 years of age, but this study did not show any correlation between TNAP activity and cellular phenotype. In contrast, another group showed that TNAP activity progressively declined with age at early passage and that MSCs from patients over 40 years of age showed decreased chondrogenic differentiation and increased oxidative damage [4]. To exclude the complicating influence of donor variation, we isolated TNAP− and TNAP+ clones from 3 donors. Among these clones, bipotential clones for adipocytes and osteoblasts were found in both the TNAP− and TNAP+ cells, but were relatively more common in the TNAP− cells. There was a strong correlation between TNAP activity and calcium mineralization in all clones. Similar report has shown that faster rates of bone formation were paralleled by faster formation of TNAP clusters in vivo [24]. Multipotential clones possessing the ability to develop into adipocytes, osteoblasts, and chondrocytes were found in the TNAP− population. Additionally, chondrogenic differentiation was successfully induced in TNAP− cells more often than in TNAP+ cells. This finding suggests that the multipotentiality of TNAP+ cells is limited, but that these cells do possess bipotentiality or monopotentiality and tend to differentiate into osteoblast lineages more frequently than other tissues. Therefore, this result indicates that TNAP− cells are probably more primitive, while TNAP+ cells are more suitable as osteoprogenitor cells that express osteogenic-related genes, but which lack the capacity for self-renewal based on the bone cell population hierarchy [25]. We verified this possibility by checking osteogenic genes at the beginning of osteogenesis in both cells. Several osteogenic genes, such as cbfa1, dlx5, OPN, and TNAP were expressed in TNAP+ BMSCs, even in noninducing conditions, while similar expression patterns were found at day 5 of postosteogenic differentiation of TNAP− BMSCs. In addition, msx2 and osterix expression levels were higher in TNAP− BMSCs than in TNAP+ BMSCs, but they disappeared at the beginning of osteogenic differentiation in both cell types. Osterix is genetically downstream of cbfa1, however, it is insufficient to establish osteogenic lineages from mesenchymal cells [26]. Msx homeobox genes essentially control cellular proliferation and differentiation during development. Specifically, msx1 and msx2 inhibit differentiation of mesenchymal lineages by upregulating the expression of cyclin D1. Loss of function in msx induces premature cell cycle exit by progenitor cells [27].
Based on our results, we also suggest that TNAP may be related to the osteogenic commitment in BMSCs. This is primarily based on our observation that TNAP+ BMSCs can induce chondrocyte maturation that is accompanied by expression of hypertrophic markers, such as MMP13 and type X collagen, during chondrogenesis in vitro. Recently, expression of hypertrophic markers during chondrogenesis has been an issue, because their expression induces bone formation, but not regeneration of hyaline cartilage, as shown in an osteoarthritis patient. This problem was confirmed when chondrocyte-like cells induced from MSCs in vitro underwent alterations related to endochondral ossification rather than adopting a stable chondrogenic phenotype in vivo [9]. Here, we showed that TNAP+ BMSCs spontaneously express several osteogenesis-related transcription factors, including cbfa1 or dlx5, which increased as a function of culture time. Forced expression of cbfa1, a member of the runt-related transcription factor family, stimulated the expression of hypertrophic phenotypes, such as TNAP and matrix calcification, in chondrocytes [28]. We found that, when TNAP+ or TNAP− BMSCs were differentiated into chondrocytes for 14 days, type X collagen and cbfa1 were expressed at higher levels in TNAP+ BMSCs. It appears that the expression of type X collagen increased during in vitro chondrogenesis may be dependent on the level of TNAP/cbfa1 expression in undifferentiated BMSCs. Higher levels of TNAP activity were detected in BM- and adipose tissue-derived MSCs, relative to synovium-derived stem cells, whereas no calcification was observed in transplants derived from synovium-derived MSCs [29]. Therefore, we suggest that TNAP or cbfa1 in undifferentiated BMSCs could be useful as a marker for predicting chondrocyte hypertrophy during in vitro chondrogenesis. Additionally, TNAP− BMSCs will be required for clinical treatments for cartilage regeneration. Marom et al. showed a relationship between TNAP activity and cell density in BM-derived stromal cells [30]. In our previous studies, expression of osteogenic genes was significantly increased during in vitro expansion at high cell density and was accompanied by a loss of multipotentiality [31]. Therefore, MSC expansion should be controlled to prevent immature or primitive stem cells from committing to or differentiating into osteogenic lineage cells.
TNAP is also a marker of pluripotency in ES cells. By evaluating the mRNA expression of the pluripotency markers, rex-1 and nanog, we showed that the role of TNAP between MSCA-1-negative- and -positive cells sorted from BMSCs is different from its role in ES cells. Expression of these genes was much higher in TNAP− BMSCs than in TNAP+ BMSCs. This finding is consistent with studies demonstrating that tripotentiality and proliferative capacity were maintained in TNAP− BMSCs, but not in TNAP+ BMSCs. Recently, one group reported that MSCA-1, which is identical to TNAP, is expressed in MSCs from human BM and endometrium [20]. In addition, MSCA-1 may be a promising osteogenic marker for human jaw periosteum-derived cells [32]. The authors of the latter study showed that SSEA-3 was also expressed on the majority of MSCA-1-positive MSCs, and they also demonstrate that the colony-forming activity and differentiation potential of MSCA-1 (TNAP)-positive MSCs were CD56-dependent [33]. Unlike human first trimester MSCs [34], adult MSCs do not express oct-4 and nanog, nor do they produce either SSEA-3 or −4. However, in another report, SSEA-4 was observed in adult BMSCs [35]. Although many studies reported the expression of pluripotent markers in adult BMSCs, there were differences in gene expression in each report. These differences probably resulted from variations in culture conditions, such as passage numbers and cell seeding density. Therefore, TNAP can be used as a predictive marker to define the status of heterogeneous BMSC populations and to evaluate chondrocyte hypertrophy during chondrogenesis.
Footnotes
Acknowledgment
This research was supported by a grant (code: SC3210) from the Stem Cell Research Center of the 21st Century Frontier Research Program funded by the Ministry of Science and Technology, and by a grant (Code: A110328) from the Korea Health Technology R&D Project, Ministry of Health & Welfare, Republic of Korea.
Author Disclosure Statement
No competing financial interests exist.