
Abstract
Gaucher disease (GD) is a lysosomal storage disorder due to glucocerebrosidase (GBA) deficiency. Mechanisms leading to the emergence of hematological and skeletal manifestations observed in GD are poorly explained. Bone marrow (BM) mesenchymal stem cells (MSCs) are multipotent progenitors that participate in the regulation of bone mass. MSCs should thus represent a cell population involved in the development or progression of bone disease in GD. In a chemical model of GD obtained with Conduritol β epoxide (CBE), a specific inhibitor of GBA activity, we functionally characterized BM MSCs and specifically analyzed their capacity to differentiate into osteoblasts. GBA deficiency obtained with CBE treatment, leads to a dramatic impairment of MSCs proliferation and to morphological abnormalities. Although the capacity of MSCs to differentiate into osteoblasts was not modified, the levels of several soluble factors that regulate bone metabolism were increased in MSCs treated with CBE, compared with untreated MSCs. Moreover, addition of conditioned media from CBE-treated MSCs on monocyte-derived osteoclasts cultured on bone matrix leads to an increase of resorption areas. These data suggested that, in GD, MSCs represents a stem cell population that is likely to be involved in bone pathogenesis.
Introduction
G
In type 1 GD, the accumulation of glucosylceramide in the lysosomal compartment of affected cells results in heterogeneous manifestations including visceral, hematological, and skeletal involvement [2]. Bone disease is the most debilitating feature of type 1 GD, the most frequent form of the disease, and has a major impact on the quality of life of patients. Skeletal manifestations include Erlenmeyer flask deformity, bone marrow (BM) infiltration, osteopenia, avascular necrosis, infarction, fractures, lytic lesions, and joint replacements [3]. To date, enzyme replacement therapy is the most commonly used therapy for patients with GD. Alternatives therapies, such as substrate reduction therapy, have also been effective for treating GD [1].
Pathophysiology of bone involvement in GD also remains poorly understood and hypotheses include inhibition of osteogenesis and/or stimulation of osteoclastogenesis by cytokines. Plasma levels of soluble factors involved in the regulation of osteoblasts and osteoclasts activity have thus been shown to be deregulated in GD, but the results reported in several studies were not constant and were not correlated with clinical severity [4 –9].
BM mesenchymal stem cells (MSCs) are multipotent progenitors able to differentiate along various mesenchymal cell subtypes in vitro and in vivo and particularly into osteoblasts [10]. To date, little is known regarding the functional integrity of GD patients BM microenvironment. We recently showed that a chemical inhibition of GBA activity led to an impaired BM hematopoietic progenitor functionality in a model of GBA deficiency induced by Conduritol β epoxide (CBE) [11]. Recently, Campeau et al. reported, in a type 1 GD patient, that MSCs displayed a low GBA activity and accumulated glucocerebroside [12]. MSCs phenotype and differentiation capacities were found to be normal but an altered inflammatory secretome was observed. Cyclooxygenase-2 (COX2), interleukin-8 (IL-8), prostaglandin-E2 (PGE2), and chemokine ligand-2 (CCL2) levels were increased compared with healthy donors MSCs thus suggesting a contribution of MSCs in skeletal disease. These data have been recently confirmed in a mouse model of GD which displayed skeletal manifestations partly related to an impairment of BM MSCs properties [13].
Here, we evaluated in an in vitro chemical model of GD the potential involvement of BM MSCs in the skeletal compartment.
Materials and Methods
BM and blood samples
BM samples were harvested from washed filters used during BM graft processing for allogeneic transplantation after healthy donor informed consent according to approved institutional guidelines (Assistance Publique–Hôpitaux de Paris, Paris, France).
Blood samples were obtained from the Etablissement Français du Sang (EFS, Saint-Louis Hospital, Paris, France).
GBA activity measurement
GBA activity measurement was performed on mononuclear cells from blood samples isolated by Ficoll sedimentation (Eurobio) and on hematopoietic stem cells (HSCs) and MSCs isolated from BM.
GBA activity measurement was performed using a flow cytometric method. Cells were washed and cell suspension was incubated with PFB-FDGlu (5′-pentafluorobenzoylaminofluorescein-di-β-D-glucoside) at a final concentration of 1 mM (Invitrogen) for 1 h at 37°C. Cells incubated for 1 h at room temperature with 0.5 mM CBE, prior to the addition of PFB-FDGlu, were used as a negative control. Following incubation with substrate, cells were resuspended in PBS (Eurobio) and fluorescence was measured on the FL-1 emission channel. Results were expressed as an index defined as the ratio between median fluorescence intensity (MFI) of cells incubated with PFB-FDGlu alone and median fluorescence intensity of cells incubated with CBE and PFB-FDGlu.
GBA activity was measured in parallel by a standard method using 4-methylumbelliferyl glucopyranoside as substrate [14]. MSCs were incubated with increasing dose of CBE ranging from 2.5×10⁻⁴ to 2 mM. For correlation between standard method and flow cytometry, GBA activity was calculated as MFI of cells +/− increasing concentration of CBE/MFI untreated cells. Coefficient of determination was calculated with linear regression.
MSCs culture and characterization, GBA activity inhibition with CBE treatment
BM MSCs were isolated and expanded as previously described in minimum essential medium-α (Invitrogen), supplemented with 10% fetal bovine serum (HyClone0), glutamax-I (2 mM; Invitrogen), bFGF (1 ng/mL; R&D Systems0), and antibiotic/antimycotic (1%, Invitrogen) [15]. Monoclonal antibodies conjugated with either fluoresceine isothiocyanate or phycoerythrin and directed to CD34, CD45, CD73, CD90, CD13, CD29, CD105 or matched isotype control (all purchased from Becton Dickinson) were used for immunophenotyping. Data were acquired and analyzed on a 5-parameter flow cytometer (FACScalibur; Becton Dickinson) with CellQuestPro software (Becton Dickinson).
GBA activity inhibition was obtained by culturing the cells in the presence of a specific inhibitor, CBE, at a concentration of 0.5 mM. Cells received a new dose of 0.5 mM CBE at each media change and passages.
Western blot
Cells were lysed in RIPA buffer (Bio-Rad) containing protease inhibitor cocktail (Sigma Aldrich). Total protein concentration was determined using BCA kit (Thermo Fisher Scientific). Fifty micrograms of proteins were separated by SDS-PAGE followed by transfer to nitrocellulose membranes. Hybridizations were performed using rabbit polyclonal antibody against GBA (Abcam). Protein loading was controlled using GAPDH antibody (Abcam). Horseradish peroxidase conjugated secondary antibodies were used prior to detection with a chemiluminescent reagent (ECL; Thermo Fisher Scientific).
Colony-forming unit-fibroblast quantification
BM mononuclear cells were seeded in 6 well plates at 1, 2, and 4×10⁴ cells/cm2 in complete medium with or without CBE 0.5 mM. On day 14, colony-forming unit-fibroblasts (CFU-F) were fixed with methanol and stained with Giemsa. Colonies were quantified by microscopic examination.
Long-term proliferation assays
Cells were plated in triplicates in 6-well plates at the initial density of 5×10³ cells/cm2 with or without 0.5 mM CBE. At subconfluence, cells were trypsinized (Hyclone), harvested, and counted. Population doubling per passage was calculated as log(n f/n o)/log2, where n o is the initial and n f the final number of cells at each passage. Cumulative population doubling at each passage was calculated by adding population doubling per passage.
Apoptosis, viability, and senescence assay
MSCs apoptosis and viability were determined at passage 3–4 using Annexin V-7AAD kit (Beckman Coulter) following the manufacturer's instructions.
For senescence assay, MSCs at passage 3– 4 were washed, fixed, and incubated overnight at 37°C with X-gal chromogenic substrate at pH 6.0 following manufacturer's instructions (Ozyme). After staining, cells were analyzed on pictures of 5 randomly selected fields.
Cell cycle analysis
Cells cycle analysis was assessed on MSCs at passage 3–4. Cells were trypsinized, fixed with 70% ethanol and stored for at least 24 h at −20°C. After ethanol removal, cells were washed twice with PBS and were incubated with staining solution [1 mg/mL RNase A (Roche Applied Science) with 10 μg/mL propidium iodide (Sigma Aldrich) in PBS]. Cell cycle analysis was performed by flow cytometry, and proportion of cells in the G0/G1, S, and G2/M phase were calculated using Cell Quest Pro software (BD Biosciences).
Microtubules and nuclear fluorescent staining
For immunofluorescent staining, cells at passage 3–4 were grown on coverglass coated with fibronectin (1 mg/mL; Calbiochem). After adhesion, cells were fixed for 15 min in 4% paraformaldehyde, permeabilized for 3 min with 0.1% Triton in PBS and washed 3 times in PBS. Microtubules were labeled with rat anti-alpha tubulin antibodies (1/500, 30 min; Ab Serotec) revealed with goat anti-rat Cy3 (1/500, 45 min; Interchim). Hoechst (0.5 μg/mL) was used for nuclear staining. Slides were then mounted with Mowiol solution and observed using a Nikon fluorescence microscope. Nucleus size distribution was measured with the Image J software.
qRT-PCR
Total RNA was extracted (RNeasy mini kit; Qiagen) and cDNA was prepared with the High Capacity cDNA Reverse Transcription kit following the manufacturer's instructions (Applied Biosystems). HMBS hydroxymethylbilane synthase) was used to normalize expression data and the 2–ΔΔCT method was applied. Final results were expressed as the n-fold differences in target gene expression in CBE-treated samples compared with untreated samples considered as calibrator. PCR were performed with Taqman gene expression inventoried probes (Runx2: Hs00231692_m1, Osterix: Hs00541729_m1, HMBS: Hs00609297_m1) on 7900 real time PCR system (Applied Biosystems).
Osteogenic differentiation of MSCs
For osteogenic differentiation, 70%–80% confluent cultures at passage 4–5 were incubated in 6 wells micro-plates in osteogenic medium consisting of Dubelcco's modified Eagle's medium (Invitrogen) with 4.5 g/L glucose supplemented with 10% FBS, 10−7 M dexamethasone, 50 μg/mL ascorbic acid, and 3 mM inorganic phosphate (for alizarin red staining). The medium was replaced every 3–4 days for 14–21 days. Cells received a new dose of 0.5 mM CBE at each media change and passages.
Alkaline phosphatase (ALP) activity was determined by the colorimetric conversion of p-nitrophenol from p-nitrophenylphosphate and normalized to total protein (BCA). Cells were trypsinized and frozen in dry pellets. Dry pellets were lysed with buffer containing 10 mM Hepes, 150 mM NaCl, and 1% Triton (all from Sigma Aldrich). Cell debris were removed by centrifugation. Lysates were incubated with p-nitrophenol phosphate in an alkaline buffer for 30 min at 37°C (Alkaline Phosphatase substrate kit; Bio-Rad). The reaction was stopped by the addition of 0.4M NaOH and read at 405 nm (Thermo Fisher Scientific). ALP activity was determined by comparison with known p-nitrophenol concentrations ranging from 6.25 to 200 μM. Results were expressed as nmol p-nitrophenol/min/mg protein.
The mineralization process was evaluated by alizarin red staining. Cells were fixed with 4% paraformaldehyde and stained for 10 min with 40 mM alizarin red (pH=4.1; Sigma) in order to assess calcium accumulation.
Osteoclast culture and bone resorption quantification
PBMC were isolated by Ficoll gradient density and monocytes cells were purified using CD14 microbeads according to the manufacturer's protocol (Miltenyi Biotec). Monocytes were plated on BD Biocoat Osteologic MultiTest Slides (BD Biosciences) at 4, 6, and 8×10⁴ cells/well in minimum essential medium-α supplemented with 10% fetal bovine serum, 1% antibiotic/antimycotic, 100 ng/mL monocyte colony stimulating factor, 100 ng/mL receptor activator for nuclear factor κB ligand (RANKL), and 25 ng/mL tumor necrosis factor alpha with or without 0.5 mM CBE. Cells were fed twice weekly and at day 14, resorption pits were quantified using Von Kossa staining. Briefly, slides were fixed with 4% paraformaldehyde and stained with 5% silver nitrate solution (Sigma Aldrich) for 30 min. Staining development was performed with 5% thiosulfate sodium (Sigma Aldrich). Wells were photographed and analyzed as percentage of resorbed areas according to the Technical Bulletin No. 444 from BD Biosciences.
In studies examining the effect of conditioned media (CM) from untreated or CBE-treated MSCs, CM were harvested after 72 h and kept frozen until resorption assay. After CD14+ purification, 6×10⁴ monocytes were cultured with 2×osteoclastic medium supplemented with CM from untreated MSCs and CBE-treated MSCs (1:1, volume/volume). CM was added at each media change.
Tartrate-resistant acid phosphatase (TRAP5) activity was determined in supernatant obtained after culture of monocytes on Osteologic MultiTest Slides using a commercial kit from TecoMedical.
RANKL expression
Cells were fixed with 4% paraformaldehyde, permeabilized with 0.1% saponin, and incubated with the anti-RANKL rabbit antibody (1/500; Millipore) or the isotypic control (1/100; BD Biosciences) and with FITC-coupled goat-anti-rabbit secondary antibody. Cells were then incubated with the secondary antibody (goat anti-rabbit, 1/100) coupled to FITC and analyzed by flow cytometry. Results were expressed as the ratio of RANKL median fluorescence intensity (MFI) and isotype MFI.
Soluble factors production
MSCs supernatants obtained after culture in the presence or absence of CBE were used to quantitatively analyze Dickkopf-related protein-1 (DKK-1), stromal cell-derived factor-1 (SDF-1), osteopontin (OPN), osteoprotegerin (OPG), monocytes chemotactic protein-1 (MCP-1), IL-6, and IL-8 levels. Analyses were performed on MSCs at passage 3–4 and supernatants were harvested 72 h after trypsinisation. All testing were performed by enzyme-linked immunosorbent assay using commercially available kits (R&D Systems) according to the manufacturer's instructions. Quantitative analysis of PGE2 was performed using a competitive binding technique according to the manufacturer's protocol (R&D systems).
Statistical analysis
The Student's t-test for paired data was used to test the probability of significant differences between samples. A value of P<0.05 was used to define statistical significance.
Results
GBA activity measurement and model of in vitro GBA inhibition
As previously shown, GBA activity could be evaluated by flow cytometry [16,17]. This method was chosen to assess GBA activity in subpopulation isolated from blood and BM. Quantification of GBA activity was determined by calculating the ratio between MFI labeled cells and MFI labeled cells treated with CBE. GBA activity was found to be higher in MSCs and monocytes (32.3±11.4; 19.0±8.4, respectively) than in lymphocytes, granulocytes, and HSCs (3.6±0.8; 5.4±2.1; 5.4±2.9, respectively, Fig. 1A).

GBA activity measurement and model of in vitro glucocerebrosidase (GBA) inhibition.
In order to study the impact of GBA deficiency on BM microenvironment, we used an already described chemical model of GD induced by CBE, a specific inhibitor of GBA activity [11,18 –24]. To determine the optimal dose of CBE able to inhibit GBA activity, MSCs were incubated with increasing doses of CBE. GBA activity inhibition was found to be dose-dependent, the maximum of inhibition being reached with 0.5 mM (Fig. 1B). In this condition, GBA activity was reduced to 1% of untreated MSCs activity.
Biochemical diagnosis of GD is based on GBA activity measurement in peripheral blood leukocytes cell lysate using fluorometric assay. GBA activity of MSCs incubated with increasing dose of CBE (2.5×10⁻⁴–2 mM), measured by either flow cytometry or the standard method, showed a correlation coefficient of 0.81, thus confirming that flow cytometry is a reliable method to determine GBA activity (Fig. 1C).
CBE is a GBA inhibitor displaying structural similarity with GBA substrate and forming a covalent bond with an amino-acid chain at the active site of GBA [25]. We thus verified that CBE treatment had an effect only on GBA activity and not on GBA protein content. As shown in Fig. 1D, GBA protein level was similar in untreated and CBE-treated MSCs.
Isolation and expansion of MSCs cultured with or without CBE
MSCs progenitors were analyzed for their ability to form fibroblastic colonies (CFU-F) in culture in the presence or absence of CBE. CFU-F frequency did not differ between untreated (20.6±13.6) and CBE-treated cells (18.8±14.6) (P=1.00; Fig. 2A). However, mean cell number per CFU-F decreased in the presence of CBE (10,697±5,516 vs. 5,344±3,301, P=0.04).
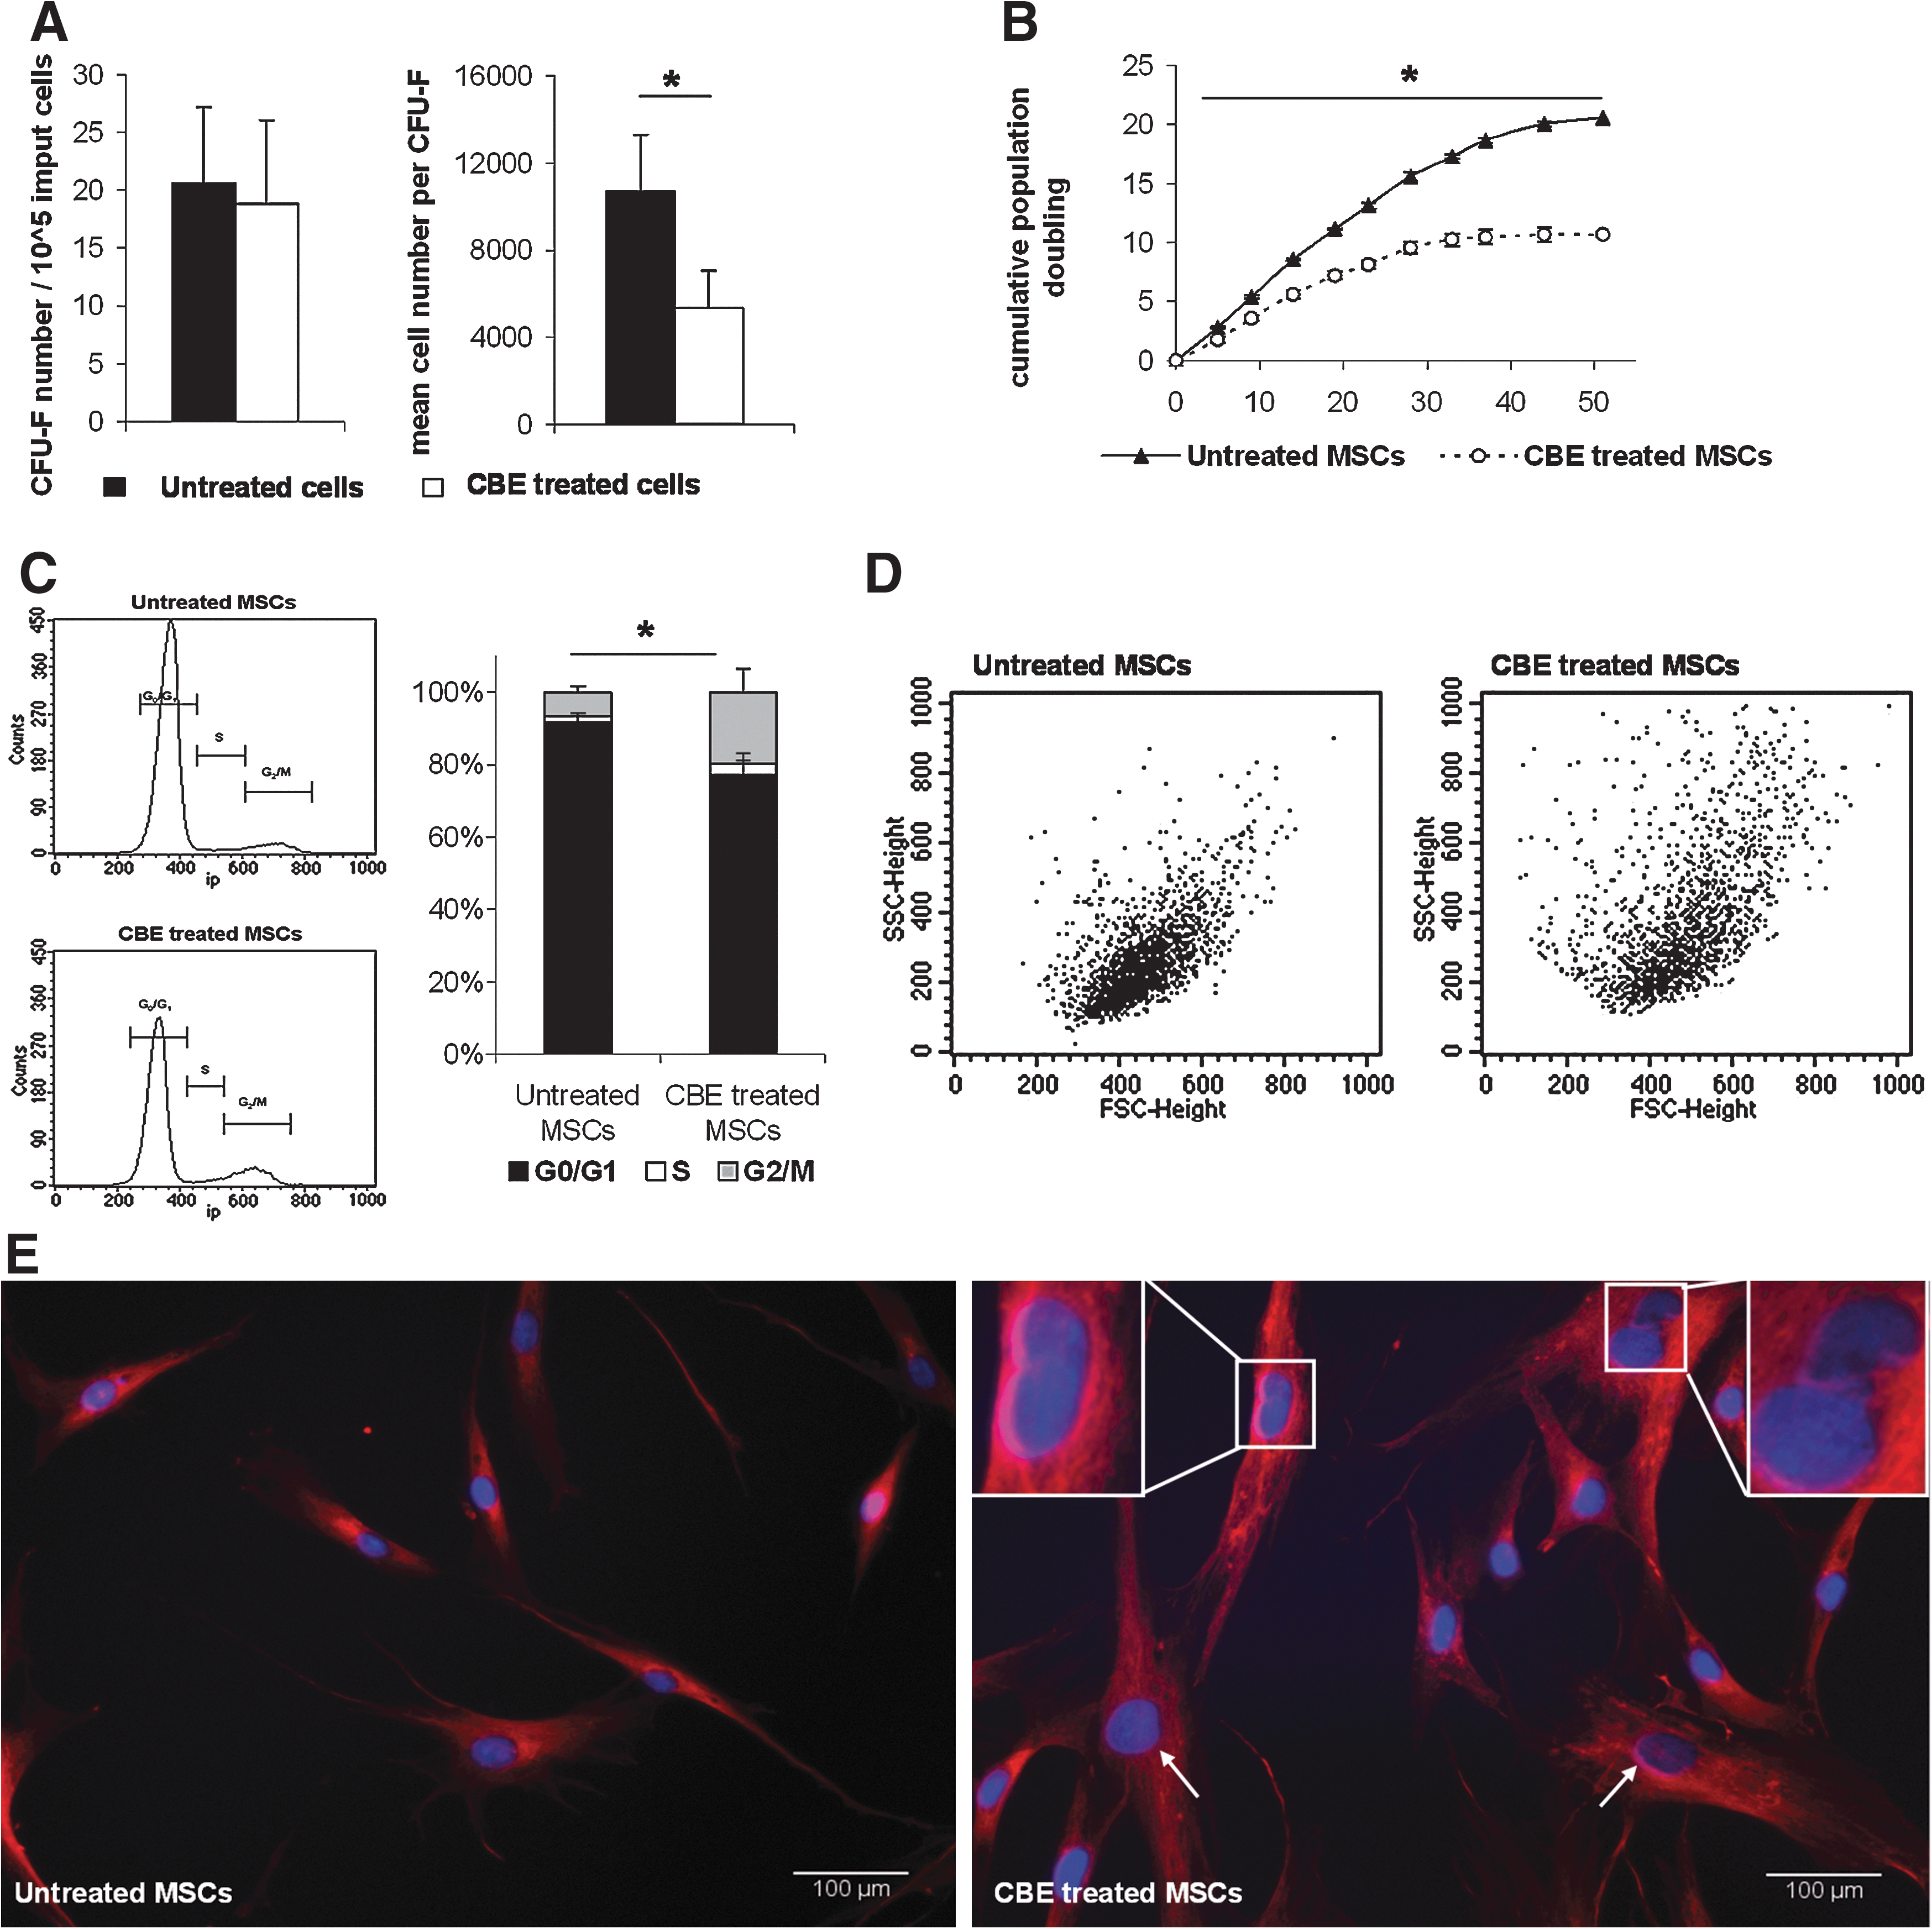
CBE effect on MSCs isolation and expansion.
The growth potential of MSCs treated or not with CBE was studied by evaluating the proliferative capacity over the time. In long-term culture, MSCs cultured with CBE displayed reduced expansion capacities compared with untreated MSCs (Fig. 2B). This difference was statistically significant from 5 days of culture and until the end of the assay [P=0.023 at day 5 (passage 1), P=0.002 at day 51 (passage 10)]. Impairment of MSCs proliferation was not related to an increased apoptosis/necrosis or senescence (data not shown).
To further investigate the role of CBE on abnormal MSCs expansion capacity, cell cycle analysis was performed on MSCs cultured in the presence or absence of CBE. As shown in Fig. 2C, the relative number of cells in G0/G1 significantly decreased in CBE-treated MSCs compared to untreated MSCs (76.1%±5.8% and 91.4%±1.8%, respectively, P=0.001) whereas G2/M-phase and S-phase increased (19.4%±6.4% and 6.4%±1.7% respectively, P=0.004; 3.1%±0.9% and 1.8%±0.7%, respectively P=0.004). These data indicate that abnormal cell proliferation in the presence of CBE was partly related to G2/M-phase cell cycle arrest.
MSCs morphology was altered by CBE treatment as shown by forward scatter/side scatter (FSC/SSC) profile in flow cytometry, showing increased proportion of cells with higher volume (FSC) and cytoplamic granularity (SSC) (Fig.2D). Immunofluorescent staining of cytoskeleton (microtubules) and nucleus (Hoechst) revealed the presence of 10% cells with an abnormal nuclear shape (nonround nuclei) among the CBE-treated MSCs whereas it was never observed in the untreated MSCs (Fig. 2E). Moreover, the nuclear size increased in the CBE-treated MSCs compared with untreated cells. Mean nucleus area was 175±49 μm2 for untreated MSCs and 263±93 μm2 for CBE-treated MSCs (P=0.003, n>150).
Despite these modifications, cell phenotype was not affected since MSCs were positive for CD29, CD44, CD73, CD90, and CD105 antigens and negative for CD31, CD45, and CD34 in all culture conditions (data not shown).
MSCs osteoblastic potential
Change in bone mass is the result of unbalance between bone formation by osteoblasts and bone resorption by osteoclasts. Because MSCs are known to be involved in bone mass regulation, we aimed to evaluate in vitro the potential impact of GBA inhibition on this tightly regulated process.
MSCs were grown in osteoblastic medium in the presence or absence of CBE and ALP activity was measured at D0 and after 14 days of differentiation. No statistical significant difference was observed in the 2 culture conditions at D0 or D14 (D0: 43±33 vs. 39±22 nmol/min/mg proteins respectively, P=0.74; D14: 312±155 vs. 276±142 nmol/min/mg proteins respectively, P=0.42).
Similarly, osteoblasts mineralization, assessed by calcium deposition was identical after 14 days of culture into osteogenic medium with or without CBE (Supplementary Fig. S1 Supplementary Data are available online at
In order to analyze osteoblastic differentiation at the mRNA level, the expression of Osterix and Runx2, 2 major transcription factors involved in MSCs differentiation along the osteoblastic lineage, were quantified. After 7 days of culture in the osteoblastic medium with or without CBE, and consistently with the data obtained at the functional level, no significant modification of Osterix and Runx2 expression were observed (Supplementary Fig. S1).
In all, inhibition of GBA activity by the chemical inhibitor CBE does not affect MSCs differentiation into osteoblasts, suggesting that bone impairment observed in GD is likely not the consequence of an intrinsic MSCs differentiation abnormality.
The OPG/RANKL/RANK system is a biological pathway that plays an essential role in the control of bone metabolism. In vivo, RANKL stimulate differentiation and activity of osteoclasts through binding with its receptor, RANK, expressed at the osteoclasts cell membrane. OPG is a soluble molecule that modulates RANKL activity by RANKL/RANK binding inhibition. RANKL and OPG are produced by stromal cells and osteoblasts [27].
In order to study the impact of GBA deficiency on OPG/RANKL balance, OPG and RANKL were measured in MSCs and MSC-derived osteoblasts.
CBE had no effect on OPG secretion by MSCs (D0) or MSC-derived osteoblasts (D14) compared to untreated cells (D0: 3,917±1,424 pg/mL/104 cells for untreated cells compared with 7,769±3,429 pg/mL/104 cells for CBE-treated cells, P=0.08; D14: 4,866±1,012 pg/mL/104 cells for untreated cells compared with 5,893±3,281 pg/mL/104 cells for CBE-treated cells, P=0.24).
In the same culture conditions, no significant modification in RANKL intracellular expression was observed. At D0, the relative expression of RANKL was of 9.7±2.5 for untreated cells and of 8.4±2.2 for CBE-treated cells (P=0.12) and at D14: of 2.4±0.4 for untreated cells and of 2.4±0.1 for CBE-treated cells (P=0.95).
Monocyte-derived osteoclasts resorption potential
Because bone mass regulation also depends on osteoclast-driven bone resorption, monocyte-derived osteoclasts function was evaluated in the presence or absence of CBE. Bone resorption areas were identified after 14 days of culture on calcium phosphate matrix. As expected, a correlation was observed between cell dose and percentage of resorbed areas (Fig. 3A). However, no significant difference was observed between untreated and treated cells. Because TRAP is a biochemical marker of osteoclast function, TRAP activity was also measured in the supernatant of monocytes cultured in differentiation media with or without CBE on calcium phosphate matrix. Consistent with bone resorption results, CBE treatment did not affect monocyte-derived osteoclasts TRAP activity (4.6 U/L±1.4 for untreated cells compared to 4.8 U/L±2.1 for CBE-treated cells; P=0.81, Fig. 3B).

Monocyte-derived osteoclasts resorption potential and MSCs secretome. Resorption activity of monocyte-derived osteoclasts cultured on biocoat bone matrix in osteoclastic media:
However, resorption areas increased when monocyte-derived osteoclasts were cultured in the presence of CBE-treated MSCs CM compared with CM from untreated MSCs (Fig. 3C). These data suggests that in vitro GBA deficiency, induced by treatment with CBE, does not lead to direct osteoclasts abnormalities and that osteoclasts activation observed in GD likely results from extrinsic stimulation.
Soluble factors expression
MSCs secrete soluble factors that regulate survival and function of surrounding cells. Recently, Campeau et al. reported that MSCs from 1 patient with type 1 GD had an altered inflammatory secretome [12]. We explored the impact of GBA impairment induced by CBE on MSCs cytokine secretion. Consistent with the data reported by Campeau et al., MSCs produced significantly more MCP-1 and IL-8 when cultured in the presence of CBE (240±164 pg/mL/104 cells and 120±46 pg/mL/104 cells respectively) compared with untreated MSCs (105±66 pg/mL/104 cells, P=0.04 and 44±18 pg/mL/104 cells, P=0.05 respectively, Fig. 3D). However, in our hands, while not reaching statistical significant, PGE2 levels tend to be increased after CBE treatment (98±49 pg/mL/104 cells for treated cells compared with 41±23 pg/mL/104 for untreated cells, P=0.06).
Moreover, increased levels of IL-6, DKK1 and SDF1 were also observed after GBA activity inhibition (360±184 pg/mL/104; 2,380±583 pg/mL/104; 91±29 pg/mL/104 cells) compared with untreated cells (193±110 pg/mL/104 cells, P=0.04; 1,233±512 pg/mL/104 cells, P=0.002; 66±21, P=0.05).
Discussion
MSCs are important components of BM niche that support HSCs maintenance through the secretion of soluble factors and cell-cell contact [28]. Moreover, MSCs have been shown to be precursors of several different cellular lineage including osteoblasts [10,29]. Since the pathophysiology of bone abnormalities observed in GD have not yet been elucidated, we hypothesized that GBA deficiency may induce modifications of MSCs properties. For this purpose, we studied cellular and molecular mechanisms governing the MSCs functional capacities in a model of GD induced by CBE, a specific inhibitor of GBA activity. GBA enzymatic activity is usually measured in peripheral blood leukocytes by the standard method using the 4-methylumbelliferyl-β-D-glucoside as a synthetic β-glucoside. Enzyme cleavage releases a fluorescent product, 4-methylumbelliferone, and the amount of fluorescence that develops per milligram protein per minute is measured [30]. The flow cytometric method adapted from Lorincz et al. and Rudensky et al. allowed us to measure GBA activity in subcellular fractions from blood and BM [16,17]. Interestingly, we found that MSCs expressed a high GBA activity, suggesting that MSCs may be involved in hematological and bone abnormalities observed in GD. GBA deficiency could be obtained in MSCs after CBE treatment, as previously shown in other cell types [11,18 –24]. Thus, CBE induced a GBA activity inhibition of at least 99% of the initial activity.
The first consequences of GBA deficiency was a dramatical impairment of MSCs proliferation. Mean cell number per CFU-F also decreased whereas CFU-F frequency was not modified. Inhibition of proliferative capacity was related to cell cycle modification with an arrest of progression in G2/M phase. GBA deficiency leads to GC catabolism impairment. Secondary increase in other lipids has been observed in macrophage model of GD induced with CBE and in fibroblasts from type 1 and 2 GD [24,31]. In globoid cell leukodystrophy, psychosine (Psy; galactosylsphingosine) was demonstrated to be an inhibitor of cytokinesis and induced multinuclear giant cells. Among lysosphingolipids, Psy and glucopsychosine (GlcPsy) potently induced the formation of multinuclear globoid-like cells. GlcPsy is accumulated in GD patients and may be involved in the mechanisms of proliferation impairment and G2/M arrest [32]. The presence of nuclei with abnormal shape and size in CBE-treated cells suggest that GBA deficiency induces lipid metabolism modification that also contribute to cytoplasmic volume and roughness increased. It has been proposed that nuclear shape can be affected by lipid synthesis and that cytoplasmic volume is related to nuclear size [33]. Taken together, these data suggest that GBA deficiency induced proliferation and cell shape abnormalities leading to cytokinesis defect. Moreover, lipids accumulation is not limited to lysosomal compartment and also affects lipid rafts composition [34]. Lipid rafts are distinct plasma membrane domains that contain cholesterol, phospholipids, and sphingolipids and regulates numerous cellular functions as cell proliferation, apoptosis, cell adhesion, signal transduction, and membrane trafficking.
Bone mass remodeling process is regulated by osteoblasts activity, forming a new matrix, and osteoclasts, resorbing bone. Mechanisms of bone mass abnormalities in GD are not well understood and may involve cells of bone microenvironment and soluble factors. An alteration of osteoblastic differentiation contributes to the pathogenesis of diseases such as multiple myeloma (MM) or osteoporosis [35,36]. Increased knowledge of the signaling pathways involved in the regulation of osteoblasts formation and differentiation from MSCs have provided a better understanding of the pathophysiological mechanisms involved in these diseases. Indeed, some studies showed that MM patients with bone lesions displayed reduced levels of bone formation markers, such as ALP and osteocalcin, and increased bone resorption markers [37]. Our study demonstrated that GBA-deficient MSCs and control MSCs had similar osteogenic potential, and that CBE-treated-osteoclasts derived from monocytes shared the same potential than untreated osteoclasts to resorbe mineral matrix and secrete TRAP. In addition the RANK/RANKL/OPG signaling pathway was not modified as suggested by OPG quantification and RANKL expression on MSCs and osteoblasts derived from MSCs. These data suggest that GBA deficiency in an in vitro chemical model does not alter the differentiation potential of MSCs or monocytes. However, osteoclasts activation observed in GD more likely results from extrinsic stimulation by MSCs, as suggested by the data obtained on osteoclasts treated with MSCs CM.
Many studies have been performed to measure soluble factors in GD in order to explain the pathophysiology of the disease and to develop markers correlating with disease severity. These factors included both pro- and anti-inflammatory cytokines and growth factors involved in bone metabolism or hematopoiesis [4 –7,9,38 –45]. Levels of many of these factors are disturbed in GD but inconsistent results have been reported because of heterogeneity of patients' disease evolution and treatment. Not all these factors are secreted by Gauchers' macrophages [12,46]. In our study, we found increased levels of IL-6, DKK-1, MCP-1, IL-8, and SDF-1 in GBA-deficient MSCs. MCP-1 induces osteoclasts formation and IL-8 stimulates osteoclastogenesis and bone resorption [47,48]. IL-6 induces osteoclasts formation and is also a proliferative factor of plasma cells in MM [49,50]. In MM, IL-6 is produced by BM microenvironment, including MSCs [15]. DKK-1 is an inhibitor of canonical Wnt pathway. In MM, levels of DKK-1 correlate with bone lesions [51]. Elevated levels of SDF-1 in peripheral blood are associated with osteolysis in MM patients and up-regulates bone resorption in rheumatoid arthritis patients [52,53]. Even though we did not observe an impairment in MSCs osteogenic potential, the increased levels of cytokines produced by MSCs may contribute to the modification of bone resorption activity and osteoclasts formation in GD. Furthermore, these cytokines may play a central role in the development of hematological abnormalities in GD or may favor the occurrence of gammapathies, frequently associated with GD.
Recently, Mistry et al. described a new mouse model of type 1 GD, obtained by conditional deletion of GBA1 gene [13]. The GBA-deficient mice displayed hepatosplenomegaly and hematologic disease associated with osteonecrosis and osteopenia, the most debilitating skeletal complications observed in human GD. BM stromal cells were isolated from GBA-deficient mice. Similar to our observations in human MSCs treated with CBE, proliferation of stromal cells from GBA-deficient mice was altered as compared to cells from wild-type mice. On a functional point of view, osteoblastic differentiation capacities of stromal cells isolated from GBA-deficient mice were reduced as compared with cells from wild-type mice. In another GBA-deficient mouse model, Enquist et al. described a mice phenotype mainly involving the hematopoietic organs [54]. Interestingly, the authors showed that both BM transplantation and transplantation of gene corrected BM cells were effective in the treatment of the disease. Taken together, these results shed light on the potential role of BM stem cells abnormalities in the occurrence of hematological and bone defect in GD.
The findings we presented here reinforce the hypothesis that pathophysiology of GD is in part the result of intrinsic abnormalities of cells in the BM stem cells niche that likely create an environment prone to the emergence of hematological and skeletal manifestations.
Footnotes
Acknowledgments
We thank Gabrielle Couchy, Jessica Zucman-Rossi, Boris Gaillard, Lydie Lecourt, and Guillaume Le Goff for technical assistance. S.L. was sponsored as a doctoral student by Genzyme SAS.
Author Disclosure Statement
The authors declare that they have no competing financial interest.
References
Supplementary Material
Please find the following supplemental material available below.
For Open Access articles published under a Creative Commons License, all supplemental material carries the same license as the article it is associated with.
For non-Open Access articles published, all supplemental material carries a non-exclusive license, and permission requests for re-use of supplemental material or any part of supplemental material shall be sent directly to the copyright owner as specified in the copyright notice associated with the article.