
Abstract
Mesenchymal stromal cells (MSC) with distinct differentiation properties have been reported in many adult [eg, bone marrow (BM)] or fetal tissues [eg, cord blood (CB); umbilical cord (UC)] and are defined by their specific surface antigen expression and multipotent differentiation potential. The MSC identity of these cells should be validated by applying well-defined readout systems if a clinical application is considered. In order to determine whether cells isolated from human UC fulfill the criteria defined for MSC, the immunophenotype and differentiation potential including gene expression analysis of the most relevant lineage-specific markers were analyzed in the presented report in combination with the HOX-gene expression. Cells from the UC do not differentiate into osteoblasts demonstrated by Alizarin Red and Von Kossa staining in addition to real-time polymerase chain reaction (PCR)-analysis of runt-related transcription factor 2, bone sialoprotein, osteocalcin, osterix, bone morphogenetic proteins 2 and 4. Oil Red O staining as well as PCR analysis of peroxisome proliferator-activated receptor-gamma, fatty acid-binding protein 4, and perilipin revealed an absent adipogenic differentiation. The lack of potential to differentiate into chondrocytes was documented by Alcian-Blue periodic acid-Schiff, Safranin O staining, and real-time PCR analysis of SOX9. Furthermore, neither endothelial nor myogenic differentiation was documented after induction of UC-MSC. In comparison to CB- and BM-derived cells, UC cells revealed an absent trilineage differentiation capacity in vitro. Therefore, these cells should not be termed “mesenchymal stromal cells.” The UC cells can be distinguished from CB- and BM-derived cells as well as from pericytes and foreskin fibroblasts by the expression of HOX-genes and the cell surface antigens CD56 and CD146.
Introduction
T
The UC consists of 2 arteries and one vein that are embedded in a jelly-like connective tissue, called “Wharton's Jelly”. During the last years, many protocols to isolate MSC from the umbilical cord (UC-MSC) with [16 –19] or without [20 –22] enzymatic treatment were published. To prove the identity of the isolated cells as MSC with the potential to give rise to cells of skeletal tissues including osteoblasts, chondroblasts, or adipocytes, in vitro differentiation assays were performed [17,23]. In general, the readout was accomplished using conventional staining [Von Kossa, Oil Red O, Alcian blue periodic acid-Schiff (PAS) etc.], whereas the expression profile of lineage-specific genes was not determined in the majority of the publications. Some previous studies reported a restricted differentiation potential of so-called UC-MSC concerning in vitro [20,24] and in vivo [16] assays. Sudo et al. evaluated the in vitro differentiation capacity of a cell population from the UC. Compared with cells derived from other tissues, the UC-cells revealed a lower degree of differentiation into adipo- and chondrocytes and failed to differentiate into osteogenic cells [24]. The study recently published by Capelli et al. also reported a lower in vitro-capacity of UC-MSC to differentiate toward bone, adipocytes, and chondrocytes compared with BM-MSC [20]. Kaltz and co-workers documented the marginal positive osteogenic and adipogenic in vitro differentiation potential of umbilical vein-derived stromal cells, whereas the cells did not form heterotopic ossicles when transplanted in the subcutaneous tissue of immunocompromised mice [16]. Following the definition just mentioned, the analyzed cells from the UC do not comply with the criteria of MSC [25].
In this study here, UC-MSC were compared with CB- and BM-derived stromal cells and to foreskin fibroblasts regarding their immunophenotype, HOX-gene expression, and differentiation potential, including gene expression analysis of the most relevant lineage markers. It was shown by our group that unrestricted somatic stromal cells (USSC) from cord blood and CB-MSC can be distinguished by their in vitro adipogenic differentiation potential, which inversely correlates with the expression of DLK-1 [15]. USSC highly express DLK-1 and fail to differentiate into adipocytes, while CB-MSC are characterized by a strong adipogenic differentiation potential and a weak or absent expression of DLK-1 [15]. Furthermore, in contrast to CB-MSC and BM-MSC, USSC do not express HOX-genes [26], which encode transcription factors determining the positional identity along the anterior/posterior axis of the developing animal embryo [27].
Here, we demonstrate that cells isolated from the human UC fail to differentiate into adipocytes, osteoblasts, and chondrocytes and, therefore, do not fulfill the criteria for MSC just explained. Based on the expression of HOX-genes, CD56 and CD146 UC-MSC differ from USSC, CB-MSC, BM-MSC, and foreskin fibroblasts. It is interesting to note that UC-MSC are positive for CD146 and CD56, a phenotype they share with skeletal muscle cells; however, no skeletal features of these cells were detected.
Materials and Methods
Isolation and expansion
The ethical approval to isolate the different cell types was obtained from the ethical review board of the Medical Faculty, University of Duesseldorf (UC-MSC: study #3436, USSC/CB-MSC: #2975, BM-MSC: #3240).
In pilot work, different protocols to isolate UC-MSC [22,28,29] were compared (as described in Results section). The results presented in this study were obtained using the following UC-MSC isolation procedure: Human UCs were obtained from the Department of Obstetrics and Gynecology, Heinrich Heine University Duesseldorf, with informed consent of the mothers and maintained at 4°C, the isolation procedure was accomplished within 24 h. Both the UC as well as the umbilical vein were rinsed with phosphate-buffered saline (PBS); Supplementary Fig. S1; Supplementary Data are available online at
Isolation of USSC and CB-MSC was performed according to the protocol previously reported by our group [14,15]. Human CB was collected from the UC vein with informed consent of the mothers. The mononuclear cell fraction (MNC) was obtained by ficoll gradient separation (Biochrom AG) followed by ammonium chloride lysis of red blood cells. 5-7×10⁶ MNC/mL were cultured in Dulbecco's modified Eagle medium (DMEM) low glucose (Lonza) with 30% FCS (Hyclone), 10−7 M dexamethasone (Sigma-Aldrich) and PSG. If colonies could be detected, the cells were expanded in the same medium without dexamethasone. To discriminate USSC from CB-MSC, the adipogenic differentiation potential as well as the DLK-1 expression was determined [15].
BM-MSC were isolated using BM aspirated from the iliac crest of healthy unrelated donors as previously described [30]. Briefly, MNC were isolated and plated in DMEM low glucose with 30% FCS and PSG until adherent colonies appeared.
Human foreskin fibroblasts and skin fibroblasts were provided by the Department of Dermatology, Heinrich Heine University Duesseldorf. Human umbilical vein endothelial cells (HUVEC) were provided by the Department of Cardiovascular Physiology, Heinrich Heine University Duesseldorf. Endothelial colony-forming cells (ECFC) from CB were isolated as described by Yoder et al. [31].
All cell types were cultured at 37°C in a humidified atmosphere with 5% CO2 until reaching 80% confluence. USSC, CB-MSC, and fibroblasts were detached with 0.25% trypsin, while UC-MSC and BM-MSC were detached with 0.25% trypsin/EDTA (Lonza). To evaluate the cumulative population doublings (CPD), the following formula was applied:
PD=[log (n1/n0)]/log2
CPD=Σ PD (n1=number harvested cells; n0=number plated cells).
In vitro differentiation
Differentiation toward the adipogenic or osteogenic lineage was performed in passages 2 and 5. Chondrogenic, myogenic, and endothelial differentiation was performed in passage 5 or 6.
For induction of adipogenic differentiation, cells were plated at 8.3×10³ cells/cm2 in 6-well plates until reaching 70% confluence. Adipogenic differentiation media were changed twice a week for 21 days, alternating induction and cultivation medium. The former consisted of DMEM high glucose (Lonza) supplemented with 10% FCS, PSG, 10−6 M dexamethasone, 0.2 mM indomethacine, 0.1 mg/mL insulin, and 1 mM 3-isobutylmethylxanthine (all Sigma-Aldrich); the latter was made up of DMEM high glucose, 10% FCS, and 0.01 mg/mL insulin. As a negative control, the cells were cultured in DMEM low glucose, 10% FCS and PSG. The differentiated cells were fixed with formaldehyde (4%, −20°C, 2 min) and stained with Oil Red O (Sigma-Aldrich) to visualize lipid vacuoles. Images were analyzed using the ImageJ Java-based image processing software for windows. The colored areas were measured, and the values of negative images were subtracted from positive ones to eliminate the background staining.
For induction of osteogenic differentiation, cells were plated at 8.3×10³ cells/cm2 in 6-well plates. When reaching 70% confluence, the osteogenic differentiation medium containing DMEM low glucose supplemented with 30% FCS, PSG, 10−7 M dexamethasone, 50 μg/mL ascorbic acid 2-phosphate, and 10 mM beta-glycerolphosphate (all Sigma-Aldrich) was added. As a negative control, the cells were cultured in DMEM low glucose, 10% FCS and PSG. Osteogenic differentiation was performed for 14 days, the medium was changed twice a week. To detect mineralization, the differentiated cells were fixed with cold ethanol (70%, 10 min) and stained with Alizarin Red S- (Sigma-Aldrich) and silver nitrate (5%, Roth) (“Von Kossa”) according to standard protocols.
To induce chondrogenesis, aliquots of 2×10⁵ cells were centrifuged at 150 g for 7 min in 15 mL polypropylene conical tubes. The pelleted cells were incubated for 21 days in DMEM high glucose supplemented with PS, 100 nM dexamethasone, 35 μg/mL ascorbic acid-2-phosphate, 1 mM sodium pyruvate (all Sigma-Aldrich), Insulin-Transferrin-Selenium (1/100 dilution) (Gibco, Invitrogen), and 10 ng/mL TGF beta1 (MACS; Miltenyi Biotec). The media were changed thrice a week. Area and diameter of the pellets were measured at day 7, 14, and 21 using the AVISO CellCelector™ analySIS image software. For each time point, 13 pellets were measured, and the arithmetic mean and standard deviation were calculated. For Alcian Blue PAS (Sigma-Aldrich) and Safranin O/Fast Green (Waldeck) staining following standard protocols, the pellets were embedded in Tissue Freezing Medium (Jung, Leica) and cut into sections of 6 μm using a cryotom.
To evaluate the myogenic differentiation capacity, 2 differentiation protocols were compared. Cells were plated at 8.3×10³ cells/cm2 in 6-well plates. When 70% confluence was reached, the myogenic differentiation medium containing 5% horse serum (Sigma-Aldrich), 0.1 μM dexamethasone, and 50 μM hydrocortisone (Sigma-Aldrich) (“HDH,” as described in [17,32]) or C2C12 (mouse muscle myoblast cell line; Sigma-Aldrich)-conditioned medium (DMEM low glucose with 10% FCS and PSG) with 50% DMEM low glucose with 2% horse serum and PSG (“50/50”) was added. To avoid contamination of the C2C12-conditioned medium with C2C12 cells, the medium was centrifuged and passed through a 0.2 μM syringe filter before use. The media were changed twice a week. Myogenic differentiation was performed for 30 days and confirmed by reverse transcription–polymerase chain reaction (RT-PCR) and western-blot analysis of myogenic marker genes. C2C12 cells served as a positive control.
Endothelial differentiation was performed on collagen-coated cell culture plates using endothelial growth medium (EGM2; PromoCell) containing 2% FCS, 5 ng/mL epidermal growth factor, 10 ng/mL basic fibroblast growth factor, 20 ng/mL insulin-like growth factor, 0.5 ng/mL vascular endothelial growth factor, 1 μg/mL ascorbic acid, 22.5 μg/mL heparin, and 0.2 μg/mL hydrocortisone. The cultures were split when 80% confluence was reached. The differentiation was performed for 30 days and confirmed by flow cytometric analyses. HUVEC served as a positive control.
RT-PCR and real-time-PCR
Total RNA of differentiated and control cells was isolated using Tri Reagent (Sigma-Aldrich) according to the manufacturer's instructions followed by DNA digestion with DNase I (Invitrogen). Chondrogenic pellets were incubated at 37°C in pronase E (Merck) for 1 h followed by incubation in collagenase P (Roche) for 24 h before RNA isolation. Human normal adult skeletal muscle total RNA (Biochain) was used as a positive control for the detection of myogenic marker genes. RT was performed with SuperScriptIII (Invitrogen) according to the supplier's protocol. Complementary DNA that approximated 50 ng of RNA was used for subsequent RT-PCR analysis in a total volume of 25 μL at the following conditions: 2 min 94°C; 30 s 94°C, 30 s 56°C/60°C/65°C, 30 s 72°C (35 cycles), and 10 min 72°C. The primer sequences with the corresponding annealing temperatures are listed in Supplementary Table S1. Human ribosomal protein L13a (RPL13a) was used as reference gene for normalization. PCR products were separated by agarose gel electrophoresis and visualized by ethidium bromide staining. To quantify the gene expression, real- time PCRs using Power SYBR Green PCR Mastermix (Applied Biosystems) were performed. For SOX9, a TaqMan® Gene Expression Assay in combination with the TaqMan 2× Universal PCR Master Mix No Amp Erase® UNG (all Applied Biosystems) was used. All reactions were run in duplicates on an ABI Step One Plus Detection System. Relative changes in gene expression were calculated following the ΔΔCt method.
Western blot
Total protein was isolated using RIPA-lysis buffer (Sigma-Aldrich). Western blot was performed utilizing the NuPAGE® System (Invitrogen) with 4%–12% Bis-Tris gels. Proteins were transferred to nitrocellulose membranes, unspecific binding sites were blocked with 5% bovine serum albumin in PBS/0.1%Tween 20 (PBST). The primary and secondary antibodies are listed in Supplementary Table S2. Proteins were detected applying Western lightning™ ECL (PerkinElmer).
Flow cytometry
Flow cytometric analyses were performed employing an FACSCanto flow cytometer with FACSDiva software (both BD Biosciences). The antibodies are listed in Supplementary Table S2.
Statistical analysis
Data are presented as arithmetic means with a standard deviation of at least 3 different cell lines (real-time PCR of osteogenic genes, Oil Red O quantification, and expression of SOX9) or 13 pellets per time point per cell line respectively (chondrogenic pellet area). Paired (real-time PCR of osteogenic genes, expression of SOX9) or unpaired (chondrogenic pellet area) t-tests were conducted with GraphPad Prism Version 5.01. P values lower than 0.05 were considered significant (*P=0.01 to 0.05; **P=0.001 to 0.01; ***P<0.001).
Results
Morphology, growth kinetics, and immunophenotype
To isolate MSC from UC, different protocols with [28,29] or without enzymatic dissociation processes [22] were compared. UC-MSC isolated applying these protocols revealed the same results with regard to the generation efficiency as well as the differentiation and growth potential (Supplementary Fig. S2: Differentiation analysis of UC-MSC, generated as described in [29]). Therefore, we decided to use a rapid and simple protocol without enzymatic treatment (as described in materials and methods). The UC-MSC resembled a fibroblastic, spindle-shaped morphology comparable to that of USSC, CB-MSC, and BM-MSC (Supplementary Fig. S3A).
UC-MSC as well as USSC and CB-MSC were highly proliferative (up to passage 22), whereas the growth potential of BM-MSC was slightly lower (Supplementary Fig. S3B, C, mean CPD in P9: UC-MSC: 43.05±0.19; USSC: 45.12±1.43; CB-MSC: 43.21±1.43; BM-MSC: 37.2±2.11). UC-MSC could be expanded for up to 1.5×10⁹ cells within 3 passages (data not shown).
The expression of characteristic cell surface markers on foreskin fibroblasts, UC-MSC (n=12), USSC, CB-MSC, and BM-MSC was investigated using flow-cytometric analysis (Fig. 1A, B). All cell populations tested were negative for CD31, CD45, CD184, CD326, Cytokeratin, and HLA-DR and positive for CD71, CD73, CD90, CD105, and HLA-ABC. Therefore, the UC-MSC cell population neither contain CD31+ endothelial nor CD326+/Cytokeratin+ epithelial cells.
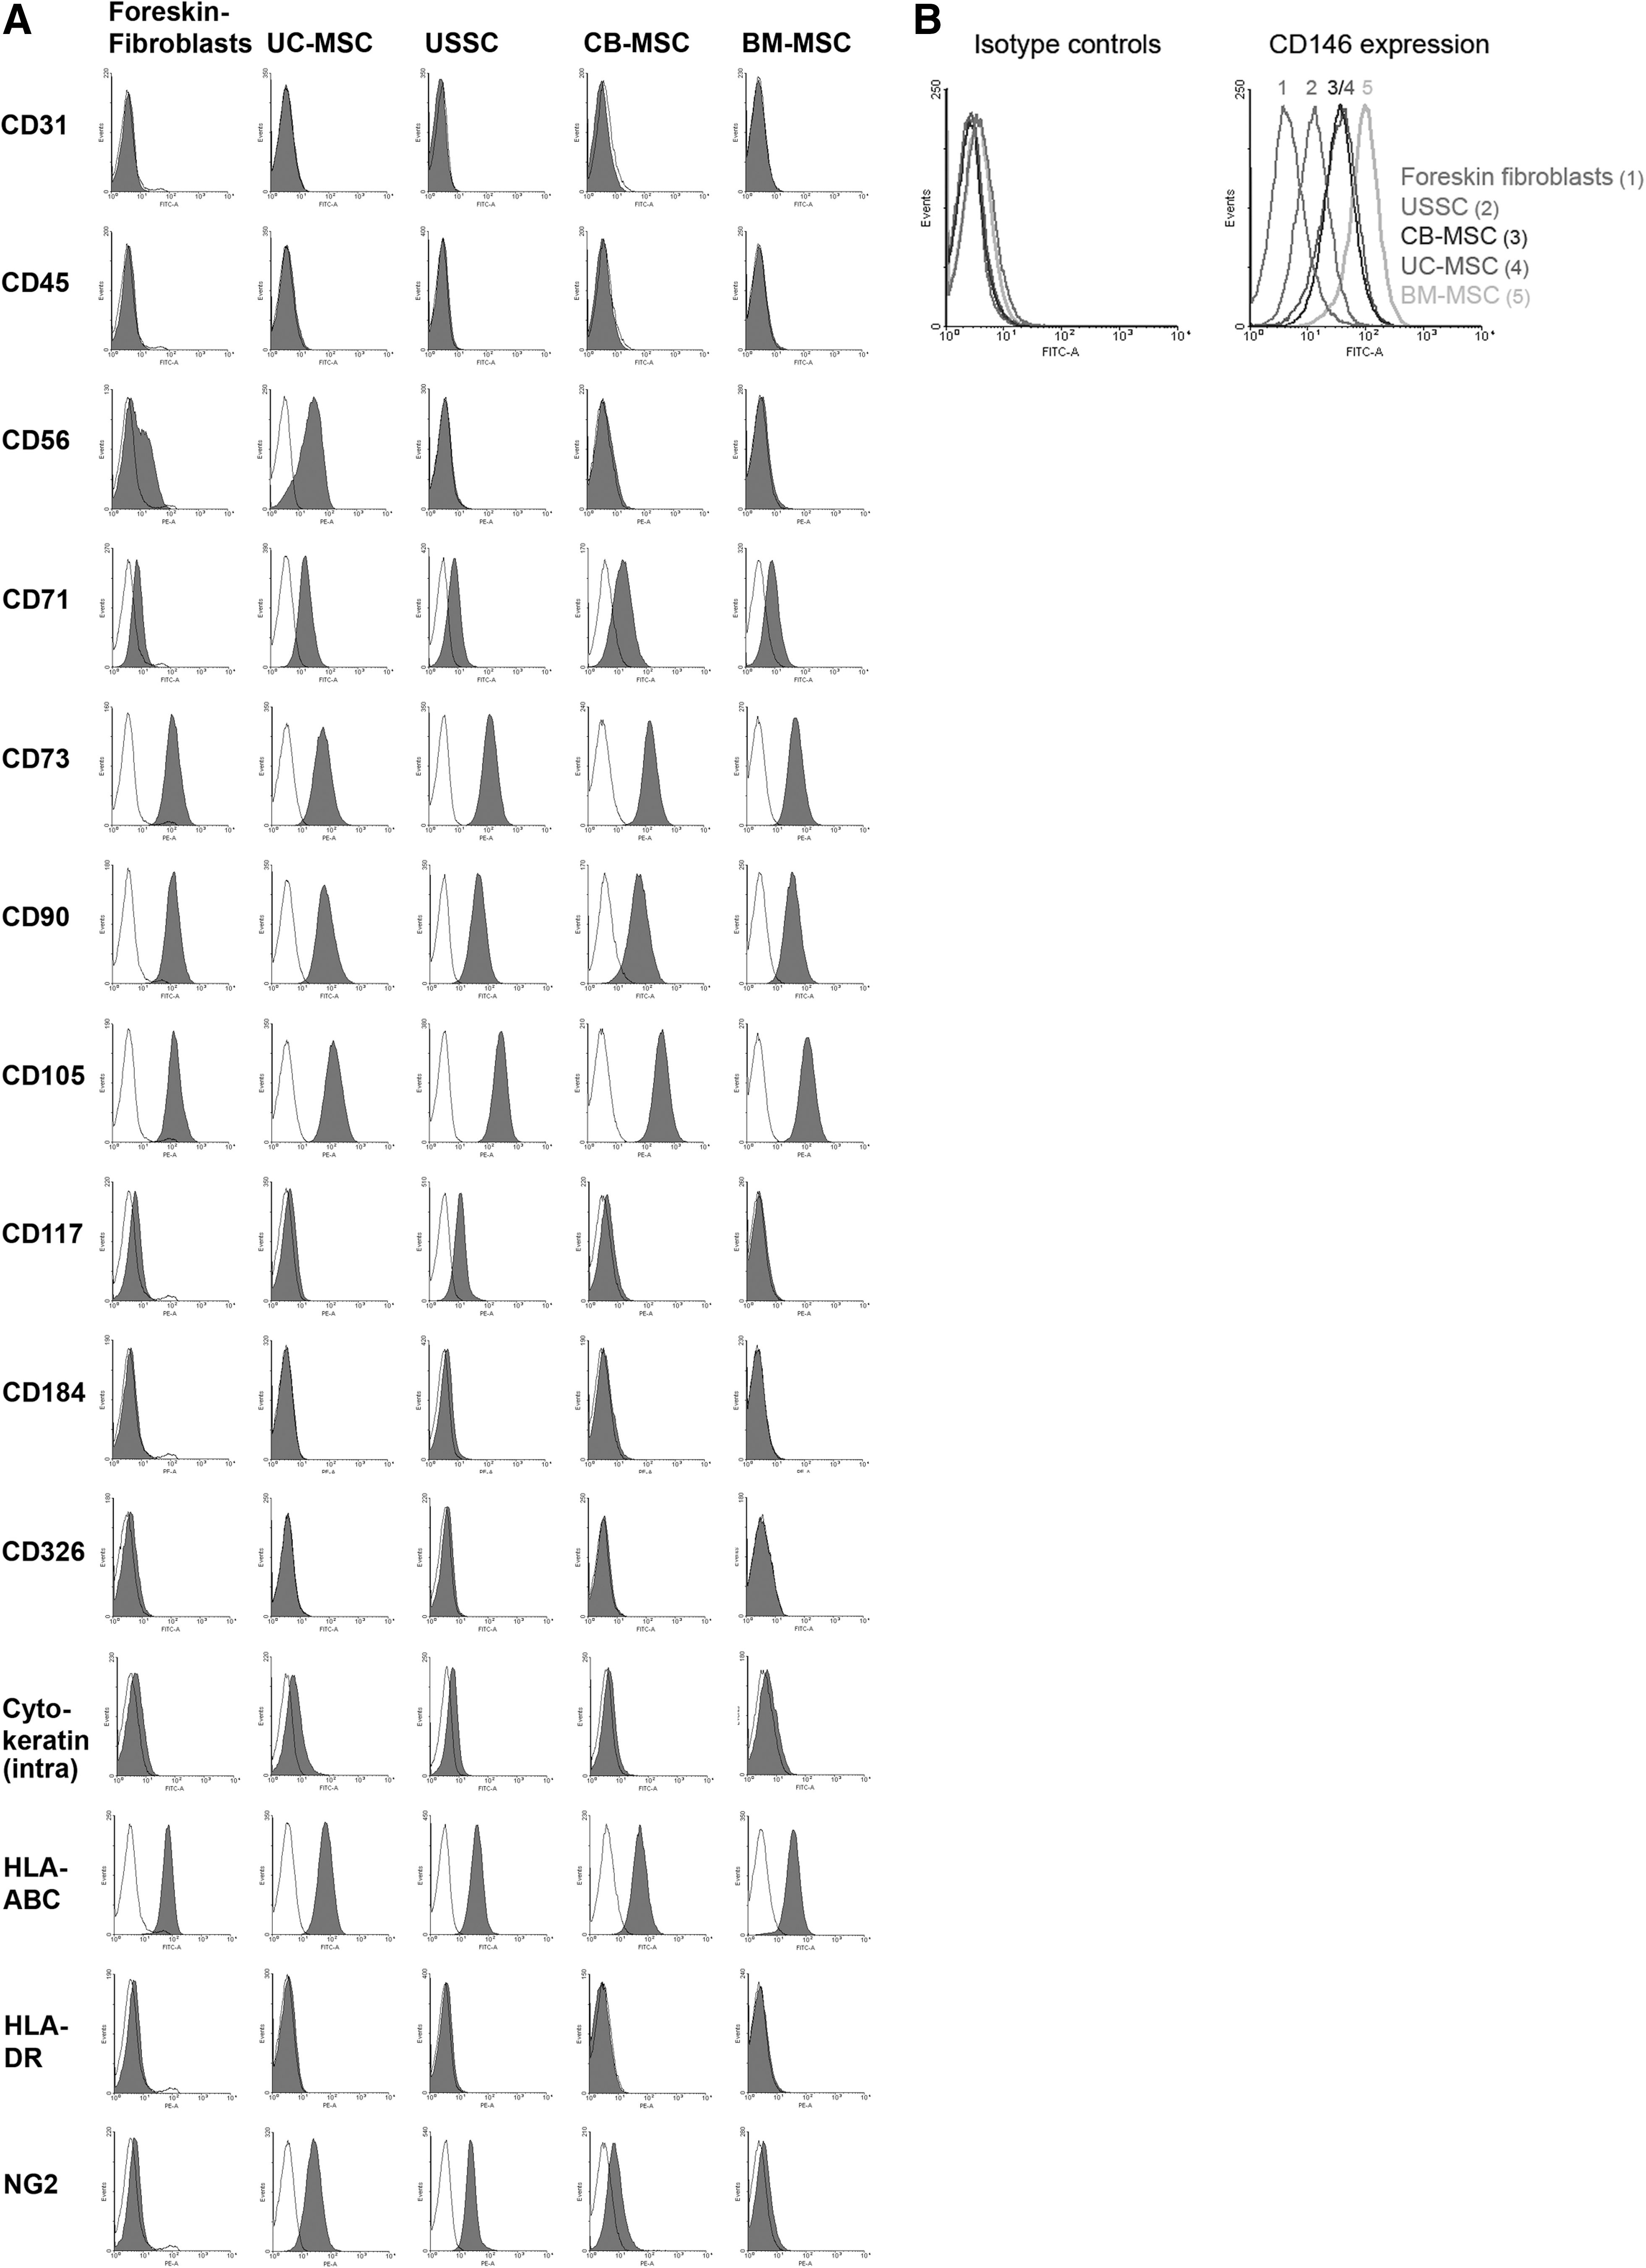
Immunophenotype.
CD117 revealed a weak expression, only USSC exhibited a stronger signal. Foreskin fibroblasts, CB-MSC, and BM-MSC were slightly positive for NG2, while UC-MSC and USSC were clearly positive.
The expression of CD146 (melanoma cell adhesion molecule) varied between the cell populations: Foreskin fibroblasts were negative, USSC exhibited a weak, while UC-MSC and CB-MSC showed a stronger expression. BM-MSC exhibited the strongest signal (Fig. 1B). Thus, the expression of CD146 permits the discrimination of UC-MSC and foreskin fibroblasts.
Another putative cell surface marker that distinguishes UC-MSC from foreskin fibroblasts as well as from CB- (USSC, CB-MSC) and BM-derived cells is CD56 (neural cell adhesion molecule 1). UC-MSC showed a strong expression, while foreskin fibroblasts were only slightly positive. USSC, CB-MSC, and BM-MSC were negative for CD56.
Multilineage differentiation potential
Osteogenic differentiation
Foreskin fibroblasts, UC-MSC (n=19), USSC (n=5), CB-MSC (n=3), and BM-MSC (n=3) were differentiated toward the osteogenic lineage. UC-MSC were tested in passages 2 and 5 with consistent results. Likewise, UC-MSC derived from whole UCs and cell populations derived from single UC-pieces revealed congruent results with regard to their multilineage differentiation potential.
Standard staining methods (Alizarin Red S, Von Kossa) were applied, and the expression of osteogenic markers was evaluated to confirm the differentiation. We focused on the expression of runt-related transcription factor 2 (RUNX2), osterix (OSX), bone sialoprotein (BSP), osteocalcin (OC), and the bone morphogenetic proteins 2 and 4 (BMP2 and BMP4). Due to the variability of cell lines, the expression levels of the genes tested varied, but showed the same tendency. To point out the gene expression at d14 in comparison with d0, the gene expression related to the housekeeping gene is depicted in Fig. 2B. The expression values (mean±SD) with the corresponding P values after paired t-tests are listed in the Supplementary Table S3.
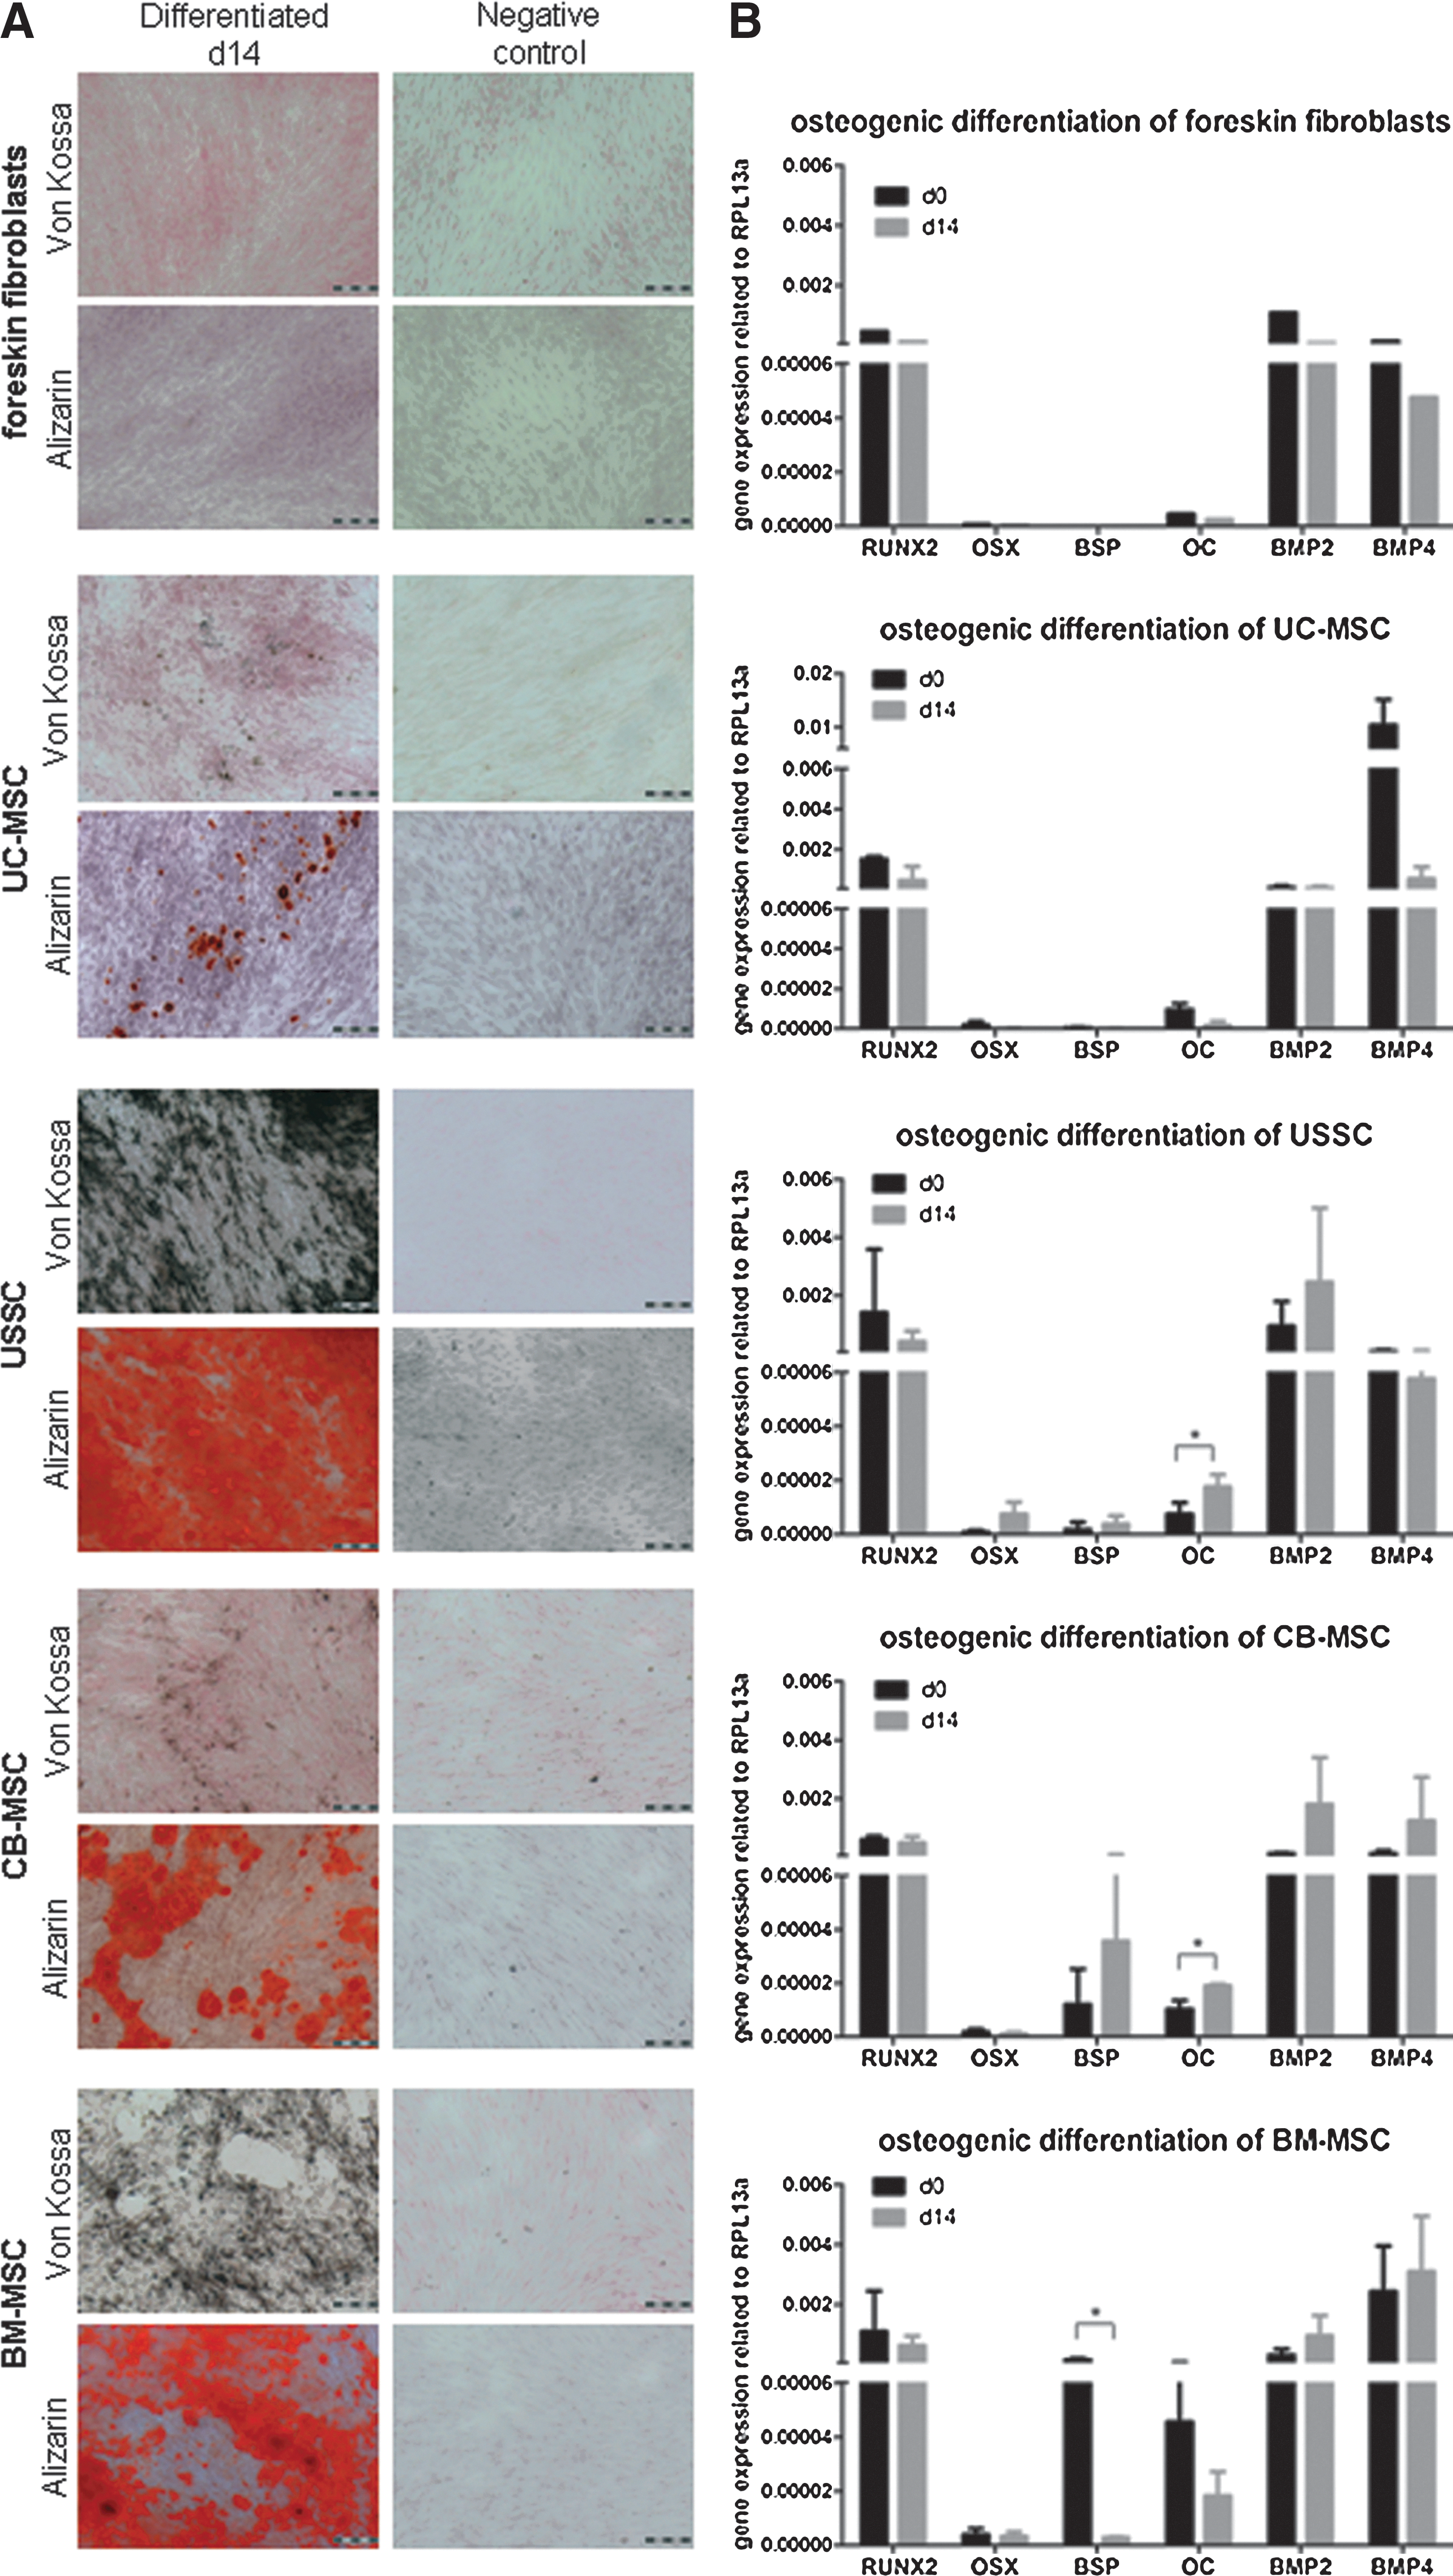
Osteogenic differentiation.
The in vitro-assays revealed a similarity between UC-MSC and foreskin fibroblasts concerning the lack of differentiation. After osteogenic induction, an absent or marginal mineralization was detected by Alizarin Red S- and Von Kossa-staining (Fig. 2A) correlating with an absent upregulation of osteogenic markers demonstrated by real-time PCR (Fig. 2B and Supplementary Table S3). During differentiation, RUNX2 was downregulated in foreskin fibroblasts as well as in UC-MSC. In both cell types, OSX as well as BSP were nearly undetectable before and after osteogenic differentiation and OC, BMP2, and BMP4 revealed a minor expression after differentiation (Fig. 2B and Supplementary Table S3). The failed in vitro-differentiation of UC-MSC was confirmed in vivo by the group of Paolo Bianco (La Sapienza University Rome, data not shown, personal communication).
USSC, CB-MSC, and BM-MSC were more efficient in differentiating toward the osteogenic lineage. The broadly mineralized areas were visualized, and the differentiation was confirmed via real-time-PCR analysis, which revealed an upregulation or high native expression level of several osteogenic genes (Fig. 2). Due to the high basal expression level of RUNX2, a decrease after osteogenic differentiation was detected in all 3 cell populations (Fig. 2B and Supplementary Table S3). In USSC, OSX was upregulated after osteogenic differentiation, whereas no considerably stronger expression was detected in CB-MSC and BM-MSC. USSC showed a marginal and CB-MSC, a stronger upregulation of BSP after differentiation. BM-MSC revealed a high expression level of BSP in an undifferentiated state, which decreased during differentiation. After differentiation, a significant stronger expression of OC in USSC and CB-MSC was demonstrated, while BM-MSC revealed the strongest expression level in the native state. BMP2 exhibited a stronger expression after differentiation in all cell populations. This also applies to BMP4, except for USSC whose BMP4-expression level marginally decreased.
Adipogenic differentiation
Oil Red O-staining revealed no adipocyte-like cells in UC-MSC (n=19), foreskin fibroblast, or USSC cultures, no adipogenic marker genes [peroxisome proliferator-activated receptor-gamma (PPARg); fatty acid-binding protein 4 (FABP4); perilipin (PLIN)] were detected after differentiation (Fig. 3). In CB-MSC and BM-MSC, lipid vacuoles were stained with Oil Red O, and the expression of PPARg, FABP4, and PLIN was shown (Fig. 3). After Oil Red O-staining, areas of lipid vacuoles were quantified in foreskin fibroblasts (0.1%), UC-MSC (0.02%±0.27%), USSC (0.24%±0.33%), CB-MSC (8.11%±5.84%), and BM-MSC (6.54%±2.03%) (Fig. 3B; UC-MSC, USSC, CB-MSC and BM-MSC: each n=3 cell lines).
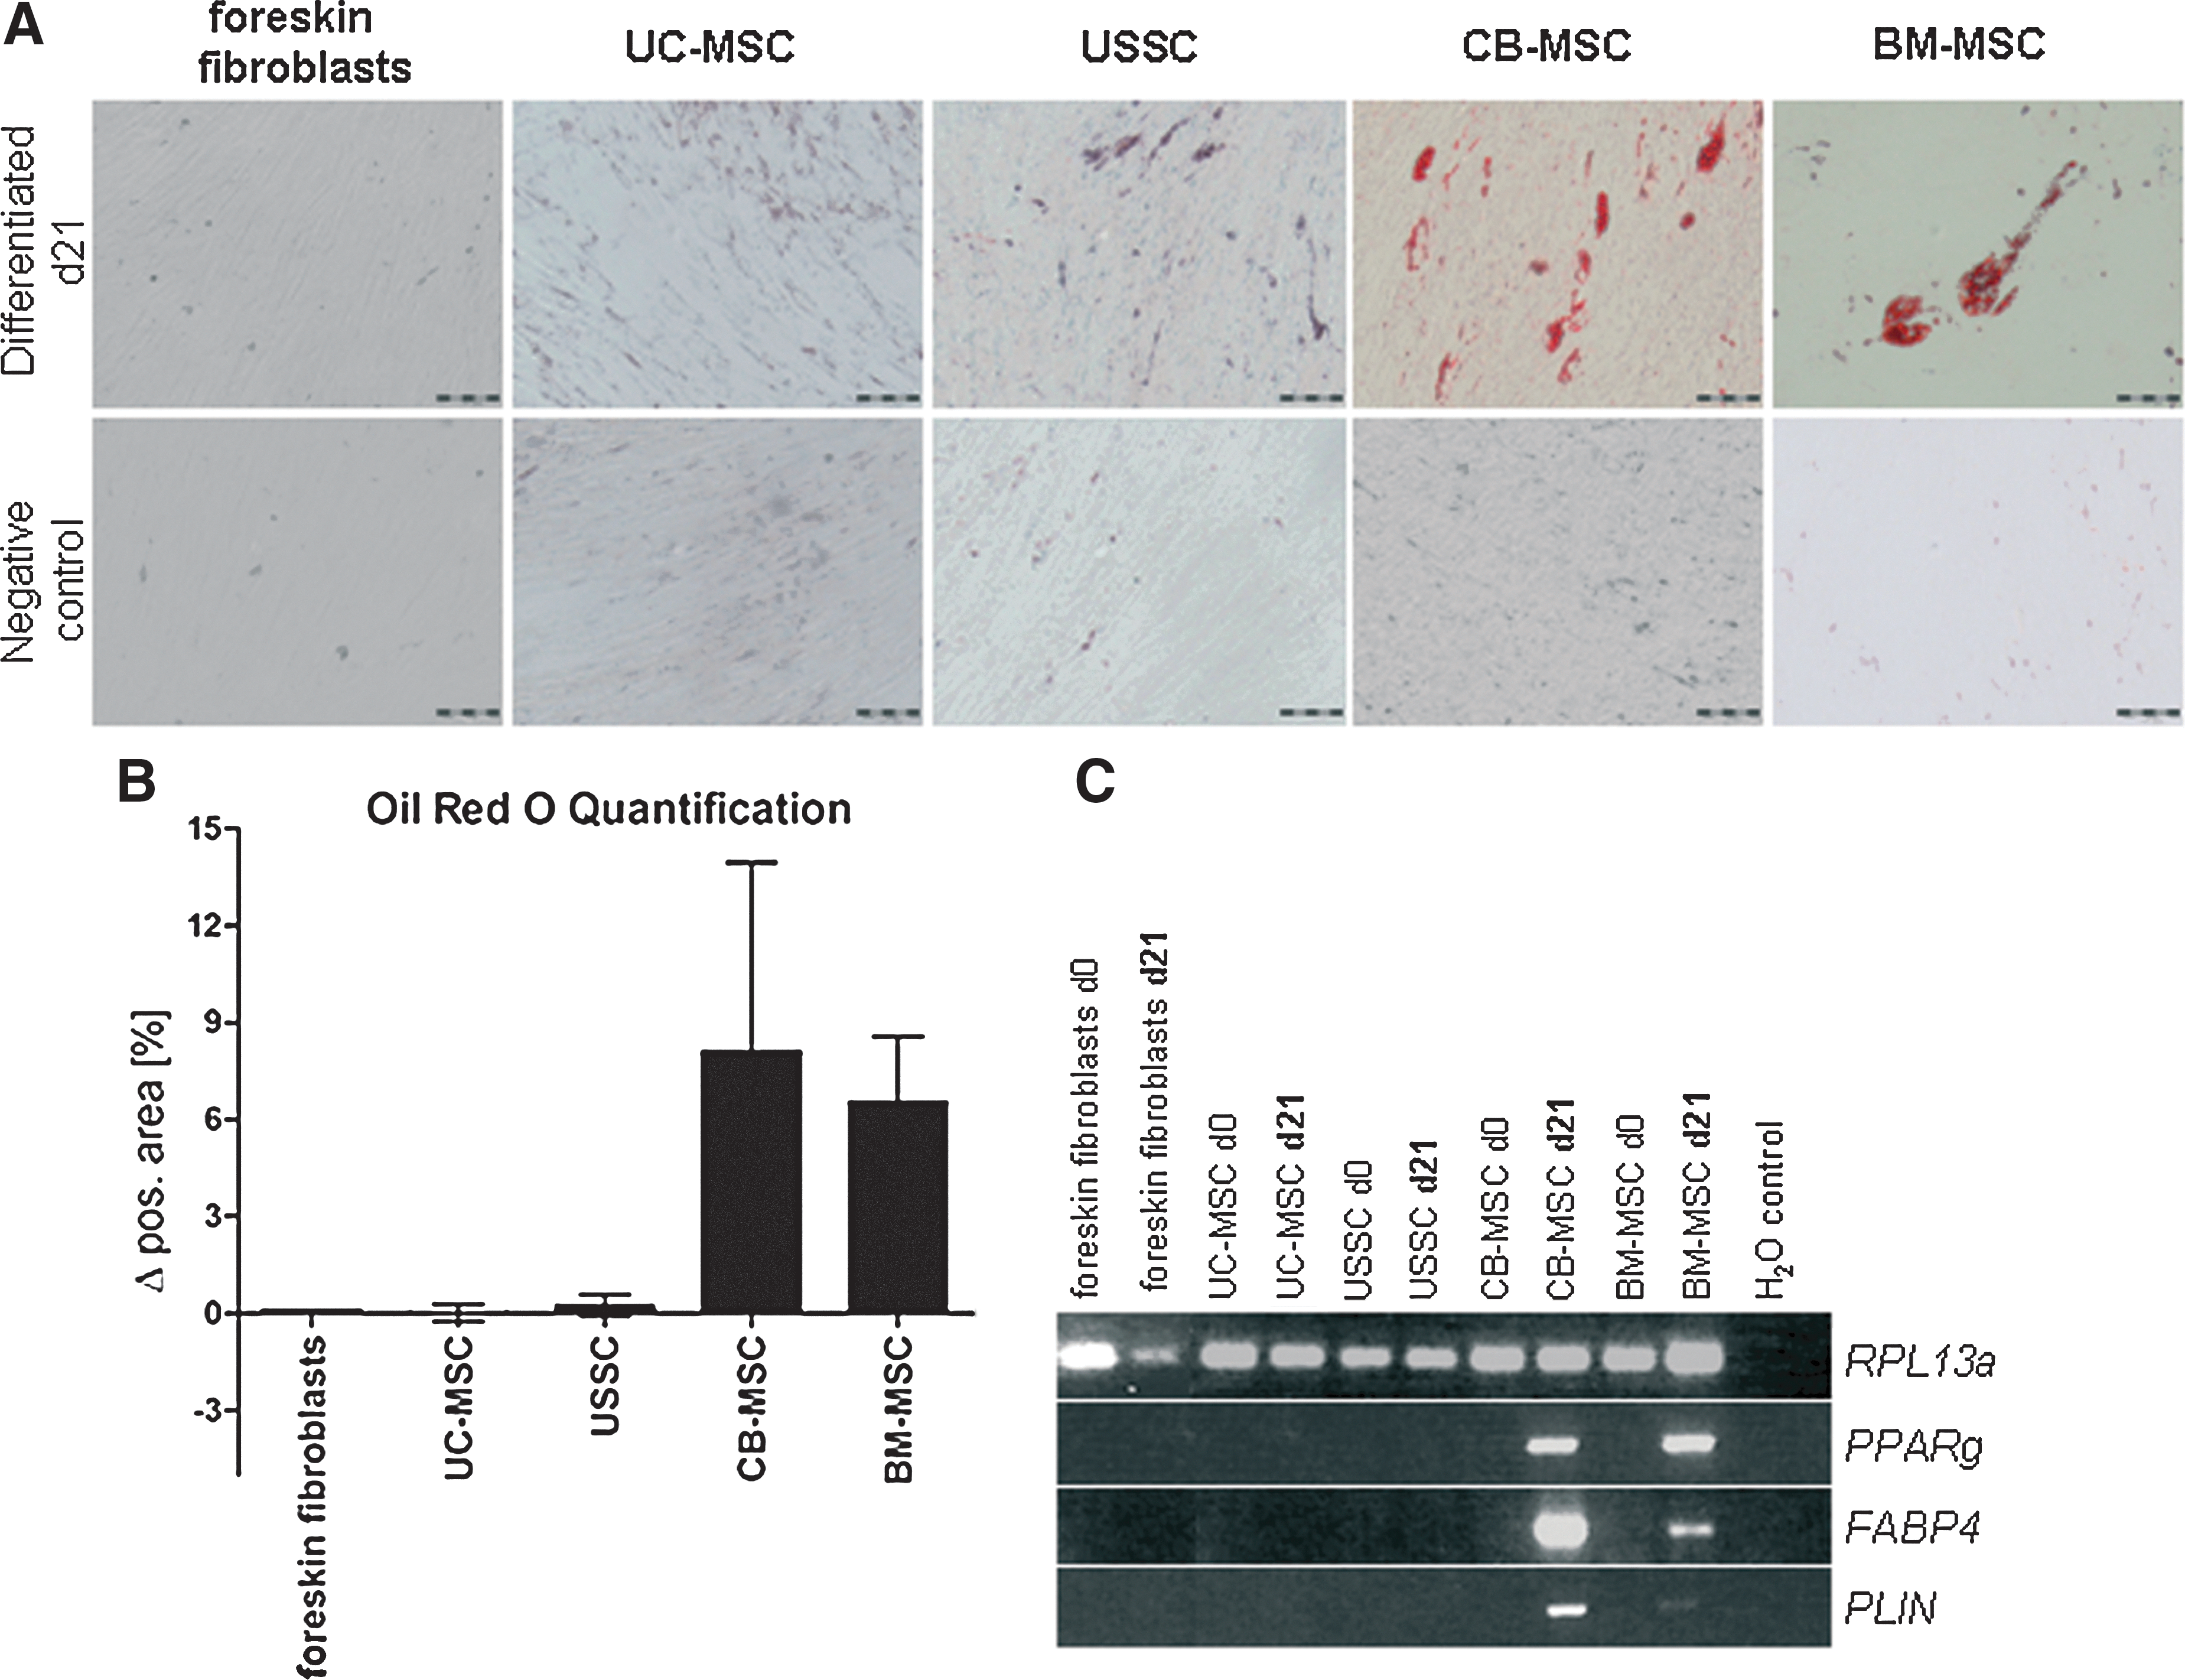
Adipogenic differentiation.
Chondrogenic differentiation
All cell types tested (foreskin fibroblasts, UC-MSC, USSC, CB-MSC, and BM-MSC) formed pellets, which stayed stable in the pellet culture for 21 days. The pellets of UC-MSC (n=4) and foreskin fibroblasts (n=2) exhibited a less condensed structure (Fig. 4C), which correlated with a statistically significant increasing pellet area during differentiation (Fig. 4A, mean±SD, n=13 pellets per time point: foreskin fibroblasts d7: 5.57×10⁵±5.25×104 μm2, d21: 8.57×10⁵±8.27×104 μm2, P<0.0001; UC-MSC d7: 5.33×10⁵±3.51×104 μm2, d21: 5.92×10⁵±4.34×104 μm2; P=0.0008). Furthermore, no proteoglycans were stained with Safranin O after 21 days in chondrogenic differentiation medium (Fig. 4C). No upregulation of the chondrogenic marker gene SRY-Box 9 (SOX9) in differentiated compared with undifferentiated cells was detected in foreskin fibroblasts (Fig. 4B: d0: 0.000046, d21: 0.000015) and UC-MSC (Fig. 4B, mean±SD, n=3 cell lines: d0: 0.000079±0.000093, absent at d21; P=0.2763).
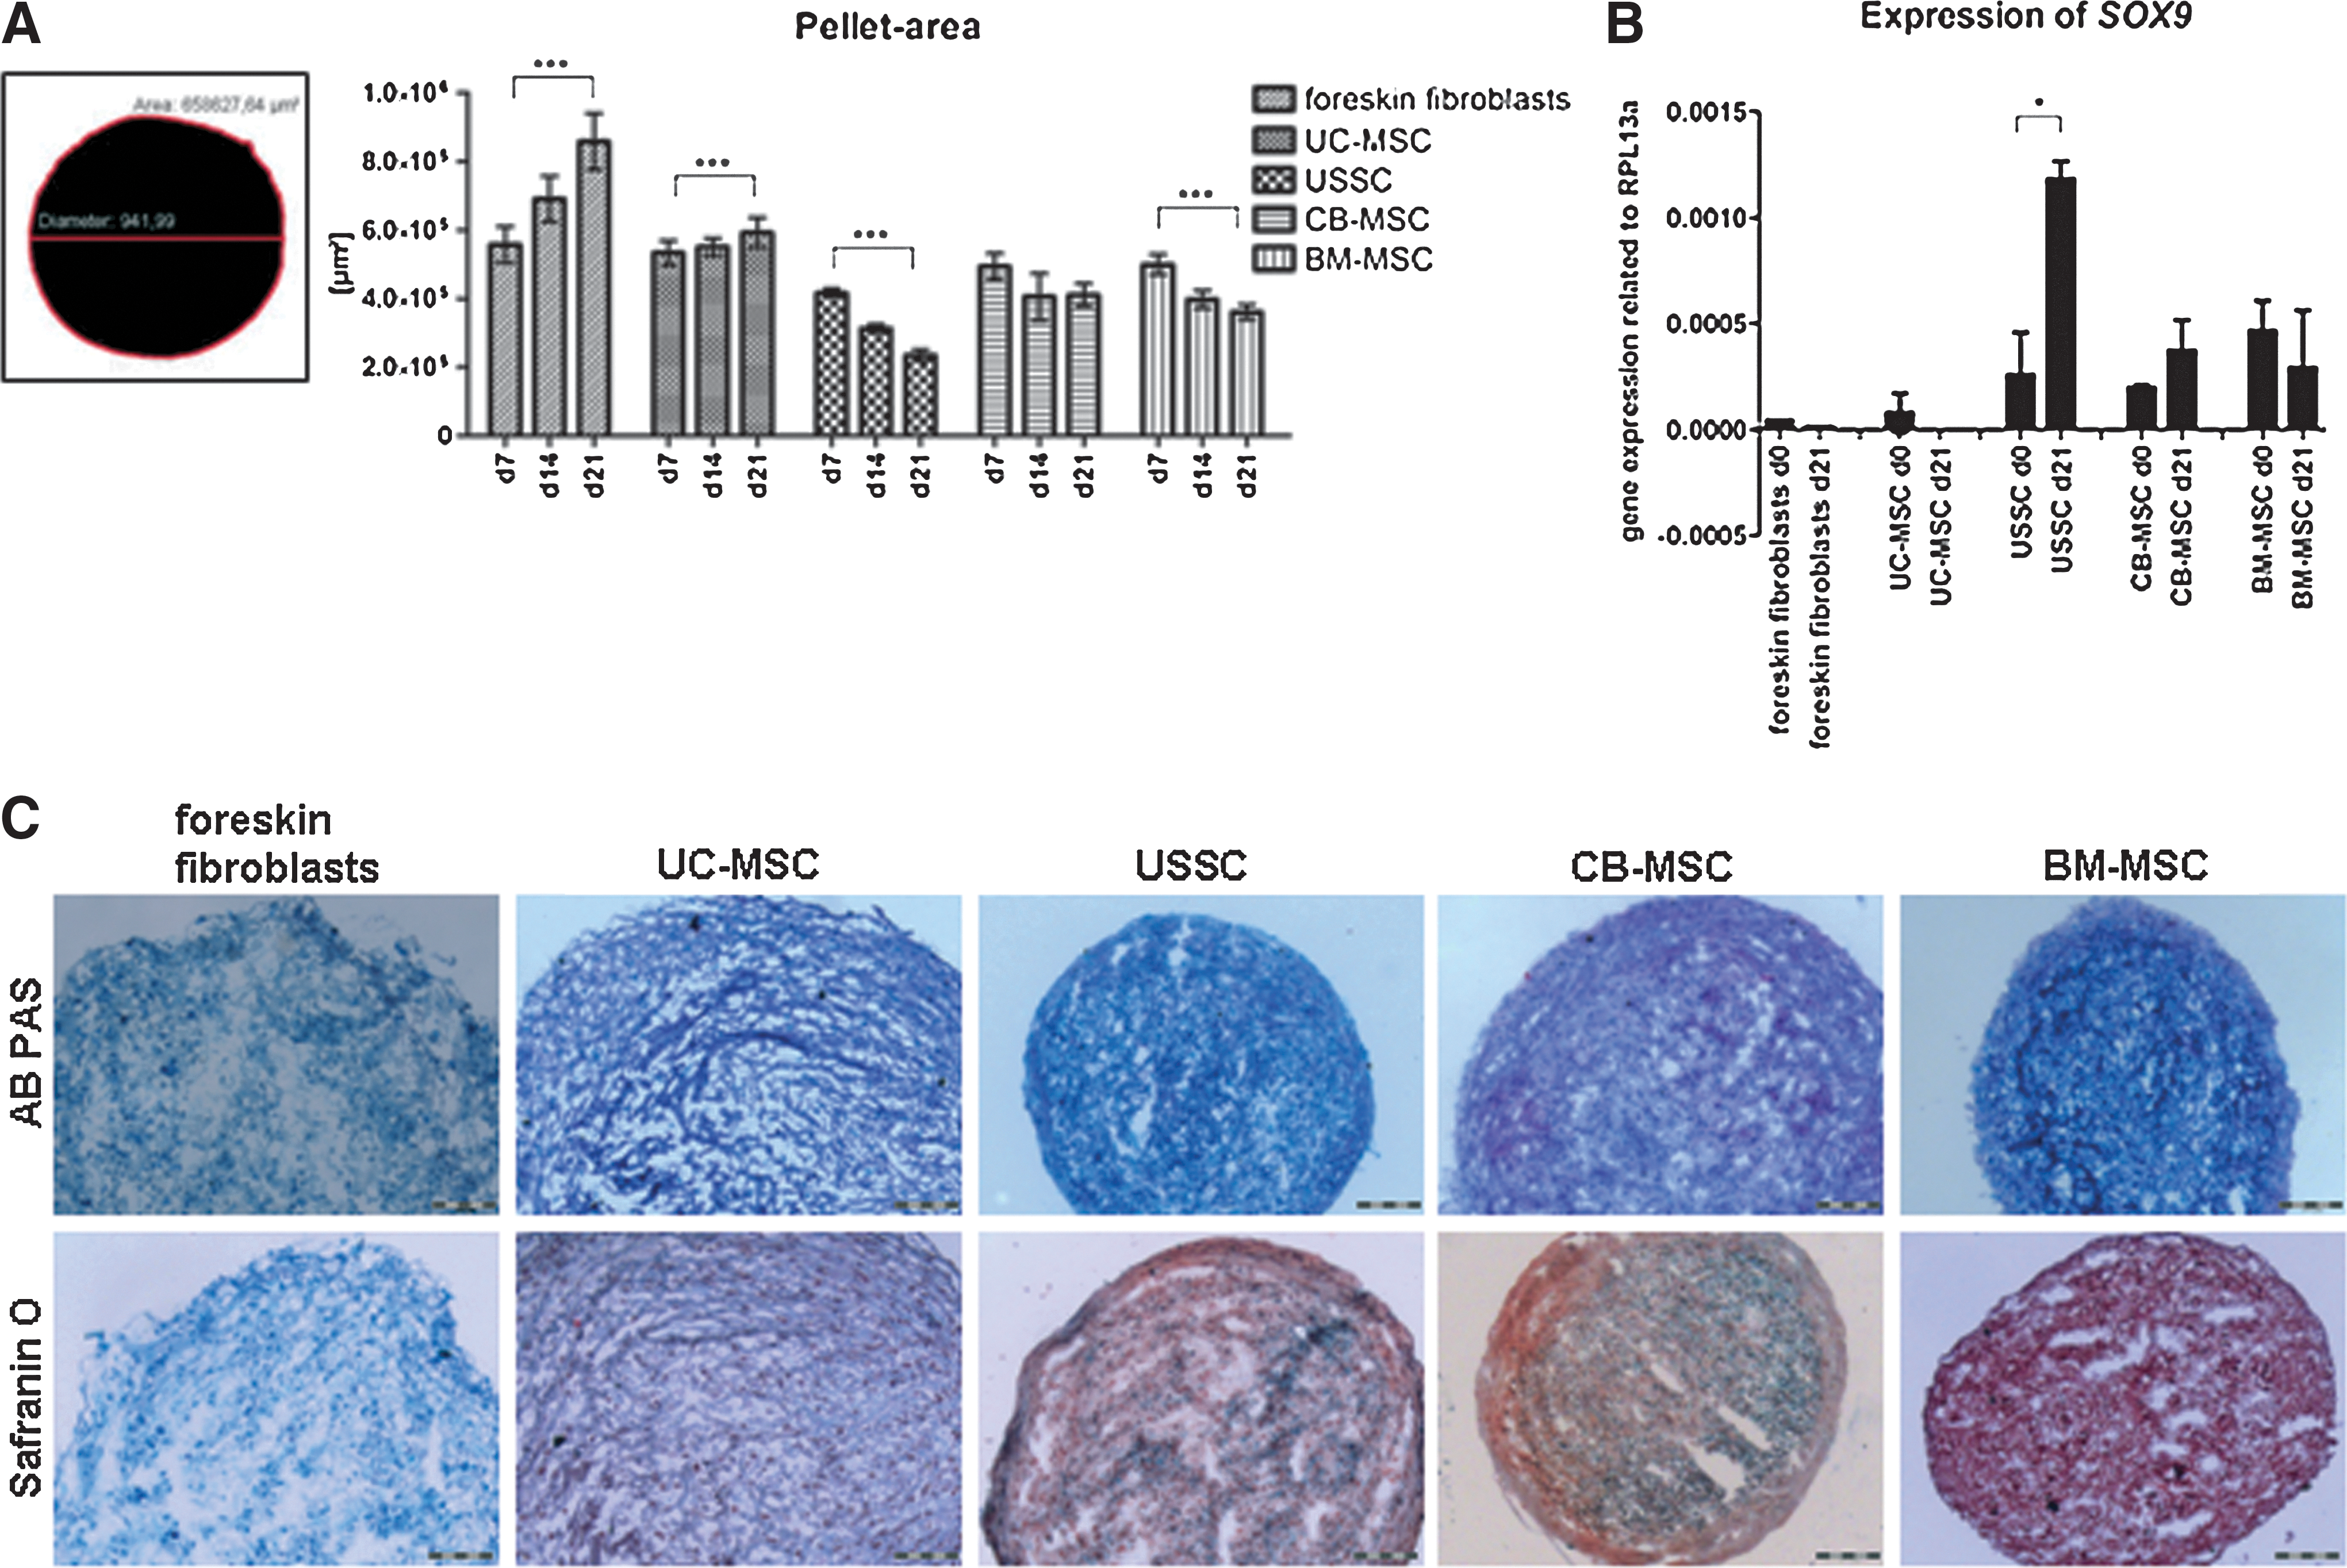
Chondrogenic differentiation.
In contrast, the pellets of USSC, CB-MSC, and BM-MSC were highly condensed, which resulted in a decrease of the pellet area with ongoing differentiation (Fig. 4A, mean±SD, n=13 pellets per time point: USSC d7: 4.16×10⁵±1.21×104 μm2; d21: 2.34×10⁵±1.57×104 μm2, P<0.0001; CB-MSC d7: 4.93×10⁵±3.83×104 μm2; d21: 4.1×10⁵±3.29×104 μm2, P=0.3922; BM-MSC d7: 4.98×10⁵±2.89×104 μm2, d21: 3.6×10⁵±2.21×104 μm2, P<0.0001). SOX9 was upregulated during chondrogenic differentiation of USSC (Fig. 4B, mean±SD, n=3 cell lines: d0: 0.000258±0.000201; d21: 0.001182±0.000083; P=0.0234) and CB-MSC (Fig. 4B, mean±SD, n=3 cell lines: d0: 0.000197±0.000011, d21: 0.000373±0.000143; P=0.1837). BM-MSC expressed high levels of SOX9 already in the native state and showed no upregulation during chondrogenic differentiation (Fig. 4B, mean±SD, n=3 cell lines: d0: 0.0000465±0.000141, d21: 0.000292±0.000270; P=0.5281). Proteoglycans were stained in cryosections of differentiated pellets using Safranin O (Fig. 4C).
Myogenic differentiation
UC-MSC express CD56, which was described as a cell surface marker on skeletal muscle cells [33]. Therefore, the potential of UC-MSC to differentiate toward skeletal muscle cells was evaluated. UC-MSC did not exhibit a myogenic morphology (characteristic cell fusions) after 30 days of differentiation (Supplementary Fig. S4A). RT-PCR analyses revealed a weak expression of the early myogenic marker MYF5 (myogenic factor 5) in undifferentiated UC-MSC (Supplementary Fig. S4B). On the contrary, MYOD1 (myogenic differentiation antigen 1) and MYOG (Myogenin)-proteins, which are late myogenic markers, were not detected in differentiated or native UC-MSC (Supplementary Fig. S4C). To conclude, UC-MSC do not display skeletal features.
Endothelial differentiation
To clarify the nature of CD146-positive UC-MSC, endothelial differentiation was performed and analyzed by flow cytometry. After differentiation, neither UC-MSC nor one of the other cell populations revealed endothelial characteristics with regard to morphology (Supplementary Fig. S5A) or cell surface marker expression (Supplementary Fig. S5B). In particular, no upregulation of the endothelial marker CD31 was detected in UC-MSC after 30 days in EGM2. Despite the strong expression of CD146 in undifferentiated cells, UC-MSC do not exhibit an endothelial differentiation potential.
HOX-gene expression
To assess the expression pattern of HOX-genes in foreskin fibroblasts, skin fibroblasts, UC-MSC, USSC, CB-MSC, and BM-MSC, RT-PCR analyses were performed. The band intensities were classified in 4 levels (−, +, ++, +++), which were depicted using the TreeView software (Fig. 5). In accordance with former results of our group [26], RT-PCR analysis revealed an absent expression of HOX-genes in USSC (Fig. 5). Foreskin fibroblasts showed a weak expression of some HOX-genes, while skin fibroblasts expressed more HOX-genes, in particular, HOXA1, 5, HOXB6, 7, 9, HOXC4, 6, 8, 9, 10, and HOXD8. UC-MSC, CB-MSC, and BM-MSC were HOX-positive. The tested cell lines of one group (eg, BM-MSC) coincided regarding the expression pattern of several HOX-genes, but also differed in the expression of individual ones. Consistent in all tested BM-MSC cell lines, HOXA9, 10, HOXB7, HOXC6, 8, 10, and HOXD8 revealed the strongest expression. In CB-MSC cell lines, HOXA9, 10, HOXC10, and HOXD8 and in UC-MSC, HOXA5, 7, HOXB5, 6, 7, 9, HOXC4, 5, 6, 8, 10, and HOXD10 were expressed congruently strong. The expression pattern of UC-MSC and skin fibroblasts showed high similarities concerning the genes of the B- (HOXB5, 6, 7, 9) and C-Cluster (HOXC4, 6, 8, 10).
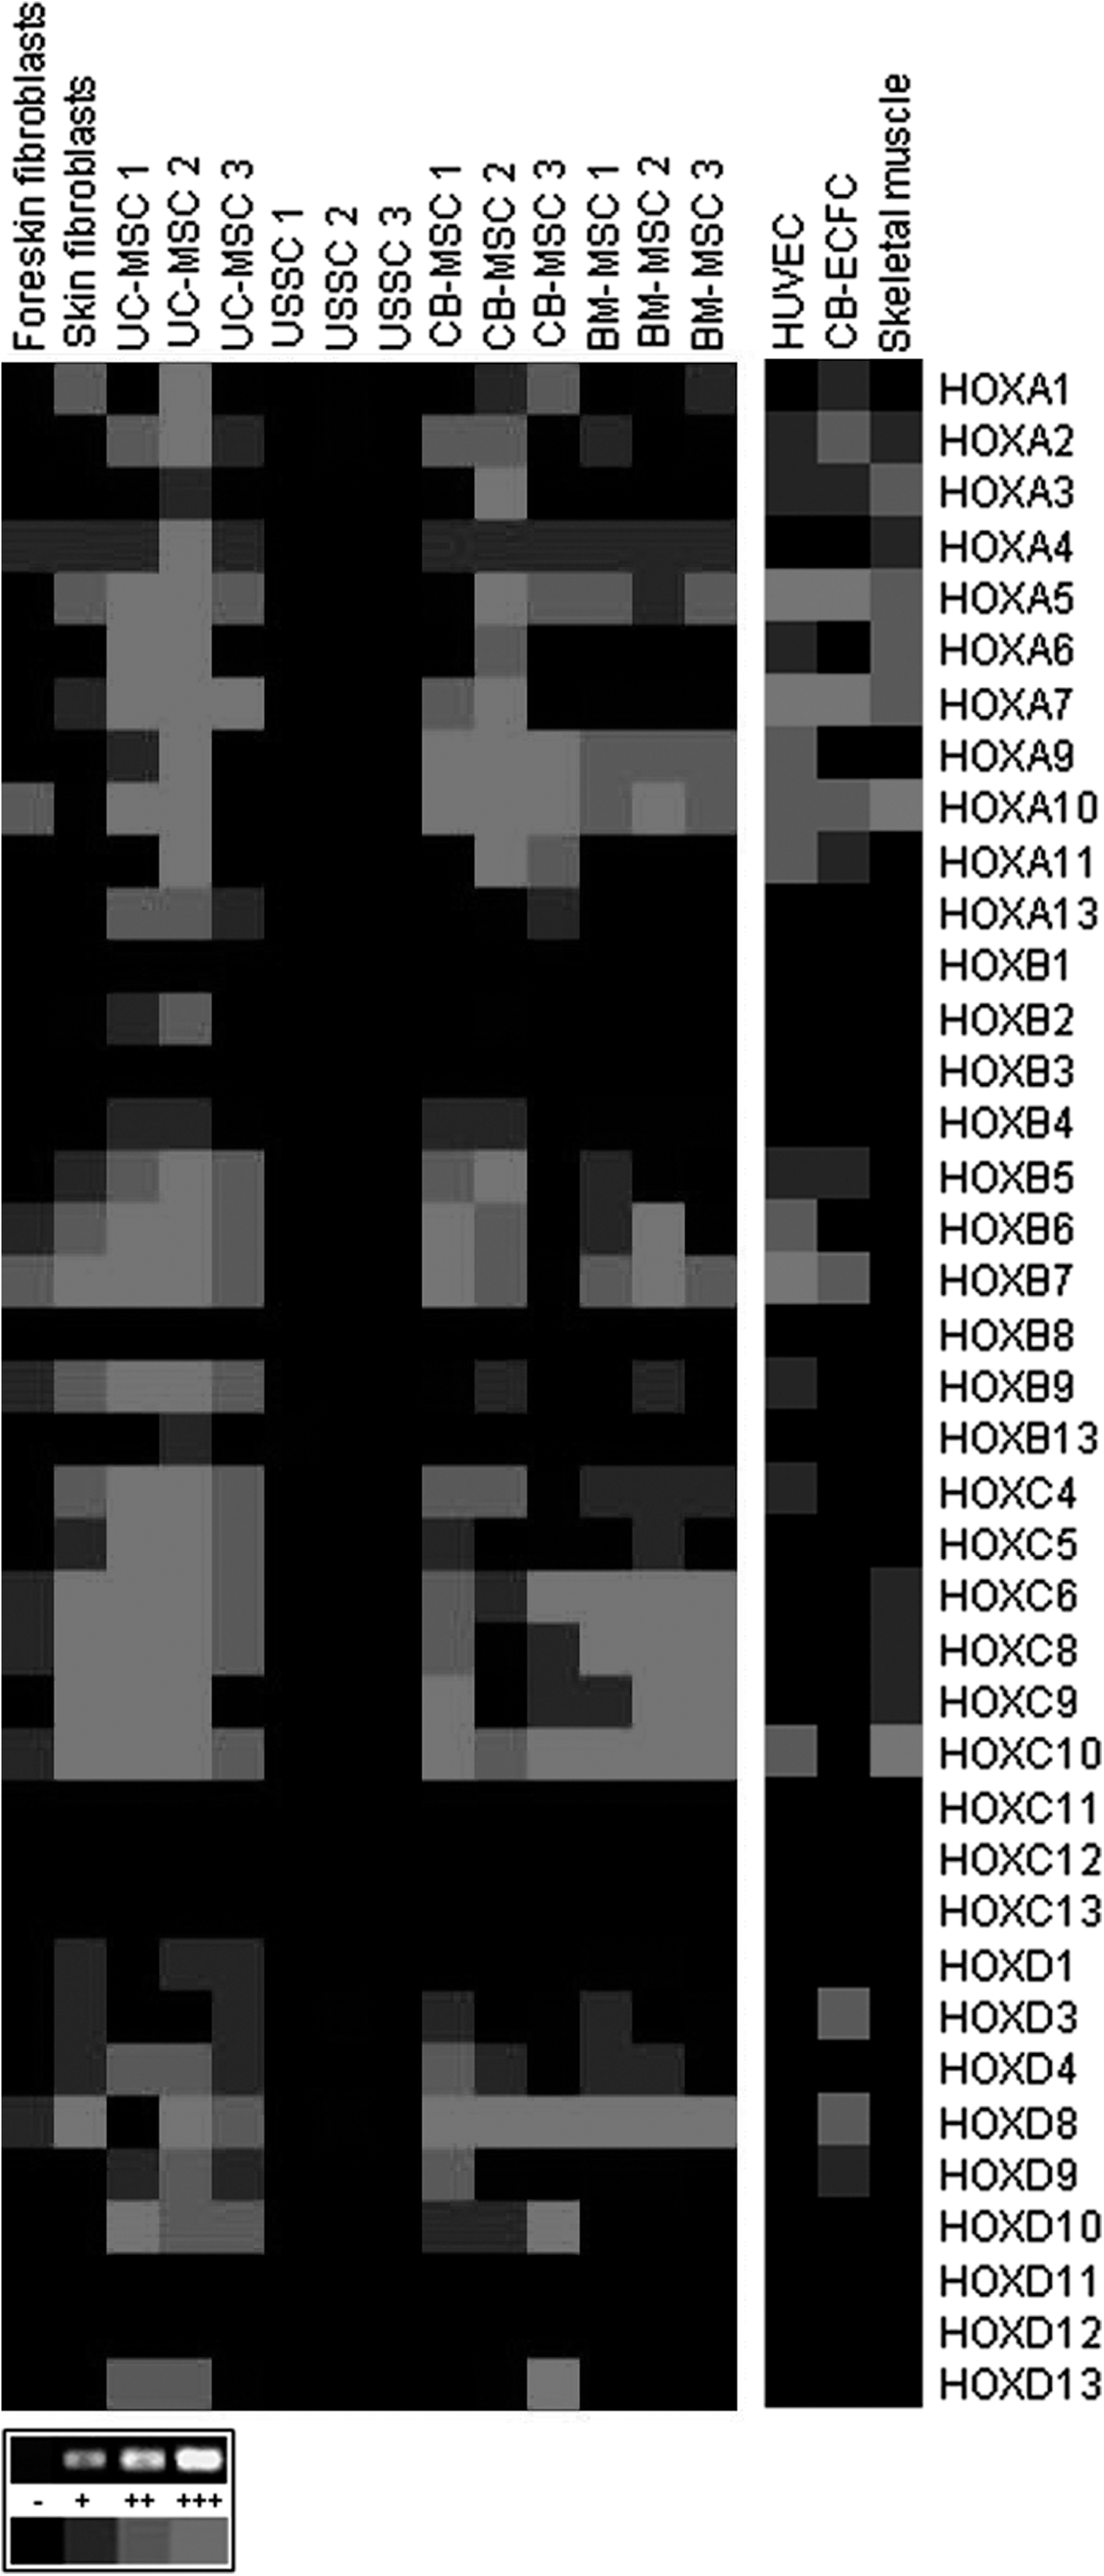
HOX-gene expression pattern. Reverse-transcription polymerase-chain-reaction analysis of HOX-genes in the indicated cell types or tissues (black, absent (−); gray, present, different expression levels (+, ++, +++) are reflected by the levels of gray). HUVEC, human umbilical vein endothelial cells; CB-ECFC, cord blood endothelial colony-forming cells.
To clarify the nature of UC-MSC, the HOX-expression profile was compared with that of HUVEC, CB-ECFC, and human adult skeletal muscle (total RNA) (Fig. 5). UC-MSC and the endothelial cells types (HUVEC and CB-ECFC) exhibited a similar expression pattern concerning the HOX-genes of the A-cluster. In contrast, UC-MSC expressed much more genes of the HOXC- and D-cluster compared with HUVEC and CB-ECFC. Skeletal muscle cells expressed HOX-genes to a lesser extent than UC-MSC, especially the genes of the HOXB, C and D-cluster (Fig. 5).
Discussion
In the present study, we addressed the question whether cells isolated from human UC fulfill the criteria defined for MSCs [25]. Human UC-MSC were compared with cells from UC blood (USSC and CB-MSC) and BM-MSC as well as with foreskin fibroblasts regarding their differentiation capacity, immunophenotype, and HOX-gene expression.
The technical procedures to isolate MSC from the UC vary in the literature and are based on enzymatic treatment (eg, collagenase, trypsin) [34,35] or mechanical dissection [21,22] of the cord with or without removal of the cord vessels. After comparison of several protocols, we decided to use an effective and simplified isolation protocol including the dissection of the cord into small pieces (Supplementary Fig. S1). This protocol utilizes the ability of MSC to adhere to plastic surfaces. The isolated UC-MSC exhibited a fibroblastic morphology and a similar growth potential compared with the cell populations from CB (Supplementary Fig. S3).
Flow-cytometric analysis was performed to define differences between the tested cell types concerning the expression of cell surface proteins. CD56 and CD146 were defined as putative markers to distinguish UC-MSC from USSC, CB-MSC, and BM-MSC, furthermore from foreskin fibroblasts. UC-MSC showed a strong expression, while USSC, CB-MSC, BM-MSC, and foreskin fibroblasts were negative for CD56 (Fig. 1A). Among other cell types, CD56 was described as being present on the surface of satellite cells in human muscle [33] or of natural killer cells [36]. Nevertheless, UC-MSC did not exhibit characteristics of skeletal muscle cells after myogenic differentiation in vitro (Supplementary Fig. S4). Although a marginal band was observed for MYF5 in undifferentiated UC-MSC applying RT-PCR analyses, no confirmation for the late myogenic markers MYOD1 and MYOG was detected at the protein level neither in undifferentiated nor in differentiated UC-MSC (Supplementary Fig. S4).
UC-MSC and CB-MSC showed a strong expression, while USSC expressed a weak level of CD146. BM-MSC exhibited the strongest signal. On the contrary, foreskin fibroblasts were CD146-negative (Fig. 1B). In a previous study, Sacchetti and coworkers described the phenotype of stromal progenitors in human BM with the ability to regenerate bone and stroma and establish a hematopoietic microenvironment in vivo [37]. This cell type is characterized by a high expression of CD146 and shares this phenotype with subendothelial cells of BM sinusoids in situ [37]. In another study, Russell et al. depicted a relationship between the trilineage differentiation potential of BM-MSC clones and their CD146-expression level [38]. The CD146 expression was higher in clones that were able to differentiate toward the adipo-, osteo-, and chondrogenic lineage compared with unipotent clones [38]. Although UC-MSC expressed a strong level of CD146 in the present work (Fig. 1B), the cells failed to differentiate in vitro. These data confirm the results of Kaltz et al. on umbilical vein stromal cells that did not form bone or give rise to adipocytes in vivo while expressing CD146 [16,39]. CD146 was also described as being present on pericytes that are in close association to endothelial cells in capillaries and microvessels [40,41]. Pericytes are negative [41], while UC-MSC are positive for CD56.
In conclusion, immunophenotypical analysis can distinguish UC-MSC (CD56+, CD146++) from foreskin fibroblasts (CD56−, CD146−), USSC (CD56−, CD146+), CB-MSC (CD56−, CD146++), and BM-MSC (CD56−, CD146+++).
To test whether UC-MSC exhibit a trilineage differentiation potential, osteogenesis-, adipogenesis-, and chondrogenesis-inducing in vitro-assays were performed in comparison to CB- and BM-derived cells.
In previous studies [14,15], our group confirmed the in vitro-ability of USSC, CB-MSC, and BM-MSC to differentiate toward the osteogenic lineage by specific staining methods. In this study here, the staining was combined with the analysis of specific marker genes by real-time-PCR analysis. RUNX2, a transcription factor essential for osteoblastic precursor cell differentiation [42], was downregulated during differentiation of foreskin fibroblasts and UC-MSC and upregulated in USSC, CB-MSC, and BM-MSC (Fig. 2B). Despite the high native (d0) expression of the osteogenic “master-gene” RUNX2, UC-MSC and foreskin fibroblasts could not be differentiated into osteoblasts, suggesting that a RUNX2-independent initiation of osteogenic differentiation occurs. This was shown by Satomura et al. in murine clonal BM stromal cells lines that expressed stable levels of RUNX2 but varied regarding the in vivo osteogenic potential [43]: The cell lines with high osteogenic capacity expressed BSP—a marker for early osteoblastic differentiation [42]—, whereas the nonosteogenic did not [43]. Correlating with these results, in the study here, BSP was not expressed in UC-MSC and foreskin fibroblasts, which did not differentiate into osteoblasts in vitro (Fig. 2A, B). This absent in vitro osteogenic differentiation potential of UC-MSC was confirmed in vivo (data not shown) by the group of Paolo Bianco (La Sapienza University Rome, personal communication).
The transcription factor OSX is essential for correct bone formation: In OSX null mutant mice, no endochondral or intramembranous bone formation occurs [44]. In UC-MSC and foreskin fibroblasts, which fail to differentiate into osteoblasts, OSX was nearly undetectable (d0 and d14). In USSC, CB-MSC, and BM-MSC, OSX was expressed either already in the native cells or during differentiation. This leads to the conclusion that a sufficiently strong expression of OSX, BSP, or OC in native cells can already permit osteogenic differentiation. Therefore, the downregulation of these genes during osteogenic differentiation (OSX in CB-MSC; BSP and OC in BM-MSC; Fig. 2B) is not contradictory to the positive osteogenic differentiation of USSC, UC-MSC and BM-MSC.
Likewise, UC-MSC and foreskin fibroblasts failed to differentiate into adipocytes, demonstrated by negative Oil Red O-staining and an absent expression of the adipogenic genes PPARg, FABP4, and PLIN (Fig. 3). CB-MSC and BM-MSC were able to differentiate into adipocytes, while USSC could not [15].
The chondrogenic differentiation potential was analyzed using an in vitro pellet culture-system allowing direct cell-cell contacts analogous to those taking place in the precartilage mesenchymal condensation during embryonic development [45]. Compared with control cultures (USSC, CB-MSC, and BM-MSC), pellets of UC-MSC and foreskin fibroblasts revealed a less condensed structure (Fig. 4C). The transcription factor SOX9 is an essential master gene during the onset of cartilage development [46]. Abnormal expression of SOX9 during skeletal development results in severe skeletal disorders [47], underscoring the key role of SOX9 during chondrogenesis. Therefore, the absent upregulation of SOX9 (Fig. 4B) proved the failed chondrogenic differentiation of UC-MSC and foreskin fibroblasts. Nevertheless, pellets of UC-MSC and foreskin fibroblasts stayed stable for 21 days and exhibited a blue color after AB-PAS staining without differentiating toward the chondrogenic lineage. This highlights the importance of detecting marker genes after differentiation.
In summary, these results demonstrate that UC cells do not fulfill the criteria defined for MSC regarding the ability to give rise to cells of the adipo-, osteo- and chondrogenic lineage. The in vitro differentiation capacity can only be judged adequately if staining processes are combined with the detection of lineage-specific gene-expression in differentiated cells.
In order to define further differences between the tested cell types derived from CB, BM, and the UC, the expression pattern of HOX-genes was analyzed. HOX-genes encode transcription factors that determine the positional identity along the anterior-posterior axis of the developing embryo [27]. The intrinsic HOX-expression pattern is maintained until the adult state [48] and is characteristic for the anatomical origin of a cell [49]. Therefore, the HOX-gene expression pattern of the cell types with a different anatomical origin used in our study was investigated. The HOX-gene expression pattern of UC-MSC, which are HOX-positive, resembled that of CB-MSC and BM-MSC (Fig. 5), whereas the HOX-negative USSC were similar to embryonic stem cells (H9) and to fetal liver cells (analyzed in [26]). UC-MSC express CD56, a phenotype they share with skeletal muscle cells. Compared with UC-MSC, skeletal muscle cells expressed HOX-genes to a lesser extent (Fig. 5). Between these 2 cell types, no consistent HOX-expression pattern was observed. This correlates to the failed in vitro myogenic differentiation potential of UC-MSC (Supplementary Fig. S4). Likewise, the CD146+ UC-MSC exhibited a different HOX-gene expression pattern compared with endothelial cells (HUVEC and CB-ECFC, Fig. 5) and failed to differentiate into endothelial cell in vitro (Supplementary Fig. S5). This suggests that UC-MSC and skeletal muscle or endothelial cells, respectively, do not have a common anatomical origin.
The expression or absence of HOX-genes is also an important aspect with regard to potential cell transplantation. In 2008, Leucht et al. reported the influence of the HOX-gene expression of transplanted cells on bone regeneration in mice [50]. HOX-negative mandibular skeletal progenitor cells adopt the tissue-typical HOX-code after transplantation into the HOX-positive tibia leading to complete bone regeneration. Vice versa, HOX-positive tibial skeletal progenitor cells maintain their positive “HOX-fingerprint” after transplantation and failed to rebuild bone [50]. It can be hypothesized that a HOX-negative cell population might show an improved engraftment and, therefore, an increased regenerative potential. Leucht and coworkers also reported differences concerning the osteogenic potential of HOX-positive and negative skeletal progenitor cells: the HOX-negative neural crest-derived cells exhibited a more robust in vivo bone regeneration, the HOX-positive cells failed to differentiate into osteoblasts [50]. In correlation, UC-MSC express many HOX-genes (Fig. 5) and fail to differentiate into osteoblasts in vivo and in vitro.
Conclusion
Our findings demonstrated the absent adipo-, osteo-, and chondrogenic differentiation potential of cells isolated from the human UC. Therefore, the cells do not comply with the definition of “mesenchymal stromal cells.” The detection of differentiation-related gene expression in combination with staining processes provides an efficient tool to verify the in vitro-differentiation. Based on the expression of HOX-genes and the cell surface antigens CD56 and CD146, UC cells can be distinguished from CB and BM derived cells as well as from pericytes and foreskin fibroblasts.
Footnotes
Acknowledgments
Julia Bosch especially thanks the Jürgen Manchot Stiftung for providing the Ph.D. scholarship. We also thank Karen Mattheisen for proof-reading the article.
Author Disclosure Statement
The authors indicate no competing financial interest.
References
Supplementary Material
Please find the following supplemental material available below.
For Open Access articles published under a Creative Commons License, all supplemental material carries the same license as the article it is associated with.
For non-Open Access articles published, all supplemental material carries a non-exclusive license, and permission requests for re-use of supplemental material or any part of supplemental material shall be sent directly to the copyright owner as specified in the copyright notice associated with the article.