
Abstract
Bone marrow mesenchymal stem cells (BM-MSCs) are the main cellular components of the bone marrow, providing a supportive cellular microenvironment to maintain healthy hematopoiesis. β-thalassemia major (β-TM) is characterized by anemia that is caused by a genetic defect in hemoglobin synthesis and results in ineffective erythropoiesis (IE). The alterations in the microenvironment in thalassemic bone marrow during IE can cause changes in BM-MSCs. This study aimed to investigate global structural and compositional changes in BM-MSCs in β-TM that may provide a basis in understanding interactions of hematopoietic stem cells (HSCs)-MSCs in such a pathological bone marrow microenvironment. Following characterization of morphological, immunophenotypical, and differentiation properties, the changes in healthy and thalassemic BM-MSCs before and after bone marrow transplantation (BMT) were examined by attenuated total reflection-Fourier transform infrared (ATR-FTIR). The significant increase in lipid, protein, glycogen, and nucleic acid contents in thalassemic BM-MSCs with respect to healthy BM-MSCs was attributed to enhanced cell proliferation and BM activity during IE. The significant decreases in the content of mentioned macromolecules in post-transplant group BM-MSCs versus pre-transplant BM-MSCs was interpreted as restoring effect of BMT therapy on IE and defective BM microenvironment. These alterations were also supported by ELISA results of erythropoietin (EPO) and growth differentiation factor (GDF15) in bone marrow plasma samples as a reflection of IE and by MTT proliferation assay on BM-MSCs. Based on these changes, sampling groups were discriminated by cluster analysis. These results provide information for the studies that concentrate on interactions between HSCs-MSCs in bone marrow.
Introduction
T
The specific microenvironment with which HSCs interact, called as stem cell niche, is important for hematopoietic regeneration including erythropoiesis. Mesenchymal stromal/stem cells are a main cellular components of bone marrow and not only provide the supportive microenvironmental niche for HSCs but are also capable of differentiating into various cell types of mesenchymal origin, such as bone, fat, and cartilage [9]. Bone marrow mesenchymal stem cells (BM-MSCs) facilitate maintenance of HSCs by secreting soluble factors and direct cell-to-cell contact [10,11]. β-TM is a well-defined inherited hematological disease characterized by ineffective erythropoiesis; however, cell-to-cell interactions between HSCs and MSCs in that pathological bone marrow microenvironment are still unknown. We hypothesized that hematopoietic defect in β-TM may induce changes in morphological, proliferative, differentiative, and molecular properties of MSCs as a result of cellular interactions between defective HSCs and BM-MSCs. The present study aims to investigate the molecular changes of BM-MSCs in such a pathological bone marrow microenvironment in β-TM, which is expected to contribute delineation of unknown mechanisms of HSCs and BM-MSCs interactions during hematopoiesis, and to understand the adaptive changes in the bone marrow microenvironment.
Fourier transform infrared (FTIR) spectroscopy has the potential to provide rapid, sensitive, and simultaneous biochemical and biophysical information without disturbing the biological material [12,13]. It relies on the characteristic absorbance of corresponding molecular vibrations in the sample. The transitions in vibrational modes, especially in stretching and bending modes of the functional groups—which represent cellular components such as lipids, proteins, carbohydrates and nucleic acids—are used to detect structural and functional changes [12,13]. Because each biological sample has a characteristic IR spectrum, the shift in peak positions, bandwidth, and peak area/intensity values provide valuable data for proper identification of biological systems [14]. Recently, FTIR spectroscopy has become a promising tool for biomedical diagnosis [15 –17]. This technique is also used in the determination of radiation induced alterations and the effect of radioprotectant in irradiated tissues [18], taxonomical studies in microbiology [12,19], plant studies [20], discrimination of drug resistant and drug sensitive cancer cells [21, 22], examination of apoptosis [23], and in the determination of stem cell differentiation into adipogenic, osteogenic, and neurogenic lineages [24 –26].
Attenuated total reflection (ATR) mode of FTIR spectroscopy is a powerful tool to study biomedical samples. In this technique, the samples can be directly placed on an ATR crystal and investigated, so that the sample preparation procedure is reduced before spectral measurements [27,28]. It is based on the total reflection phenomenon. When the radiation beam passes through an ATR crystal, it is internally reflected, which causes creation of an evanescent wave protruding only a few micrometers beyond the surface of ATR crystal [28].
In the current study, BM-MSCs from patients with β-TM were characterized in terms of their morphological, immunological, and differentiation properties and compared to those obtained from healthy BM donors. Then the differences in the structure and the function of macromolecular components of healthy and thalassemic BM-MSCs before and after bone marrow transplantation (BMT) therapy were compared using Attenuated ATR-FTIR spectroscopy. Additionally, cluster analysis was performed to discriminate pre and post-transplant group thalassemic BM-MSCs from the healthy control BM-MSCs according to their spectral variations. This analysis not only offers the opportunity to differentiate between control and other samples without training spectral data but also tests the interpoint distances between all samples. It has been shown that erythropoiesis (IE) is characterized by increased erythropoietin (EPO) and growth differentiation factor 15 (GDF 15) levels in bone marrow. Therefore, EPO and GDF15 levels were measured in bone marrow plasma samples of thalassemic and healthy donors by quantitative enzyme-linked immunosorbent assay (ELISA) assay and also cellular activation was measured by MTT (thiazolyl blue tetrazolium bromide) proliferation assay to support spectroscopic results.
Material and Methods
Sampling groups
Human BM-MSCs were isolated from bone marrow aspirates (2–3 mL) that were obtained from the posterior iliac crest of patients with β-TM before and after BMT (between day +25 and day +35) as a part of routine patient follow up procedures at Hacettepe University Children's Hospital BMT Unit. Age-matched healthy BMT donors served as a controls; 2–5 mL of collected large volume bone marrow (∼500–1000mL) was used for BM-MSC isolation and expansion. The study was approved by institutional ethical board of Hacettepe University and samples were used by informed consent of patients and healthy donors.
Isolation and cultivation of MSCs from bone marrow stroma
Bone marrow aspirates were diluted in equal volume of PBS (phosphate buffer solution) and subjected to fractionation on a density gradient solution Ficoll (1.077 g/L; Biochrom AG, Berlin, Germany) to obtain mononuclear cells (MNCs). MNCs were then washed twice with PBS and cultivated in a medium containing Dulbeco's modified Eagle medium-low glucose (DMEM-LG; Biochrom AG), 10% (vol/vol) fetal bovine serum (FBS; Biochrom AG), 1% (vol/vol)
Flow cytometry
Flow cytometric analyses of P3 BM-MSCs were performed on a FACS Aria flow cytometer (Becton, Dickinson Biosciences) to evaluate BM-MSCs in terms of expression of main MSC surface markers CD73 (BD Biosciences), CD90 (BD Biosciences), and CD105 (eBioscience) and lack of expression of HSC markers CD34 (BD Biosciences) and CD45 (BD Biosciences). All markers were conjugated with either fluorescent isothiocyanate or phycoerythrin. BM-MSCs were trypsinized and washed with PBS. To evaluate BM-MSCs marker profile, 1×10⁵ cells were suspended in 100 μL PBS-BSA-Na azide with 2 μL of each flow cytometry antibody in a separate tube and incubated for 30 min in the dark. At the end of incubation, cells were washed twice with PBS and finally diluted in 200 μL PBS-BSA-Na azide. The analysis of cells was performed according to 10,000 event count with the FACS Aria (Beckon Dickinson Biosciences). The acquired data was analyzed by using BD FACS Diva Software v6.1.2 (Beckon Dickinson Biosciences).
Differentiation experiments
Passage 3 BM-MSCs from thalassemic patients and controls were subjected to certain differentiation induction mediums to evaluate their stem cell potency by activating their adipogenesis and osteogenesis.
Adipogenic differentiation
Confluent (90%) cells from P3 of BM-MSCs cultures in 6-well plates were treated with 1μM dexamethasone (Sigma), 60 μM indomethacine (Sigma), 500 μM IBMX (Sigma) and 5 μg/mL insulin (Sigma) in DMEM-LG (Biological Industries), with 10% FBS (Gibco). Medium was replaced every 3 days for a 3-week period and adipogenesis was followed by microscopic investigation during a 3-week period. Meanwhile, the cells in control wells were cultured for 3 week in DMEM-LG with 10% FBS. At the end of differentiation period, cells were fixed with 10% buffered formalin for 20 min at room temperature and stained with Oil Red O (Sigma) for 10 min at room temperature to visualize adipogenic differentiation.
Osteogenic differentiation
Confluent (70–80%) BM-MSCs from P3 in 6-well plates were subjected to osteogenic medium composed of DMEM-LG (Biological Industries), 10% of FBS (Gibco), 100 nM dexamethasone (Sigma), 10 mM β-glycerophosphate (Sigma), and 0.2 mM ascorbic acid (Sigma). The induction medium was replenished every 3 days and osteogenesis was followed by microscopic investigation during a 3-week period. Meanwhile, the cells in control wells were cultured for 21 days in DMEM-LG with 10% FBS. In order to visualize calcium deposits, cultures were stained with Alizarin Red solution (pH 4.2) after being fixed in 10% formalin for 10–20 min at room temperature.
MTT proliferation assay
Passage 2 BM-MSCs belonging to pre-transplant, post-transplant, and control groups were trypsinized and then harvested by centrifugation at 1500 rpm for 5 min. Harvested cells for each sample were seeded with triplicates in 96-well plates at a density of 1×10⁴ cells per well in 200 μL BM-MSCs culture media. Cultured cells were expanded in 5% CO2 incubated at 37°C. One set of wells with MTT and culture medium without cells were used as a blank control. 20 μL MTT (5mg/mL in PBS; Sigma-Aldrich) solution was added to each well at day 1, 3, 5, 7, 9, and 11 of culturing. After addition of MTT, the 96-well plates were covered with thin foil and incubated for 4 h at 37°C in 5% CO2. Formazan crystals were observed as dark crystals at the bottom of plate under the inverted light microscope. At the end of the incubation period, 100 μL sodium dodecyl sulfate (SDS) (Sigma-Aldrich) was added to each well and incubated at room temperature for 24 h by covering the plate with thin foil. SDS is defined as MTT solvent that dissolves formazan cystals, producing a purple solution. At the end of the incubation time, the absorbance of each well was measured at 620 nm using ELISA reader (Tecan Systems Inc.).
Determination of EPO and GDF 15 levels in bone marrow plasma samples
Bone marrow samples of thalassemic and healthy donors were collected into tubes containing heparin anticoagulant. The tubes were centrifuged at 2500 rpm for 15 min to obtain plasma samples that were stored at −80°C until analysis. Quantification of EPO and GDF15 levels of BM plasma samples was performed by ELISA assays for human EPO (Quantikine IVD, R&D Systems) and for human GDF 15 (Quantikine IVD, R&D Systems) according to the manufacturer's instruction manual.
Analysis of chimerism by short tandem repeat polymerase chain reaction
Genomic DNAs were extracted from recipient and donor BM-MSCs samples using MagNA Pure Systems (Roche) according to the manufacturer's recommendation. AmpFlSTR Identifiler amplification kit (Applied Biosystems) was used to perform short tandem repeat-polymerase chain reaction (STR-PCR). STR-PCR is based on the amplification of tetranucleotide STR loci by PCR reaction. The kit amplifies 15 loci (CSF1P0, D7S820, D8S1179, D21S11, D2S1338, D3S1358, D13S317, D16S539, TH01, D1S51, D19S433, TPOX, vWA, D5S818, and FGA) and Amelogenin in a single tube and provides loci consistent with major worldwide STR databasing standards. PCR was performed using 1 ng of genomic DNA in a final reaction volume of 15 μL as suggested by the manufacturer. The PCR cycle conditions were: 95°C for 11 min, followed by 28 cycles at 94°C for 1 min, 59°C for 1 min, and 72°C for 1 min. The final elongation step was 60 min at 60°C. The PCR products were analyzed with an ABI PRISM 310 DNA sequencer (Applied Biosystems) as described by the manufacturer on the basis of calculation of the observed peak areas. Percentage donor chimerism was assumed from the peak area contributed by one heterozygous allele, visibly distinct in the mixed profile, and was identical to that area contributing to a mixture of donor and recipient.
ATR-FTIR spectroscopy
Sample preparation
For ATR-FTIR measurements, 2×10⁶ BM-MSCs at P 3 were harvested by centrifugation following trypsinization at 1500 rpm for 5 min and the cell pellet was washed twice in 0.9% PBS solution to remove remaining culture medium. The cell pellet was resuspended in 10 μL 0.9% PBS solution, and the cell suspension was deposited on the Diamond/ZnSe (Di/ZnSe) crystal plate of the Universal ATR unit of the FTIR spectrometer by rapidly evaporating using mild N2 flux for 30 min to obtain a homogenous film of entire cells on ATR crystal as reported previously [22,29].
Data acquisition and spectroscopic analysis
Infrared spectra were obtained by scanning the prepared BM-MSCs pellet on ATR-Di/ZnSe crystal with a Spectrum 100 FTIR spectrometer in the one-bounce ATR mode (Perkin-Elmer Inc.). The spectra were recorded in the 4000–650 cm−1 region at room temperature. A total of 100 scans were taken for each interferogram at 4 cm−1 resolution. The spectra of atmospheric water vapor and carbon dioxide interference were recorded as background and then subtracted automatically using the Spectrum One software program. In order to prevent the contribution of inorganic phosphate in PBS, the spectrum of 10 μL PBS buffer was collected at identical conditions with the samples. Then the PBS buffer spectrum was subtracted from the spectra of cells. Recording and analyses of the spectral data were performed using the Spectrum One software from Perkin Elmer. The band positions were measured according to the center of weight of the peaks. The spectra were normalized with respect to specific bands only for visual presentation of the differences. However, for detailed data analysis and accurate determination of the variations, the original baseline corrected spectrum was considered.
Cluster analysis
This analysis was applied to find out spectral relationships among pre- and post-transplant BM-MSCs and control BM-MSCs in the 3050–800 cm−1 wavenumber range. The first derivative and vector-normalized spectra of control and thalassemic BM-MSCs were applied for cluster analysis by using OPUS 5.5 software (Bruker Optic, GmbH). Cluster analysis is a procedure that groups the spectral data of samples according to their similarities. The result of the analyses were displayed as dendrogram. The change in variances between the spectra of samples is represented by heterogeneity values. Higher heterogeneity between the clusters demonstrates higher differences among analyzed groups. Pearson's correlation coefficients were used to measure the distances between the pairs of spectra. Ward's algorithm was used to construct dendograms for hierarchical clustering. The details of the calculation and algorithm can be found in Severcan et al. (2010) [30].
Statistical tests
The results were expressed as mean±standard error. The spectra were analyzed using different spectral parameters like band frequencies, bandwidths, and band areas. First the data were evaluated using a normality test to decide whether the parametric or nonparametric statistical test to be used. Since the data showed normal distribution, they were compared to each other by using one-way analysis of variance and Tukey's multiple comparison test by considering their statistical significances in terms of P<0.05, P<0.01, and P<0.001.
Results and Discussion
In the present ATR-FTIR spectroscopy study, molecular alterations in structure and composition of BM-MSCs of patients with β-TM were investigated before and after their BMT therapy. The spectral results were compared between the control group and the pre- and post-transplant groups as well. Thalassemic and healthy BM-MSCs were characterized by their adherence to the plastic surface of the culture flask and their fibroblast like morphology under inverted light microscope in accordance with International Society for Cellular Therapy (ISCT) criteria [8,31]. They did not show any difference in terms of their morphological properties. Additionally, they were evaluated for their expression of MSCs CD105, CD73, and CD90 surface antigens. BM-MSCs were positive for CD105, CD73, and CD90 antigens in ≥95% of thalassemic and healthy donors, while they showed lack of expression for hematopoietic markers CD45 and CD34. According to ISCT definitions, MSCs must have the capacity to differentiate into at least osteoblasts and adipocytes by standard differentiation-inducing media [31]. In this study, differentiation potentials of thalassemic and healthy BM-MSCs were assessed by using specific induction media. Both thalassemic and healthy BM-MSCs were differentiated into adipogenic and osteogenic lineages. Oil Red O staining for adipocytes and Alizarin Red staining for osteocytes were positive (data not shown).
The PBS buffer-subtracted average FTIR spectra of BM-MSCs belonging to sampling groups are shown in Fig. 1. The quite complex spectra in the region between 3800–800 cm−1 contains several bands corresponding to several different functional groups of lipids, proteins, carbohydrates, and nucleic acids [24,32]. The band assignments of these spectral bands are presented in Table 1. The accurate spectral measurements were performed by using raw spectrum of each sample in 3050–2800 cm−1 and 1800–800 cm−1 regions. The measurements of area values of spectral bands and their ratios were used to make an interpretation about concentration of assigned macromolecules, while band wavenumber values were used to understand structural changes in the assigned macromolecules. Numerical variation of band area values, band wavenumber, and band area ratios of the main bands are listed in Tables 2 and 3.
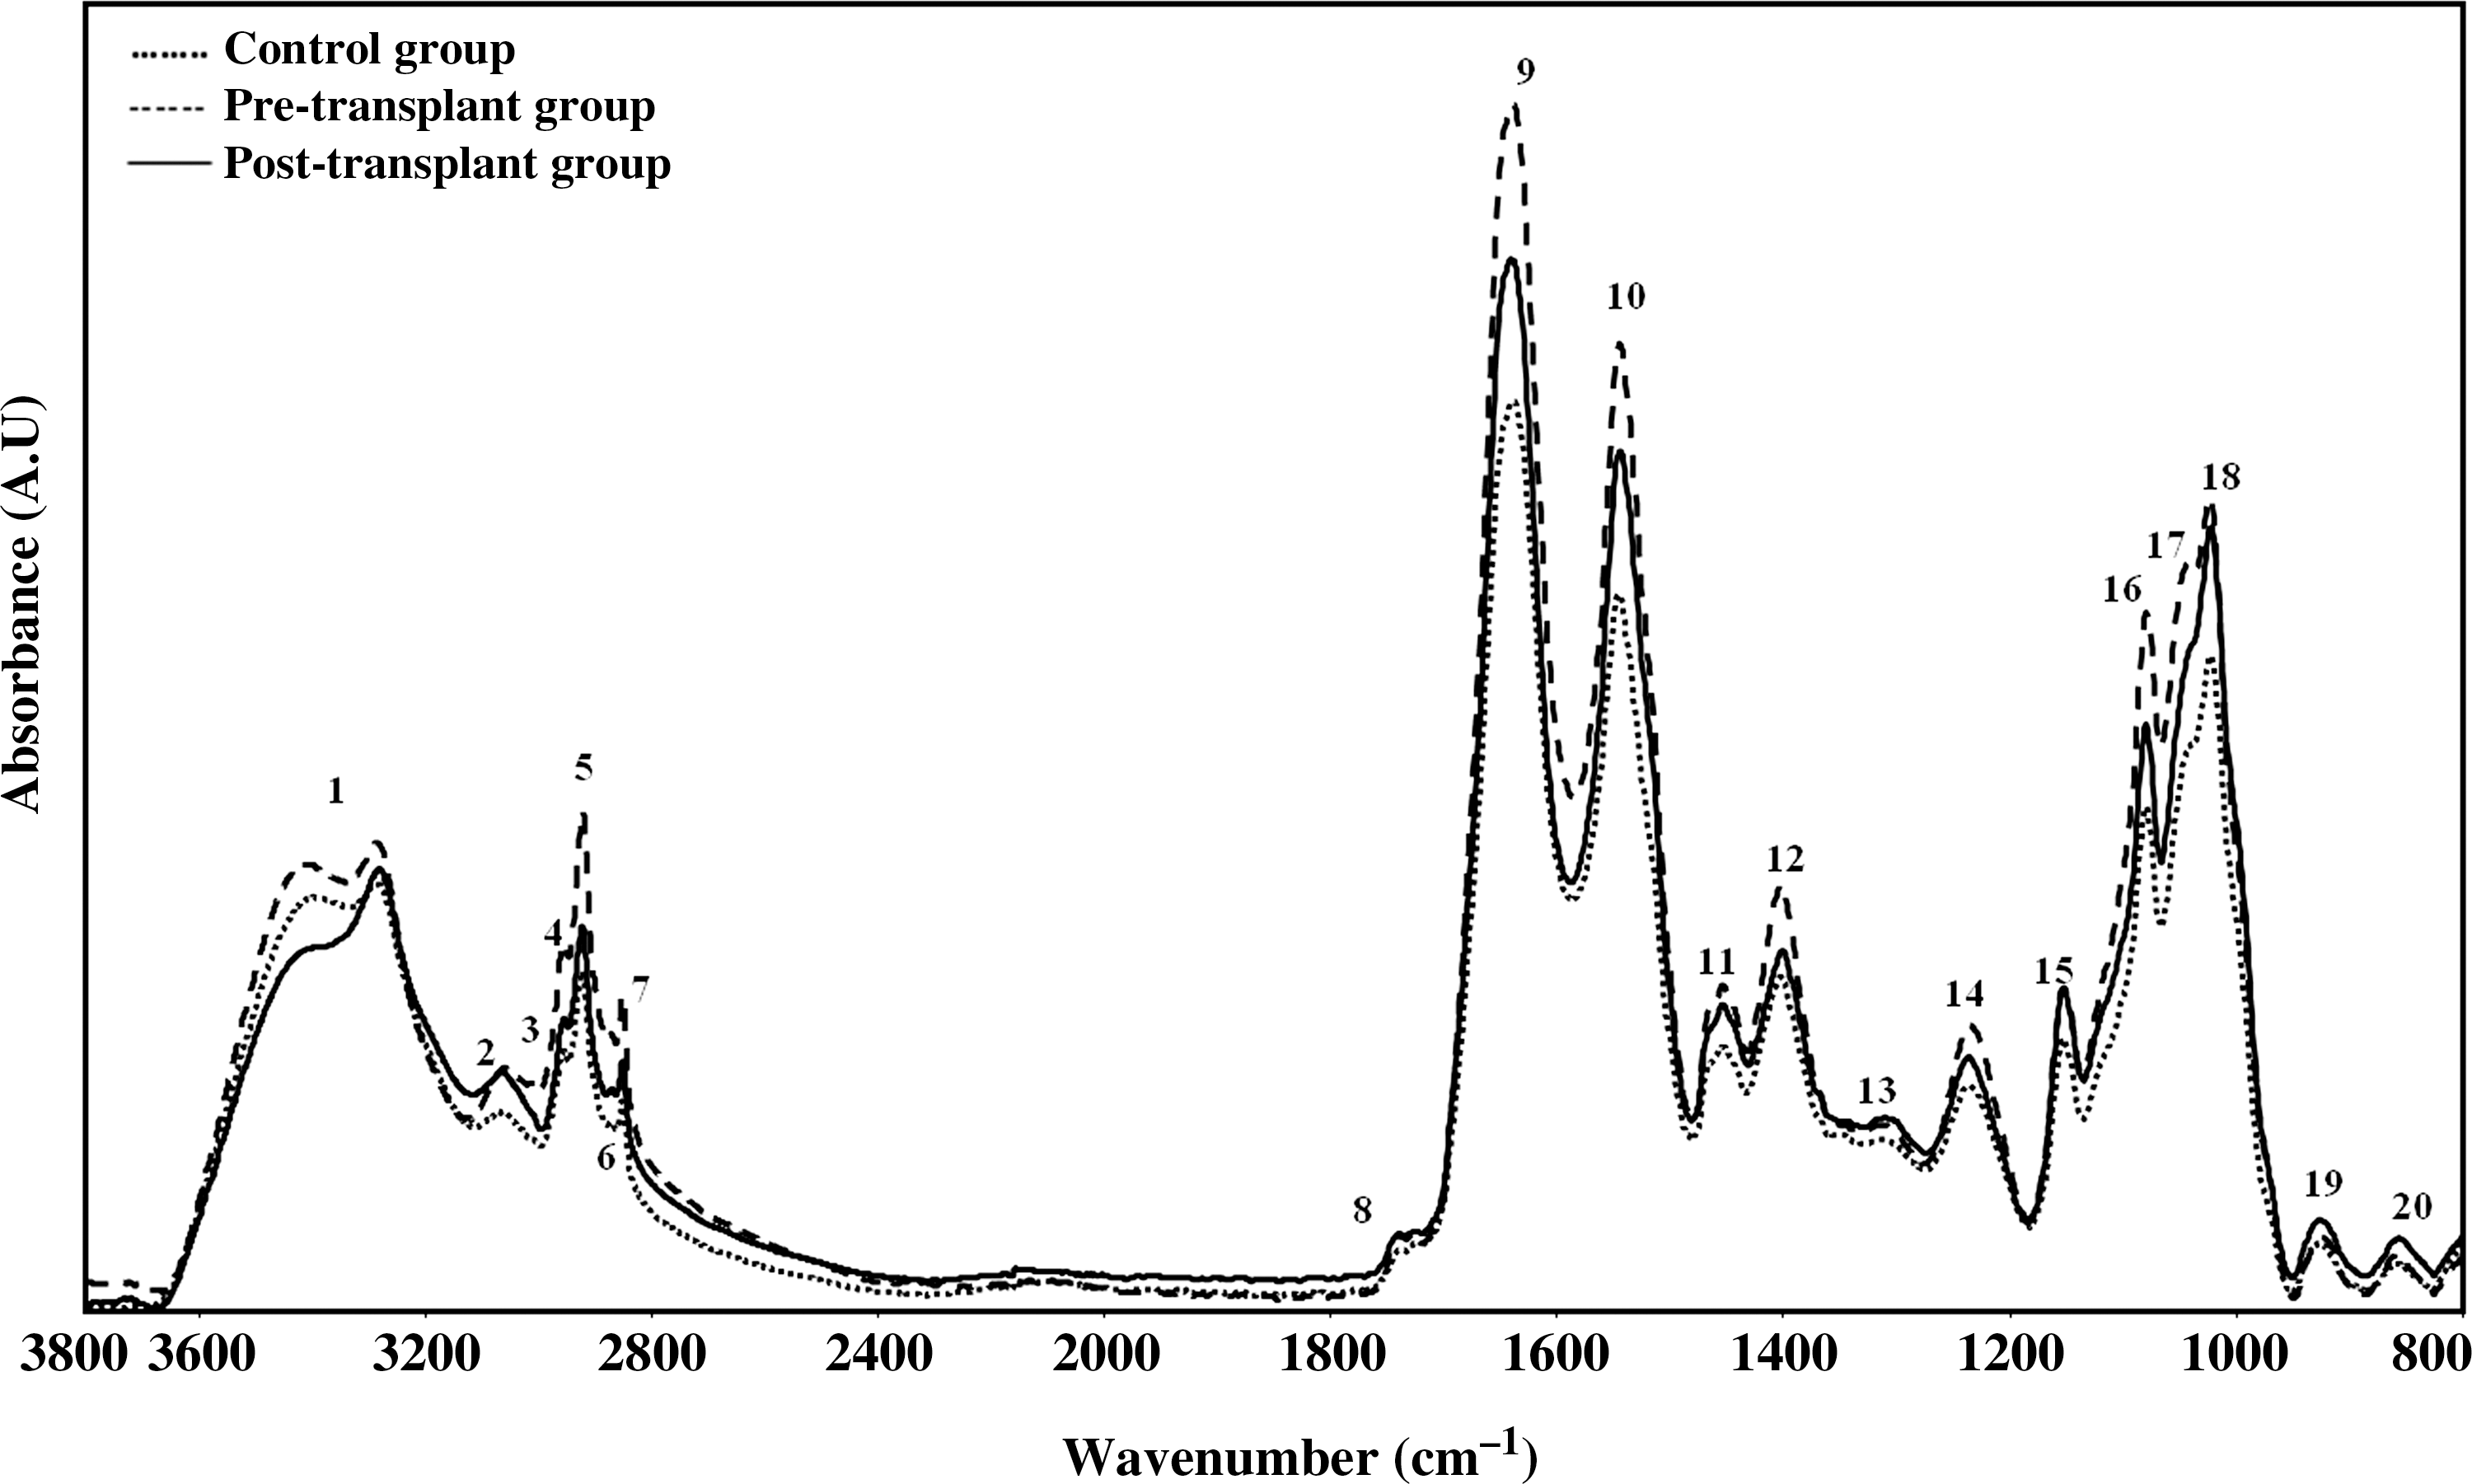
The representative average spectra of control
The band area values are the mean±standard error of mean for each group. Comparison was performed by the Tukey's multiple comparison test. Downward arrow indicates a decrease and upward arrow indicates an increase.
The degree of significance with respect to the control group that was denoted as P<0.05.
The degree of significance with respect to the control group that was denoted as P<0.01.
The degree of significance with respect to the control group that was denoted as P<0.001.
The degree of significance with respect to the pre-transplant group that was denoted as P<0.05.
The degree of significance with respect to the pre-transplant group that was denoted as P<0.01.
The values are the mean±standard error of mean for each group. Comparison was performed by the Tukey's multiple comparison test. Downward arrow indicates a decrease and upward arrow indicates an increase.
The degree of significance with respect to the control group that was denoted as P<0.05.
Figure 2 represents the deconvolved and normalized FTIR spectra of BM-MSCs of control, pre-transplant, and post-transplant groups in the 3050–2800 cm−1 region. This region is called as CH region since it consists of spectral bands arising from CH stretching vibrations of olefinic=CH, CH2 and CH3 groups of lipids. The olefinic band at 3010 cm−1 due to the CH stretching mode of the HC=CH groups were used to examine the level of unsaturation in the lipid acyl chains [33,34]. As shown in Table 2, a significant increase in the area of this band represented the increase in the amount of unsaturation in the acyl chains of lipid molecules in pre-transplant BM-MSCs with respect to the control BM-MSCs. The olefinic band area of the pre-transplant BM-MSCs was also significantly higher than the post-transplant BM-MSCs. The increase in olefinic band area of in biological systems is attributed to the increase in unsaturated lipid synthesis [17,35,36]. The unsaturated fatty acids are known to have an important role in cell proliferation by exerting growth-supporting ability [37]. The area of CH2 antisymmetric and CH2 symmetric stretching bands, originating from saturated lipid acyl chains, were significantly (P<0.05) higher in the pre-transplant BM-MSCs with respect to the control BM-MSCs. Following BMT therapy, area values of these bands showed a tendency to decline toward the control BM-MSCs. The results belonging to increase in saturated lipid concentration were also supported by the increase in the area of CH2 bending vibrations of lipids at 1453 cm−1 [38,23] and COO− symmetric stretching vibrations of fatty acid side chains at around 1400 cm−1 [39 –41] (Table I2). The increased saturated and unsaturated lipid contents may indicate an increase in lipid synthesis in cells as a result of increased cellular proliferation. It is known that in β-TM an excess of α-globin chains accumulates in progenitor erythroid cells leading to premature death of late erythroid progenitors in bone marrow. This results in profound anemia leading to dramatic increase in EPO levels that stimulate uncontrolled proliferation of erythroid progenitors contributing to massive erythropoiesis [42,43]. Erythroid progenitors with an enhanced proliferation and survival capacity and lacking the ability to synthesize normal hemoglobin induce the process called ineffective erythropoiesis (IE) that is the main characteristic of β-TM. IE is characterized by increased EPO and GDF 15 levels in BM. GDF15 has a role in regulating inflammatory and apoptotic pathways during disease conditions. GDF-15 is overexpressed in IE during β-TM due to its important role in controlling differentiation, proliferation, and death of erythroid precursors [42 –45]. We hypothesized that the enhanced proliferation of erythroid progenitors in the thalassemic bone marrow during IE may induce adaptive changes in BM-MSCs. ATR-FTIR results showed an increase in the synthesis of unsaturated and saturated lipids in thalassemic BM-MSCs. That finding may be attributed to increased cell proliferation, which was stimulated by such cellular interactions between erythroid progenitor cells and BM-MSCs in thalassemic bone marrow niche. Therefore, EPO and GDF 15 levels in plasma samples of pre- and post-transplant thalassemia patients and healthy donors were used to support ATR-FTIR spectroscopy data. EPO levels were significantly higher in thalassemic patients before transplantation (44.910±12.270) (P<0.01) when compared with healthy donors (0.706±0.706). However, EPO levels decreased significantly (10.710±2.129) (P<0.05) following BMT therapy with respect to the pre-transplant patients (44.910±12.270). ELISA results of GDF 15 in bone marrow plasma samples showed similar alterations with EPO results. GDF 15 levels of pre-transplant patients were significantly higher (1466±407) (P<0.01) with respect to controls (104.2±18.51). On the other hand, a significant decrease was measured in GDF 15 levels of post-transplant patients (777.5±275.9) (P<0.05) after BMT therapy with respect to pre-transplant patients (1466±407) (P<0.01). The higher EPO and GDF 15 levels in bone marrow plasma samples of β-TM patients before and after BMT therapy may indicate increased cellular activity as a response of bone marrow microenvironment to IE that can be induced by secretory functions of BM-MSCs that are the main cellular components of bone marrow microenvironment [42,43]. The significant decreases in EPO and GDF15 levels in the post-transplant group can indicate rapid adaptation of transplanted HSCs into thalassemic bone marrow microenvironment and the recovery effect of healthy HSCs on thalassemic BM-MSCs as a result of cellular interaction in BM niche. Since post-transplant bone marrow samples used in the study were obtained shortly after engraftment (between days +25 and +35), the significant changes observed in BM-MSCs toward normal values reflected very dynamic interactions between HSCs and BM-MSCs that led to a change in the abnormal host microenvironment toward normal by achievement of healthy donor erythropoiesis after BMT therapy. ATR-FTIR spectroscopy showed significant reductions both in saturated and unsaturated lipid contents of post-transplant BM-MSCs with respect to pre-transplant BM-MSCs, which reflects an adaptation of patients' BM-MSCs to recovered bone marrow microenvironment.

The representative infrared spectra of control
The shifts in the wavenumber values of the CH3 and CH2 antisymmetric and CH2 symmetric stretching bands are related to the order/disorder states of membrane lipids [46,47]. There was a tendency toward decreased band wavenumber of CH3 antisymmetric stretching bands in both pre- and post-transplant BM-MSCs with respect to the control BM-MSCs. These results implied an increase in the order of the deep interior part of the fatty acyl chains [48] of thalassemic BM-MSCs. The peak positions of CH2 antisymmetric and symmetric stretching bands give information about the chain flexibility of fatty acids, which also reflects the order of the membrane structures [46,49]. A significant decrease was also observed in the wavenumber values of CH2 antisymmetric stretching band of pre- and post-transplant MSCs (Table 3). These results indicated an increase in the number of trans-conformers of lipid molecules, which reflects higher lipid order and decreased acyl chain flexibility [50]. The mechanical properties of mammalian cells have been investigated in previous studies due to the strong involvement of the cell membrane in numerous cell functions such as adhesion, cell proliferation, differentiation, motility, and interactions with their microenvironment via signaling and metabolite traffic [51 –53]. Active and dynamic structure of cell plasma membrane provides specific cell shape [53], which is affected by alterations in the lipid order [54]. Therefore, an increase in the order of membrane lipids in thalassemic BM-MSCs can affect membrane thickness and cell shape, which are important characteristics of the stem cell membrane in mediating dynamic interactions with cellular microenvironment and external stimuli, particularly during bone marrow remodeling in disease conditions [53,55].
The fingerprint region between 1800 cm−1 and 800 cm−1 contains vibrational modes of several different functional groups. Figure 3 shows the 1800–800 cm−1 region of normalized FTIR spectra of the study sampling groups. The bands located at 1639 cm−1 and 1545 cm−1 are assigned to C=O stretching and N–H bending (amide 1); N–H bending and C–N stretching (amide 2) vibrational modes of structural proteins, respectively. The shifts in the area and wavenumber values of these bands were used to monitor changes in protein content and structure [56,57]. The band area of amide 1 was significantly increased significantly in pre-transplant BM-MSCs (P<0.05) with respect to control BM-MSCs. The area of amide 2 mode was significantly higher in both the pre-transplant (P<0.001) and post-transplant BM-MSCs (P<0.01) when compared with the control BM-MSCs. Increased total protein content was supported by the significant increase in the area of the band located at about 1310 cm−1, which is assigned to peptide side chain vibrations [58]. The band area results of different functional groups are listed in Table 2. ATR-FTIR spectroscopy data showed an increases in the area of amide 1 and amide 2 bands of thalassemic BM-MSCs according to control BM-MSCs as results of significant increases in protein synthesis. These increases were more prominent in pre-transplant BM-MSCs than post-transplant BM-MSCs. This finding was attributed to reduction in total protein content and protein biosynthesis after BMT therapy. Previous studies in the literature for protein accumulation in β-TM mainly concentrated on destruction of erythroid cells due to aggregation of free α-globin and deficient hemoglobin production [43,59,60]. To the best of our knowledge, no specific investigation about protein alterations in BM-MSCs in β-TM was reported. The increase in protein concentration in thalassemic BM-MSCs may also be interpreted as the result of increased cell proliferation rate and BM activity due to ineffective erythropoiesis. Khandros et al. 2010 [60] suggested that β-TM resembles protein aggregation disorders of the nervous system, liver, and other tissues, and further information is needed to understand complex cellular interactions in the BM microenvironment.
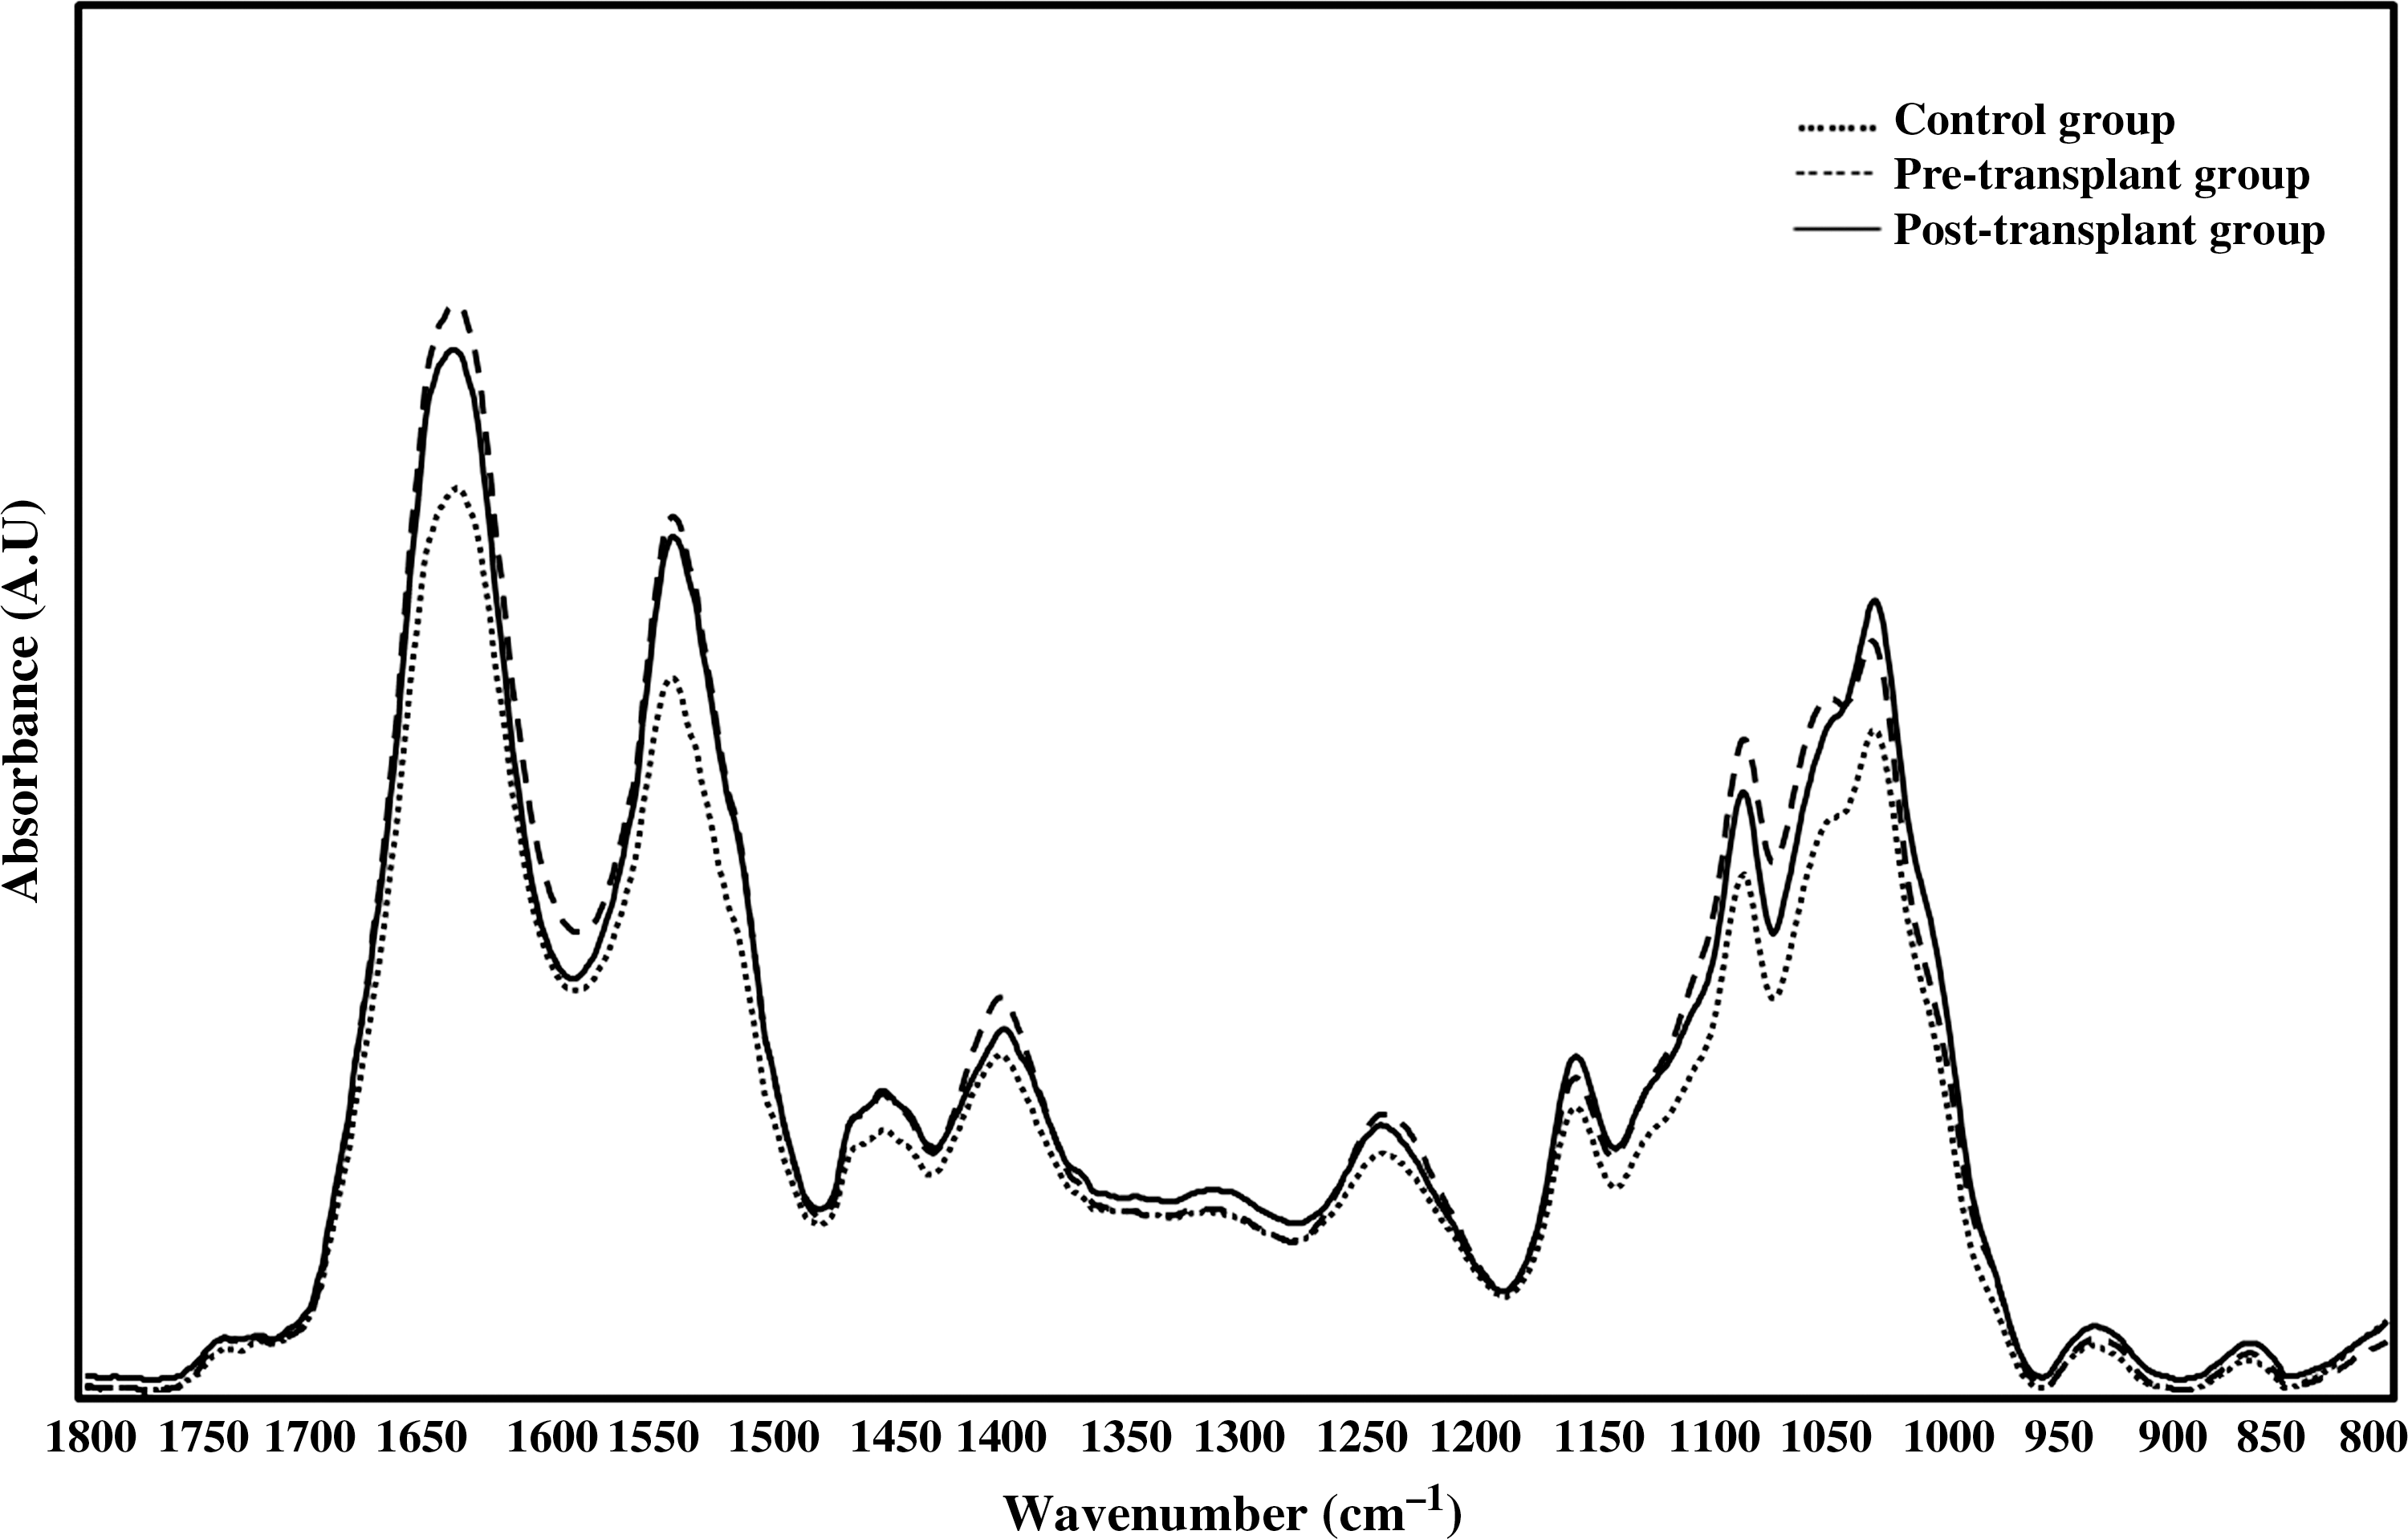
The representative infrared spectra of control
The change in lipid to protein ratio was calculated by taking the ratio of the peak area value of the CH2 antisymmetric stretching band (2924 cm−1) to the amide 1 (1639 cm−1) band. The ratio was significantly higher (P<0.05) in the pre-transplant BM-MSCs with respect to control BM-MSCs (Table 3). This means that the increase in lipid concentration was more profound than the increase in protein concentration in thalassemic BM-MSCs [61]. Thus it may be suggested that the increase in BM activity deeply affected lipid metabolism in thalassemic BM-MSCs, more than it affected protein metabolism.
In order to detect changes in glycogen content in BM-MSCs, the area of 3 main bands located at 1152 cm−1, 1045 cm−1, and 1025 cm−1 were measured. The band at 1152 cm−1 is originated from antisymmetric stretching mode of the COOC groups present in glycogen and nucleic acids [40]. The bands located at 1045 cm−1 and 1025 cm−1 are attributed to the vibrational frequency of CH2OH groups and the CO stretching frequencies of the COH groups of carbohydrates including glucose, fructose, glycogen, etc. [62]. Significant increases in the area of these bands in pre-transplant BM-MSCs (P<0.001) and also post-transplant group BM-MSCs (P<0.001) revealed an enhanced glycogen and carbohydrate concentrations in thalassemic BM-MSCs regarding to the control BM-MSCs (Table 2). The area ratio of the bands located at 1045 cm−1 and 1545 cm−1 gives an estimate of the carbohydrate levels including glucose, fructose, and glycogen etc. in the cells [62]. Increase in glycogen content in thalassemic BM-MSCs was also supported with an increase in the ratio 1045 cm−1 to 1545 cm−1 (Table 3). These results were explained by the increase in glycogen synthesis. Existing studies showed that glycogen is used as an alternative energy source in metabolic stress conditions of diseases like cancers to enable cellular growth [58,63,64]. Significant increases in glycogen content in thalassemic BM-MSCs with respect to healthy controls may support the increase in the content of other macromolecules as a result of enhanced cell proliferation in the thalassemic bone marrow microenvironment.
The alterations in nucleic acid content in the cells were evaluated by considering the changes in the areas of bands located at 1234 cm−1 and 1080 cm−1. Antisymmetric phosphate stretching vibrations at 1234 cm−1 mainly arise from nucleic acids, while symmetric-phosphate stretch at 1080 cm−1 assigns C-O skeletal stretching vibrations from nucleic acid sugars and C-O-P stretching vibrations of phosphorylated lipids [65]. As it was given in Table 2, ATR-FTIR study results showed significant increases in the band area values of the mentioned bands in pre-transplant and post-transplant group BM-MSCs with respect to the control BM-MSCs. In order to support these results, we also investigated changes in the area of the band at 925 cm−1, which is assigned as a Z type DNA [66]. The area of this band was found to be increased significantly in pre-transplant (P<0.01) and post-transplant (P<0.05) group thalassemic BM-MSCs when compared with the control BM-MSCs. Such increases in nucleic acid content may be resulting from increased proliferation activity of thalassemic BM-MSCs that was induced by ineffective erythropoiesis in thalassemic BM microenvironment as discussed above.
The global increases in the concentrations of different macromolecules in thalassemic BM-MSCs with respect to the healthy controls were interpreted as a reflection of increased cell proliferation activity, which was also supported by MTT proliferation assay. This assay is based on the cleavage of the yellow MTT [3-(4,5-dimethylthiazol-2-yl)-2,5-diphenyltetrazolium bromide, a tetrazole] salt to purple formazan crystals in the mitochondria of metabolically active and highly proliferative viable cells. The crystals can be dissolved in MTT solvents such as acidified SDS or acidified isopropanol. When the final purple solution is spectrophotometrically measured, an increase in the absorbance reflects an increase in the amount of MTT formazan formed as a result of an increase in cell number [67]. The results of MTT proliferation assay, given in Table 4, showed that the proliferation activity in thalassemic BM-MSCs was significantly higher than control BM-MSCs and the activity was still higher than controls in the post-transplant samples with values closer to controls. These findings were in agreement with the ELISA assay results of EPO and GDF-15 in bone marrow plasma. Such an increased proliferation activity was the clue to explain higher concentration of macromolecules in thalassemic BM-MSCs than healthy control BM-MSCs.
The values are the mean±standard error of mean for each group. Comparison was performed by the Tukey's multiple comparison test. The upward arrow indicates an increase.
The degree of significance with respect to the control group that was denoted as P<0.05.
In the present study, chimerism analyses were performed to determine whether BM-MSCs were of recipient or donor origin by amplifying 15 STR loci in genomic DNA. Post-transplant DNAs of BM-MSCs of all 5 patients were obtained between +25 and +35 days after transplantation, and they were used in chimerism tests by comparing pre-transplant DNA of patients and DNA of donors. Our chimerism test results showed that there was complete donor type hematopoietic engraftment in patients' bone marrows after transplantation while MSCs were of completely recipient (patient) origin. The results of chimerism analysis revealed that BM-MSCs of all 5 patients were of 100% recipient origin, while there were between 95% and 99% donor type HSCs engraftment in their bone marrow after transplantation. Chimerism testing following transplantation is important to monitor the engraftment of donor stem cells and it was clear that +25 and +35 days after the engraftment period there was full interaction between transplanted healthy donor HSCs and patient's BM-MSCs. This engraftment time was enough to provide full cellular interactions between HSCs-MSCs to observe the healing of disease related alterations in patient's bone marrow. In summary, we found that BM-MSCs isolated from recipients of allogenic bone marrow transplantation therapy were not of donor genotype, despite successful donor type hematopoietic engraftment in a short engraftment time. Our results can be supported by previous chimerism studies in the literature that were published by Rieger et al. [68], Villaron et al. [69], and Koc et al. [70]. These studies showed that MSCs remained of host origin (patient origin) even a long time after allogenic BMT therapy, while donor chimerism was achieved in HSCs. In the present study relatively early passage MSCs (P3 cells) were used in order to preserve the properties of BM-MSCs that were gained as a result of the recovery effect of HSC-MSC interactions after engraftment period. Therefore, BM-MSCs preserved their characteristics in in-vitro culture conditions till they were investigated by ATR-FTIR spectroscopy.
Finally, in the current study, hierarchical cluster analysis was performed to compare the control, pre-transplant, and post-transplant groups' BM-MSCs based on their spectral differences in the region between 3050 and 2800 cm−1. The results of cluster analysis are shown in Fig. 4. As seen from the dendogram, all samples were successfully distinguished. The high heterogeneity value implied that there were important macromolecular alterations among control, pre-, and post-transplant group BM-MSCs. These results revealed that the spectral changes obtained from ATR-FTIR spectroscopy can be successfully determined by cluster analysis.
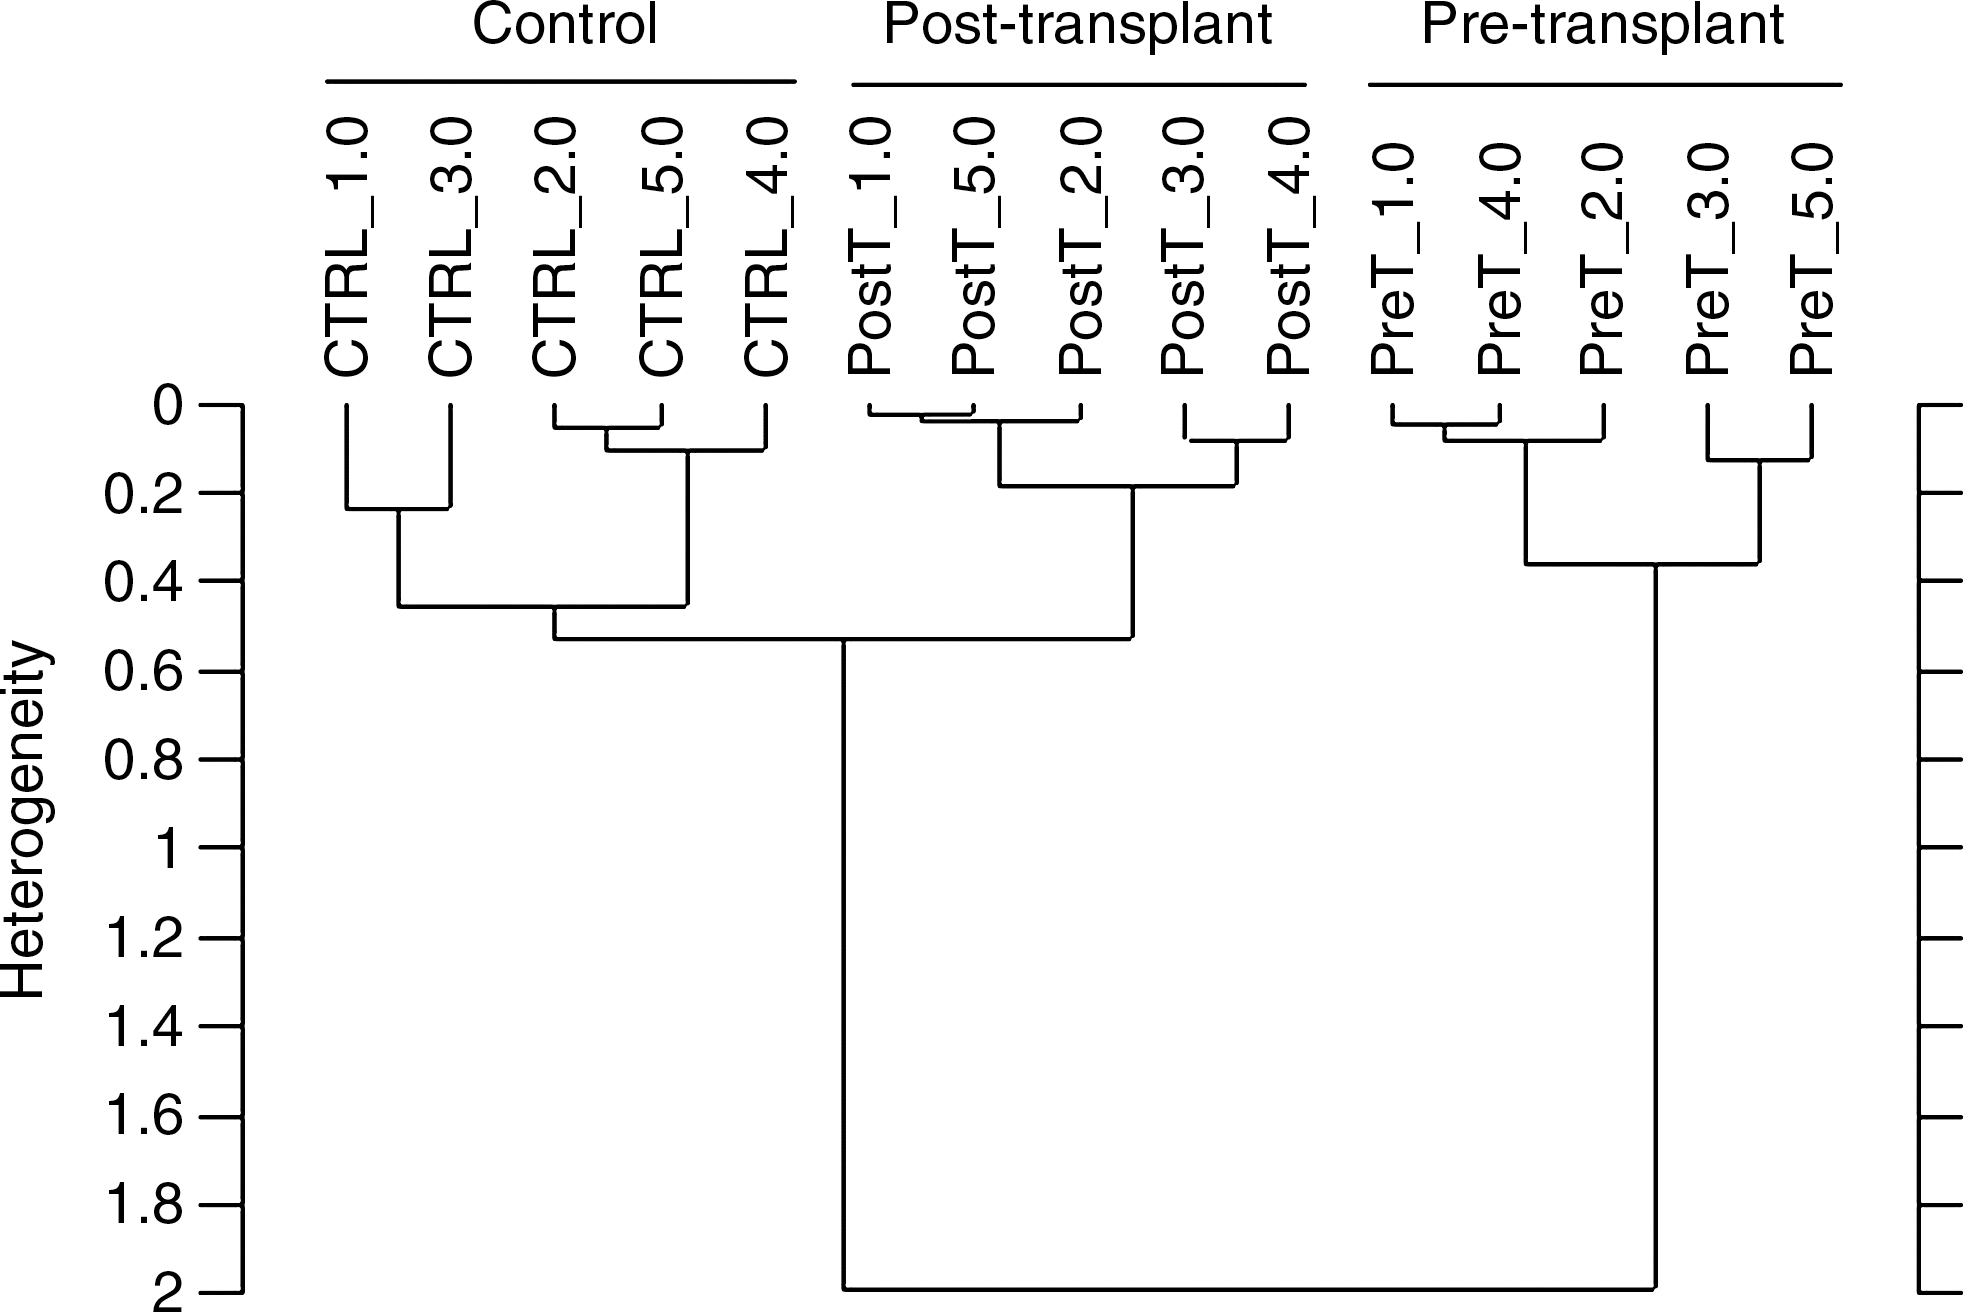
Hierarchical cluster analysis performed on the first derivative and vector normalized spectra of control, pre- and post-transplant group BM-MSCs and resulting from Ward's algorithm. The study was conducted in the 3050–2800 cm−1 spectral region.
Conclusion
In summary, our results showed that β-TM had significant influence on the structure and the content of macromolecules and secretory functions of BM-MSCs, while it did not affect the main properties used for definition of BM-MSCs. BM-MSCs of thalassemic patients and healthy donors showed similar morphology under inverted light microscopy. Their expression profile for CD105, CD90, and CD73 surface antigens and differentiation potential into osteoblasts and adipocytes were also similar. The spectral results revealed that saturated and unsaturated lipids, protein, glycogen, and nucleic acid contents were significantly increased in thalassemic BM-MSCs. Lipid order in the cell membrane also increased in thalassemic BM-MSCs. These findings suggested that increases in the content of macromolecules can be attributed to the increase in the cell proliferation activity during ineffective erythropoiesis in thalassemic bone marrow. The levels of EPO and GDF 15 and the results of MTT proliferation assay were used to support ATR-FTIR results and to determine the degree of IE. The decreases in the contents of macromolecules, EPO and GDF15 levels, and MTT proliferation assay results in post-transplant BM-MSCs with respect to pre-transplant BM-MSCs can be interpreted as reduced abnormal erythropoiesis because of restoring effect of BMT therapy on hematopoiesis, which secondarily leads to normalization of abnormal host microenvironment as well. Such a restoring effect can be used to study HSCs-BM-MSCs dynamic interactions in the bone marrow microenvironment.
The current ATR-FTIR spectroscopy study together with hierarchical clustering is the first study to show the global alterations in structure and function of macromolecules of characterized BM-MSCs due to the pathological disease condition of beta thalassemia major. Our results not only show the differences between healthy and thalassemic BM-MSCs, but also provide better understanding of the in-vivo cell-to-cell interactions between HSCs and BM-MSCs by evaluating and comparing the changes belonging to thalassemic BM-MSCs before and after BMT therapy. Therefore, this study is the first model study that will contribute to future studies performed to investigate cellular interactions in the bone marrow microenvironment.
Footnotes
Acknowledgments
The study was supported by METU internal funds and also was supported by Hacettepe University PEDI-STEM Project funds (Project No: 2006 K 120 640).
Author Disclosure Statement
No competing financial interests exist.