
Abstract
Previous studies indicated that bone marrow mesenchymal stem cells (BMSCs) from patients with systemic lupus erythematosus (SLE) exhibited impaired capacities of proliferation, differentiation, secretion of cytokines, and immune modulation. In this study, we aimed to investigate whether apoptosis and senescence of SLE BMSCs were dysregulated. We found that there were increased frequencies of apoptotic and aging SLE BMSCs in comparison with those of normal controls. Notably, levels of Bcl-2 expression in SLE BMSCs were markedly decreased both at mRNA and protein levels. When BMSCs were induced to apoptosis by tumor necrosis factor-α (TNF-α) stimulation in vitro, the Bax and caspase 8 expression in SLE BMSCs was significantly increased at mRNA levels. The activity of caspase 8 was also enhanced in SLE BMSCs. More cytochrome-C-positive pellets in the cytosolic fraction of BMSCs were detected in SLE patients than in normal controls. The expression of Fas and tumor necrosis factor-α receptor 1 in SLE BMSCs was significantly upregulated compared with normal controls, and the serum levels of FasL and TNF-α were also elevated. Moreover, intracellular reactive oxygen species levels of SLE BMSCs were higher than those of normal controls, with the activation of PI3K/AKT/FoxO3 signaling pathway. Taken together, our results demonstrate increased apoptosis and senescence in SLE BMSCs, which may be associated with the pathogenesis of SLE.
Introduction
S
It has become evident that reactive oxygen species (ROS) are involved in proliferation, migration, and differentiation of BMSCs [12]. However, intracellular ROS accumulation appears to be the main cause of the senescence of human BMSCs [13,14], and also related to the apoptosis of BMSCs [15]. Many studies have shown that FoxO3 blocked by phosphoinositide 3-kinase (PI3K)/Akt signaling pathway is one of the major factors to prevent ROS accumulation by activating genes encoding the oxidative-stress-response proteins. Moreover, previous researches have elucidated that upregulation of FoxO3 during chondrogenesis was likely to be associated with BMSC survival [16].
Apoptosis is also induced by other stimuli that activate 2 major cell death signaling pathways, that is, the intrinsic and extrinsic pathways [17, 18]. The intrinsic pathway (or mitochondrial pathway) involves the translocation of Bax from the cytosol to the mitochondria, which results in the release of proteins, such as cytochrome C, from the intermembrane space of mitochondria. Alterations of mitochondrial membrane proteins, such as Bcl-2, are also involved in the intrinsic pathway. In the death receptor (DR) or extrinsic pathway, specific cell surface receptors, including Fas and the tumor necrosis factor-α receptor 1 (TNFR1), trigger a cascade of caspase activation. Among them, caspase 8 is a common apoptotic mediator in a variety of mammalian cell types [19].
In this study, we examined the activity of senescence-associated β-galactosidase (SAβ-gal) and the frequency of apoptotic BMSCs. In addition, those proteins related to apoptotic regulation, including Bcl-2, Fas, TNFR1, cytochrome C, and caspase 8, were investigated. We also detected intracellular ROS levels and related regulatory PI3K/AKT/FoxO3 signaling pathway.
Materials and Methods
Recruitment of SLE patients
Ten female SLE patients, aged 19 to 51 years (mean 34.0±8.7 years), were enrolled in the study. All fulfilled the diagnostic criteria of SLE proposed by the American College of Rheumatology [20]. Ten female healthy donors served as normal controls, aged 30 to 57 years (mean 39.0±7.0 years). The study was approved by the Ethics Committee at The Drum Tower Hospital of Nanjing University Medical School and registered at ClinicalTrials.gov (Identifier: NCT00698191). Informed consent was obtained from each patient and healthy donor.
Isolation, cell culture, and identification of BMSCs
BMSCs were isolated and expanded from iliac crest bone marrow of all the SLE patients and normal controls. Ten microliters of heparinized bone marrow were mixed with an equal volume of phosphate-buffered saline (PBS). Then, the resuspended cells were layered over 1.077g/mL Ficoll (TBD) solution and centrifuged at 600 g for 30 min at room temperature. The mononuclear cells were collected at the interface and resuspended in low-glucose Dulbecco's modified Eagle's medium (L-DMEM) (Gibco) supplemented with 10% heat inactivated fetal bovine serum (Invitrogen) and 1% antibiotic-antimycotic solution. Then, the cells were plated at a density of 2×10⁷ cells per 25 cm2 dish and cultured at 37°C in a 5% CO2 incubator, and the medium was changed after 48 h and then every 3 days. When the BMSCs were confluent, the cells were recovered by the addition of 0.25% trypsin–ethylenediaminetetraacetic acid (Gibco); they were then replated at a density of 1×10⁶ cells per 25 cm2 dish. Passage 4 BMSCs were harvested. Flow cytometric (FCM) analysis confirmed that the cells expressed CD105, CD44, and CD29 >95%, in parallel with CD14, CD34, CD45, and HLA-DR expression of <5% (Supplementary Fig. S1; Supplementary Data are available online at
FCM analysis for cell apoptosis
The Annexin V-FITC/PI Apoptosis Detection Kit (Becton Dickinson) was employed to evaluate the apoptosis of passage 4 BMSCs from 8 SLE patients and 8 normal controls by using FCM analysis. After being washed with ice-cold PBS, 1×10⁵ cells were resuspended in 100 μL of binding buffer. Five microliters of Annexin V and 5 μL of propidium iodide (PI) were added to the cells. After incubation for 15 min (25°C) in the dark, 400 μL of 1×binding buffer was added to each tube and FCM analysis was performed immediately. Data acquisition and analysis were assayed by BD LSRII analyzer (Becton Dickinson) using “CellQuest” software. Annexin V (+) and PI (−)/PI (+) cells were considered as apoptotic cells.
Senescence-associated β-galactosidase assay
BMSCs from 3 SLE patients and 3 normal controls were passaged into 6-well culture plates at a density of 5×10⁴ cells per well. After 72 h, senescence-associated SAβ-gal was assayed at pH 6.0 as described in assay instructions (CHEMICON). Briefly, cells were washed twice with PBS, and fixed into the wells using 1 mL 1×fixing solution per well, and then incubated at room temperature for 15 min. Following washing with PBS, cells were then incubated in freshly prepared staining SAβ-gal detection solution at 37°C without CO2 and protected from the light for about 18 h. The percentage of senescent cells was obtained by counting the number of blue-stained cells and the total cells per field under a light microscope.
FCM analysis for Bcl-2 and caspase-8 activities
FCM analysis was performed on passage 4 BMSCs from 8 SLE patients and 8 normal controls in this experiment according to manufacturer's protocol. Phycoerythrin-labeled anti-human B cell leukemia/lymphoma 2 (Bcl-2) (Bioscience) was used. The activity of caspase-8 was measured by GaspGLOW fluorescein active caspase 8 staining kit (Biovision). BMSCs were incubated with fluorescein isothiocyanate (FITC)-conjugated z-DEVD-fmk and IFTD-fmk.
Enzyme-linked immunosorbent assay for serum levels of FasL and TNF-α
Serum samples were stored at −20°C until assayed. Serum levels of FasL and TNF-α were determined by a sandwich solid-phase enzyme-linked immunosorbent assay (Biovision) according to manufacturer's protocol. The optical density was measured in a detector (Bio-Rad) at 450 nm wavelength.
Detection of intracellular ROS levels
Intracellular ROS levels from 5 SLE patients and 5 normal controls were measured by means of an oxidation-sensitive fluorescent probe (DCFH-DA). About 1×10⁶ cells of MSCs were collected and washed twice in PBS. They were then incubated with 10 μmol/L DCFH-DA at 37°C for 20 min according to the manufacturer's instructions (Beyotiome). DCFH-DA was deacetylated intracellularly by nonspecific esterase, which was further oxidized by ROS to the fluorescent compound 2,7-dichlorofluorescein (DCF). DCF fluorescence was detected by FCM analysis when exposed to an excitation wavelength of 488 nm and emission at 535 nm.
RNA isolation and real-time polymerase chain reaction
BMSCs from 10 SLE patients and 10 normal controls in the presence or absence of TNF-α (100 ng/L) were placed in TRIzol (Invitrogen) and total cellular RNA was extracted. cDNA was synthesized using PrimerScript RT reagent Kit (TaKaRa). Glyceraldehyde phosphate dehydrogenase (GAPDH) was regarded as the house-keeping gene. All primers were designed by using the Primer Express 2.0 Software (Applied Biosystems), synthesized by Takara Corp. (Shanghai), and the sequences are shown in Table 1.
Real-time polymerase chain reaction (PCR) was carried out in triplicate for each sample in 96-well plates using SYBR Green I Dye in the Applied Biosystems 7500 real-time PCR system (Applied Biosystems). Reactions were performed in a 20 μL reaction volume and cycling times and temperatures were as follows: initial denaturation was carried out for 10 s at 95°C, followed by 45 cycles of denaturation at 95°C for 5 s and combined primer annealing/extension at 60°C for 34 s. Data were analyzed using SDS software, version 2.0 (Applied Biosystems). The ΔCT value was determined by subtracting the GAPDH CT value from the target gene CT value. Relative gene expression was calculated as 2 − (ΔCT each − ΔCT mean), where ΔCT each=ΔCT value of each sample and ΔCT mean=mean ΔCT values of normal controls.
Protein extraction and western blot analysis
BMSCs from 3 SLE patients and 3 normal controls were harvested and centrifuged at 500 g for 10 min at 4°C after 6 days of culture. The pellets were resuspended in lysis buffer for 30 min, and then centrifuged at 14,000 g for 10 min at 4°C. The supernatants were collected and quantified with Bradford Protein assay.
To analyze protein levels, supernatants with equal amounts of proteins were mixed with 5×sodium dodecyl sulfate (SDS) sample buffer and boiled for 5 min, and then separated through 8% to 15% SDS–polyacrylamide gel electrophoresis gels. The proteins were transferred to nitrocellulose membranes by a semidry blotting system after electrophoresis. The membranes were incubated with 5% skim milk to block nonspecific binding at 4°C followed with primary antibodies, including antibodies against Fas, TNFR1, caspase 8 (Biovision), p-FoxO3, FoxO3, p-AKT, and AKT (Cell Signaling Technology). Anti-GAPDH antibody (Sigma) was used as a loading control. After being washed in Tris-buffered saline with Tween (TBST), the membranes were incubated for 2 h with horseradish-peroxidase-conjugated secondary antibody. Bands were visualized by enhanced chemoluminescence and exposed to radiography film after the membranes were washed with TBST.
Immunocytochemistry
Cells from 4 SLE patients and 5 normal controls were passaged into 6-well culture plates at a density of 5×10⁴ cells per well. After 72 h, cells were fixed with 2% paraformaldehyde buffer containing 78 mmol/L L-lysine and 10 mmol/L NaIO4 for 20 min at room temperature and washed with PBS for 3 times. Cells were then incubated in 0.3% Triton X-100 for 5 min, blocked in 10% goat serum albumin for 20 min, rinsed, and incubated for 60 min at room temperature with primary antibody against cytochrome C (Millipore). Cells were subsequently rinsed with PBS, incubated with hematoxylin-conjugated secondary antibody for 45 min at room temperature, and examined by light microscopy (Olympus).
Statistical analysis
Data analysis was performed using SPSS16.0. Categorical data were expressed as counts and continuous data as mean±standard deviation (SD). Differences between 2 groups were assessed by 2-tailed Student's t-test for parametric variables and Mann–Whitney rank test for nonparametric variables. The P-values <0.05 were considered as statistically significant in this study.
Results
Increased apoptosis and senescence in BMSCs from SLE patients
BMSCs were successfully isolated and culture-expanded from all SLE patients and normal controls. We sought to assess apoptotic cells using FCM analysis by Annexin V-FITC/PI staining at the fourth passage. Figure 1A showed a significant increase in Annexin-V-positive cells among BMSCs in SLE patients (26.2%±13.0%) compared with normal controls (3.7%±3.5%) (P<0.05, n=6). While we did not find a significant increase in apoptosis in P5 BMSCs in comparison with P4 BMSCs no matter SLE patients or normal controls (Supplementary Fig. S4).
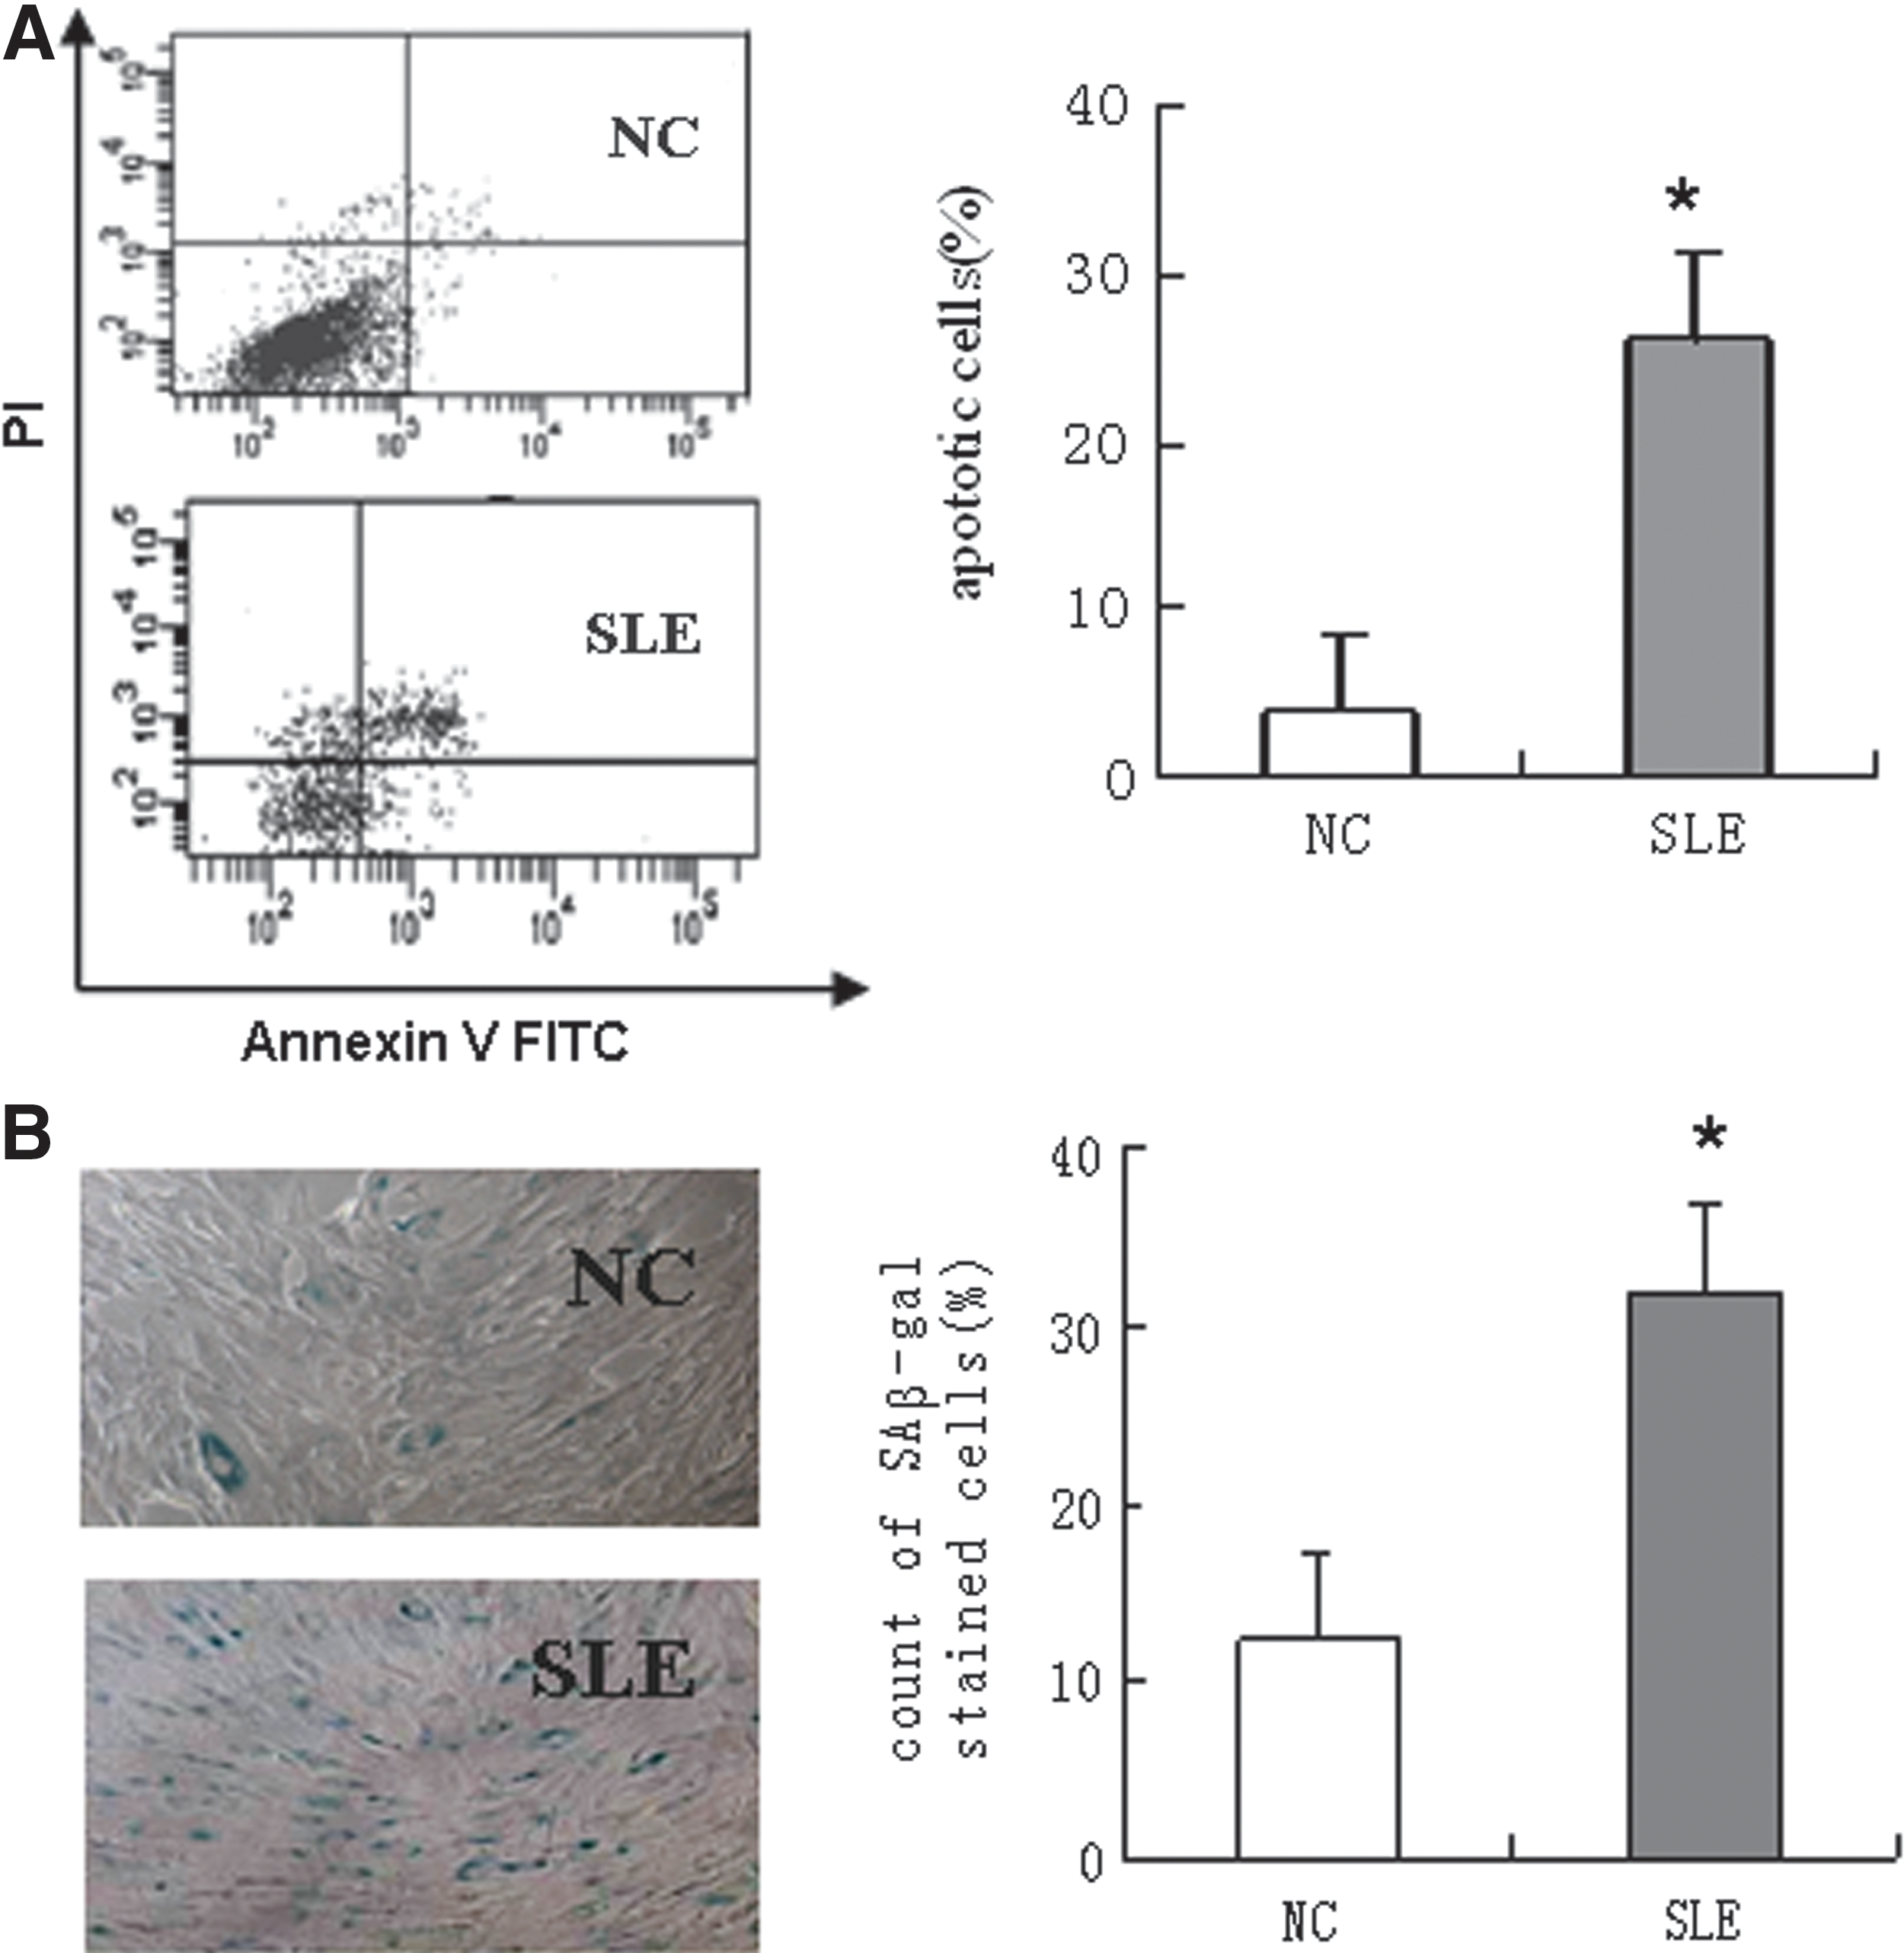
Determination of the apoptosis and senescence of BMSCs from SLE patients and normal controls. BMSCs at passage 4 were isolated and harvested from SLE patients and normal controls, and analyzed by Annexin V-FITC/PI staining. Annexin-V-positive cells were 3.7%±3.5% in normal controls and 26.2%±13.0% in SLE patients (P<0.05, n=6)
To characterize in vitro senescence, BMSCs from 3 SLE patients and 3 normal controls were monitored using the SAβ-gal assay, which is believed to be the most reliable marker of senescence. The percent of SAβ-gal-positive BMSCs from SLE patients was 31.8%±9.0%, significantly higher than that of normal control BMSCs (12.4%±0.7%) (P<0.05; Fig. 1B). However, no remarkable differences of SAβ-gal-positive cells were found in both P5 and P4 BMSCs no matter SLE patients or normal controls. In addition, increased proliferative index was shown in P5 and P4 normal BMSCs, but it was similar in the same passage BMSCs of SLE patients and normal controls (Supplementary Fig. S5).
Dysfunctional mitochondrial and DR pathway in SLE BMSCs
To investigate the change of mitochondrial pathway functions during apoptosis of SLE BMSCs, the mRNA expression of Bcl-2, Bcl-w, and Bax was measured by real-time PCR. Results revealed that the antiapoptotic factor Bcl-2 mRNA expression was significantly decreased in SLE BMSCs compared with normal controls, with or without TNF-α stimulation (P<0.05), while there were no significant differences in mRNA expression of Bcl-w and Bax between SLE patients and normal controls without TNF-α stimulation. When BMSCs were treated with TNF-α for 48 h, the mRNA expression of Bax of BMSCs significantly increased in SLE patients compared with normal controls (Fig. 2A–C). We also found that the percentage of Bcl-2-positive BMSCs, investigated by using FCM, was lower in SLE (11.0±9.1) than in normal controls (56.2%±18.5%, P<0.05) (Fig. 2D). Cytochrome C released from mitochondria into cytosol is another mitochondrial event during apoptosis. Immunostaining was performed to observe cytochrome C expression in the cytosolic fraction. The results showed that there were more cytochrome-C-positive cells in SLE BMSCs compared with normal controls (Fig. 2E).
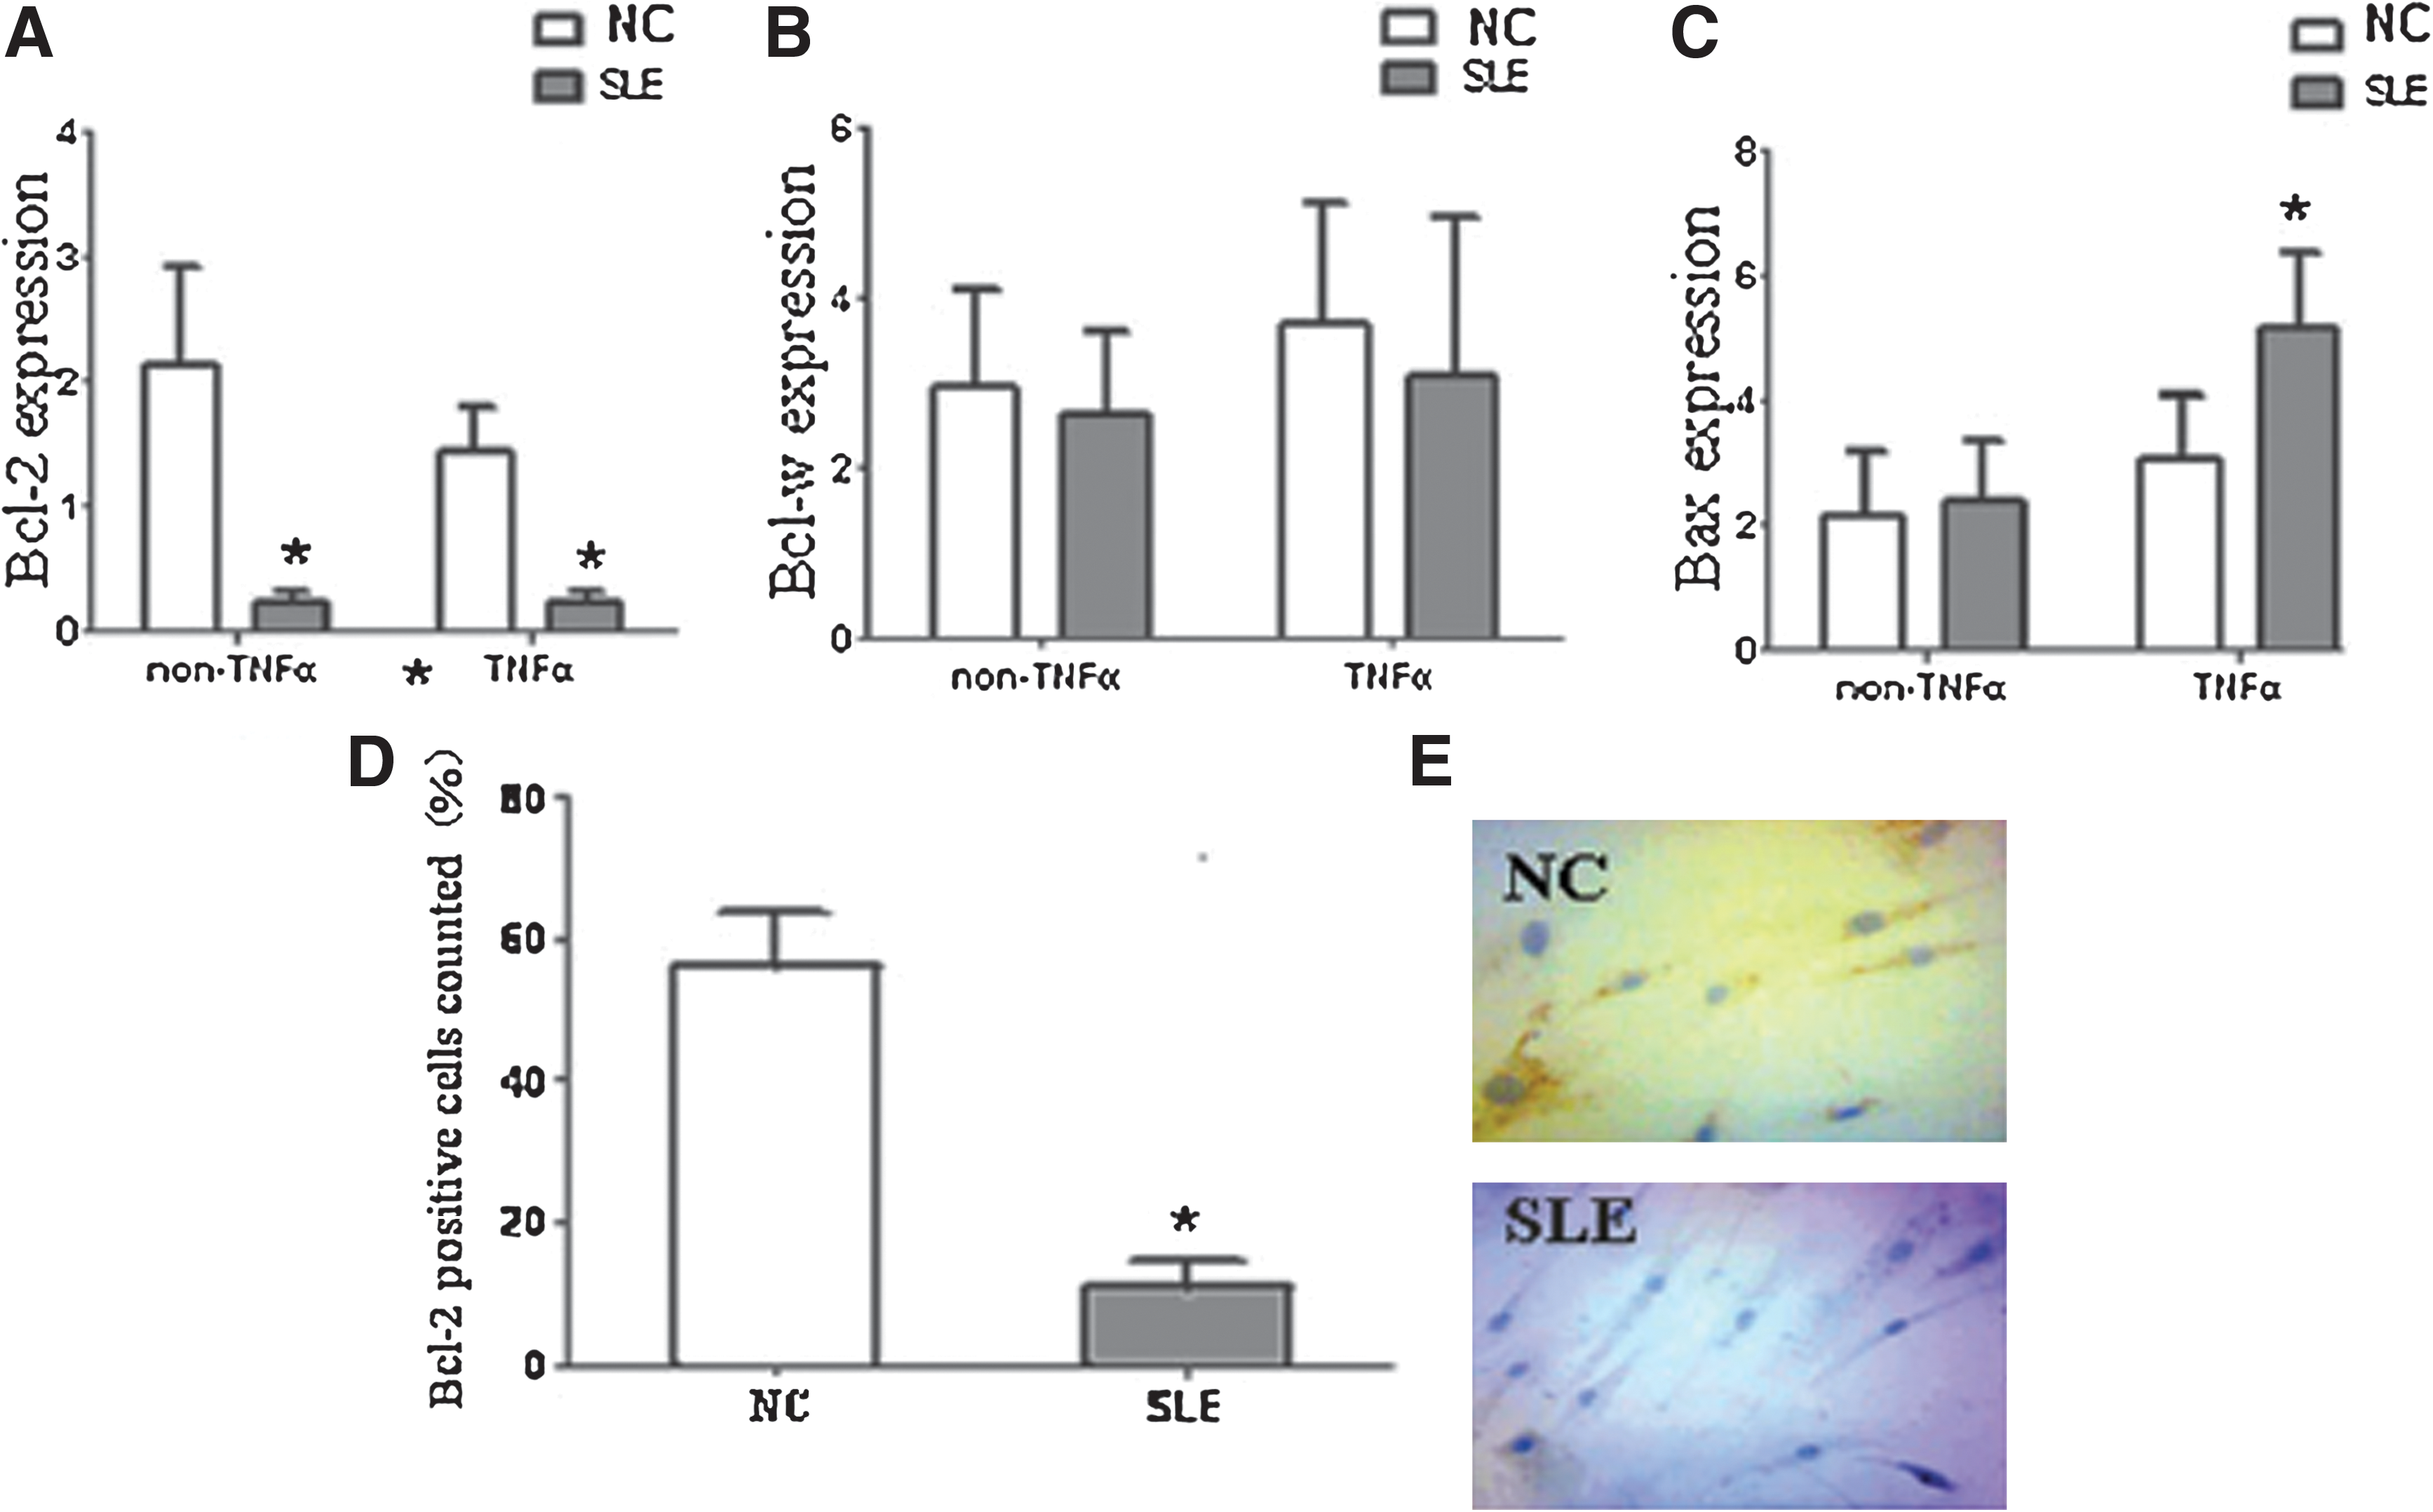
The analysis of apoptosis-related mitochondrial pathway in SLE BMSCs. Genes were evaluated by real-time PCR from 10 SLE patients and 10 normal controls, and data were shown as the mean ratio±SD of transcript levels over GAPDH. The antiapoptotic factor Bcl-2 mRNA expression was significantly decreased in SLE BMSCs compared with those in normal controls with or without TNF-α (P<0.05)
We next sought to explore whether the DR pathway was involved in apoptosis of BMSCs. In our study, the mRNA levels of Fas, TNFR1, and caspase 8 were measured, and no significant differences were seen between the 2 groups without TNF-α stimulation. When cells were treated with TNF-α for 48 h, the mRNA expression of Fas and caspase 8 significantly increased in SLE BMSCs compared with normal controls (Fig. 3A–C). However, more activation of caspase 8 by FCM analysis was observed in SLE patients (Fig. 3D), and the expression of Fas and TNFR1 was significantly higher in SLE BMSCs compared with normal controls at the protein level (Fig. 3E). Elevated serum levels of FasL and TNF-α were also found, which reflected bone marrow microenvironment (Fig. 3F, G). BMSCs from SLE and normal controls were treated with various concentrations of anti-Fas antibody (0, 5 μg/mL, and 10 μg/mL), and the results showed that apoptosis of BMSCs both in SLE and in normal controls increased in the presence of anti-Fas antibody (5 μg/mL and 10 μg/mL). However, no differences were found between SLE and normal controls when BMSCs were stimulated by anti-Fas antibody (Supplementary Fig. S6).
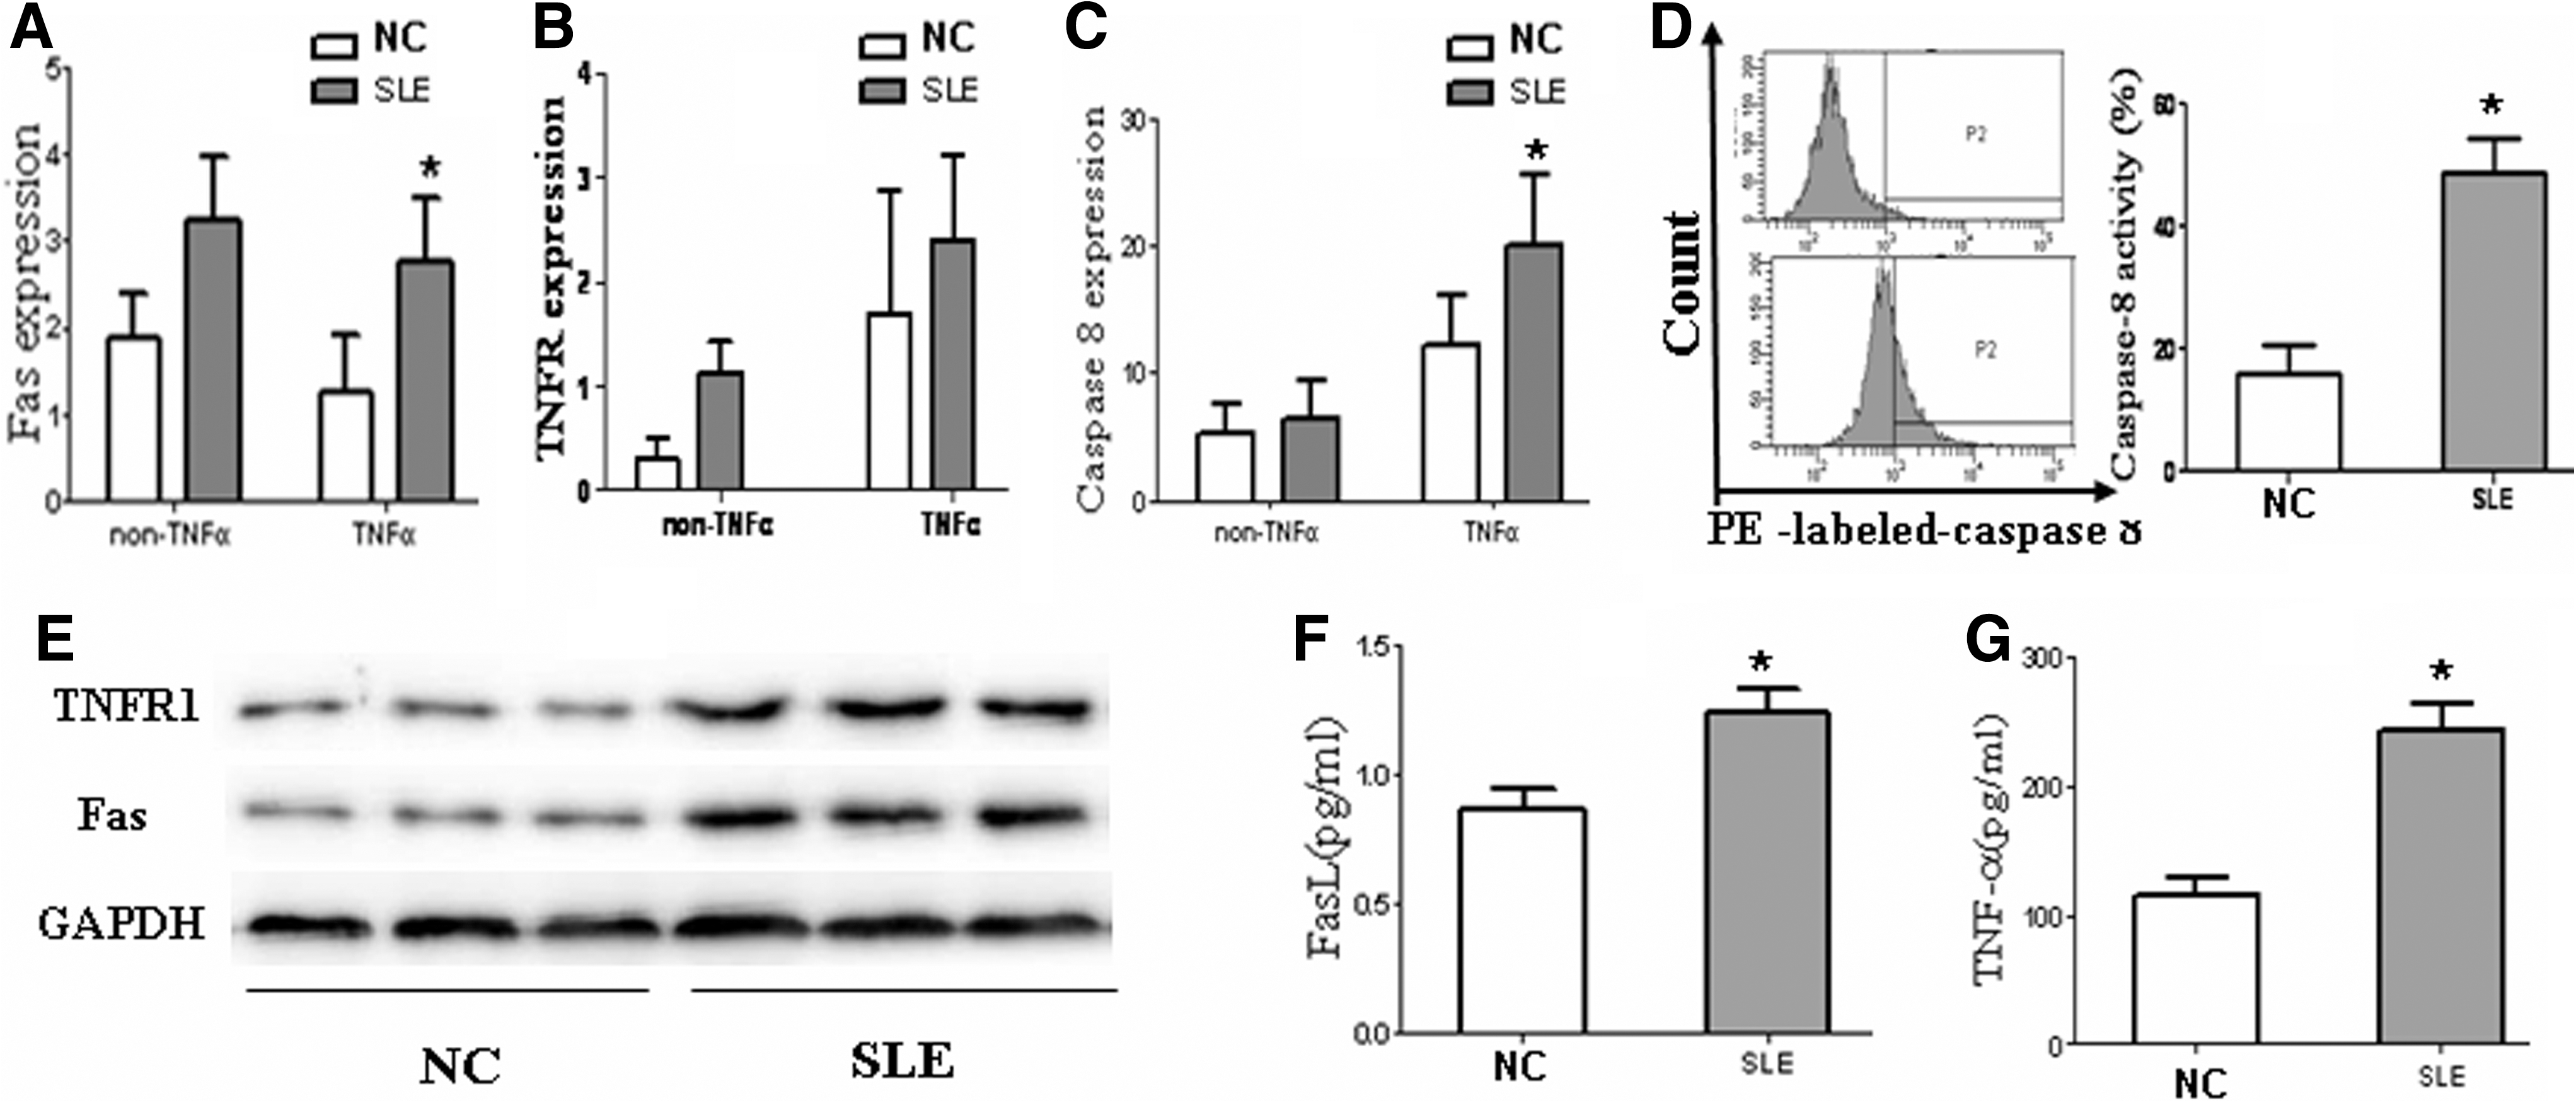
The analysis of apoptosis-related DR pathway in SLE BMSCs. The mRNA expression of Fas, TNFR1, and caspase 8 was detected from 10 SLE patients and 10 normal controls, and data were shown as the mean ratio±SD of transcript levels over GAPDH. No significant differences were seen in the 3 genes between the 2 groups without TNF-α stimulation. While cells were treated with TNF-α for 48 h, the mRNA expression of Fas and caspase 8 was significantly increased in SLE BMSCs
Upregulated intracellular ROS levels from SLE BMSCs, which maybe associated with the overexpression of p-FoxO3 and p-AKT
To quantify intracellular ROS production, DCF-stained cells were analyzed by FCM. SLE BMSCs showed a right shift compared with normal controls (Fig. 4A) (P<0.05, n=5), suggesting that O2 − production might be higher in SLE BMSCs.

The detection of intracellular ROS levels and its upstream regulated genes of BMSCs from SLE patients and normal controls. Quantification of intracellular ROS levels was evaluated by DCF staining followed by FCM analysis. Result revealed higher intracellular ROS levels in SLE patients than in normal controls (P<0.05, n=5)
To gain insight into the molecular characteristics participating in the regulation of intracellular ROS levels of SLE BMSCs, we measured the expression of PI3K, KRas, and NRas at mRNA levels by real-time PCR. Results showed that there were no differences between the 2 groups (Fig. 4C–E). Then, we analyzed the expression of p-AKT and p-FoxO3 of BMSCs from SLE patients and normal controls by western blot analysis. As shown in Fig. 4B, p-AKT and p-FoxO3 expression was upregulated (n=4), which might be a reflection of the abnormal expression of intracellular ROS levels.
Discussion
Recently, SLE has been postulated by some to be a stem cell disorder disease. A better understanding of the characteristics of BMSC dysfunction in SLE could have major clinical implications in SLE treatment. Our study demonstrated that SLE BMSCs appear to show senescence in early passages in tissue culture, in accordance with a previous report [11]. In addition, there were more BMSCs undergoing apoptosis in SLE patients than in normal controls. Thus, we speculate that these 2 factors might be involved in functional abnormalities in SLE BMSCs, in turn participating in the pathogenesis of SLE.
To elucidate the signaling pathways related to BMSC apoptosis, we analyzed 2 major apoptosis pathways: the mitochondrial death pathway and the DR pathway. Accumulating evidence suggests that apoptosis can be controlled by the Bcl-2 family [21, 22]. Previous studies observed that the apoptosis of BMSCs induced by H2O2 compromised mitochondrial function, as evidenced by the release of cytochrome C from mitochondria into cytosol [23]. Our results show the involvement of an intrinsic pathway in SLE BMSC apoptosis, including downregulation of Bcl-2 expression and overexpression of cytochrome C in cytoplasm. These results indicate that SLE BMSCs are prone to apoptosis involving a mitochondrial death pathway. Multiple DRs and their adapter can lead to cell apoptosis as well as other physiological processes after cell injury in a caspase-8-independent manner [24]. In this study, we did not detect any apparent differences in Fas and TNFR1 mRNA expression between the SLE patients and normal controls. However, Fas and TNFR1 expression was elevated in SLE BMSCs at the protein levels. Elevated levels of FasL and TNF-α can partially reflect an inflammatory bone marrow environment of SLE patients. Studies on BMSCs showed that H2O2-induced cell apoptosis did not cause appreciable cleavage of caspase 8, indicating that the extrinsic apoptosis pathway acts independently of caspase 8 [23]. In our study, we indeed detected a change in caspase 8 activity, although its expression remained similar at the mRNA levels. Following TNF-α treatment, the mRNA expression of caspase 8 and Bax was significantly increased in SLE BMSCs compared with normal controls. Our results suggest that this caspase is one of the molecules through which TNFR1 initiates apoptotic signaling in BMSC apoptosis. Together, these data confirm that apoptosis of SLE BMSCs occurs via a DR and a caspase-dependent mechanism.
There are many factors related to senescence, including irreversible DNA damage, ROS levels, and shortening of telomeres [25]. Many investigations indicate that intracellular ROS, such as super oxide anions and hydrogen peroxide, mainly derived from the mitochondria, are intricately connected to aging and survival [26]. PI3K/AKT has been recognized as an important signaling pathway that upregulates intracellular ROS levels by stimulating oxidative metabolism in the mitochondria [27]. AKT hyperactivation promotes metabolic activity in the mitochondria and inhibits FoxO transcriptional activity, resulting in highly increased ROS levels. FoxO3 is essential for the regulation of HSC fate by maintaining ROS below a harmful threshold [28, 29]. On the other hand, loss of FoxO3 in the adult hematopoietic system results in significantly increased levels of apoptosis in HSCs [30]. In the present study, we observed an increased expression of phosphorylation-FoxO3 (p-FoxO3) in SLE MSCs. The phosphorylation of Fox3 impaired the activation of FoxO3, resulting in cytoplasmic sequestration and inhibition of its downstream transcriptional activity, which produced high levels of ROS and caused senescence. Our results are consistent with the observation that FoxO3 deficiency causes an increase in neutrophil apoptosis in murine models of arthritis [31].
To further elucidate the mechanism underlying the abnormal expression of p-FoxO3 and ROS, we examined the genes related to PI3K/AKT signaling pathway, including KRas, Nras, PI3K, and AKT. The results showed that AKT was highly expressed at the protein level, which is in line with the forthcoming viewpoint that AKT was activated in fibroblasts undergoing senescence [32]. Activated Ras leads to growth arrest as a result of potent negative feedback that abrogates PI3K signaling. On the other hand, it also can induce DNA damage via the production of ROS [33]. Nevertheless, it is plausible to reason that there were no significant augmentations of PI3K, KRas, and NRas at mRNA levels in SLE patients in our study.
In conclusion, we provide strong evidence of increased apoptosis in SLE BMSCs, as reflected by downregulation of Bcl-2 and upregulation of cytochrome C in cytoplasm. Apoptosis of BMSCs also led to the activation of caspase 8, indicative of an activated extrinsic apoptosis pathway. Our study also found that SLE BMSCs display an enhanced aging process with overproduction of intracellular ROS, which might be linked with upregulation of p-FoxO3 and its upstream gene AKT. All of these findings suggest that SLE BMSCs are prone to senescence and apoptosis, which may implicate the possible involvement of BMSCs in the pathogenesis of SLE. Therefore, we speculate that allogenic but not autologous MSCT might be preferable for SLE treatment.
Footnotes
Acknowledgments
The work of Dr. Sun was supported by the National Natural Science Foundation of China (No. 81072473, 81172847, and 30972736), Jiangsu Province Natural Science Foundation (BK2009034), Major International (Regional) Joint Research Project (81120108021), and Jiangsu Province Kejiao Xingwei Program. We would like to appreciate Professor Silver R.M., from Division of Rheumatology and Immunology, Medical University of South Carolina, of his kind help in correcting carefully the article.
Author Disclosure Statement
The authors have nothing to disclose.
References
Supplementary Material
Please find the following supplemental material available below.
For Open Access articles published under a Creative Commons License, all supplemental material carries the same license as the article it is associated with.
For non-Open Access articles published, all supplemental material carries a non-exclusive license, and permission requests for re-use of supplemental material or any part of supplemental material shall be sent directly to the copyright owner as specified in the copyright notice associated with the article.