
Abstract
In the present study, we investigated how the symmetry/asymmetry of cell division in mitotic CD34+ cells can be evaluated by determining the plane of cell division and the potential distribution of proteins between daughter cells. The orientation of the mitotic spindle is dependent upon the positioning of the centrosomes, which determine the plane of cell division and the sharing of proteins. If the functions of unequally shared proteins are relevant to the kinetics of cell division, they could determine whether the daughter cells undergo self-renewal or differentiation. The kinetic function of the proteins of interest was investigated using a colony-replating assay and carboxyfluorescein succinimidyl ester (CFSE) staining. We used Notch/Numb as a model system, since they have a role in balancing symmetric/asymmetric divisions. Mitotic cells were examined microscopically and centrosomal markers γ-tubulin/pericentrin were used with activated Notch-1 and Numb. We monitored the first crucial divisions by CFSE staining and found an inverse relationship between activated Notch and Numb expression, suggesting a reciprocal regulation. We suggest that the subpopulations expressing activated Notch or Numb have different cell fates. To determine the influence of Notch signaling on progenitor cell self-renewal, we used the γ-secretase inhibitor N-[N-(3,5-Difluorophenacetyl-L-alanyl)]-S-phenylglycine t-Butyl ester (DAPT). DAPT influences self-renewal/differentiation outcome by affecting the frequency of symmetric renewal divisions without affecting the rate of divisions. Overall, the purpose of this study was to establish a cellular system for predicting the symmetry/asymmetry of hematopoietic progenitor divisions at the level of centrosomes and protein distribution and to investigate the influence of these proteins on progenitor cell kinetics.
Introduction
H
Little is known about the mechanisms controlling the symmetry of cell division in mammalian cells. Beckman et al. identified 4 endosome-associated proteins (CD53, CD62, CD63, and CD71), which asymmetrically segregated in about 20% of dividing hematopoietic stem/progenitor cells (HSPC) [7], while stem cell marker lipid raft-associated protein CD133 (prominin-1) has been found to be asymmetrically distributed in 22.3%±0.7% of mitotic human hematopoietic stem cells cultured on primary human multipotent mesenchymal stromal cells or in stroma-free cultures [8]. We have previously found that interaction between CD34+ cells resulted in polarization of CD34, CD44, CD164, and Notch-1 [9]. Polarization of proteins such as Notch suggests probable unequal sharing of Notch in the daughter cells. However, our former studies considered the total CD34+ cell population, rather than restricting the analysis to cells in mitosis, and the plane of cell division was inferred rather than demonstrated. Moreover, we did not provide a functional demonstration that the proteins of interest were involved in regulating hematopoietic progenitor cell kinetics. This latter point is important because proteins involved in cell adhesion and migration may also exhibit a polarized distribution, without necessarily influencing self-renewal/differentiation.
The above considerations indicate that examination of HSPC division asymmetry should be limited to cells in mitosis, so that the plane of cell division can be demonstrated and the potential protein distribution between daughter cells can be evaluated. Further, the kinetic function of the protein of interest should also be demonstrated. The study of primary CD34+ cells in mitosis is hampered because the mitotic index of CD34+ cells is very low and it is difficult to analyze the numbers of cells necessary for meaningful statistical analysis. Cell synchronization is one strategy to increase the frequency of cells in mitosis (or other phases of the cell cycle) [10]. Study of mitotic cells would establish the orientation of the mitotic spindle relative to the positioning of polarized intracellular proteins.
Protein polarization is not sufficient to determine symmetry of outcome since the plane of cell division is dictated by the orientation of the mitotic spindle. This orientation is dependent upon the positioning of the centrosomes, which serve as microtubule organizing centres (MTOCs) at each end of the mitotic spindle. Daughter cells inherit a single centrosome and the centrosomes are duplicated in parallel with the cell cycle [11]. Centrosomes also serve as scaffolds for multiple cell regulating molecules [12]. They define the poles of the mitotic spindle and its orientation at mitosis, and in turn determine the plane of cell division and the sharing of unequally distributed proteins between the daughter cells [13]. If the functions of the unequally shared proteins are relevant to the kinetics of cell division they could determine whether the daughter cells undergo self-renewal or differentiation.
First, the purpose of this paper is to devise an improved approach demonstrating the symmetry/asymmetry of CD34+ HSPC at the level of the centrosomes and intracellular protein distribution; second, to use this approach in conjunction with Notch and Numb as a model system, because it has been suggested that reciprocal negative regulation between them may determine the balance of symmetric and asymmetric cell divisions [14,15]. The Notch pathway is known to play a critical role in maintaining progenitor cell populations, including HSPC [16]. Generally, when Notch is inhibited, progenitor cells undergo premature differentiation. On the other hand, expression of the cell fate determinant Numb is associated with differentiation in most progenitor cell populations [15]. In terms of investigating the HSPC kinetics, Notch/Numb is a good model system, since it can be manipulated by commercially available inhibitors. To block Notch-1 signaling, we used the γ-secretase inhibitor N-[N-(3,5-Difluorophenacetyl-L-alanyl)]-S-phenylglycine t-Butyl ester (DAPT). In the present study, we used a colony-replating assay and carboxyfluorescein succinimidyl ester (CFSE) staining to investigate the influence of Notch/Numb signaling on the kinetics of progenitor cell division.
Materials and Methods
Cells
Granulocyte colony-stimulating factor (G-CSF) mobilized peripheral blood cells from normal donors or patients were obtained by leukapheresis. These cells were collected by the Stem Cell Laboratory at Hammersmith Hospital and were in excess of clinical requirements. Informed consent and local research ethics committee approval was sought in all cases.
Mononuclear cell and CD34+ cell separation
Mononuclear cell (MNC) was separated from patients' blood samples by density gradient centrifugation (Lymphoprep; Axis-Shield), harvested from the interface, and washed twice in Hanks Balanced Salt Solution (Gibco). CD34+ cells were purified from MNC using MiniMACS immunomagnetic bead technology following the manufacturer's recommendations (Miltenyi Biotec Ltd.). The purity of the CD34+ fraction was consistently above 96%.
Cytokines and inhibitors
All recombinant cytokines were obtained from First Link except for G-CSF that was obtained from Granocyte (Chugai Pharma). The optimal concentrations of cytokines were determined by constructing dose–reponse curves in the standard colony-forming units-granulocyte-macrophage (CFU-GM) assay (see below). An optimized combination of cytokines was used containing 20 ng/mL stem cell factor (SCF), 5 ng/mL interleukin-3 (IL-3), 1 ng/mL granulocyte-macrophage colony-stimulating factor (GM-CSF), and 100 ng/mL G-CSF. To block Notch-1 signaling, we used the γ-secretase inhibitor ΙΧ (DAPT) (Merck; 25 μΜ). To activate Notch-1 signaling, we used recombinant human Jagged-1 (R&D Systems; 2 μg/mL).
Cell synchronization
CD34+ cells were cultured in α-minimal essential medium (α-MEM; Gibco) supplemented with 15% fetal bovine serum (FBS; Biosera; α-15 medium) in the presence of the optimized cytokine combination. After 24 h, cells were exposed to 2 mM thymidine for 24 h (to synchronize cells in S-phase) and then released by transferring them to complete medium (α-15 medium+cytokines) for 6 h. Next the cells were exposed to 100 nM nocodazole for 12 h and then released in full medium for 12 more hours. At that point the cells were harvested, washed in phosphate buffered saline (PBS), and fixed in 4% paraformaldehyde (Sigma-Aldrich) in PBS for 15 min at room temperature, then washed twice in PBS and then used for microscopy or flow cytometry. Nocodazole is an agent that interferes with the polymerization of microtubules and causes cell cycle arrest in the G2/M phase [17].
Analysis of cell cycle distribution
The cell cycle phase distribution (G1, S, and G2/M phases) was determined for synchronized and unsynchronized CD34+ cells by the use of propidium iodide (Sigma-Aldrich). The cells were washed in PBS, were fixed with 70% cold ethanol, while vortexing to avoid clustering, and incubated over night at −20°C. Then the cells were washed in PBS and resuspended in PBS containing 5 μg/mL RNAse A (Sigma-Aldrich) for 30 min at room temperature. Next the cells were washed in PBS and resuspended in PBS containing 20 μg/mL propidium iodide (Sigma-Aldrich), which binds to DNA, before being analyzed for red color (FL2) on a FACScalibur flow cytometer (BD Biosciences).
Calculation of the mitotic index
For the specific detection of mitotic cells the mitosis-specific marker phosphorylated histone H3 (at Ser 10) was used [18]. For dual labeling with propidium iodide, phospho-histone-H3 conjugated to AlexaFluor®-488 (green; BD Pharmingen) was used, before being analyzed on a FACScalibur flow cytometer (BD Biosciences). The mitotic index was calculated by using this marker and performing flow cytometry. In addition, after staining with phospho-histone-H3-AlexaFluor-488 and analyzing using a Zeiss Meta 512 confocal microscope (Carl Zeiss) with Argon laser to view the AlexaFluor-488 the mitotic index could be calculated visually.
Immunofluorescence
CD34+ cells were cultured in α-15 for 3 days. After 3 days in culture, the cells were washed in PBS and fixed in 4% paraformaldehyde in PBS for 15 min at room temperature, then washed twice in PBS and resuspended in α-MEM at a concentration of 106 cells/mL and aliquots of 30 μL were air dried onto glass microscope slides (VWR). For intracellular staining, cells were permeabilized using 0.25% Triton X (Sigma) in PBS for 15 min at room temperature. Nonspecific sites were blocked using 5% FBS (Biosera)/3% bovine serum albumin (BSA; PAA laboratories) in PBS (blocking solution) for 1 h. Centrosomes were stained with rabbit anti-pericentrin or mouse anti-γ-tubulin antibody, activated Notch-1 was stained with rabbit anti-cleaved (Val1744)-Notch-1 antibody, and Numb with goat anti-Numb antibody (all from Abcam) in blocking solution overnight at 4°C. Rabbit, goat, and mouse isotypes IgG (Santa Cruz Biotechnology) were used as negative controls. After three 5 min washes in 3% FBS/1% BSA in PBS (wash solution), cells were incubated with 1 μg/mL chicken anti-mouse AlexaFluor-488, chicken anti-goat AlexaFluor-488 (green), chicken anti-rabbit AlexaFluor-594 (red), and chicken AlexaFluor-647 (cyan; all Invitrogen) in blocking solution for 1 h in the dark. Slides were then washed for 5 min thrice in wash solution, and mounted in VECTASHIELD containing 4′,6-diamidino-2-phenylindole (DAPI; Vector Laboratories). Immunostained cells were analyzed using a Zeiss Meta 512 confocal microscope (Carl Zeiss) with Argon, HeNe1, and HeNe2 lasers to view the AlexaFluors-488, 596 and 647 respectively.
Flow cytometry-intracellular staining
For the measurement of the levels of intracellular proteins, cells were stained using the Fix and Perm kit (Bio Research GmbH). After washing the cells in PBS, 100 μL of reagent A (fixation medium) were added and the cells were incubated for 15 min at room temperature. At the end of the incubation, the cells were washed in PBS and then 100 μL of reagent B (permeabilization medium) were added for 15 min at room temperature. After washing with PBS the cells stained with mouse anti-Notch-1 antibody, rabbit anti-cleaved (Val1744)-Notch-1 antibody, and goat anti-Numb antibody (all from Abcam) in blocking solution overnight at 4°C. Rabbit, goat, and mouse isotypes IgG (Santa Cruz Biotechnology) were used as negative controls. After a wash in wash solution, cells were incubated with 1 μg/mL chicken anti-mouse AlexaFluor-488 (green), chicken anti-rabbit AlexaFluor-594 (red), and chicken AlexaFluor-647 (cyan; all Invitrogen) in blocking solution for 1 h in the dark, washed with PBS, and resuspended in PBS for flow cytometric analysis. Stained cells were analyzed using the BD LSRII flow cytometer with 525_50 B-A, 610_20 YG-A, and APC lasers to view the AlexaFluors-488, 596, and 647 respectively. At least 10,000 cells were collected for each test sample to ensure a sufficient number of positive-stained cells. FlowJo 7.6 software was used for the analysis of the results.
CFSE assay
For staining cells prior to flow cytometric analysis of cell proliferation or cell division, CFSE staining was used. The CD34+ cells were washed in PBS and then resuspended in 1 μM CFSE in PBS. After 7 min incubation on a shaker in the dark, equal amount (10 mL) of FBS was added to quench the staining. After 2 washes in PBS the cells were resuspended in α-15 medium+cytokines to a concentration of 106/mL.
Preparation of cell lysate-immunoprecipitation
Primary cells were washed twice in PBS, the supernatant was removed, and the pellet was vigorously resuspended in 200 mL RIPA buffer (Sigma), containing phosphatase inhibitor cocktail and complete protease inhibitor cocktail (both from Roche Diagnostics), per 107 cells on ice. The lysates were mixed with an equal volume of Laemmli Sample Buffer (Sigma) and boiled for 5 min at 100°C. Lysates were stored at −80°C for western blotting analysis.
ImmunoCruz™ Optima (Santa Cruz Biotechnology) was used to immunoprecipitate γ-tubulin from cells. The ImmunoCruz™ matrix was prepared as per the manufacturer's protocol. In brief, for 107 cells lysed in 200 μL lysis buffer (as per western blotting protocols) an antibody–matrix complex was formed by incubating 100 μL of IP matrix and 10 μg/mL anti-γ-tubulin antibody or anti-IgG1 negative control antibody in 500 μL of PBS for 2 h at 4°C. The matrix was washed twice with cold PBS and then incubated with cell lysate overnight at 4°C. After 2 washes in 500 μL cold PBS, the matrix was suspended in a 100 μL Laemmli Sample Buffer and boiled for 5 min at 100°C.
Western blotting
Boiled lysates and Novex® Sharp Prestained Protein Standards (Invitrogen) were run in parallel on NuPAGE® Novex 4%–12% Bis-Tris Gels (Invitrogen) at 140 V and transferred to 0.45 μm polyvinylidenedifluoride membranes (Immobilon™; Sigma) by a semi-dry transfer system (Biorad). Membranes were blocked with 5% milk (Marvel milk powder, Nestle) in TBS-Tween and then were incubated overnight at 4°C in primary antibodies—mouse anti-γ-tubulin (Abcam), 3 different rabbit anti-cleaved (Val1744)-Notch-1 (Abcam; Cell Signaling Technology; Millipore), and 3 different rabbit anti-Numb antibodies (Abcam; Cell Signaling; Sigma)—at the appropriate concentrations. Membranes were washed in TBS-Tween, stained for 30 min at room temperature with appropriate HRP-conjugated secondary antibodies diluted at 1:1,000 in 1% milk, washed again in TBS-Tween, and visualized by chemiluminescence (ECL; Amersham Biosciences) on Kodak Biomax MR film (Sigma).
Colony-replating assay (CFU-GM)
Cytokines with/without DAPT were added to cytokine-free methylcellulose (HCC4230, Stem Cell Technologies). Then, CD34+ cells equivalent to 2×10³/mL were added. CFU-GM were cultured in standard assays for 7 days, then 90 individual colonies per group were plated into wells in 96-well microtiter plates. After an additional 7 days, secondary colonies were scored and the proliferation index was calculated as previously described [19].
Statistical analysis
Statistical analysis was performed using the SPSS software (Version 14). Statistical significance of paired data was analyzed by the Wilcoxon rank-sum test where the number of replicate experiments (n) was more than 4. A P value <0.05 was considered significant.
Results
Identification and frequency of mitotic cells
The symmetry of cells is best observed at mitosis when protein sharing between daughter cells is clear. For this reason we sought a suitable way to identify mitotic CD34+ cells and measure the Mitotic Index. For the specific detection of mitotic cells, phospho-histone H3 was used to stain the cells followed by performing flow cytometry or microscopy (Fig. 1A), which enabled us to calculate the Mitotic Index. The frequency of mitotic cells among freshly isolated CD34+ cell fractions is very low (<1%) but increases after about 3 days of culture in complete medium. The magnitude of this increase depends on the cytokines used to support the cells during this time. We used a cocktail of cytokines containing SCF, G-CSF, GM-CSF, and IL-3, which has been previously used in our laboratory to support CFU-GM growth and has been found to increase mitotic indices and chromosome quality of bone marrow precursors of myeloid malignancies [20]. However, the frequency of mitotic cells is still too low (3%) for meaningful analysis. For this reason we attempted to accumulate cells in mitosis using cell synchronization protocols.

Identification and frequency of mitotic cells-centrosomes and plane of cell division.
In particular, a thymidine block was used to synchronize cells in S-phase, followed by nocodazole after release to accumulate the cells in G2/M. This not only increased the Mitotic Index from 3% to 7% (P<0.05; Fig. 1B–D) but also increased the frequency of apoptotic cells to 30% (P<0.05). Nocodazole is known to block microtubule polymerization affecting α-tubulin [17], which is the basic component of the mitotic spindle but it also seems to affect γ-tubulin, which is a component of the pericentriolar material. When we stained centrosomes with γ-tubulin and/or pericentrin, we found that nocodazole had an important effect on the migration of the daughter centrosome to the opposite side of the cell, since the centrosomes failed to separate and the cells did not reach the anaphase. Normal orientation of the 2 centrosomes to the opposite poles of the mitotic spindle (see below) was observed in 80% of mitotic CD34+ cells. Synchronization reduced this normal orientation significantly (P<0.05) by 40%, while increasing the number of mitotic cells with the 2 centrosomes attached (Fig. 1E).
Centrosomes and plane of cell division
It was important to be able to identify the mitotic cells using microscopy, so as to examine the orientation of the mitotic spindle and the plane of cell division by using the positioning of the centrosomes at the opposite spindle poles. Thus, staining the centrosomes (with γ-tubulin and/or pericentrin) in phospho-histone H3 or DAPI stained mitotic cells predicted the orientation of the mitotic spindle and the plane of cell division (Fig. 1F). This provided the necessary framework for analyzing patterns of protein sharing at cell division. The use of centrosomes as reference points facilitated the examination of the cells microscopically at all stages of mitosis, from prophase to telophase (Fig. 1G). By staining protein markers of interest in conjunction with centrosomal markers in mitotic cells, we were able to investigate protein segregation relative to the mitotic spindle orientation and predict the symmetry or asymmetry of cell division according to this criterion.
Distribution of Notch and Numb
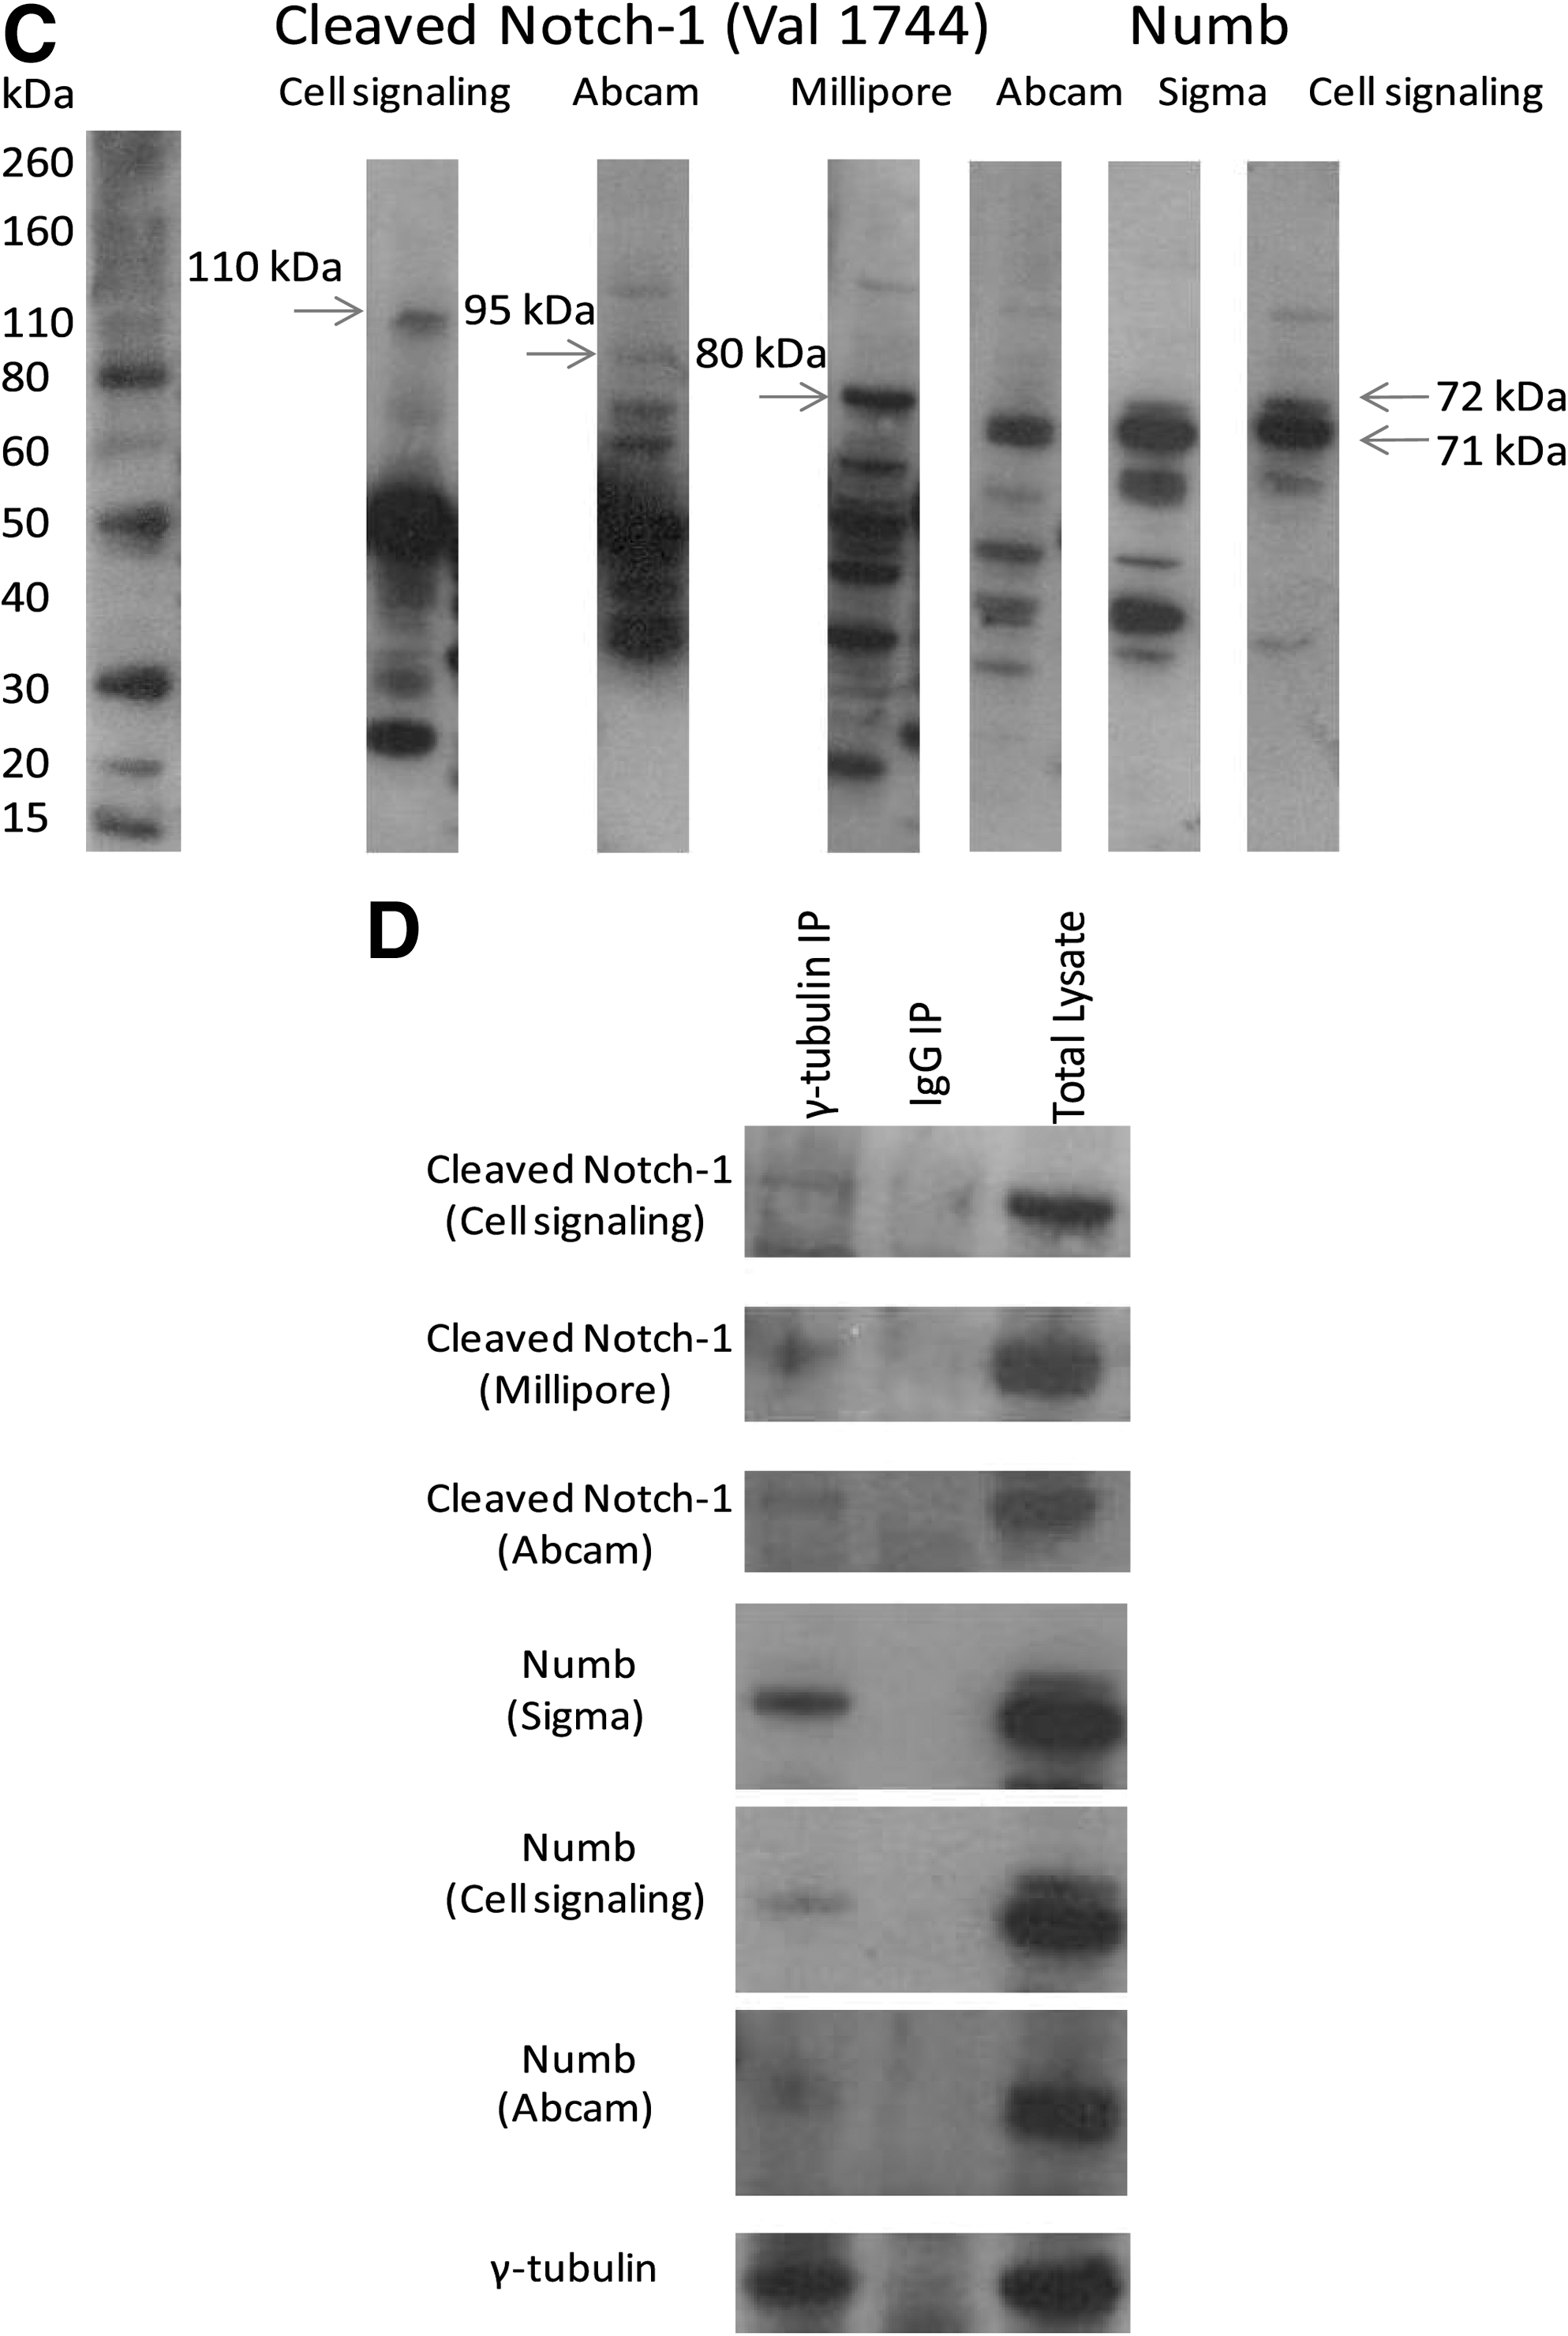
We investigated Notch and Numb because they have been specifically associated with the regulation of progenitor self-renewal. For this, we used activated Notch-1 (cleaved at Val1744) and Numb combined with γ-tubulin or pericentrin. In more than 500 mitotic cells (data obtained from 8 independent experiments using distinct donors) that were examined, it was found that Numb was mostly (84%±2% of the cases) equally segregated to the 2 poles of the mitotic spindle, however, in 16%±1.5% of the cases we observed unequal Numb distribution (Fig. 2A). When activated Notch-1 and Numb were combined, we observed equal distribution of activated Notch-1 to the 2 poles of the mitotic spindle in all the cells with symmetric distribution of Numb (84%). However, in cells with asymmetric distribution of Numb (16%), we observed inverse segregation of activated Notch-1 and Numb that were localized at the opposite ends of the mitotic spindle (Fig. 2B). These data were obtained after 3 days in culture. Thus, using the distribution of Numb and activated Notch-1 as criteria, clear differences between symmetrically and asymmetrically organized cells could be observed. To qualify the specificity of the antibodies used to Numb or activated Notch-1, we performed western blotting analysis, demonstrating that CD34+ cells express Numb and activated Notch-1 (Fig. 2C) after 3 days in culture. We used 3 different antibodies detecting the intracellular domain of Notch-1, cleaved between Gly1743 and Val1744 and 3 antibodies detecting the Numb isoforms, Numb1-4. Figure 2A and B indicate great degree of co-localization between Numb and/or activated Notch-1 and pericentrin/γ-tubulin. To further investigate whether Numb or activated Notch-1 are associated with centrosomes, we used an anti-γ-tubulin antibody, to immunoprecipitate γ-tubulin from CD34+ cells, and western blotted for Numb or activated Notch-1 proteins (Fig. 2D). Once again, to support this novel association of centrosomes with Numb and activated Notch-1, we used 3 different antibodies detecting Numb and Notch-1, cleaved between Gly1743 and Val1744. This result demonstrated that both Numb and activated Notch-1 were at least partially associated with γ-tubulin in the immunoprecipitate, indicating that they could be centrosomal-associated proteins.

Distribution of activated Notch and Numb.
Activated Notch/Numb expression per division
To investigate the expression of activated Notch/Numb in the initial and subsequent progenitor cell divisions, CFSE staining was used. Since the first divisions are the crucial ones for the outcome of the cell population, we monitored the first 2 divisions after 3 days in culture. In each division, there were 4 possibilities: cells negative for Numb and activated Notch, positive for activated Notch, positive for Numb or positive for both. When we examined the patterns of activated Notch and Numb expression per division, we found that the majority of the cells expressed neither of the proteins, or expressed them at low level (double negative) when undivided, whereas they expressed both (double positive) after 2 divisions. Interestingly, there are some cells expressing only Numb or only activated Notch receptor and the number of cells expressing only Numb increased from 4% to 27% (P<0.01) and the number of cells expressing only activated Notch decreased from 20% to 2% (P<0.01) from undivided cells to the second division (Fig. 3). Inverse relationship between Numb and activated Notch receptor expression indicated reciprocal regulation, confirming that increased expression of Numb and inhibition of Notch signaling occur as cells are differentiating.
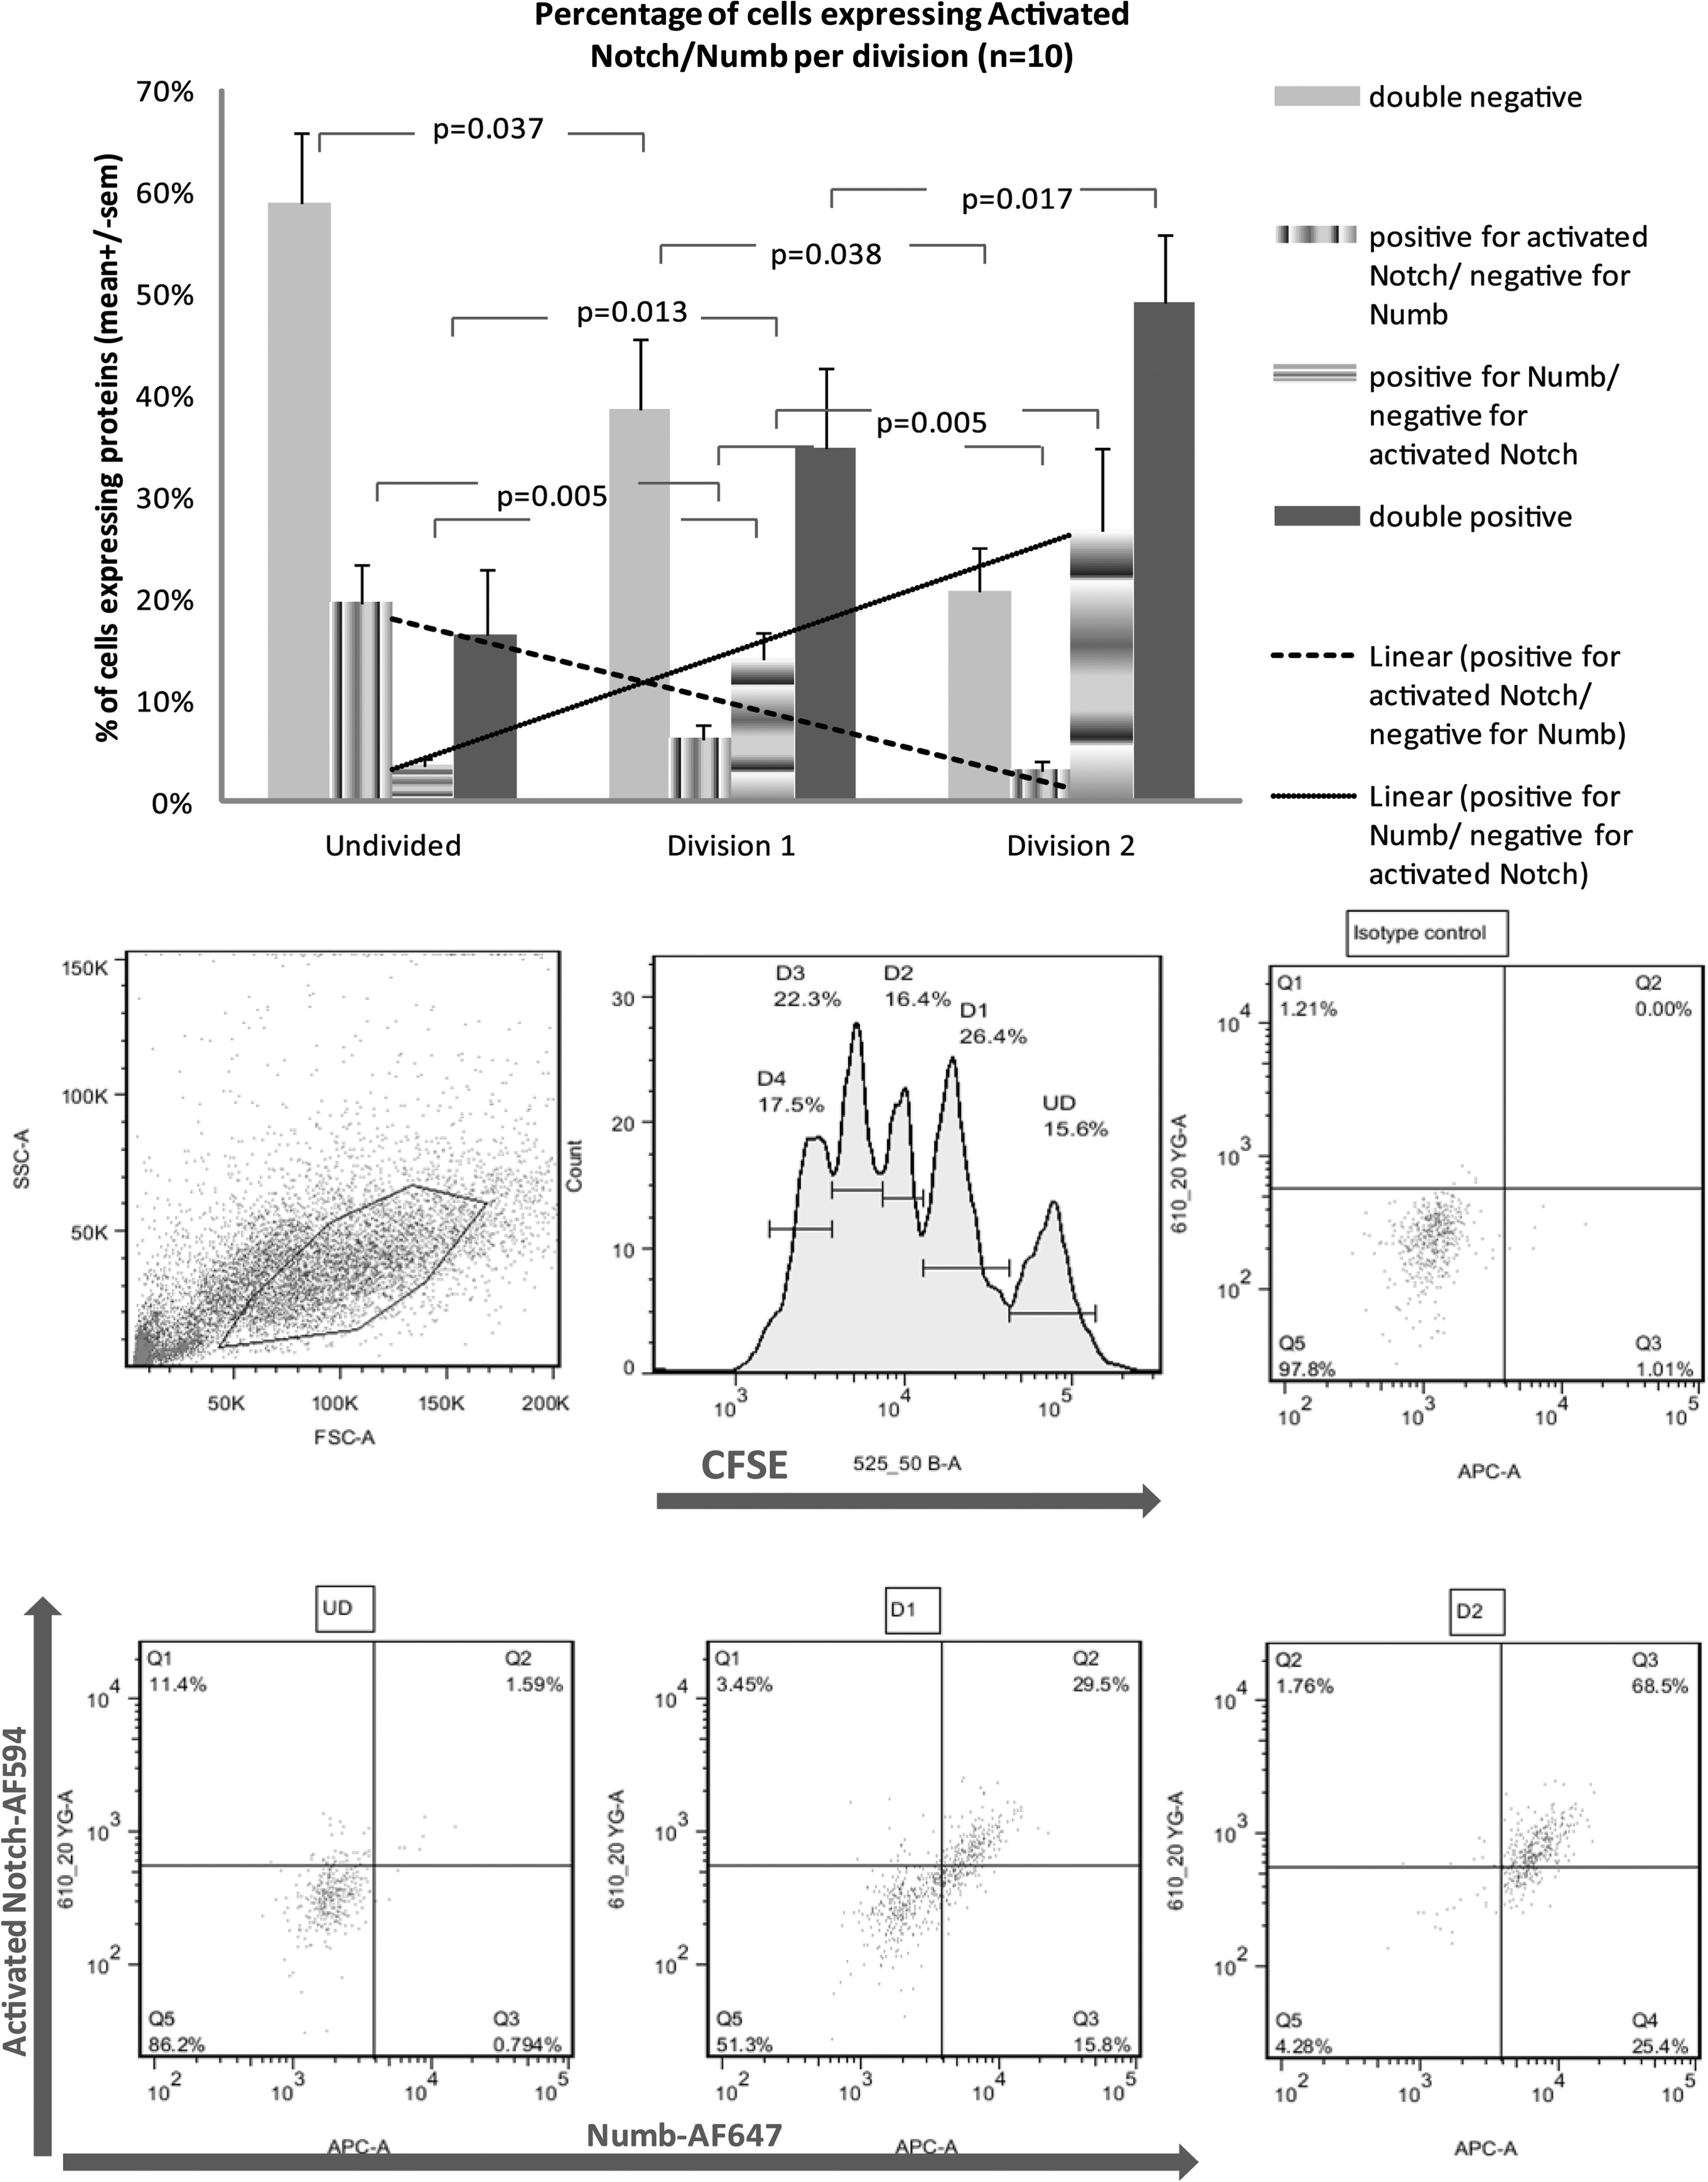
Activated Notch/Numb expression per division. Carboxyfluorescein succinimidyl ester (CFSE) staining was used to track cell divisions. Expression of activated-Notch and Numb after 3 days culture was monitored for the first divisions after staining with anti-cleaved-Notch-1 (Val1744) antibody conjugated to AlexaFluor-594 (red) and anti-Numb antibody conjugated to AlexaFluor-647 (cyan). A representative FACS plot and the average of 10 independent experiments are shown. Isotype controls were used for setting the gates. Results are expressed as percentages of cells per division. The patterns of activated Notch and Numb expression per division demonstrate double-negative cells, positive for cleaved Notch, positive for Numb or positive for both. The inverse relationship between increasing number of Numb positive cells and decreasing number of cells expressing cleaved-Notch receptor and the linear regressions are also shown.
Effects of Notch inhibition on activated Notch, Notch, and Numb expression
The Notch pathway may be blocked with the γ-secretase inhibitor DAPT. It was used at a concentration of 25 μΜ to inhibit the γ-secretase dependent S3 cleavage of Notch, which releases the Notch internal cytoplasmic domain (NICD) [21]. To confirm that DAPT was actually blocking Notch signaling, we added DAPT to the cytokine mix and after 3 days in culture we examined the levels of cleaved Notch. Total Notch and Numb expression were also examined. The results are shown in Fig. 4A. As expected, DAPT significantly decreased about 40% (P<0.01) of the levels of active cleaved Notch, whereas it did not have any effects on total Notch levels (uncleaved receptor). In addition, DAPT had no significant effects on Numb levels. To support these observations, we performed western blotting analysis shown in Fig. 4C. Addition to the cytokine mix of recombinant human Jagged-1, a Notch-1 receptor ligand, was used as a positive control to activate the pathway. Figure 4C demonstrates that under our culture condition Notch signaling is constantly activated at basal levels. Addition of external Jagged-1 activates the pathway at a higher degree, as shown by the levels of intracellular cleaved Notch-1, whereas addition of DAPT decreases the levels or cleaved Notch, confirming the flow cytometry results. Once again, 3 different antibodies detecting cleaved Notch-1 between Gly1743 and Val1744 were used, while the use of 3 Numb antibodies showed no changes in Numb levels. To further support the Jagged-1 activation and DAPT-induced inhibition of Notch, the downstream target of Notch signaling, Hes-1 was examined and found to be upregulated by Jagged-1 and downregulated by DAPT.
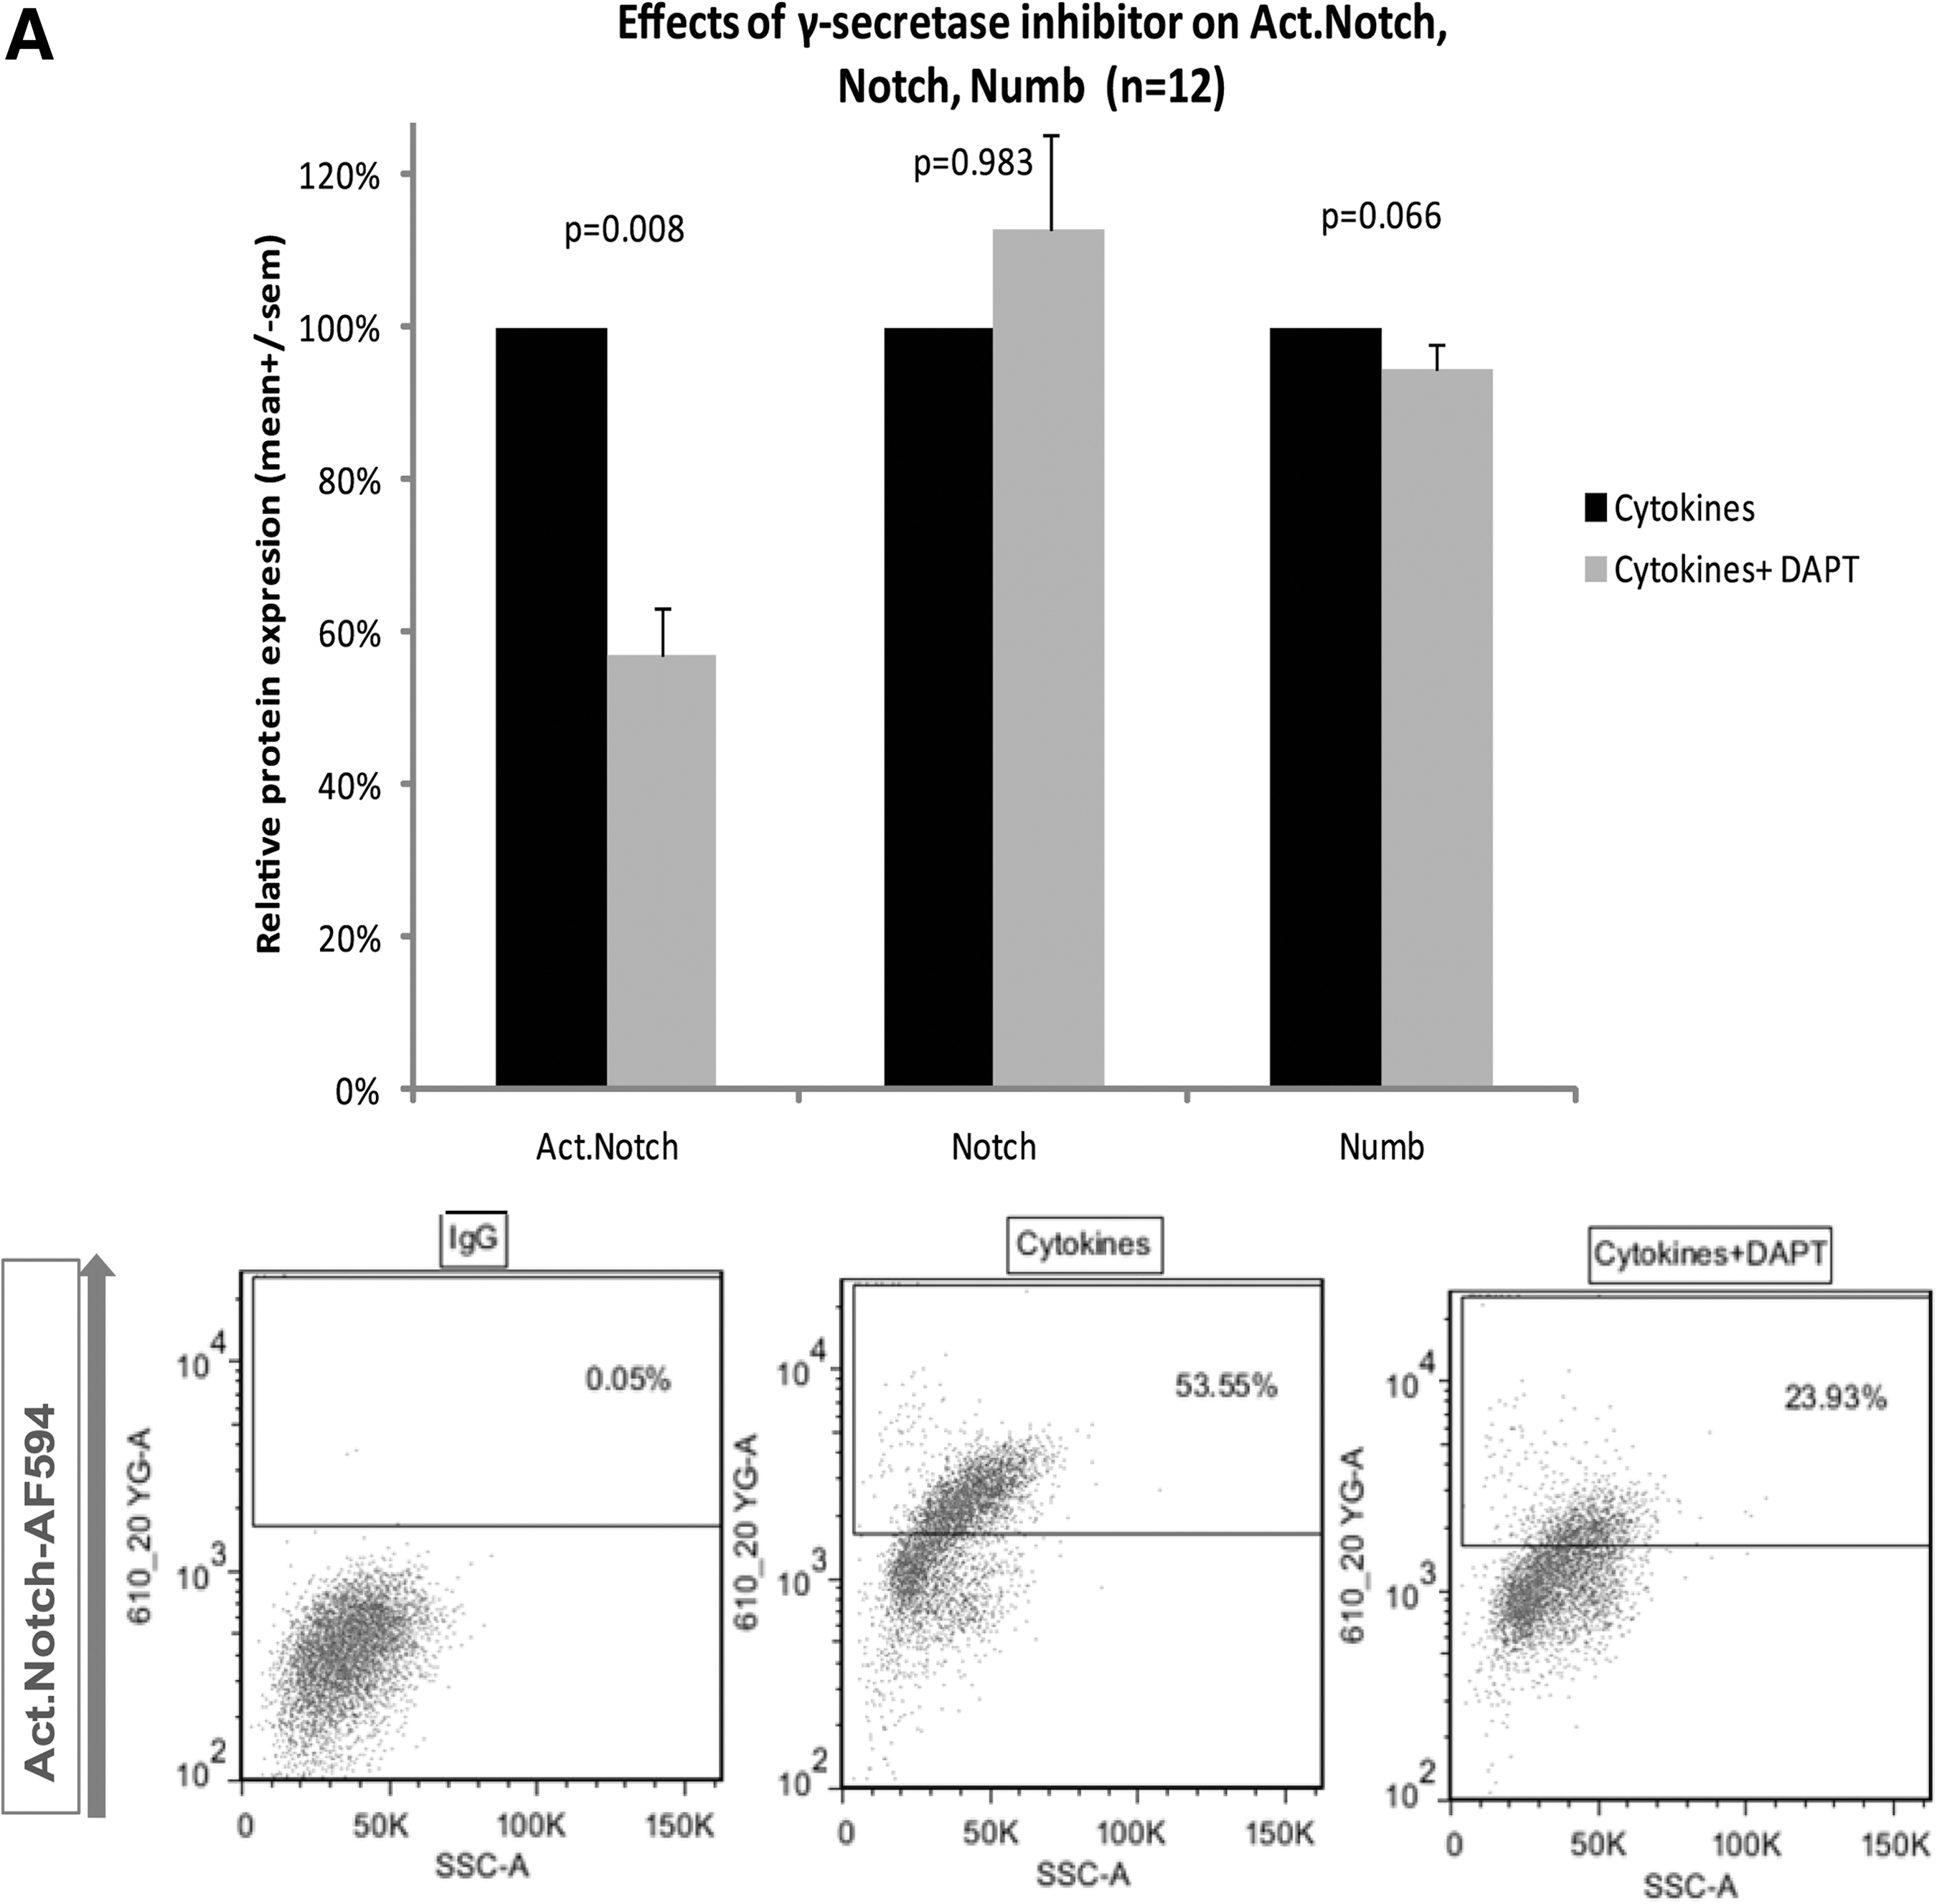
Effects of the γ-secretase inhibitor N-[N-(3,5-Difluorophenacetyl-L-alanyl)]-S-phenylglycine t-Butyl ester (DAPT) on the levels of cleaved Notch, total Notch, and Numb after 3 days in culture.

Next, we performed dual staining with activated Notch and Numb, so as to examine the effects of DAPT on different subpopulations of cells according to their levels of activated Notch and Numb expression. As shown in Fig. 4B, as expected γ-secretase inhibition reduced the percentage of activated Notch+/Numb− and activated Notch+/Numb+ cells. Interestingly, the effects are much more significant on activated Notch+/Numb− cells (P<0.05) than on activated Notch+/Numb+ cells (P>0.05). Surprisingly, DAPT significantly increased the percentage of activated Notch−/Numb+ cells (P<0.05).
Effects of Notch inhibition on progenitor cell kinetics
To establish the relevance of Notch and Numb to the kinetics of cell division, we examined whether Notch inhibition increased or reduced progenitor cell production. Unstained and CFSE-labeled cells were cultured in the presence of a cytokine mix with or without DAPT for 3 days. The total cell number (Fig. 5A), the viability (Fig. 5B), and the number of divisions or the percentage cells per division (Fig. 5C) were examined. γ-secretase inhibitor did not significantly affect the total cell number and the viability, neither did it alter the number of divisions or the percentage of cells per division.

Effects of DAPT on progenitor cell proliferation, survival, self-renewal, and differentiation. Effects of DAPT on the total cell number

We then investigated the effect of DAPT in a colony-replating assay to determine whether Notch inhibition altered the frequencies of self-renewal and differentiation progenitor cell divisions. For this, we added DAPT to the cytokines and examined the number of primary colonies and the proliferation index of CFU-GM myeloid progenitor cells. The number and the cellularity of primary CFU-GM colonies were not affected by DAPT (Fig. 5D). However, addition of DAPT to cytokines reduced CFU-GM proliferation index by 40% (P<0.05; Fig. 5E). This result is consistent with inhibition of Notch signaling resulting in a reduction in the frequency of self-renewal symmetric divisions in the HSPC population.
Discussion
Whether a cell divides symmetrically or asymmetrically is thought to be influenced by the polarization of critical proteins within the cell, relative to the orientation of the mitotic spindle and the plane of cell division, before mitosis, so that they are shared unequally between the daughter cells when the mother cell divides. In this study, we have devised a strategy for investigating the role of protein polarization in determining the symmetry/asymmetry of HSPC cell division and have validated the role of the Notch/Numb axis in the regulation of cell kinetics.
This goal required consideration of several aspects of the cell division cycle. First, we decided to limit our analysis to CD34+ cells in mitosis, when the plane of cell division can be determined and the potential distribution of proteins between daughter cells can be evaluated. We found that the mitotic index among CD34+ cells was very low. Initially, we reasoned that cell cycle synchronization of the CD34+ cells would increase the frequency of cells in mitosis and thus facilitate our analysis. We attempted to synchronize the cells by using thymidine and nocodazole. There has been a controversy between Cooper and Spellman and Sherlock over synchronization of whole cultures [22,23]. A properly synchronized culture is when the cells move as a uniform cohort through the cell cycle, therefore Cooper believes that whole-culture methods cannot synchronize cells [24], since these methods may align cells for some particular property (such as DNA content), but the cells do not reflect the total properties of cells at a particular cell age during the normal cell cycle. Nocodazole is widely used as a synchronizing agent arresting cells prior to mitosis at G2-phase [25]. Experiments have demonstrated that even when a culture inhibited with nocodazole has almost all cells at G2-phase, these cells are not synchronized [26] and our results showed a significant increase in apoptosis in nocodazole-treated cells. In addition, centrosome separation prior to nuclear envelope breakdown is driven by actin filaments but not microtubules [27], whereas microtubules appear to provide the cohesion between 2 duplicated centrosomes and restrict the premature centrosome separation [28]. Treatment with nocodazole influenced duplicated centrosomes so as they were randomly separated even in thymidine-synchronized cells. Our findings, demonstrate that nocodazole seems to affect γ-tubulin, component of the pericentriolar material, and play a role in centrosome separation. For all of these reasons, we suggest, in accordance with many previous studies, that cell synchronization with nocodazole is inappropriate for the study of symmetry/asymmetry of cell division.
We then tested the mitotic marker, phospho-histone H3 in the identification of mitotic CD34+ cells and found that it permitted identification of cells in all stages of mitosis. We used the marker to facilitate our examination of mitotic cells microscopically, which was important for the determination of mitotic spindle orientation and the plane of cell division. The mitotic marker was conjugated to a fluorochrome. When we stained the centrosomes and the proteins of interest (Notch and Numb) simultaneously, there were no more alternative fluorochromes to use for detection by the lasers of the confocal microscope, so we used just DAPI in conjunction with centrosomes and proteins, to detect the mitotic cells by the morphology of the nucleus.
The next step was to determine the orientation of the mitotic spindle. The centrosomes serve as MTOCs and after their duplication, the resultant 2 centrosomes migrate to occupy the opposite poles of the cell where they organize microtubules to form the mitotic spindle. When mother and daughter cells separate at mitosis, the plane of cell division is perpendicular to the mitotic spindle. Thus, determination of the positions of the centrosomes in mitotic cells allows identification of the orientation of the mitotic spindle and the plane of cell division.
Once these reference points had been established, they could be used to investigate the polarization of proteins within the cell and how they might be shared at cell division. We focused on Notch and Numb because they have been identified as critical cell fate determinants The Notch pathway is known to play a critical role in stem cell growth and differentiation [16], specifically in maintaining the undifferentiated state of neuronal progenitor [29], muscle satellite progenitor [30], and HSPC [31]. Generally, when Notch is inhibited progenitor cells undergo premature differentiation, while overactivation of Notch inhibits differentiation.
Drosophila Numb is a membrane-associated protein that asymmetrically segregates in dividing cells and is believed to determine distinct cell fates by interacting with and inhibiting Notch action [32]. The mammalian adaptor protein Numb and its homolog Numblike modulate neuronal and muscle satellite cell fate determination at least in part by antagonizing Notch signaling. The mammalian Numb is expressed in at least 4 different isoforms p65, p66, p71, and p72 [33,34] that are generated by alternative splicing of the Numb mRNA. Asymmetric distribution of Numb has been observed in mitotic neuronal progenitors in the mouse forebrain [35], mouse skeletal muscle satellite cells [36], and mouse hematopoietic stem cells [15]. Our observations revealed that Notch and Numb exhibited distinctive patterns of polarization that indicated unequal sharing between daughter cells at mitosis. By using the distribution of Numb and activated Notch-1 as criteria, we could predict the symmetry or asymmetry of cell division according to this criterion.
We also examined the distribution of other markers that were previously found by our group to be polarized after interaction between CD34+ cells. Specifically, for the adhesion marker Sialomucin endolyn (CD164) our group demonstrated a close association between CD164 and pericentrin in interphase CD34+ cells [9]. When we examined mitotic cells, it was found that CD164 segregated equally in the 2 poles of the mitotic spindle in 82% of the CD34+, while the asymmetric segregation was 18% (data not shown). We did not examine the segregation of the endosome-associated proteins (CD53, CD62, CD63, and CD71) and the lipid raft-associated protein CD133 (prominin-1) that have been found to be asymmetrically distributed in mitotic HSPC [7,8], however, the slightly smaller percentage of asymmetric protein distribution (that reflects to asymmetric division) of our markers compared to theirs might stem from the different cytokine combinations that have been used or from the different cell sources (G-CSF-mobilized peripheral blood cells obtained by leukapheresis or umbilical cord blood cells).
In addition, the inverse relationship between Numb and activated Notch receptor expression in the first 2 divisions suggests reciprocal regulation and confirms that differentiation of HSPC is accompanied by increased expression of Numb and decreased activation of Notch signaling. These differences in Numb and activated Notch expression might stem from unequal segregation of these proteins during the first crucial divisions. For instance, in a double positive cell, unequal distribution of Numb or activated Notch during mitosis might lead to a cell containing only one or the other protein. However, this assumption is oversimplified, since it does not take into account the fact that the symmetrical or asymmetrical distribution of Numb and activated Notch-1 depends on the plane of cell division. Based on activated Notch/Numb expression patterns, we propose that the cells expressing only activated Notch will favor self-renewal, while those expressing only Numb will be biased toward differentiation. We have to mention here that all the cells express Numb, which is an abundantly expressed protein of the endosomal machinery. However, the undivided (undifferentiated) cells express numb to a lower extent than more differentiated cells; thus, we refer to them as Numb negative. It is more challenging to predict the fate of cells expressing both proteins or none. In those cells it seems that there is no reciprocal regulation between Notch and Numb. An explanation for that is that Notch and Numb are not exclusive for each other. Notch can be blocked by inhibitors of the presenilin/γ-secretase complex that regulates intramembrane proteolysis of type I membrane proteins [37]. On the other hand, mammalian Numb has been recently described to associate and inactivate with proteins belonging to other pathways, such as the Hedgehog pathway [38] and the p53 pathway [39].
To investigate the Notch/Numb axis association with regulation of progenitor self-renewal, it was important to be able to verify its influence on cell kinetics. For this we used the γ-secretase inhibitor, DAPT, in a colony-replating assay that detects changes in the frequency of self-renewal divisions in clonogenic hematopoietic progenitor cells. By using this assay we have previously demonstrated that canonical and noncanonical Wnt signaling exert a powerful positive influence on CFU-GM self-renewal [40], which implies an increase in symmetrical divisions [41]. It has been found that DAPT downregulates the Notch target genes Hes1 and Hes5 expression and reporter activity [42,43]. Initially, we demonstrated that DAPT significantly downregulates the levels of activated Notch without affecting the levels of total Notch. Moreover, DAPT induces dowregulation of the downstream Notch target Hes-1 after 3 days in culture, indicating inactivation of the Notch pathway. The Notch pathway is mainly activated by its ligands, Jagged and Delta-like in HSPC, most of which are expressed in the osteoblasts of the bone marrow [44]. The activation of Notch signaling in vitro usually happens via cocultures of HSPC with naturally expressing or transduced stroma cell lines [45,46]. When we activated Notch signaling by adding recombinant Jagged-1 to our cytokine mix, we observed an increase in cleaved Notch and Hes-1 levels. The fact that addition of Notch-1 ligands activates the Notch pathway to a higher extent, while addition of DAPT inhibits the pathway demonstrates that CD34+ cells have the Notch pathway constantly activated at basal levels. This might be an effect of autocrine and/or paracrine secretion of Notch ligands by primitive hematopoietic progenitor cells, and a downstream effect of the cytokines used. Gene expression analysis demonstrated that most of the hematopoietic precursor cells express Jagged and Delta-like ligands [47]. SCF has been found to affect erythropoiesis by inducing increased expression of members of the Notch family and Hes-1 in CD34+ cells [48], while GM-CSF is the main soluble factor that stimulates Notch signaling activation in regulatory T cell through cell contact with mobilized HPC [49]. In addition, the phosphoinositide-3-kinase (PI-3 kinase) pathway, one of the main signaling cascades that is stimulated by the cytokines we used, leads to downstream activation of the Notch pathway [50,51].
The colony-replating assay supported the finding that Notch pathway was constantly active in basal levels in CFU-GM, since use of the γ-secretase inhibitor blocked that activation and changed the progenitor cell kinetics. We propose as potential mechanism that DAPT reduces the frequency of symmetrical renewal divisions. This is supported by the fact that cell production is unaffected by DAPT, demonstrating that Notch inhibition with γ-secretase inhibitor affects the self-renewal/differentiation outcome without altering the rate of divisions. We propose that the choice between asymmetric and symmetric segregation of activated Notch/Numb during the first crucial divisions seems to be an important mechanism for the self-renewal/differentiation outcome of the HSPC population. Moreover, we demonstrated that DAPT reduced the percentage of activated Notch+/Numb− and increased significantly the percentage of activated Notch−/Numb+ cells suggesting that Notch inhibition seems to affect the outcome of progenitor cell kinetics by having differential effects on subpopulations that are biased toward self-renewal, than those biased toward differentiation. It would be of great interest to sort activated Notch+/Numb− and activated Notch−/Numb+ cells and examine their cell kinetics using the colony-replating assay, since the potential self-renewal/differentiation outcome of these populations would have been demonstrated rather than inferred. However, to perform intracellular staining for activated Notch and Numb, we have to fix the cells, therefore, we cannot follow the sorted cells in a functional assay. An interesting alternative method would be to tag activated Notch and Numb with green fluorescent protein and red fluorescent protein and visualize the cell divisions by time-lapse imaging or even follow the tagged cells in functional assays, such as the colony-replating assay or Long-Term Culture-Initiating Cell (LTC-IC) assay.
The idea that protein polarization equates with a role in determining the symmetry/asymmetry of cell division is likely to be a gross oversimplification for several reasons. First, protein polarization has roles in other cell functions, like cell migration or adhesion. Second, it is likely that multiple proteins are involved in determining the symmetry of cell division. We have drawn attention to the importance of identifying mitotic spindle orientation and plane of cell division in interpreting the significance of protein polarization in the symmetry/asymmetry of cell division. However, it is difficult to reconcile polarization of multiple proteins with the simple model of symmetry suggested here and by others unless the relevant proteins are linearly arranged on the plane of cell division, or like Notch and Numb, can form 1 or 2 foci at opposite poles of the cell (Fig. 6). The former case is reminiscent of the arrangement of the chromosomes at mitosis and may indicate a new role for the mitotic spindle in the positioning of polarized proteins (Fig. 6A). The latter case is likely to apply to proteins that localize with the centrosomes (Fig. 6B). In this regard, it is relevant that the centrosomes, apart from organizing the microtubules, serve as platforms for binding multiple signaling and regulatory molecules [12,13]. We show for the first time that activated Notch and Numb are associated with the centrosomal proteins γ-tubulin/pericentrin, suggesting that they are docking on the centrosomes of mitotic HSPC and activate the downstream signaling cascades. To support this novel and unexpected finding, we validated this association by co-immunoprecipitation with γ-tubulin using 3 different antibodies for intracellular domain of Notch-1, cleaved between Gly1743 and Val1744 and 3 for Numb. Our results demonstrate that at least a proportion of intracellular Notch or Numb co-immunoprecipitates with centrosomes. The co-immunoprecipitations were performed in lysates of total CD34+ cells. We observed by microscopy that the association of intracellular Notch or Numb with centrosomes is much stronger in mitotic cells, however, the small percentage of mitotic cells (<5%) does not allow us to have enough cells, so as to sort mitotic cells and perform co-immunoprecipitation experiments. We have previously demonstrated that p210(BCR-ABL1) and p145(ABL1) are both centrosome-associated proteins in chronic myeloid leukemia cells, as demonstrated by co-immunoprecipitation with pericentrin [52], whereas by using combination of co-immunoprecipitation and antibody arrays we found that this approach is capable of identifying new p210(BCR-ABL1) binding partners [53]. We may use this approach to find centrosome binding partners.

Schematic representation of our model for symmetrical/asymmetrical division:
Finally, we have presented a framework for investigating protein polarization and its role in progenitor cell kinetics. By using this framework, normal and malignant stem/progenitor cell populations or different subsets of stem cells can be examined. Additionally, proteins involved in other pathways that affect HSPC self-renewal, such as Wnt, Sonic Hedgehog, or Smad [54], can be used with this framework. Overall, our results begin to elucidate how the protein distribution relative to centrosomes may predict the control of cell division symmetry/asymmetry and the regulation of progenitor cell kinetics.
Footnotes
Acknowledgments
This work was supported by the Kay Kendall Leukaemia Fund (KKLF). We are grateful for support from the NIHR Biomedical Research Centre funding scheme. We would like to thank Dr. Zacharoula Nikolakopoulou for proofreading the article.
Author Disclosure Statement
No competing financial interests exist.