
Abstract
Mucopolysaccharidosis type I (MPS IH; Hurler syndrome) is a rare genetic disorder that is caused by mutations in the α-L-iduronidase (IDUA) gene, resulting in the deficiency of IDUA enzyme activity and intra-cellular accumulation of glycosaminoglycans. A characteristic skeletal phenotype is one of the many clinical manifestations in Hurler disease. Since the mechanism(s) underlying these skeletal defects are not completely understood, and bone and cartilage are mesenchymal lineages, we focused on the characterization of mesenchymal cells isolated from the bone marrow (BM) of 5 Hurler patients. IDUA-mutated BM stromal cells (BMSC) derived from MPS IH patients exhibited decreased IDUA activity, consistent with the disease genotype. The expansion rate, phenotype, telomerase activity, and differentiation capacity toward adipocytes, osteoblasts, chondrocytes, and smooth muscle cells in vitro of the MPS I BMSC lines were similar to those of BMSC from age-matched normal control donors. MPS I BMSC also had a similar in vivo osteogenic capacity as normal BMSC. However, MPS I BMSC displayed an increased capacity to support osteoclastogenesis, which may correlate with the up-regulation of the RANKL/RANK/OPG molecular pathway in MPS I BMSC compared with normal BMSC.
Introduction
M
Although allogeneic hematopoietic stem cell transplantation can alleviate some of the systemic complications of MPS IH, it cannot—or can only partially—prevent and correct the skeletal anomalies associated with the disease [4 –6]. A possible explanation for the lack of improvement in the skeletal defects after transplantation is poor penetration of IDUA, produced by the donor leukocytes into host skeletal tissues [7], despite the fact that bone is a highly vascularized tissue. The cellular and molecular mechanisms underlying the skeletal disease in MPS I remain largely unknown. Studies in the MPS I mouse model revealed aberrant bone remodeling, as well as growth plate development and maturation with abnormalities in the early cortical bone structure [8]. In young mice, the growth plate appeared thickened with a high number of chondrocytes, and a disorganized structure was observed in the hypertrophic zone. Arrangement of the primary trabecular bone was abnormal, and an increased presence of cartilage within the woven bone was observed, suggesting difficulties in cartilage resorption during endochondral ossification.
Wilson et al. have recently demonstrated that high concentrations of GAGs in MPS I may inhibit the collagenolytic activity of cathepsin K, a lysosomal cysteine protease highly expressed by osteoclasts and responsible for a significant part of total bone resorption. These studies suggest that an impairment of cathepsin-K activity may contribute to the deranged bone remodeling in MPS I [9]. In another study, Simonaro et al. reported that GAGs storage in MPS leads to inflammation, apoptosis of cartilage cells, and synovial hyperplasia, resulting in poorly organized and metabolically abnormal connective tissue matrices [10]. In addition, they reported that the Toll-like receptor 4 (TLR4) signaling pathway may play a significant role in the pathogenesis of MPS bone and joint disease, as the treatment of MPS VI rats with an anti-tumor necrosis factor-α drug dramatically reduced the inflammation in the joints, which was associated with improved joint pathology [11].
Bone marrow stromal cells (BMSC) contain a sub-population of multipotent stem cells capable of differentiating toward multiple skeletal cell types, including osteoblasts (bone), chondrocytes (cartilage), adipocytes (BM fat), fibroblasts (periosteum), and adventitial reticular cells (BM stroma) [12]. The involvement of BMSC in skeletal disorders is well known, such as in fibrous dysplasia of bone, Paget's disease, hyperparathyroidism, osteoporosis, and osteoarthritis [13 –17]. The evaluation of the biological and functional characteristics of BMSC from patients affected by these diseases has provided additional insights into some of the pathogenetic mechanisms underlying the disorders. One study analyzed BMSC from MPS I transgenic mice. No differences were found in the basic features (clonogenicity, expansion, and differentiation capacity) of transgenic BMSC compared with wild-type [18].
To study a possible involvement of BMSC in the complicated skeletal abnormalities affecting Hurler patients, we isolated BMSC from pediatric patients with MPS IH disease and evaluated their properties in comparison with BMSC from healthy pediatric donors. Apart from characterizing the IDUA molecular mutations and IDUA enzyme activity, we evaluated the phenotype and differentiation ability of MPS I BMSC into chondrogenic, osteogenic, adipogenic, and smooth muscle lineages. Since stromal cells are also involved in the activation as well as differentiation of osteoclasts, we also assessed the ability of MPS I BMSC to stimulate osteoclastogenesis in vitro. Receptor activator of nuclear factor-κB (RANK), osteoprotegerin (OPG), and the RANK ligand (RANKL) have been identified as the key partners of a system that directly regulates osteoclast differentiation [19]. In particular, RANKL binds to RANK present on osteoclast precursors, inducing their differentiation into osteoclasts. OPG is a decoy receptor that acts by neutralizing and preventing RANKL from binding to RANK, resulting in decreased osteoclast recruitment. Alterations in the balance of the OPG/RANK/RANKL molecular triad are associated with numerous bone diseases [20]. Here, we show that MPS I BMSC display excessive osteoclastogenetic capacity probably related to the dysregulation of RANKL and OPG expression.
Materials and Methods
Isolation and culture of human BMSC
Human BMSC were obtained from the BM of pediatric healthy donors (n=4; aged 7 months, 1 year, 7 years, 9 years) and MPS IH patients (n=5; aged 9 months, 11 months, 11 months, 13 months, 20 months), with informed consent per institutionally approved protocols. BMSC were isolated and cultured as previously described [21]. Briefly, a Ficoll-gradient separation of BM cells was performed, and mononuclear cells (BMMNC) were seeded at a density of 2×10⁵ cells/cm2 in basal growth medium, containing Dulbecco's modified Eagle's medium (DMEM)-LG (Invitrogen), 10% fetal bovine serum (FBS) (Biosera), 1% Penicillin-Streptomycin (Invitrogen), and 1% L-glutamine (Invitrogen). After 48 h, the medium was changed, and the resulting adherent fibroblast-like cells were cultivated at 37°C in a humidified atmosphere containing 5% CO2. Subsequently, the medium was replaced twice a week. The cells were maintained in basal medium until they reached 70% of confluence and were harvested with 0.05% trypsin (Invitrogen). For subsequent expansion, the cells were plated at a density of 2×10³cells/cm2 and maintained in culture for several passages.
Colony-forming unit-fibroblast assays
The number of BMSC progenitors was determined in 3 patients by the colony-forming unit-fibroblast (CFU-F) assay, as previously described [22]. Briefly, BMMNC were seeded in a P100 dish (Nunc) at serial dilutions from 1.5×10⁶ cells/dish to 1×10⁴ cells/dish and maintained for 14 days in basal medium. To enumerate CFU-F, the dishes were washed thrice with phosphate-buffered saline (PBS); the cells were fixed with methanol, and stained with the Giemsa solution. CFU-F were scored at 20× magnification. The experiment was performed in triplicate for each sample.
Proliferation kinetics of BMSC
The population doublings (PDs) were calculated as follows: PDnew=PDinitial+[log(C0/C1)]/log2, wherein C0=cell number initially seeded and C1=cell number harvested. The PDs of cells from P2 to P7 were determined. Three sets of cultures were repeated for each sample.
Flow cytometric analysis
BMSC at passage 3 were labeled with phycoerythrin- or fluorescein isothiocinate-conjugated antibodies against CD14, CD34, CD45, CD90, CD73, CD105, CD146, HLA-ABC, and HLA-DR. Isotype antibodies were used as control (all antibodies were purchased from BD Biosciences). Flow cytometric analysis was performed on 20,000 events with the use of an FACScan cytometer, and data were analyzed using the CellQuest software (BD Biosciences).
Cell-cycle analysis
BMSC at passage 4 were harvested 48, 96, and 144 h after seeding and washed twice with ice-cold PBS (Gibco). The cells were resuspended in GM saline solution and permeabilized with ice-cold 70% ethanol, followed by incubation with 2 mL of a solution containing 10 μg/mL propidium iodide plus 25 μL 1 mg/mL RNAse 10.000 Units overnight [23]. Flow cytometric analysis was performed on 20,000 events by using a FACS Calibur, and the cell-cycle phase distribution was calculated as percentages by a Gaussian-modified method [24].
Detection of telomerase activity
Proteins were extracted from 1×10⁶ BMSC at passage 6, and telomerase activity was determined on 1μg of protein extract per sample using the TRAPeze RT telomerase detection kit (Chemicon, Millipore) according to the manufacturer's instructions. This method measures the incorporation of telomeric repeats (TTAGGG) to the 3′end of a substrate oligonucleotide. The extension products are amplified and measured by quantitative reverse transcriptase-polymerase chain reaction (Q-RT-PCR) using Ampifluor® Primers, and the fluorescent emission produced is directly proportional to the amount of telomeric repeats (=copy numbers).
IDUA enzyme assay
IDUA activity was determined by Clements et al. [25]. Briefly, cells were resuspended in 150 mM NaCl and freeze-thawed 6 times. Protein extracts were assayed for total protein content using the Lowry assay. Five microgram of protein was added, in triplicate, to a solution containing 8 mM D-Saccharic acid 1,4-lactone and 2 mM 4-methylumbelliferyl-α-L-iduronide in 0.1 M sodium formate buffer, pH 3.2. Samples were incubated for 1 h at 37°C before stopping the reaction by adding 1 mL of 0.5 M carbonate buffer, pH 10.7. The cleaved substrate was quantified on a Perkin Elmer fluorometer. The enzyme activity was calculated from a reference curve obtained by using 4-methylumbelliferone and was expressed as nmoles/hr/mg.
In vitro differentiation of BMSC
Differentiation potential of cultured BMSC was assessed using standard methods [21,26,27]. For chondrogenic differentiation, BMSC at passage 2 were seeded in a 15 mL conical tube at a density of 2.5×10⁵ cells/tube and resuspended in chondrogenic differentiation medium consisting of DMEM-High glucose (Invitrogen) supplemented with ITS+premix (Collaborative Biomedical Products), 1 mM pyruvate (Sigma), 50 μg/mL 2-phosphate-ascorbic acid (Fluka), 100 nM dexamethasone (Sigma), and 10 ng/mL transforming growth factor (TGF)-β3 (Sigma). Cells were grown as pellets for 3 weeks at 37°C, 5% CO2. For histology, the resulting tissues were embedded in paraffin and stained with Hematoxilin-Eosin (Sigma). Sulfated GAGs were visualized by staining with Alcian Blue (Sigma). For Collagen type II immunolocalization, sections were deparaffinized and exposed to 3% hydrogen peroxide for 30 min. Monoclonal anti Coll type II antiserum (Abcam) was diluted 1:100 and applied overnight at 4°C. The reaction was developed by using an indirect immunoperoxidase protocol. For the assessment of the chondrogenic expression profile, transcript levels for type II collagen (COL2A1), type X collagen (COL10A2), SRY-BOX9 (SOX 9), and aggrecan (ACAN) were analyzed by Q-RT-PCR at day 21 of culture.
For osteogenic differentiation, BMSC at passage 3 were seeded at a density of 6×10³ cells/cm2 in basal medium. After 48 h, the medium was switched to Osteogenic Induction Medium, consisting of DMEM-Low glucose (Invitrogen), supplemented with 10% FBS (Biosera), 100 nM dexamethasone (Invitrogen), 10 mM B-glycerol-phosphate (Invitrogen), and 0.05 mM 2-phosphate-ascorbic acid (Invitrogen). The osteogenic differentiation was assessed by Alizarin Red S (Sigma) staining on day 21 of differentiation. In parallel experiments, the transcript levels for alkaline phosphatase (ALP), type I collagen (COL1A2), osteonectin (SPARC), runt-related transcription factor 2 (RUNX2), osteopontin (SPP1), osteocalcin (BGLAP), receptor activator for nuclear factor-κB ligand (RANKL), and osteoprotegerin (OPG) were analyzed by Q-RT-PCR at day 0, day 7, day 14, and day 21 of culture.
For adipogenic differentiation, BMSC at passage 3 were seeded at a density of 2×10⁴ cells/cm2 in basal medium. After 24 h, the medium was switched to Adipogenic Induction Medium, consisting of DMEM-High glucose (Invitrogen), supplemented with 10% FBS (Biosera), 1 μM dexamethasone (Sigma), 1 μM indomethacin (Invitrogen), 500 μM 3-isobutyl-1-methylxantine (IBMX, Sigma), and 10 μg/mL human recombinant insulin (Sigma). For the detection of adipogenic differentiation, intracellular lipid droplets were stained by Oil Red O solution (Sigma) on day 18 of differentiation. At day 21, the transcript levels for fatty acid binding protein 4 (FABP4), lipoprotein lipase (LPL), and peroxisome proliferator-activated receptor gamma (PPARG) were analyzed by Q-RT-PCR.
For smooth muscle cell (SMC) differentiation, BMSC at passage 3 were plated at 5×10³ cells/cm2 on 100 ng/mL fibronectin-coated (Sigma-Aldrich) wells or cover glasses. After 24 h, differentiation was induced in serum-free basal medium (Invitrogen) supplemented with 10 ng/mL TGF-β1 (R&D Systems). On day 0 and day 6 of differentiation, the expression of SMC-specific proteins, alpha smooth muscle actin (α-SMA), and calponin was assessed by immunofluorescence. Microscopy analysis was performed with confocal lazer microscopy (Radiance 2100; Biorad Laboratories). At day 6, the transcript levels for alpha smooth muscle actin (ACTA2), calponin (CNN1), and transgelin (TAGLN) were analyzed by Q-RT-PCR.
RNA isolation and Q-RT-PCR reaction
Total RNA was extracted using TRIZOL® reagent (Invitrogen), following the manufacturer's protocol. 1 μg of RNA was then reverse transcribed with the use of a SuperScript® II Reverse Transcriptase kit (Invitrogen) in the presence of random hexamers. Quantitative real-time PCR assays were performed in triplicate on an ABI 7900 Real-Time PCR system thermal cycler with the qPCR Mastermix (Applied Biosystems). All TaqMan Gene Expression assays were provided by Applied Biosystems; see supplementary table 1 (Supplementary Data are available online at
Co-culture of BMSC and CD34+ purified cells
BM cell suspensions were centrifuged on Ficoll-Paque (Pharmacia Biotech) to isolate BMMNC. CD34+ cells were purified using the MidiMACS CD34 isolation kit (Miltenyi Biotec). CD34+ cell purity was 95%–97% by flow cytometry. BMSC at passages 5–7 were seeded at 1.5x10³cells/cm2 and cultured in basal medium until 80% confluence was reached. Aliquots of CD34+ enriched cells (3×10⁴cells/cm2) were plated on the monolayers of BMSC and co-cultured at 37°C in 95% air–5% CO2 for up to 3 weeks. Every 3 days, half the culture medium was carefully removed to minimize the loss of nonadherent cells and was replaced with an equal volume of fresh medium.
Tartrate-resistant acid phosphatase staining
The medium was removed from BMSC-C34+ cell co-cultures, and the cells were fixed by the addition of 60% acetone solution in citrate buffer (pH 5.4) for 30 s. The cells were washed twice with distilled water and air dried. Tartrate-resistant acid phosphatase (TRAP)-positive (TRAP+) cells were detected using a commercial TRAP staining kit (Sigma Chemical Co). TRAP+ mononucleated and multinucleated cells were counted manually in the representative areas of each culture using an inverted-phase contrast microscope (Axiovert 40 C, Zeiss). In some experiments, the cells were counterstained after TRAP staining with 49,6-diamidino-2-phenylindole (Molecular Probes, Inc.) to visualize the nuclei.
Enzyme-linked immunosorbent assay for the quantitative determination of free human RANKL and OPG
Human sRANKL and human OPG ELISA (Biomedica) were performed on supernatants of cultured BMSC and osteogenic-differentiated BMSC, according to the manufacturer's instructions. The samples for OPG testing were diluted 1:5.
In vivo transplantation
In vivo transplantation of human BMSC was performed as reported earlier [28,29]. All animal procedures were approved by the animal ethics committee of the Biomedical Science Park, University La Sapienza, Rome. Briefly, 2×10⁶ BMSC at passage 3 were loaded onto 40 mg of hydroxyapatite/tricalcium phosphate particles (100–200 μm; Zimmer) and embedded in a fibrin gel to generate carrier-cell constructs. The constructs were subcutaneously transplanted into 8- to 15-week-old female SCID/beige mice (Harlan-Sprague Dawley). The samples were harvested after 8 weeks, fixed in 4% formaldehyde, decalcified in 10% ethylenediaminetetraacetic acid at pH 7.2, and embedded in paraffin. The deparaffinized and rehydrated sections were stained with hematoxylin and eosin as previously described [30]. Transplants of the carrier alone were used as control. Histomorphometry measurement of bone volume/total volume (BV/TV, %) was performed on routinely processed samples by using a Leica Leitz DM RB image analyzer.
Statistical analysis
Continuous data are described by mean and standard deviation (SD). The presence of clustering due to the repeated measurements on each case/control is taken into account in the calculation of SD. One sample t-test was used to compare the mean counts of the colony-forming efficiency (CFE) in controls with the average counts on a single case considered as a reference. Differences between groups were tested by the nonparametric rank-sum test for clustered data [31] or by an unpaired 2-tailed t-test. The Mann–Whitney test was used when the normality test failed. All the tests were one sided at a significance level of 5%. The package R version 2.10.0 (2009 The R Foundation for Statistical Computing) was used for statistical analysis. P values<0.05 were considered significant.
Results
Expansion capacity and telomerase activity is similar for BMSC isolated from MPS IH or healthy donors
BMSC were isolated from 5 patients affected by MPS IH (hereafter named MPS I BMSC) before they were treated with hematopoietic stem cell transplantation. Four pediatric healthy donors (hereafter named HD BMSC) served as controls. MPS I patients were aged 11 months (female, patient no. 1), 13 months (female, patient no. 2), 20 months (female, patient no. 3), 9 months (male, patient no. 4), and 11 months (female, patient no. 5). All the patients had biochemical and molecular confirmation of their diagnosis and presented with coarse facies, multiple dysostosis including dorsolumbar spine kyphosis and hip dysplasia, and other typical clinical signs. The BM cells harvested from MPS IH patients formed discrete colonies that were similar to the cultures of control donors. BMSC lines could be established from all MPS IH patients. We quantified the CFE, which is the number of CFU-F formed after seeding a clonogenic concentration of BMMNC from 3 MPS IH patients and 4 HD. The CFE was decreased in MPS I BMMNC (P=0.02) in comparison with healthy pediatric donors (Fig. 1A). No differences in the morphology of MPS I and HD BMSC could be detected (data not shown). Although it has been reported that MPS I fibroblasts proliferate more quickly than their normal counterparts [32], we found no differences in PDs between MPS I and HD BMSC (Fig. 1B). To confirm that the expansion capacity of MPS I BMSC was similar to that of HD BMSC, we performed cell-cycle analysis at different time points. The cell-cycle distribution pattern was similar for MPS I and HD BMSC (Fig. 1C). For both MPS I and HD BMSC, the majority of cells were in the G0/G1 phase of the cell cycle (69%±9% for MPS I BMSC vs. 66%±5% for HD BMSC) at 48h after seeding, and the remaining cells were distributed in a similar manner in the SG2M phase. Likewise, no differences in cell-cycle analysis could be detected between MPS I and HD BMSC at 96 and 144 h after seeding. We could not also detect differences in telomerase enzyme activity, as evaluated by the telomeric repeat amplification (TRAP) method, between HD and MPS I BMSC cells at passage 6 (Fig. 1D).

Clonogenicity, expansion capacity, telomerase activity, and immunophenotype of MPS I BMSC.
Immunophenotype of MPS I and HD BMSC is similar
To further characterize MPS I BMSC, surface protein expression was examined at passage 3 by flow cytometry. BMSC did not express the hematopoietic antigens, CD45, CD14, and CD34. More than 95% of MPS I BMSC expressed CD73, CD90, CD105, and CD146. In one MPS I and one HD BMSC line, 74.4 and 77.3%, respectively, of the cells was CD146 positive, whereas the other cell lines were 98.3±0.5 CD146+. More than 70% of the BMSC derived from all donors expressed HLA-ABC; however, none of the BMSC expressed HLA-DR. The selected antigens representing an MPS I BMSC line and an HD BMSC line are depicted in Fig. 1E.
Mutation analysis and iduronidase activity in MPS I BMSC
The disease-specific genotype of MPS I BMSC was compared with that of their primary somatic counterparts. Sequence analysis of the IDUA gene in the 3 MPS I BMSC lines revealed the previously identified mutations (Fig. 2A). BMSC derived from MPS IH patient no. 1 (Pt 1) were homozygotous for the p.W402× mutation in exon 9. Molecular analysis of MPS IH patient no. 2 (Pt 2) revealed a compound heterozygosity for the p.Q70× mutation in exon 2 and the c.398_403del6 mutation in exon 4, which is a deletion of 6 nucleotides (TGGGCA) that causes an in-frame deletion of the amino acids M133 e G134. MPS I BMSC from patient no. 3 (Pt 3) revealed a compound heterozygosity for p.Q70× and p.496R mutations. The p.Q70× (c.208C>T) and p.W402× (c.1205G>A) introduce a premature STOP codon at positions, respectively, 70 and 402 of the protein chain; the p.P496R missense mutation in exon 10 (c.1487C>G), resulting in a nonconserved amino acid change (Proline>Arginine) at position 496 of the protein chain.

Mutation analysis and iduronidase activity in MPS I BMSC.
In addition, we evaluated the specific IDUA enzymatic activity of MPS I BMSC and compared it with the enzymatic activity of HD BMSC. As shown in Fig. 2B, the mean IDUA activity of MPS I samples (0.63±0.45) was reduced to <1% of HD BMSC IDUA activity (192.73±80.66).
Differentiation potential of MPS I BMSC to chondrocytes, osteoblasts, adipocytes, and SMC in vitro is similar to that of HD BMSC
BMSC cultured in the presence of TGF-β3 generate a solid three-dimensional tissue structure that can be harvested and processed for histology and molecular analysis. MPS I BMSC generated typical pellets when cultured as micromasses under previously standardized chondrogenic conditions for 21 days. As negative control, MPS I BMSC pellets cultured in the absence of TGF-β3 did not form a typical cartilage structure. Cartilage matrix was stained with alcian blue with a typical cartilage morphology (Fig. 3A). The pellets also stained diffusely positive for type II collagen (Fig. 3A). The morphology and histology of MPS I and HD pellets was highly similar. In addition, gene expression studies on MPS I and HD pellets confirmed no significant differences in the transcript levels of type II collagen (COL 2), type X collagen (COL 10), SOX-9, and aggrecan (Fig. 3E), typical chondrogenic genes.
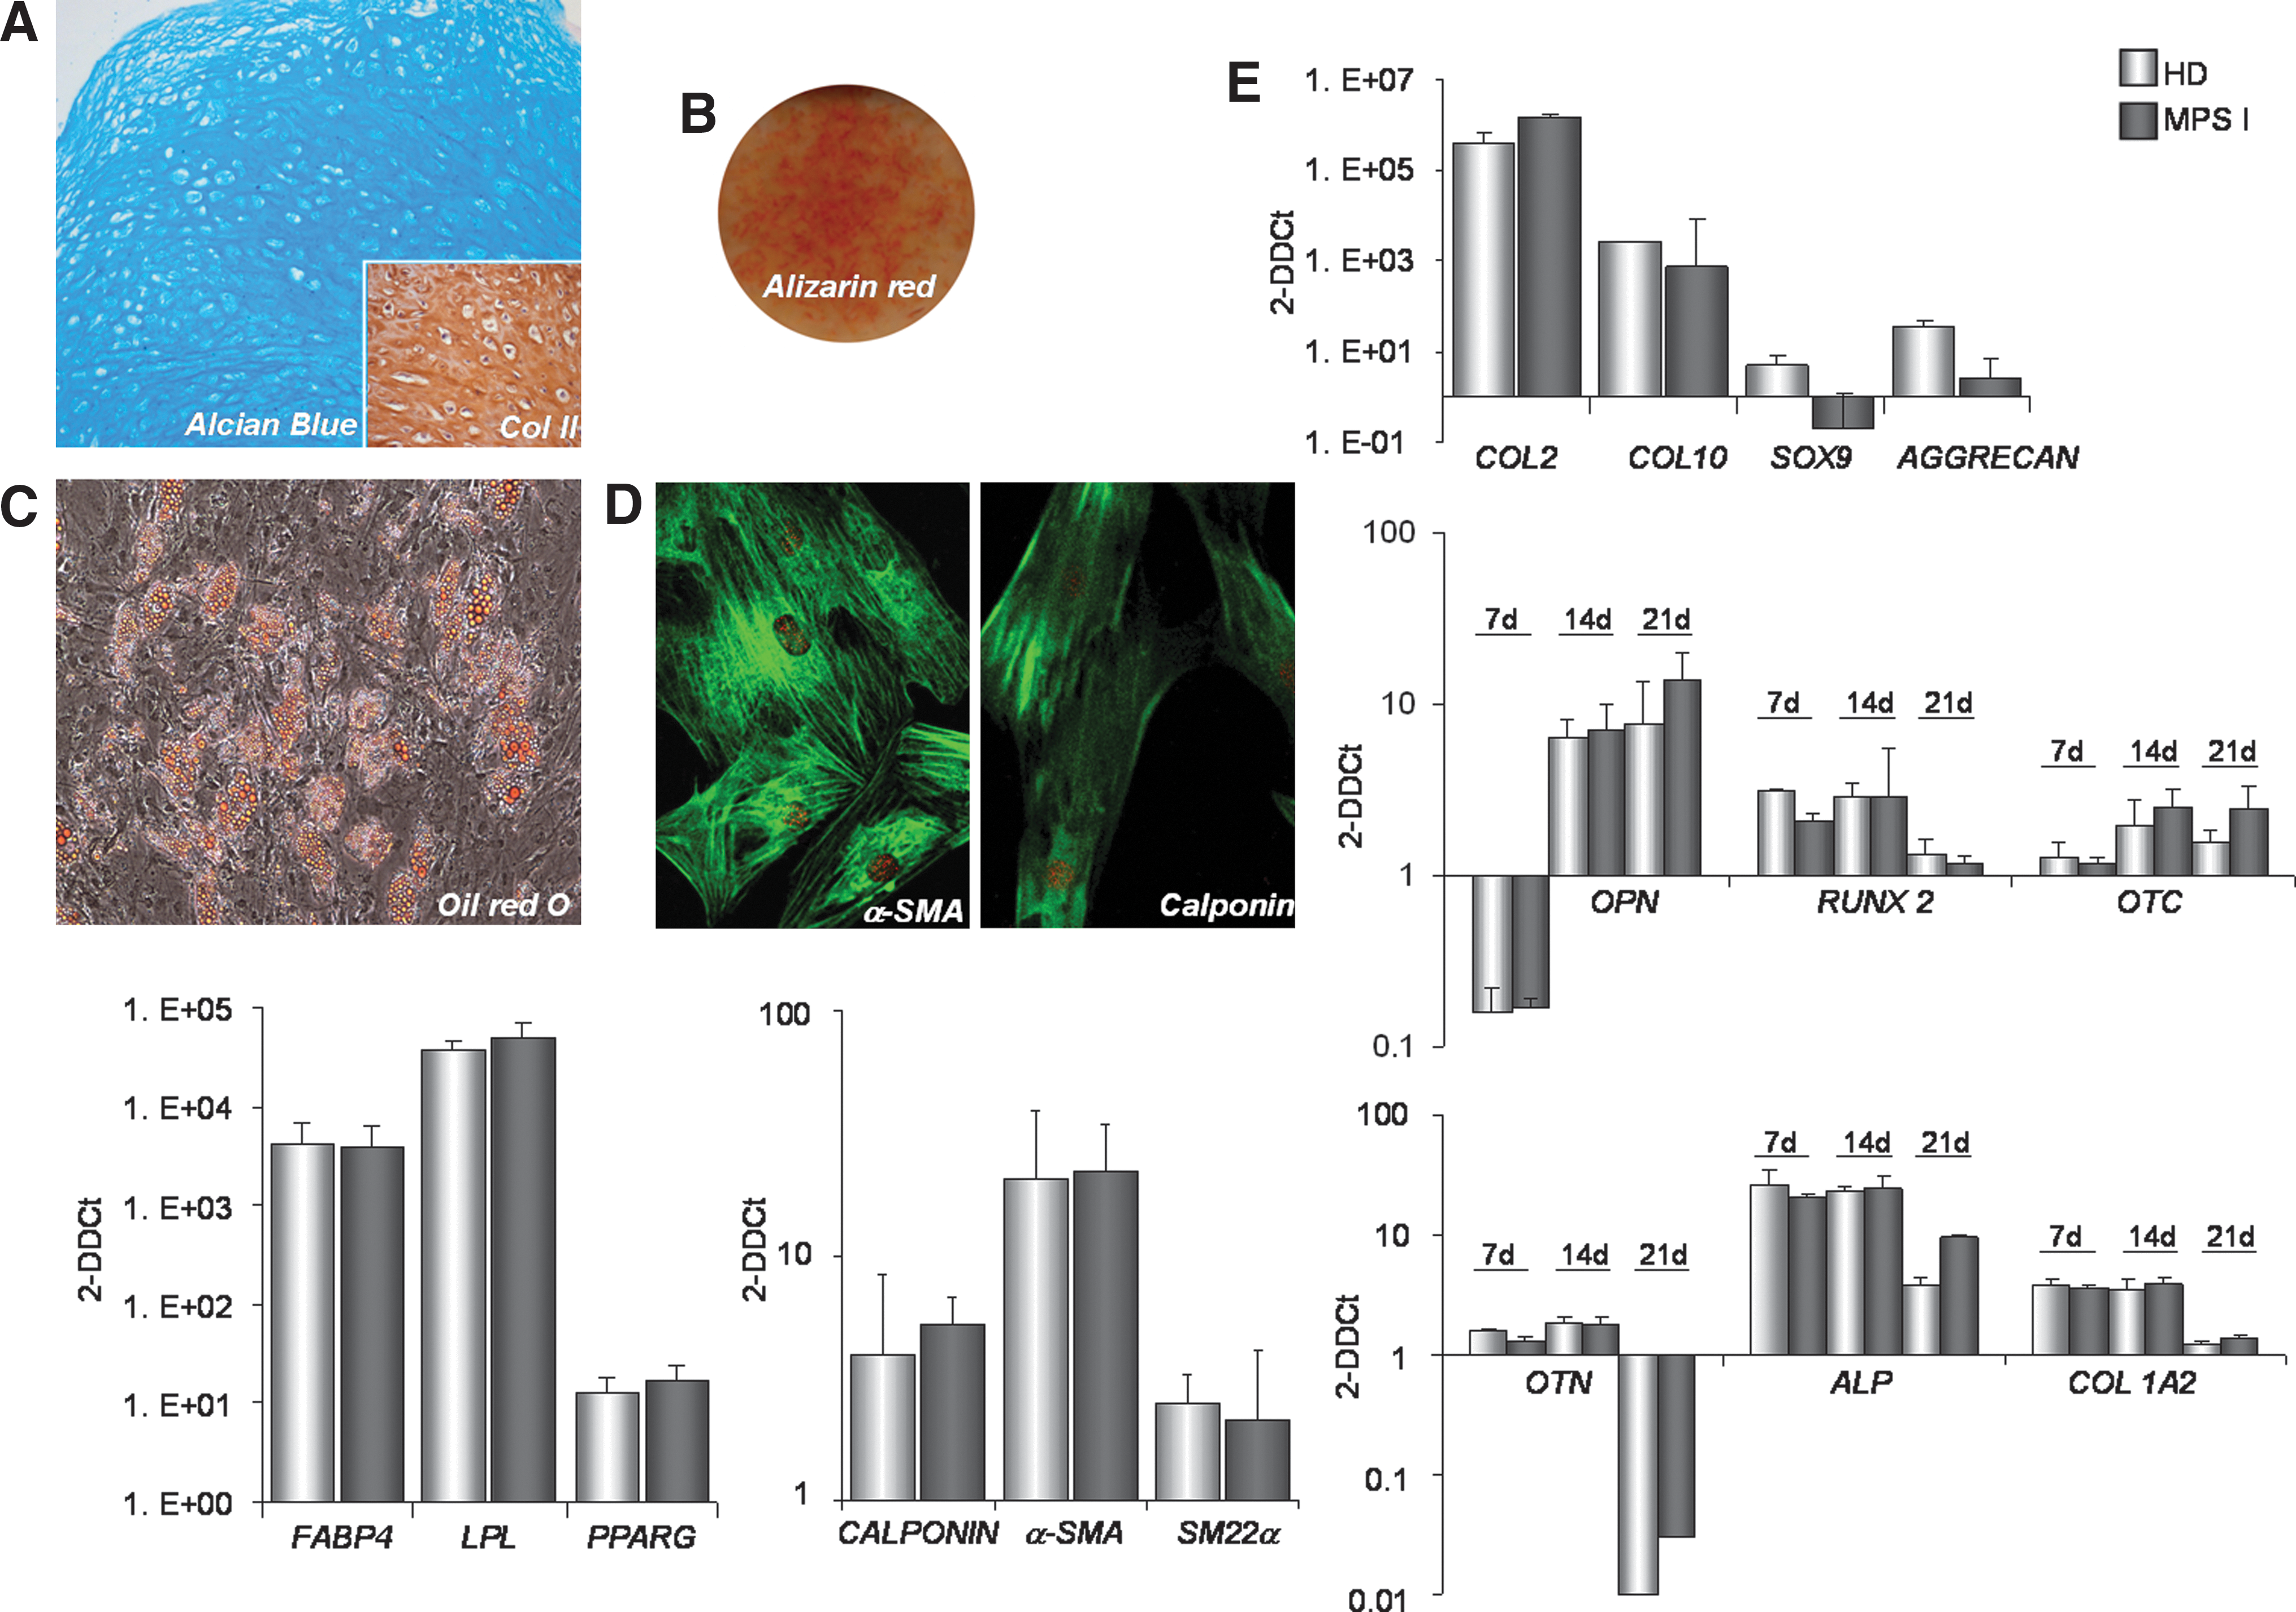
Multilineage differentiation capability of MPS I BMSC.
MPS I and HD BMSC were grown for 3 weeks in osteoblastic and adipocytic differentiation medium. BMSC cultured under osteogenic differentiation conditions were stained with Alizarin Red, to reveal mineral deposits (Fig. 3B), and cells cultured in adipogenic medium were stained with Oil Red O, to detect intracytoplasmic lipid droplets (Fig. 3C). In order to analyze the osteogenic differentiation at the molecular level, the expression of selected genes involved in bone formation [osteopontin (OPN), runt-related transcription factor 2 (RUNX2), osteocalcin (OTC), osteonectin (OTN), alkaline phosphatase (ALP), and type I collagen alpha II chain (COL1A2)] was analyzed at 7, 14, and 21 days by Q-RT-PCR. An increase in all the transcripts analyzed at each time point was detected (Fig. 3E). No significant differences were seen in the levels of these differentiation markers between MPS I and HD BMSC. Likewise, the expression of adipogenesis-related genes [fatty acid binding protein 4 (FABP4), lipoprotein lipase (LPL), and peroxisome proliferator-activated receptor gamma (PPARG)] at 21 days after adipogenic induction was similar in both groups (Fig. 3E).
Since Hurler disease is characterized by multiorgan lesions of connective tissue, we also examined the SMC differentiation capacity of BMSC derived from MPS I versus those derived from HD by culturing with TGF-β1. The transcript levels of SMC contractile apparatus-specific genes, including α-SMA, SM22α, and calponin were analyzed. As shown in Fig. 3E, the culturing of all MPS I and HD BMSC populations with TGF-β1 resulted in a comparable increase in the SMC transcript levels by day 6 compared with undifferentiated BMSC. Immunofluorescence for α-SMA and CALPONIN of MPS I BMSC and HD BMSC confirmed these results (Fig. 3D).
In vivo osteogenic differentiation capacity of MPS I BMSC is normal
An in vivo transplantation assay was then used to assess the bone formation capacity of MPS I versus HD BMSC. MPS I and HD BMSC were loaded onto hydroxyapatite/tricalcium phosphate particles, embedded in fibrin gel, and subcutaneously transplanted into immunocompromised mice. In both groups, analysis of the transplants harvested at 8 weeks (Fig. 4A) revealed abundant newly formed bone tissue containing fully differentiated osteoblasts and osteocytes. MPS I and HD BMSC generated heterotopic bone with a similar amount and distribution (Fig. 4B), suggesting a similar osteogenic capacity for MPS I and HD BMSC.
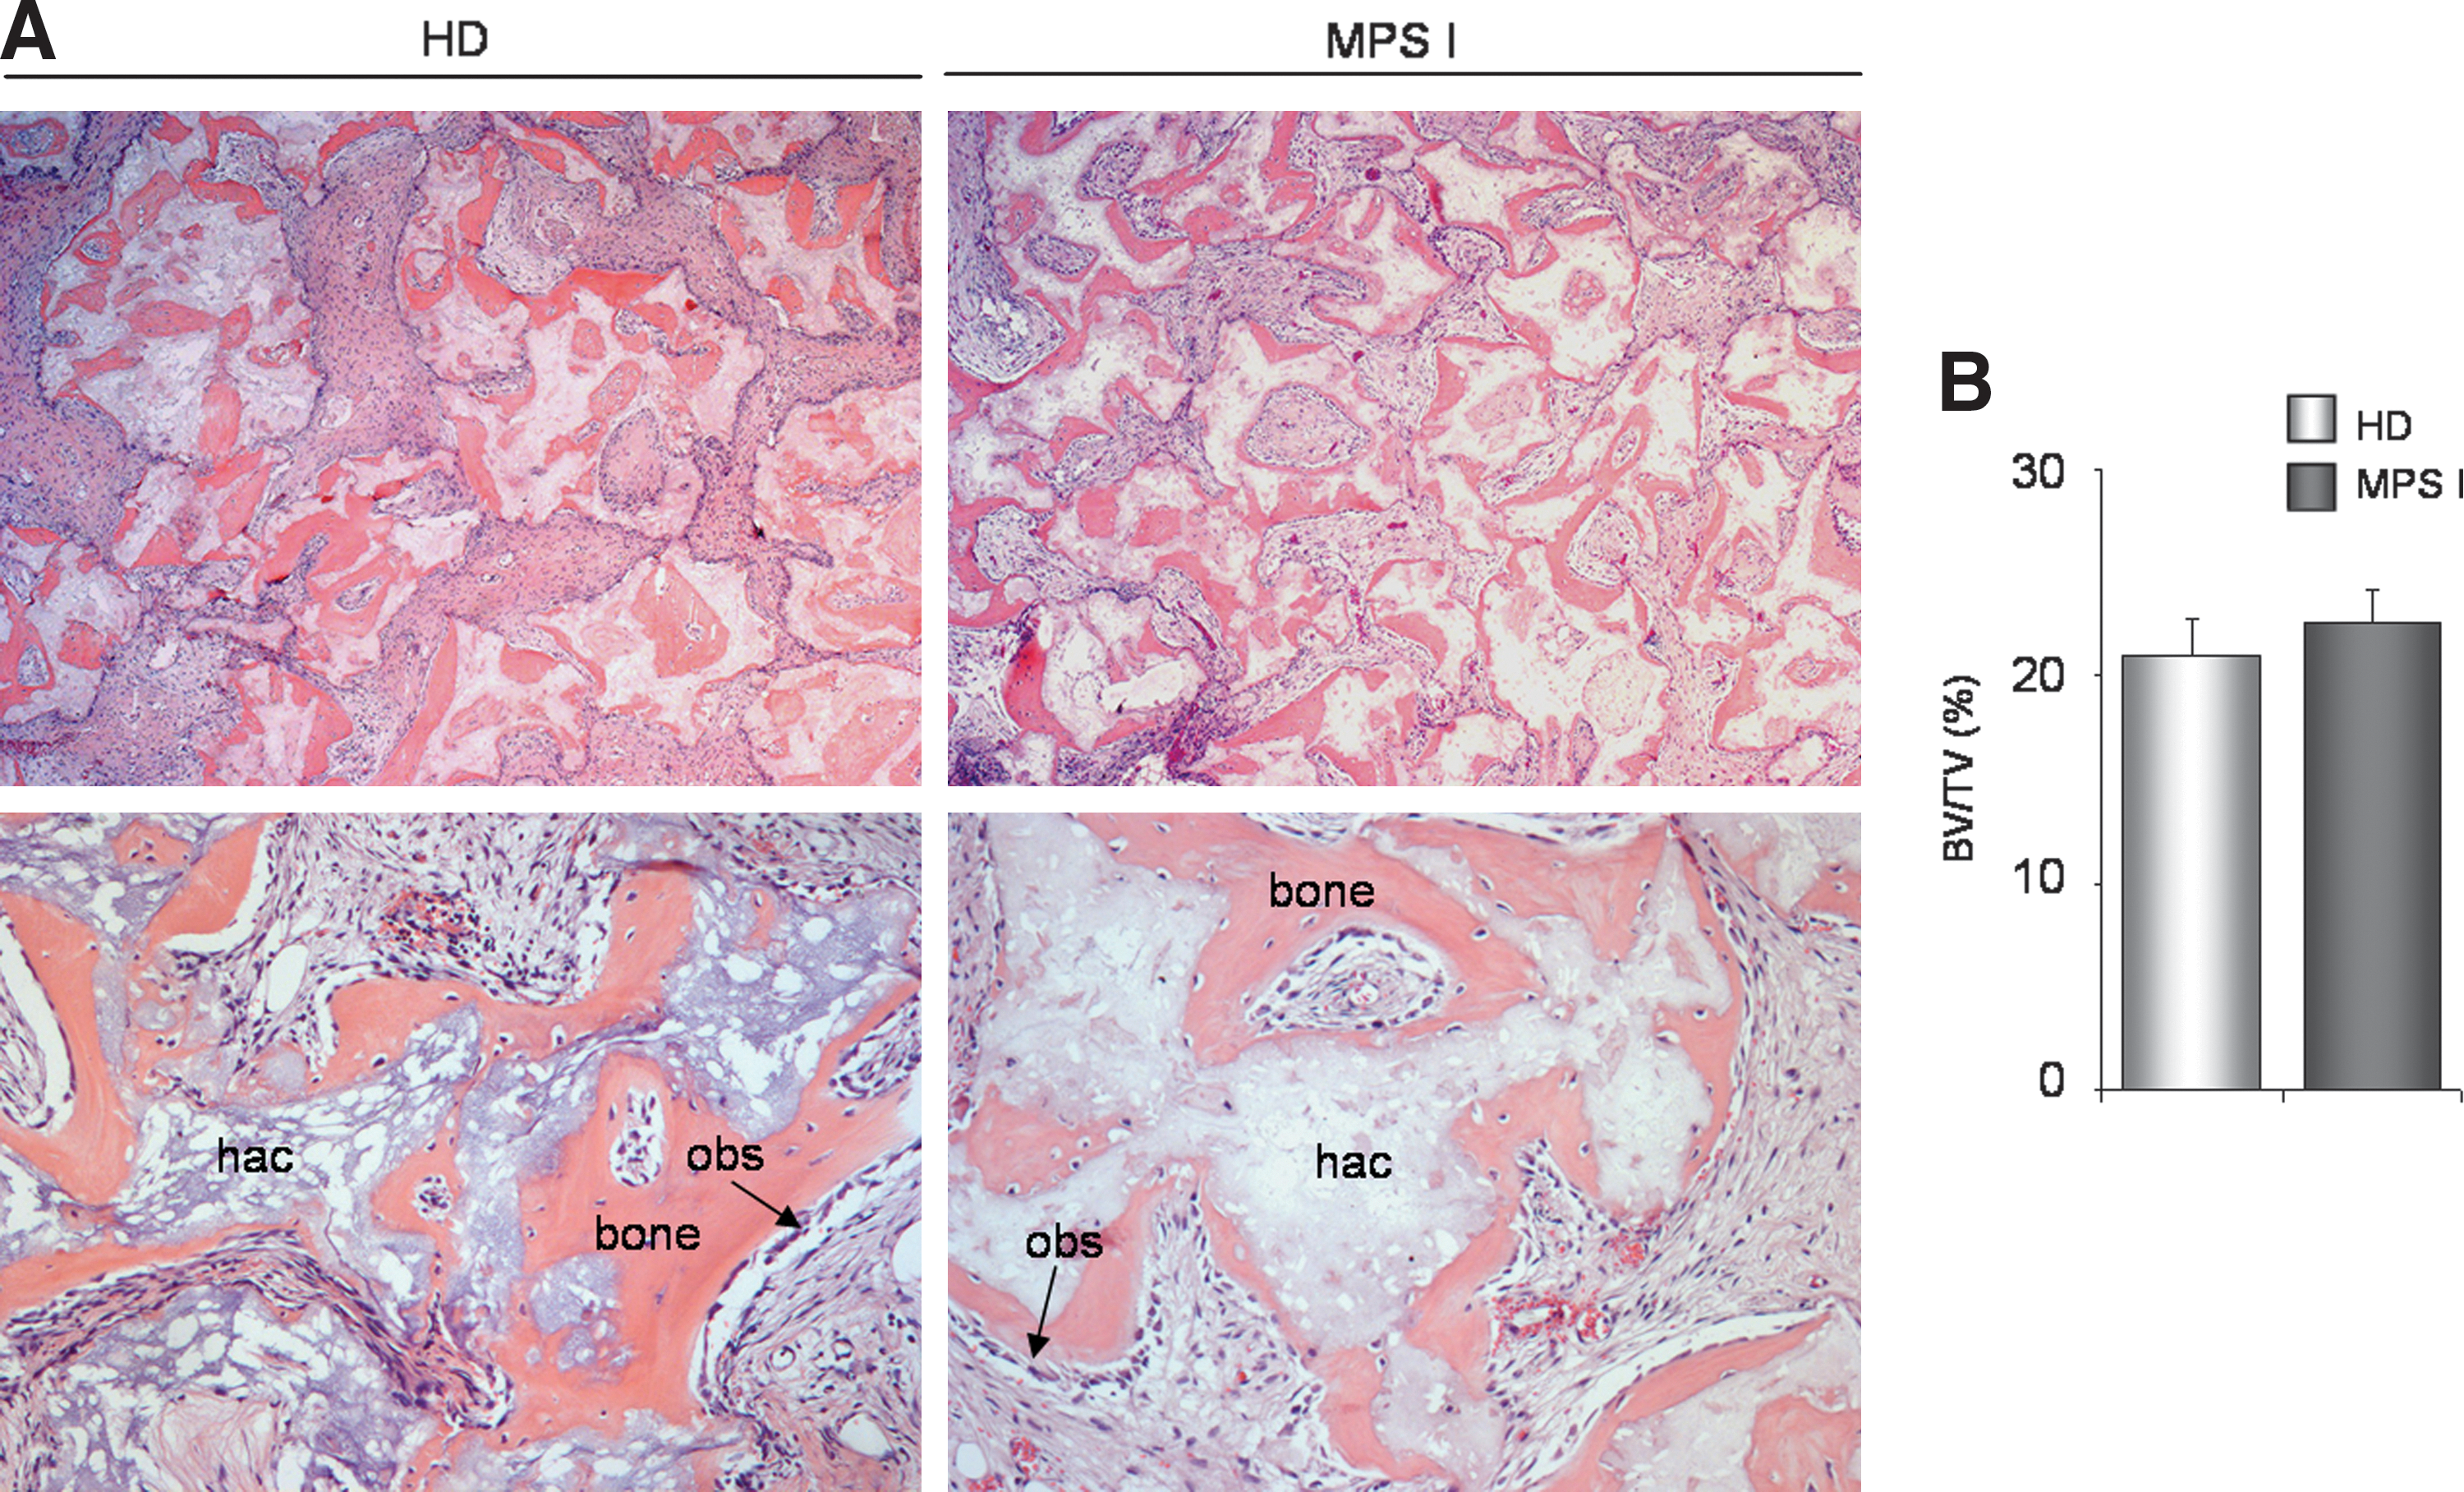
In vivo transplantation of MPS I BMSC versus HD BMSC. MPS I and HD BMSC were loaded in hydroxyapatite/tricalcium phosphate particles, embedded in a fibrin gel, and subcutaneously transplanted into immunocompromised mice. After 8 weeks, the grafts were harvested.
MPS I BMSC have significantly greater pro-osteoclastogenetic capacity than HD cells
To investigate the osteoclastogenic capacity of BMSC derived from MPS IH patients, we established a co-culture system between MPS I and HD BMSC and CD34+ HD BM-derived cells (purity>95%, by flow cytometry), as previously described by Mbalaviele et al. [33], to evaluate the formation of osteoclast-like cells. After 3 weeks, we observed multinucleated cells in both groups of co-cultures (Fig. 5A), and TRAP staining was performed to identify the differentiated osteoclasts and mononuclear precursors. The number of TRAP+ cells in each dish, counted under an inverted-phase contrast microscope (Fig. 5B), was significantly increased in co-cultures with MPS I BMSC compared with those with HD BMSC (P=0.01) (Fig. 5C).
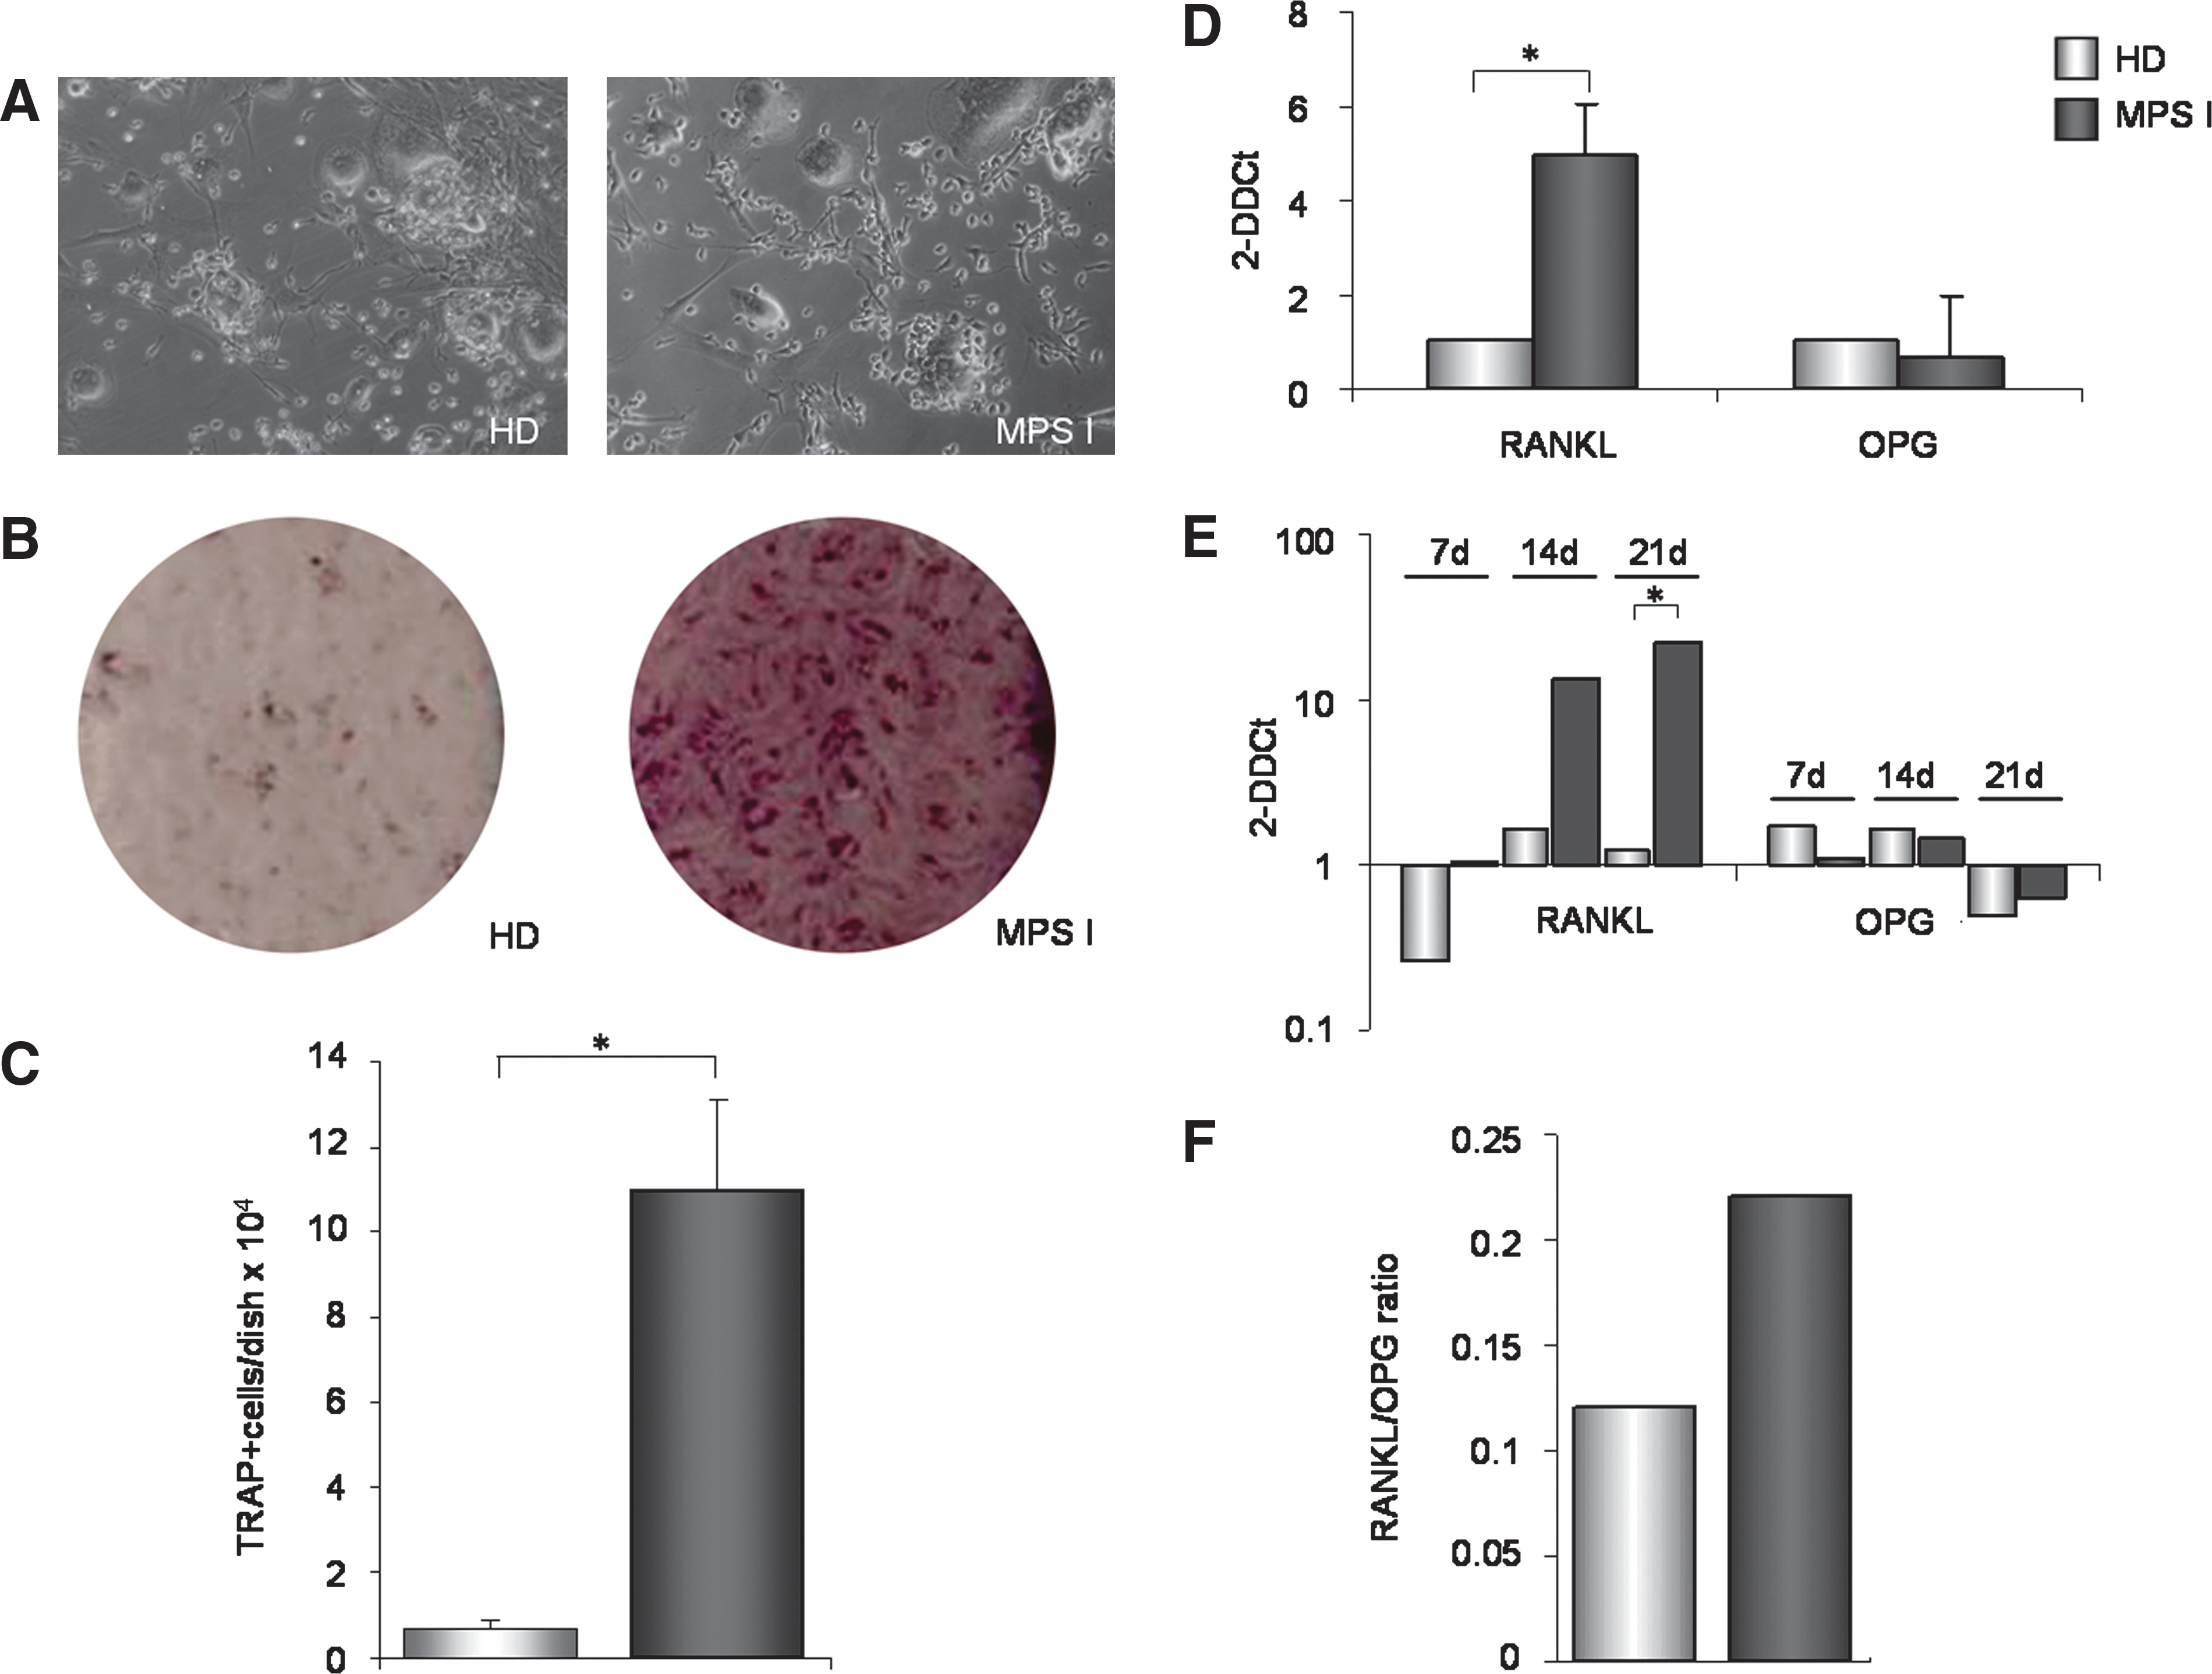
MPS I BMSC induce increased osteoclast formation and express higher levels of RANKL. CD34+ cells were isolated from BM of HD and co-cultured for 3 weeks with MPS I and HD BMSC.
Increased osteoclastogenesis of MPS I BMSC and osteoblasts is associated with increased production of RANKL
RANKL and OPG are key regulators of osteoclastogenesis and bone resorption, mediating the interactions between osteogenic cells and hematopoietic osteoclast precursors. RANKL mRNA levels were significantly higher in the 3 MPS I BMSC samples versus 3 HD BMSC samples (P=0.03) (Fig. 5D), whereas OPG mRNA levels were similar. RANKL and OPG mRNA levels were also measured in osteoblast progeny from MPS-I and HD BMSC. RANKL mRNA levels were higher on days 7 and 14 progeny of MPS I BMSC compared with HD BMSC, reaching significance by day 21 (P=0.04) (Fig. 5E). Again, the OPG expression levels were similar in osteoblasts derived from MPS I and HD BMSC. Accordingly, the RANKL/OPG index, which is as an index of osteoclastogenic stimulation capacity, in the supernatants of day 21 osteogenic progeny of MPS I was higher than in the supernatants of osteoblasts generated from HD BMSC (Fig. 5F), even though not statistically significant (P=0.2).
Discussion
Among the widespread clinical features of MPS, the toxic effect of GAGs in bones and joints leads to the complicated skeletal disease known as dysostosis multiplex. To date, a few studies have described the characteristics of the skeletal defects in Hurler patients [1,3,34 –36], and a limited number of them has investigated the possible mechanisms involved in the bone pathophysiology of this disease [9,10,37]. One of the limitations of all studies, including this study, is the restricted availability of patient samples, which hampers the investigation of rare disorders such as MPS IH and often does not permit adequate statistical analysis. As a result, the pathogenesis of skeletal changes in MPS, and how the disease genotype correlates with a skeletal phenotype, remains unclear. In particular, which cells in the bone environment are critical mediators of skeletal abnormalities remain elusive. Skeletal cells (osteoblasts, chondrocytes, adipocytes, and marrow stroma) primarily involved in development, morphogenesis, and growth of skeletal tissues are of mesenchymal lineage. Osteoclasts (which resorb bone and mineralized cartilage throughout development, modeling, remodeling, and growth of the skeleton), in contrast, are of hematopoietic origin. Dissecting the relative role of skeletal cells of mesenchymal origin, on the one hand, and of osteoclasts, on the other, in generating skeletal abnormalities has obvious relevance to the design of cell-targeted therapies.
In several bone disorders, changes in bony structures are associated with distinct functional changes in BMSC [13]. The latter are known to include postnatal progenitors of skeletal cells (skeletal stem cells, aka mesenchymal stem cells). In general, the notion of skeletal stem cells provides a novel angle for elucidating the key pathogenetic mechanisms of skeletal disorders, an approach that has been productive in other genetic diseases of the skeleton such as fibrous dysplasia [38]. To begin elucidating the pathogenic mechanisms implicated in the musculoskeletal defects of Hurler disease, we isolated and characterized BMSC from pediatric patients diagnosed with MPS IH and compared their biological and functional characteristics with BMSC from age-matched HD. The DNA mutation analysis of the 3 MPS I BMSC primary lines confirmed the pattern found in the parental cells at diagnosis. As expected, an extremely low level of iduronidase activity was detected in these cells. However, similar to HD BMMNC, MPS I BMMNC cultured in the appropriate culture conditions gave rise to expandable BMSC colonies. CFE estimates the frequency of stromal clonogenic progenitors among marrow cells, giving important information about the biological activity of stromal cells [39]. As reported by Kuznetsov et al. [40], CFE can change in pathological conditions and may be reflective of bone tissue or hematopoietic disorders, even in the absence of other evidence of histological alteration of bone or stroma. The frequency of CFU-F in BMMNC of 3 MPS IH patients was significantly lower than in BMMNC of 4 HD patients, which may suggest an altered status of the bone marrow stromal compartment in MPS I.
MPS I BMSC were otherwise very similar to HD BMSC. BMSC from 3 independent MPS IH patients or HD donors exhibited typical BMSC characteristics, including fibroblastoid morphology, expression of the surface proteins CD90, CD73, CD105, and CD146, but not CD14, CD34, and CD45. MPS I and HD BMSC also had a similar proliferation capacity and cell-cycle distribution. The telomerase activity of MPS I and HD BMSC was similar, and a similar cellular senescence profile was observed (data not shown).
Since one possible explanation for the defects in skeletal tissues in MPS IH could be the abnormal differentiation of BMSC to chondrocytes and/or osteoblasts, we compared the differentiation capacity of MPS I and HD BMSC with these lineages. Similar to HD BMSC, MPS I BMSC differentiated to the chondrogenic lineage in vitro, as demonstrated by their capacity to form pellets of cartilage with typical morphology and chondrocyte-specific gene expression. Thus, the in vivo cartilage anomalies observed may not result from an impaired differentiation of cartilage tissue, but might be due to abnormalities in, and dysfunction of, mature chondrocytes. This hypothesis is supported by previous reports demonstrating that GAGs accumulation leads to chondrocyte apoptosis in the articular cartilage and growth plates of MPS animals, with a consequent triggering of inflammatory events and further destruction [41]. It is also possible that, since MPS I BMSC lines used in our work were isolated from pediatric patients, at this early stage of the disease, the capacity of BMSC to differentiate into cartilage is still not altered. In addition, no differences in MPS I BMSC compared with HD-BMSC were found as related to smooth muscle, osteoblast, and adipocyte differentiation in vitro. Furthermore, MPS I BMSC were able to generate genuine, histology-proven bone in vivo, similar to HD BMSC, which suggests that the osteogenic potential of BMSCs per se is not altered in MPS I.
The generation of a murine model for MPS-I was first described by Clarke et al., in which the main features of Hurler disease in humans were recreated in the mouse [42]. At the skeletal level, the most severe difference between MPS-I and wild-type mice is an increase in the amount of cartilage in the subepiphyseal growth plate, despite a simultaneous increase of osteoclasts, as recently described by Wilson et al. [9]. Similarly, Simonaro et al. have described an increase in osteoclast precursors and osteoclasts in BM of MPS VI rats, with an up-regulation of RANKL in fibroblast-like synoviocytes, an important molecule involved in osteoclastogenesis [10]. RANKL is produced by osteoblasts and stromal cells and functions as a key regulator for osteoclast differentiation and activation [43]. The involvement of RANKL in several inflammatory and bone diseases, such as osteoporosis and arthritis, has also been well documented [44,45]. Based on these findings, we hypothesized that a possible increase of the osteoclast number in MPS I growth plates could result from abnormalities in the levels of RANKL/OPG locally produced by BMSC. To test our hypothesis, we evaluated the capacity of MPS I versus HD BMSC to support the generation of osteoclasts from normal CD34 positive cells in vitro [33]. The number of osteoclasts differentiated in the presence of MPS I BMSC was significantly higher. We further demonstrated that RANKL expression is higher in MPS I BMSC and osteoblasts derived from these BMSC, compared with HD BMSC and osteoblasts. We could not detect any significant difference in the expression of other inflammatory or pro-osteolytic cytokines, as such as TGF-β, DKK-1, and IL-6 (data not shown). These data might explain the increased number of osteoclasts during in vitro culture of CD34+ cells with MPS I BMSC. It is, thus, possible that a cell-autonomous dysfunction in MPS I BMSC results in increased osteoclastogenesis via overproduction of RANKL, thus contributing to an explanation of the excess osteoclasts noted in MPS I mice [9]. Wilson et al. [9] hypothesized that an osteoclast cell-autonomous decrease in the collagenolytic activity of cathepsin K could impair osteoclast function, leading to pathological effects on the bones. On the other hand, our data suggest an independent, cell-autonomous functional change in stromal cells that drive osteoclastogenesis. Taken together, our data and those from previous studies focusing on the function of differentiated osteoclasts seem to reveal a more complex derangement of skeletal remodeling than is currently appreciated. A vicious cycle of enhanced osteoclastogenesis and ineffective osteoclastic degradation of bone matrix would contribute to the skeletal phenotype in MPS I, explaining the enhanced numbers of osteoclasts noted in vivo.
In conclusion, we report that BMSC derived from MPS IH patients can generate normal cartilage, bone, and SMC in vitro, and bone tissue in vivo. However, MPS I BMSC and osteoblasts derived from these BMSC produce increased amounts of RANKL and display an increased capacity to stimulate the formation of osteoclasts in vitro. Our results support the hypothesis that aberrant osteoclastogenesis may be one of the aspects involved in Hurler bone disease and that the abnormal ability of MPS I BMSC to support osteoclastogenesis may contribute toward an explanation of the aspects of the skeletal phenotype seen in this disease.
Footnotes
Acknowledgments
The authors would like to thank Doctor Rossella Parini (Rare Metabolic Diseases Unit, Department of Pediatrics, San Gerardo Hospital, Monza, Italy) for advice and comments pertaining to this article. This work was supported by the Italian Telethon Foundation to MS (TCP 07004), by grants from the National MPS Society (United States) to MS, Associazione Italiana Mucopolisaccaridosi to AB and MS, Progetto ARTEVITA, and FWO Odysseus Program, and by K.U.Leuven CoE/PF funds to CMV. MS is assistant telethon scientist. VR was supported by a grant from IWT Flanders.
Author Disclosure Statement
All authors state that they have no conflicts of interest.
References
Supplementary Material
Please find the following supplemental material available below.
For Open Access articles published under a Creative Commons License, all supplemental material carries the same license as the article it is associated with.
For non-Open Access articles published, all supplemental material carries a non-exclusive license, and permission requests for re-use of supplemental material or any part of supplemental material shall be sent directly to the copyright owner as specified in the copyright notice associated with the article.