
Abstract
Mesenchymal stem cells (MSCs) are adult stem cells with a self-renewal and multipotent capability and express extensively in multitudinous tissues. We found that water channel aquaporin-5 (AQP5) is expressed in bone marrow-derived MSCs (BMMSCs) in the plasma membrane pattern. BMMSCs from AQP5−/− mice showed significantly lower plasma membrane water permeability than those from AQP5+/+ mice. In characterizing the cultured BMMSCs from AQP5−/− and AQP5+/+ mice, we found no obvious differences in morphology and proliferation between the 2 genotypes. However, the multiple differentiation capacity was significantly higher in AQP5−/− than AQP5+/+ BMMSCs as revealed by representative staining by Oil Red O (adipogenesis); Alizarin Red S and alkaline phosphatase (ALP; osteogenesis); and type II collagen and Safranin O (chondrogenesis) after directional induction. Relative mRNA expression levels of 3 lineage differentiation markers, including PPARγ2, C/EBPα, adipsin, collagen 1a, osteopontin, ALP, collagen 11a, collagen 2a, and aggrecan, were significantly higher in AQP5−/− -differentiating BMMSCs, supporting an increased differentiation capacity of AQP5−/− BMMSCs. Furthermore, a bone-healing process was accelerated in AQP5−/− mice in a drill-hole injury model. Mechanistic studies indicated a significantly lower apoptosis rate in AQP5−/− than AQP5+/+ BMMSCs. Apoptosis inhibitor Z-VAD-FMK increased the differentiation capacity to a greater extent in AQP5+/+ than AQP5−/− BMMSCs. We conclude that AQP5-mediated high plasma membrane water permeability enhances the apoptosis rate of differentiating BMMSCs, thus decreasing their differentiation capacity. These data implicate AQP5 as a novel determinant of differentiation of BMMSCs and therefore a new molecular target for regulating differentiation of BMMSCs during tissue repair and regeneration.
Introduction
M
Water homeostasis may play important roles in stem cell differentiation, as stem cells transport considerable amount of water into or out of the cells to achieve rapid volume regulation during differentiation [12]. A few recent studies indicated expression and function of AQPs in stem cells. AQP3 was reported to express in human fetal airway epithelial progenitor cells [13]. AQP4, AQP8, and AQP9 were found to express in murine adult neural stem cells (ANSCs) [12 –14]. AQP8 might play a key role in mitochondrial volume regulation during ANSC differentiation [12]. The expression levels and cellular localization of AQP4 and AQP9 were differentially regulated during ANSC differentiation into neurons and glial cells [14]. Kong et al. found that AQP4 deletion reduced the proliferation, migration, survival, and neuronal differentiation of ANSCs of adult mice [15]. The mechanisms involve altered intracellular Ca2+ dynamics and decreased expression of connexin43 and the CaV1.2 subtype of L-type voltage-gated Ca2+ channel in ANSCs. The expression and function of AQPs in bone marrow-derived mesenchymal stem cells (BMMSCs) remain unknown.
In the present study, we discovered the expression of aquaporin-5 (AQP5) in mouse BMMSCs. Using a transgenic AQP5 knockout (AQP5−/− ) mouse model, we characterized the function of AQP5 in the differentiation capacity of BMMSCs. The results revealed significantly increased adipogenic, osteogenic, and chondrogenic differentiation potential of BMMSCs from AQP5−/− mice. The underlying mechanism may involve decreased apoptosis of AQP5−/− BMMSCs associated with reduced plasma membrane water permeability.
Materials and Methods
Mice
AQP5−/− mice in a CD1 genetic background were used in the present study. AQP5−/− mice were maintained and genotyped as described previously [16]. All experiments were conducted on 6- to 8-day-old AQP5+/+ and AQP5−/− male mice from mating pairs of AQP5+/− parents. Mouse procedures were approved by the Experimental Animal Committee of Jilin University (Permit No: SCXK 2007-0011).
BMMSCs isolation and culture
Bone marrow was obtained from 6- to 8-day-old male CD1 mice by flushing femurs and the tibias cavity using low glucose-Dulbecco's modified Eagle medium (LG-DMEM) (Sigma–Aldrich), supplemented with 10% fetal bovine serum (FBS; Tissue Culture Biologicals), 2 mM L-glutamine (Gibco, Invitrogen), 100 U/mL penicillin, and 100 mg/mL streptomycin (Gibco, Invitrogen). After filtration, the cell suspension was centrifuged at 1,000 rpm for 5 min. Red blood cells were lysed with a lysis buffer (0.01 M KHCO3 and 0.15 M NH4Cl) for 50 s. After centrifugation, the cell pellet was resuspended in the LG-DMEM culture medium, and 10 million cells were plated to a 100-mm culture dish (Nunc) and incubated at 37°C in 5% CO2 and 95% air atmosphere for 12 h. Unattached cells were removed, and a fresh medium was replaced every other day until cells reached 90% confluency. Cells were then subcultured at a 1:2 ratio. BMMSCs identified at passage 3 were used for all studies.
Immunofluorescence
Adherent cells from the bone marrow cultured on a Lab-Tak coverglass chamber (Nunc) for 24 h were washed twice with phosphate-buffered saline (PBS). The cells were fixed with 4% (w/v) paraformaldehyde (PFA) for 15 min, followed by washing with PBS, and permeabilized with 0.1% (v/v) Triton X-100 for 15 min. The cells were blocked with 2% (w/v) bovine serum albumin (BSA, Type V; Sigma–Aldrich) for 1 h at room temperature and then incubated overnight at 4°C with the rabbit anti-rat AQP5 antibody (1:500; Millipore Corporation) and rat anti-human CD44 (1:500; Millipore Corporation), rat anti-mouse CD90, CD31, CD45, and CD11b (1:400; Abcam), and Sca-1 (1:200; Biolegend) antibodies, respectively. After washing 3 times, cells were incubated with a Cy3-conjugated sheep anti-rabbit IgG secondary antibody (1:500; Sigma–Aldrich) and fluorescein isothiocyanate (FITC)-conjugated goat anti-rat IgG secondary antibody (1:100; Sigma–Aldrich) together for 1 h at room temperature. The images of the cells were recorded using Confocal Microscopy (FV1000; Olympus).
Reverse transcription–polymerase chain reaction
Total RNA was isolated from bone marrow adherent cells using the Trizol reagent (Invitrogen) and cDNAs were reverse transcribed with a SuperScript First-strand Synthesis System (Invitrogen). The AQP5 coding sequence was polymerase chain reaction (PCR)-amplified using primers shown in Table 1.
Immunoblotting
Cells in culture were rinsed twice with PBS and lysed on ice with western blot and immunoprecipitation (WIP) cell lysis reagent (BIOSS; Beijing Biosynthesis Biotechnology Co. Ltd.) supplemented with 1% phenylmethanesulfonyl fluoride (PMSF) for 30 min. The insoluble protein lysate was removed by centrifugation at 12,000 g for 15 min at 4°C. The protein concentrations were determined using a NanoDrop 1000 (Thermo Scientific) spectrophotometer. Proteins (50 μg) were resolved on 12% sodium dodecyl sulfate–polyacrylamide gel electrophoresis and blotted on polyvinylidene fluoride (PVDF) membranes. The membranes were washed with the Tris-buffered saline–tween (TBST) solution twice and blocked with 5% (w/v) nonfat milk for 1 h at room temperature. The membranes were then washed with TBST, and incubated overnight with the β-actin mouse monoclonal antibody (1:400; Cell Signaling), rabbit anti-rat AQP5 antibody (1:2,000), or rabbit anti-mouse C/EBPα and CBFA1 (Runx2) antibodies (1:500; BIOSS, Beijing Biosynthesis Biotechnology Co. Ltd.) at 4°C. After washing, the blots were incubated separately with a horse radish peroxidase-conjugated goat anti-rabbit IgG secondary antibody (1:5,000; Sigma–Aldrich) for 1 h. After washing with TBST, signals were detected using an enhanced chemiluminescence kit (Milipore Corporation). The densitometry of each band was analyzed using ImageJ software with β-actin as an internal control.
Flow cytometry
BMMSCs were harvested by trypsin digestion and washed twice with PBS. Then, cells were fixed in 4% PFA for 20 min and permeabilized with 0.1% Triton X-100 for 15 min. After washing with PBS, 1% BSA was added into cells in a centrifuge tube and incubated for 1 h. After centrifugation at 1,000 rpm for 5 min, cells were incubated with Alexa Fluor 488–conjugated anti-CD44, Sca-1, CD90, CD31, CD45, and CD11b antibodies (1:50; Biolegend), respectively, in the dark and incubated at 37°C for 1 h. Then, the cells were centrifuged, washed with PBS, and resuspended in 200 μL PBS. After filtration (300 apertures), cells were analyzed by flow cytometry (Beckman Coulter; Epics XL).
Water permeability measurement
Water permeability measurement was performed using the calcein acetoxymethylester (calcein-AM) fluorescence quenching method as reported previously [17] with some modifications. In brief, AQP5+/+ and AQP5−/− BMMSCs were cultured on microscope coverglass (Fisher). Cells were incubated with 5 μM calcein-AM (Sigma–Aldrich) for 15 min in dark at room temperature and then transferred to a perfusion chamber with switch for rapid solution exchange. By exchanging perfusate osmolality between 300 mOsmol (PBS) and 500 mOsmol (PBS with sucrose), the time course of calcein-AM fluorescence quenching with an osmotic gradient was recorded. A reciprocal exponential time constant (1/τ) was used as the shrinking rate of cells, where τ is the time required from the starting point of the osmotic switch to the point when cytoplasmic calcein fluorescence quenching reaches maximum.
Proliferation analysis
For the colony forming units-fibroblastic (CFU-F) assay, isolated nucleated cells from bone marrow were plated at a density of 2×10⁵ cells in a 60-mm culture dish (104 cells/cm2; Nunc). The culture medium was replaced every 3 days. After 14 days, cells were stained with 5% (w/v) crystal violet (Sigma–Aldrich) for 15 min at room temperature. Colonies larger than 50 cells were counted under a microscope. The colony-forming efficiency was quantified by the number of colonies/dish.
To quantify the proliferation of BMMSCs in undifferentiated condition, cells were cultured in 12-well plates at a density of 5,000 cells/well with a complete medium. At days 1, 3, 5, and 7 cells were counted using a hemacytometer.
In vitro differentiation
BMMSCs at passage 3 were used for adipogenic, osteogenic, and chondrogenic differentiation according to the procedures reported by Mary Murphy with some modifications [18].
For adipogenic differentiation, cells were seeded into a 6-well plate. Confluent cells were first subjected to an adipogenic induction medium containing high glucose-Dulbecco's modified Eagle medium (HG-DMEM), 10% FBS, 1 μM dexamethasone, 200 μM indomethacin, 0.5 mM methylisobutylxanthine, and 10 μg/mL insulin (Sigma–Aldrich) for 48 h, and then cells were incubated in a maintenance medium containing HG-DMEM, 10% FBS, and 10 μg/mL insulin for 48 h. The above procedure was repeated twice. Control wells were cultured in a growth medium over the same time course. Lipid vesicles were stained by 2% (w/v) Oil red O (Sigma–Aldrich). The adipogenic differentiation potential of BMMSCs was further quantified by flow cytometry after staining of lipid vesicles with 0.5 μg/mL Nile Red dye (Sigma–Aldrich) as described previously [19].
For osteogenic induction, BMMSCs were seeded into a 12-well plate at a density of 2,000 cells/cm2. After 24 h, cells were maintained in an osteogenic induction medium (0.1 μM dexamethasone, 50 μM ascorbic acid, and 10 mM β-glycerophosphate) for 21 days. A fresh induction medium was replaced every 3 days. Control wells were cultured in the growth medium for 21 days. All the wells were stained with 2% (w/v) Alizarin Red S (Sigma–Aldrich) to visualize extracellular mineralization and the alkaline phosphatase (ALP) dye solution (Nanjing Jiancheng Bioengineering Institute) for ALP activity. Osteogenesis potential was quantified by detecting the amount of calcium deposits and ALP activity. As described previously with some modifications [20], before quantification of calcium deposition, cells in a 12-well plate were incubated with 0.5 N acetic acid overnight on a shaker to allow the calcium released into the solution. Samples were diluted 10 times, and absorbance at 610 nm was measured on microplate reader (Thermo) using a Diagnostics Calcium kit (Nanjing Jiancheng Bioengineering Institute) in a 96-well plate. Calcium concentration was calculated by comparing the sample with the standard provided in the kit. The ALP activity was assayed by a colorimetric method using an ALP activity kit (Nanjing Jiancheng Bioengineering Institute). The absorbance was measured at 520 nm on a microplate reader, and the amount of ALP was standardized to the concentration of protein in the same well.
For chondrogenic induction, cells were detached, counted, and centrifuged into microspheres (5×10⁶ cells/pellet) in 15-mL conical polypropylene tubes. Pellets were incubated for 21 days in the chondrogenic induction medium (HG-DMEM supplemented with 0.1 μM dexamethasone, 0.1 mM ascorbic acid, 1% insulin-transferrin-selenium [ITS], 10 μg/mL insulin [Sigma–Aldrich], and 10 ng/mL human transforming growth factor-β1 [TGF-β1] [Pepro Tech., Inc.]). A fresh induction medium was replaced every 2–3 days. Chondrogenic differentiation was determined by staining with 6% (w/v) Safranin O (Sigma–Aldrich) and type II collagen immunohistochemistry using a type II collagen mouse monoclonal antibody (1:200; Lab Vision). The chondrogenic differentiation potential was measured by quantification of sulfated glycosaminoglycan (GAG) as described previously [21]. Briefly, differentiated pellets were digested at pH 6.0, 65°C for 16 h with a papain solution (Sigma–Aldrich) diluted to 1 μg/mL in 0.1 M NaH2PO4, 5 mM Na2EDTA, and 5 mM cysteine-HCl. The measurement was conducted by a reaction with Alcian Blue (Sigma–Aldrich), and the absorbance was measured at 600 nm on a microplate reader, and the sulfated GAG concentration was calculated by shark chondroitin sulfate as standard.
In some experiments, the apoptosis inhibitor Z-VAD-FMK (Beyotime) at 20 μM was applied to the differentiation medium of AQP5+/+ and AQP5−/− BMMSCs.
Real-time PCR
Total RNA was extracted from induced and uninduced cells using Trizol reagent. cDNA was reverse transcribed from 2 μg total RNA with an oligo (dT) primer using SuperScript First-strand Synthesis System according to the manufacturer's instruction. Relative mRNA expression of PPARγ2, C/EBPα, adipsin, collagen 1a, osteopontin, ALP, collagen 11a, collagen 2a, and aggrecan was quantified by real-time PCR on the Roche LightCycler-480 with the FastStart Universal SYBR Green Master (ROX) kit (Roche Diagnostics). The primers for real-time PCR were listed in Table 1. PCR conditions were 95°C for 10 min, followed by 40 cycles of 95°C for 15 s and 60°C for 1 min. The relative expression level of every gene was calculated with the 2−ΔΔCt method as performed previously [22].
Bone healing
AQP5+/+ and AQP5−/− male mice at 8 weeks of age were used for the drill-hole injury model. After pentobarbital anesthesia, a 10-mm-long skin incision was made in the right femur of mice on the lateral side. The bone was exposed by splitting the muscles and removing the periosteal membrane. The drill-hole injury was made in the femur as described previously [23]. At 0, 14, and 21 days post-surgery, bone healing in the injury site was first assessed by measuring the bone mineral density (BMD) using DXA scanning (DCS 600EX-III; Aloka), and the values of BMD (mg/cm2) were recorded. The mice were then sacrificed by an overdose of pentobarbital. The femurs including the drilled site were removed and processed for paraffin sections with hematoxylin and eosin staining by standard methods.
Apoptosis assay
To analyze the cell number of BMMSCs in a differentiation medium, cells were seeded at 80,000 cells/well in 12-well plates with a complete medium for 24 h and then changed to an adipogenic and osteogenic induction medium. The number of live cells was counted at different time points.
For flow cytometry analysis of apoptosis, differentiated and undifferentiated AQP5+/+ and AQP5−/− BMMSCs were incubated with 1 μM paclitaxel (Sigma–Aldrich) for 24 h. The cells were collected by centrifugation at 1,000 rpm. After washing with PBS, cells were labeled with 5 μL FITC-conjugated annexin V in dark for 10 min and then with 10 μL propidium iodide (PI) according to the instruction of the kit (Beyotime). Apoptosis were analyzed by flow cytometry.
Statistical analysis
Statistical analysis was performed by SPSS statistics (version 17.0) using 2-tailed Student's t-test. Results are expressed as mean±standard deviation of 3 to 8 independent experiments.
Results
AQP5 expression in the plasma membrane of BMMSCs
Primary cultured bone marrow adherent cells from AQP5+/+ and AQP5−/− mice were analyzed by reverse transcription-polymerase chain reaction (RT-PCR), western blot, and immunofluorescence. As shown in Fig. 1, AQP5 mRNA (Fig. 1A) and protein expression (Fig. 1B) were detected in AQP5+/+ cells but not in AQP5−/− cells. Figure 1C shows immunofluorescence of AQP5 and positive MSC markers (CD44, Sca-1, and CD90) and negative MSCs markers (CD31, CD45, and CD11b) on AQP5+/+ and AQP5−/− cells. AQP5 is expressed in the plasma membrane of BMMSCs with positive BMMSCs markers, but not cells with BMMSCs negative markers. These results indicated selective AQP5 expression on BMMSCs.
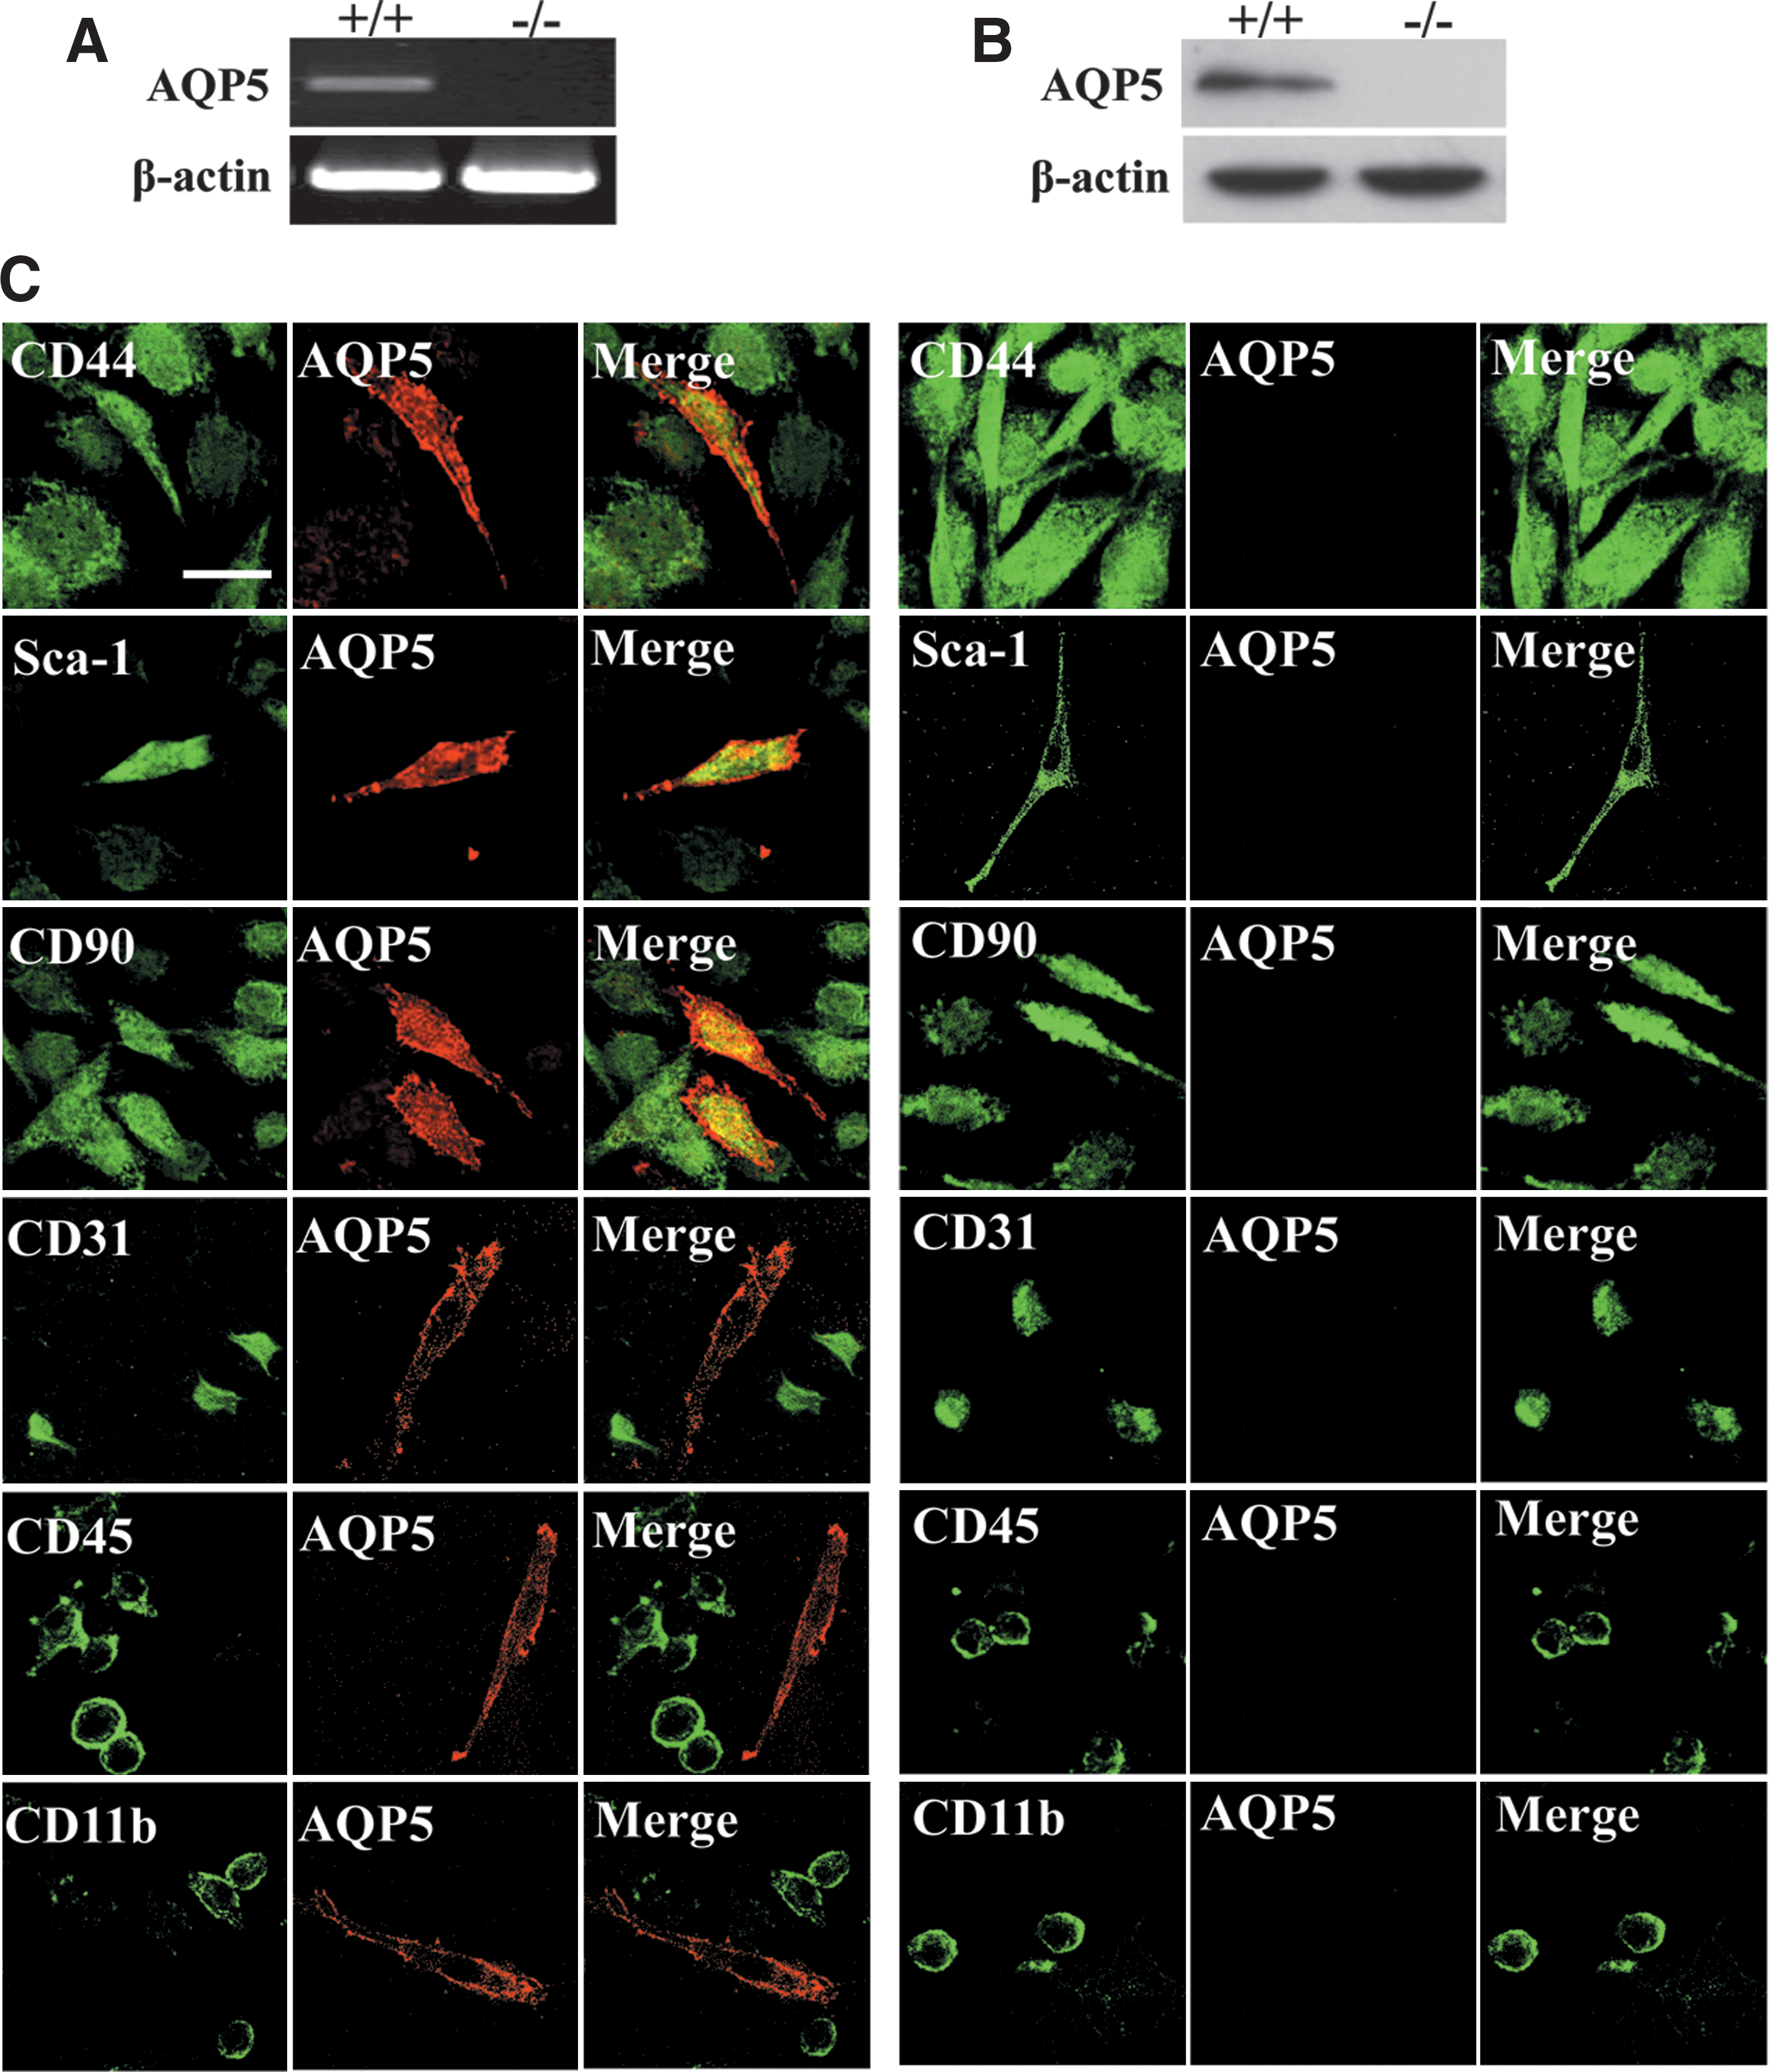
Aquaporin-5 (AQP5) expression in the plasma membrane of bone marrow-derived mesenchymal stem cells (BMMSCs) in primary bone marrow culture. Reverse transcription-polymerase chain reaction (RT-PCR)
Reduced plasma membrane water permeability in AQP5−/− BMMSCs
To determine the purity of the BMMSCs, a flow cytometry analysis was performed as positive and negative screening. As shown in Fig. 2A, most cells of AQP5+/+ and AQP5−/− origin (>93%) at passage 3 expressed positive BMMSCs markers CD44, Sca-1, and CD90, but not negative BMMSCs markers CD31, CD45, and CD11b, suggesting that these cells are nearly pure BMMSCs. The AQP5+/+ and AQP5−/− BMMSCs at passage 3 in the primary culture are morphologically similar. Immunofluorescence indicated AQP5 staining in >95% cells in AQP5+/+ but not in AQP5−/− BMMSCs (Fig. 2B). Figure 2C shows that the plasma membrane water permeability of AQP5−/− BMMSCs was reduced by ∼50% as compared to AQP5+/+ BMMSCs.

Water permeability measurement of AQP5+/+
and AQP5−/−
BMMSCs.
BMMSCs proliferation is not affected by AQP5 deficiency
To compare the differences in the growth potential of AQP5+/+ and AQP5−/− BMMSCs, we first examined the colony frequency occurrences of BMMSCs in the bone marrow using the CFU-F assay. As shown in Fig. 3A, the number of colonies formed from AQP5−/− bone marrow-nucleated cells was not significantly different from AQP5+/+ cells (22.17±2.31 vs. 21.67±2.16 in AQP5+/+ , P>0.05). The proliferation rate of BMMSCs in the growth medium at passage 3 was also similar in both genotypes (Fig. 3B).

Proliferation analysis of AQP5+/+
and AQP5−/−
BMMSCs.
Increased differentiation capacity of AQP5−/− BMMSCs
To compare the adipogenic differentiation capacity between AQP5+/+ and AQP5−/− BMMSCs, cells at passage 3 were incubated by the adipogenic induction medium for 8 days. As shown in Fig. 4A, adipogenic differentiation was indicated by Oil Red O staining of numerous intracellular lipid droplets as compared to uninduced cells. There were more Oil Red O-positive adipocytes that were differentiated from AQP5−/− BMMSCs (60.78%±2.16% vs. 45.98%±5.5% in AQP5+/+ , P<0.01). The flow cytometry analysis of cells stained by Nile Red also indicated significantly a higher percentage of adipocytes differentiated from AQP5−/− BMMSCs (58.48%±3.78% vs. 44.91%±5.66% in AQP5+/+ , P<0.01) (Fig. 4B). Real-time PCR was conducted to further quantify the adipogenic potential of AQP5+/+ and AQP5−/− BMMSCs by determining the relative mRNA expression levels of the adipogenic markers PPARγ2, C/EBPα, and adipsin. As shown in Fig. 4C, the relative mRNA expression levels of all the 3 marker genes were significantly higher in adipogenic AQP5−/− BMMSCs after induction for 8 days (PPARγ2: 6.07±0.53 vs. 3.67±0.98 in AQP5+/+ , P<0.05; C/EBPα: 11.07±2.01 vs. 6.65±1.13 in AQP5+/+ , P<0.05; Adipsin: 2,537.21±181.66 vs. 375.67±83.61 in AQP5+/+ , P<0.01).
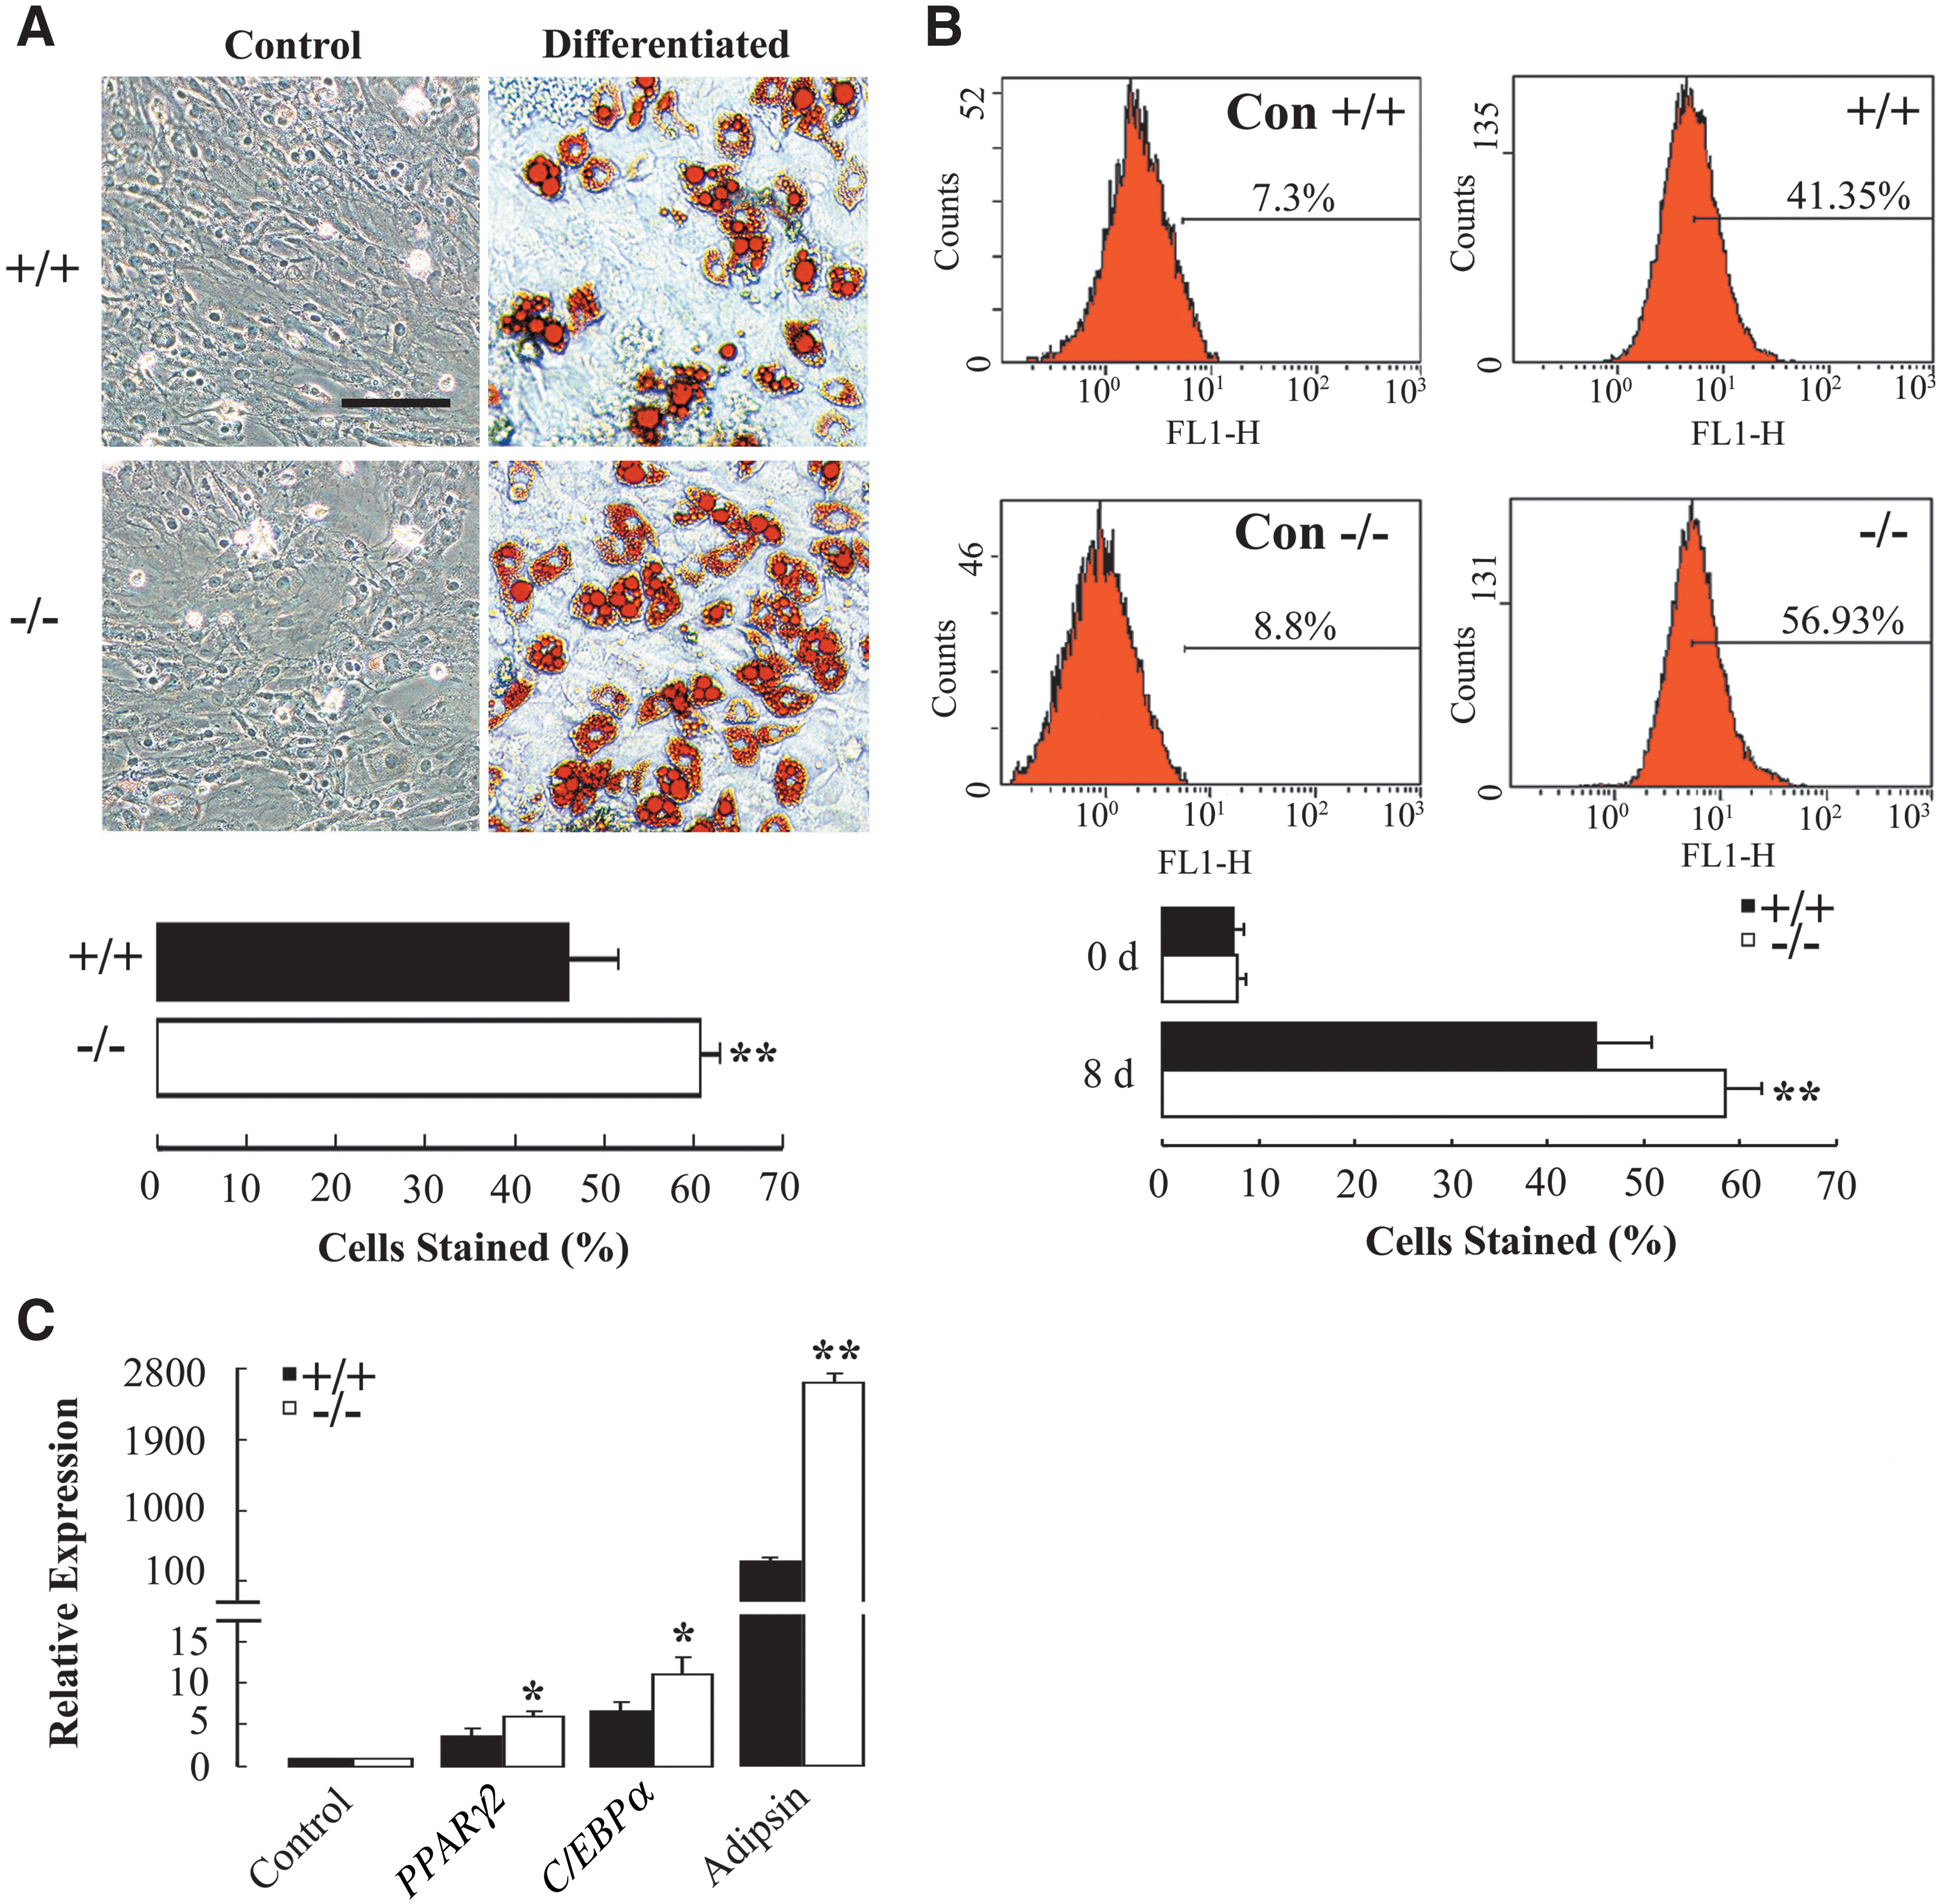
Adipogenic differentiation of BMMSCs from AQP5+/+
and AQP5−/−
mice.
The osteogenic potential of AQP5+/+ and AQP5−/− BMMSCs was first analyzed by Alizarin Red S and ALP staining. As shown in Fig. 5A, extracellular mineralization was visualized by Alizarin Red S staining after osteogenic induction for 21 days. The calcium content was significantly higher in the mineralized AQP5−/− BMMSCs (15.93±1.05 vs. 11.56±0.72 μg/well in AQP5+/+ , P<0.01). Figure 5B shows ALP staining and normalized ALP activity of osteogenic BMMSCs. ALP activity was also higher in osteogenic AQP5−/− BMMSCs (8.65±0.81 vs. 5.99±0.96 U/g in AQP5+/+ , P<0.05). The relative mRNA expression levels of osteogenic differentiation markers collagen 1a, osteopontin, and ALP were markedly higher in osteogenic AQP5−/− BMMSCs (Collagen 1a: 311.22±17.38 vs. 172.59±15.54 in AQP5+/+ , P<0.01; Osteopontin: 5.23±0.47 vs. 1.41±0.68 in AQP5+/+ , P<0.01; ALP: 87.67±10.75 vs. 49.35±16.54 in AQP5+/+ , P<0.05) (Fig. 5C).
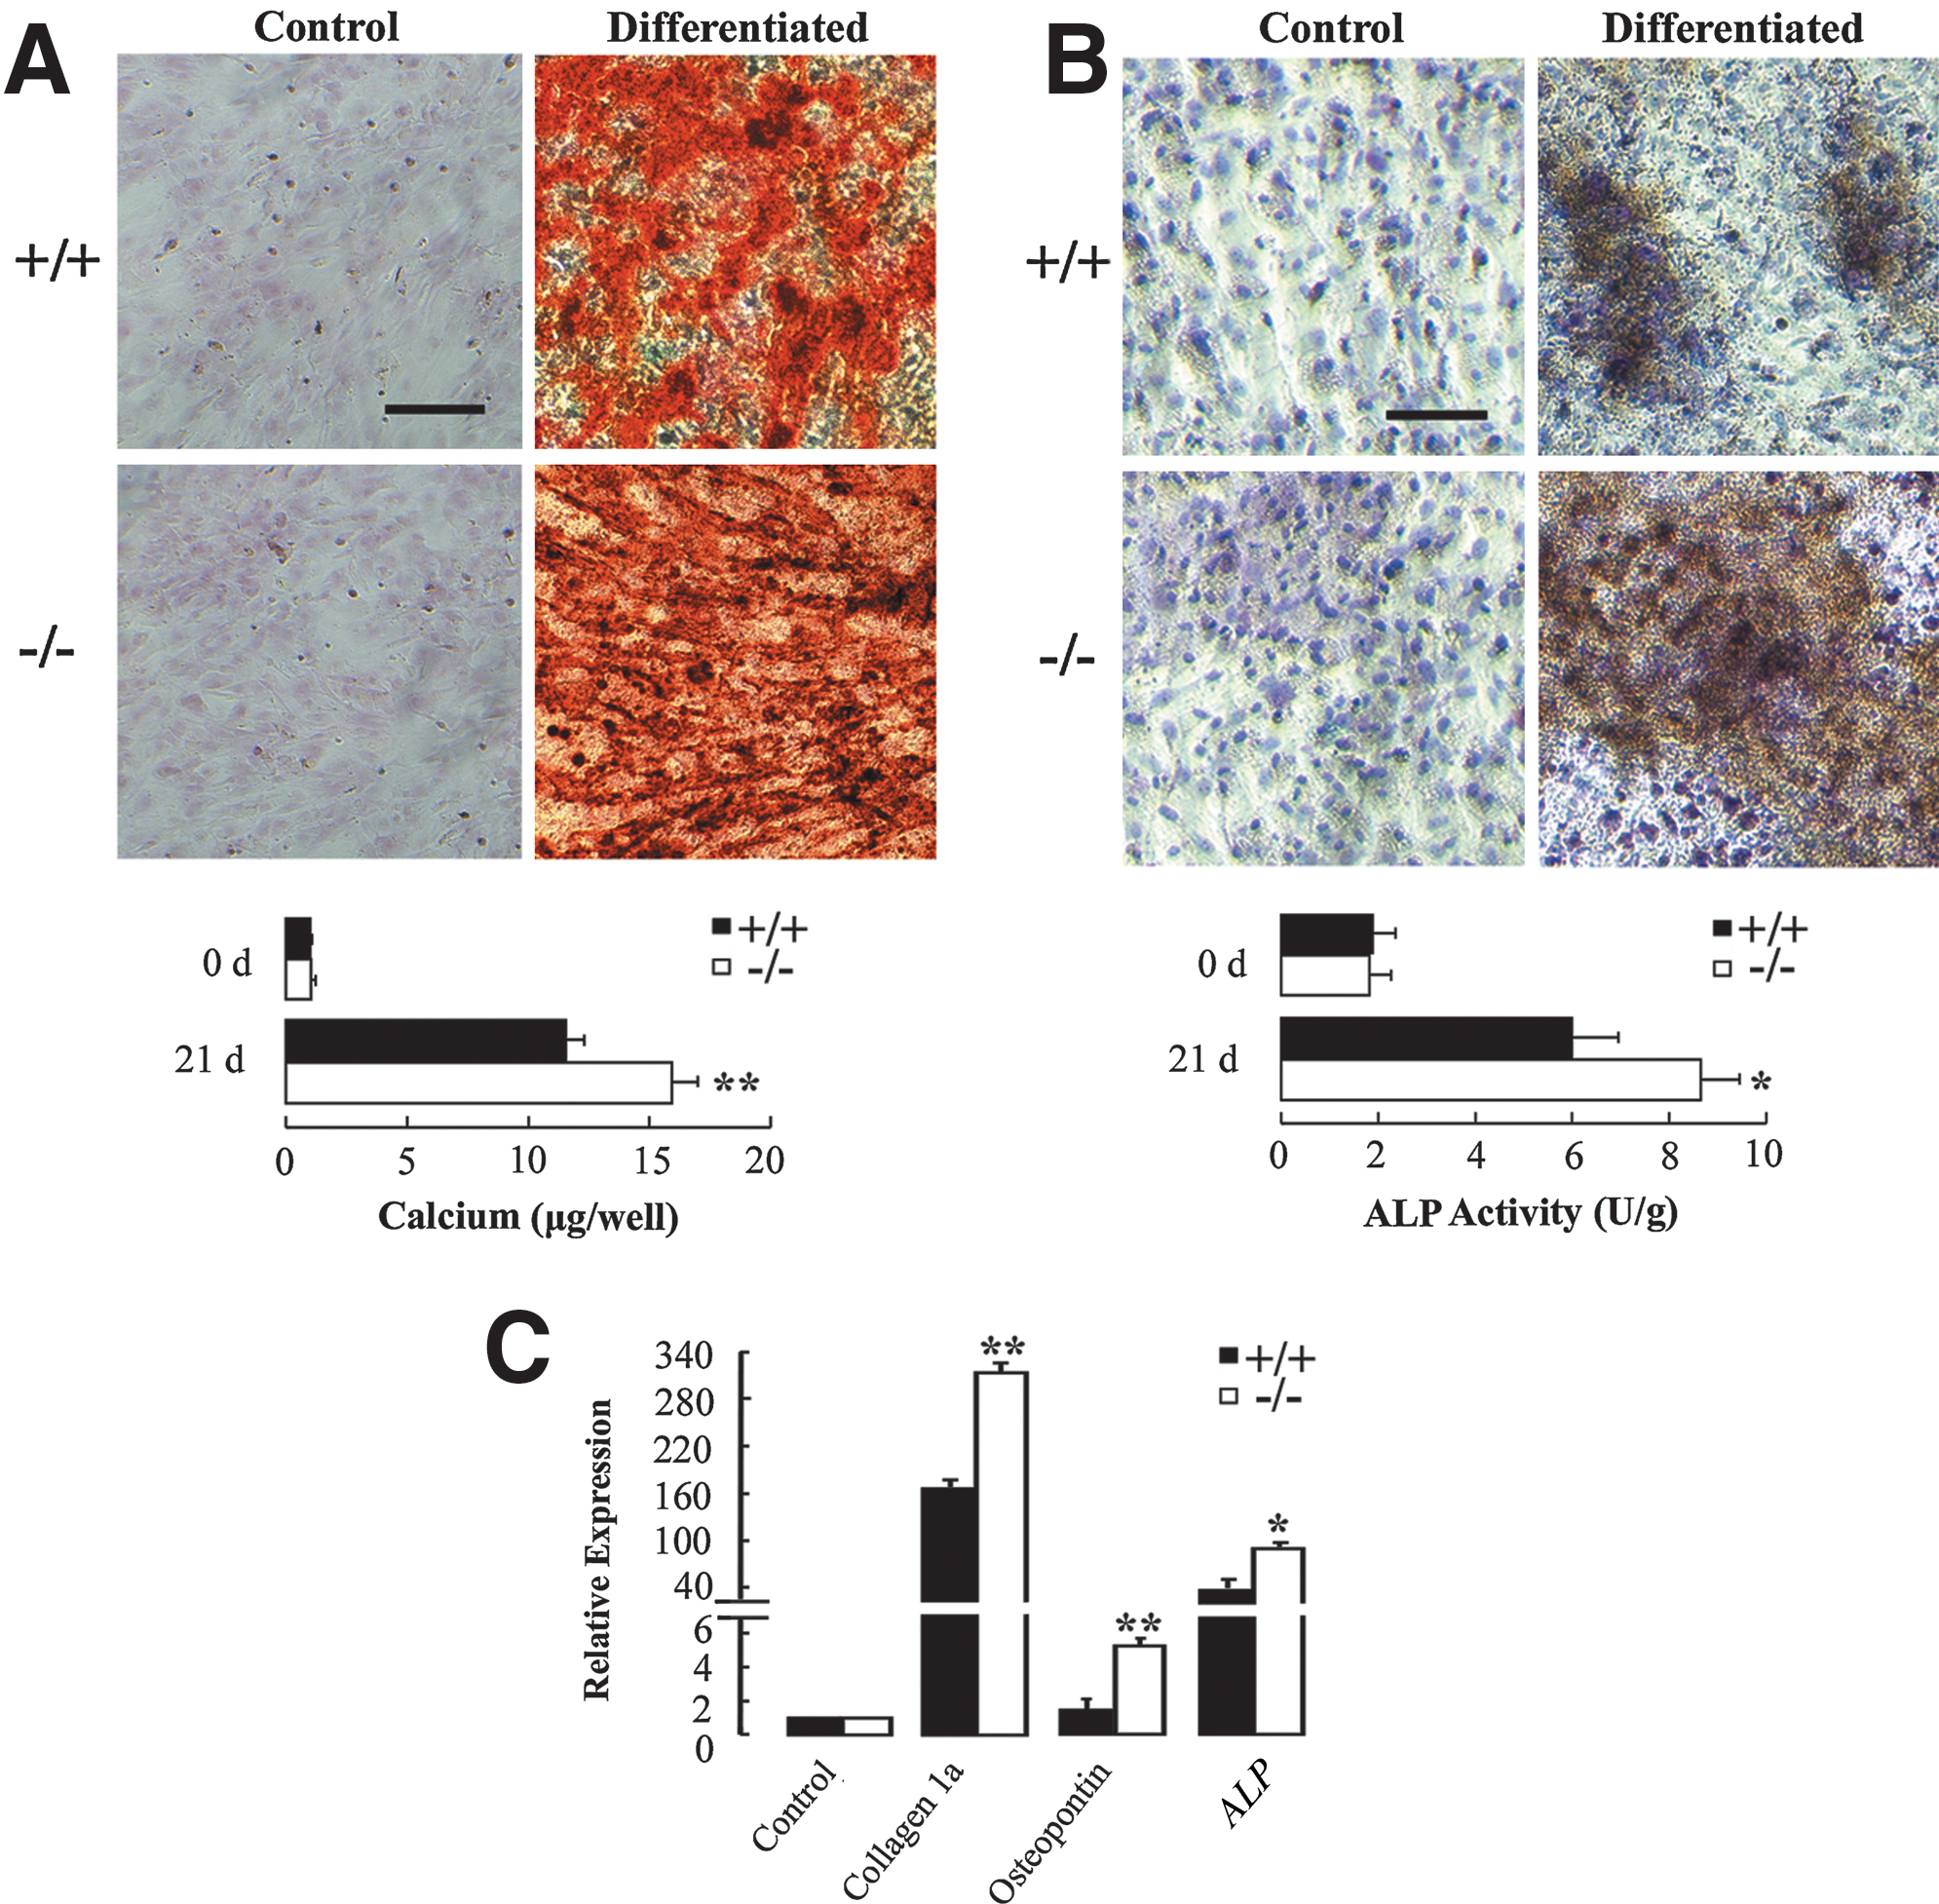
Osteogenic differentiation of AQP5+/+
and AQP5−/−
BMMSCs.
To evaluate the chondrogenic potential of AQP5+/+ and AQP5−/− BMMSCs, the chondrogenic pellets after 21-day induction were analyzed by collagen II immunohistochemistry and Safranin O staining. As shown in Fig. 6A, a typical lacunar structure indicating chondrogenesis was revealed by positive collagen II and Safranin O staining. Sulfated GAG content after 21-day induction was significantly higher in AQP5−/− chondrogenic pellets (7.4±0.87 vs. 4.83±0.85 μg/pellet in AQP5+/+ , P<0.05) (Fig. 6B). To further confirm the altered chondrogenic capacity in AQP5−/− BMMSCs, real-time PCR was conducted to quantify the relative expression levels of chondrogenic differentiation markers, including collagen 11a, collagen 2a, and aggrecan. As shown in Fig. 6C, the relative mRNA expression levels of the 3 genes were significantly higher in AQP5−/− chondrogenic pellets (Collagen 11a: 257±15.23 vs. 92.03±13.75 in AQP5+/+ , P<0.01; Collagen 2a: 382.84±27.22 vs. 57.11±24.58 in AQP5+/+ , P<0.01; Aggrecan: 954.82±135.8 vs. 369.8±150.84 in AQP5+/+ , P<0.01).

Chondrogenic differentiation of BMMSCs from AQP5+/+
and AQP5−/−
mice.
Overall, these results indicated significantly increased adipogenic, osteogenic, and chondrogenic differentiation capacity of AQP5−/− BMMSCs compared to AQP5+/+ BMMSCs.
Bone-healing process is accelerated in AQP5−/− mice
To further evaluate the role of AQP5 in differentiation of BMMSCs in vivo, we compared the bone-healing process of AQP5+/+ and AQP5−/− mice in a drill-hole injury model. The morphological appearance in Fig. 7A and summarized bone density data acquired by X-ray image (DXA) analyses shown in Fig. 7B indicated accelerated bone healing in the injury sites in AQP5−/− mice.
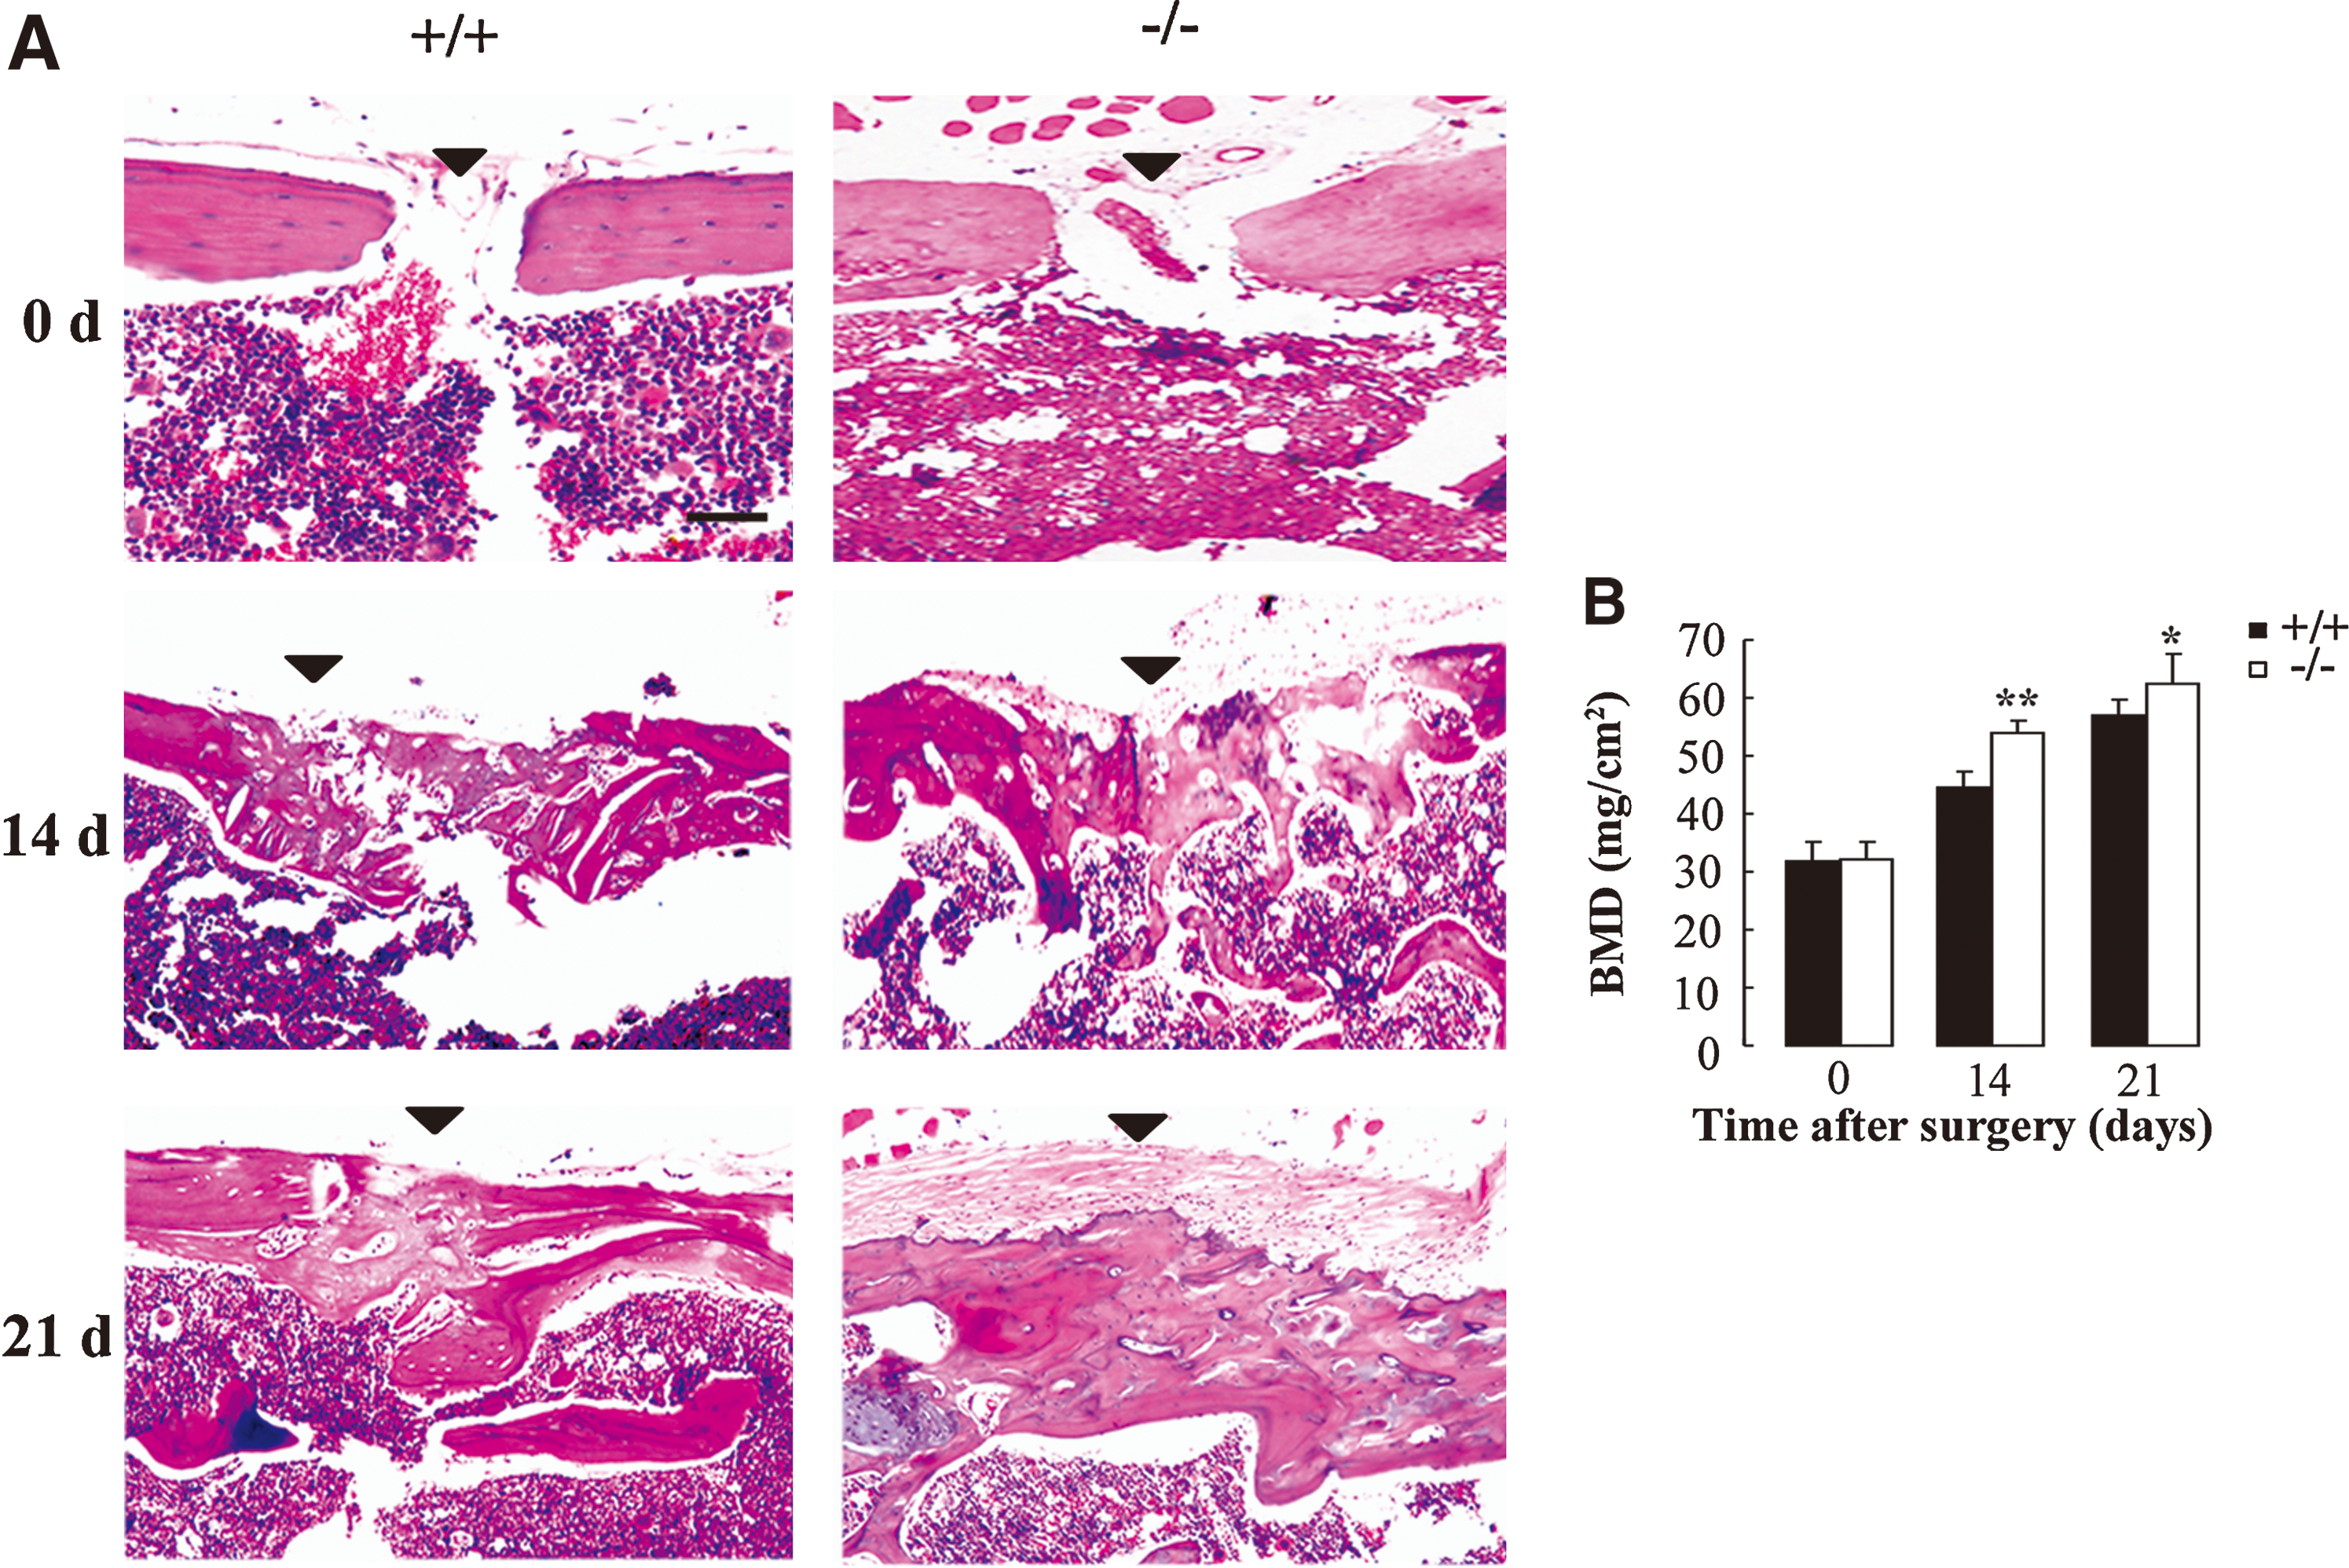
Histological and bone mineral density (BMD) analysis of bone healing after drill-hole injury in femur.
Decreased apoptosis rate of AQP5−/− BMMSCs
Differentiating BMMSCs had more sensibility to apoptosis even at the very early stages [24]. Previous studies revealed that AQP-mediated higher plasma membrane water permeability promotes cell apoptosis [25 –29]. We first analyzed the cell viability change of BMMSCs during differentiation. As shown in Fig. 8A, the decrease of viable AQP5−/− BMMSCs was significantly slower than AQP5+/+ BMMSCs in adipogenic and osteogenic induction media, which could be related to the lower apoptosis rate of AQP5−/− BMMSCs under differentiating conditions.

Analysis of apoptosis during differentiation of BMMSCs.
We then measured the apoptosis rate of undifferentiated and differentiating BMMSCs by flow cytometry. At undifferentiated status, the paclitaxel-induced apoptosis rate of AQP5−/− BMMSCs was significantly lower (15.73%±0.9% vs. 20.95%±1.14% in AQP5+/+ BMMSCs, P<0.01) (Fig. 8B). The paclitaxel-induced apoptosis rate of BMMSCs upon 24-h induction of adipogenic differentiation was also decreased in AQP5−/− BMMSCs (28.23%±1.03% vs. 41%±1.93% in AQP5+/+ BMMSCs, P<0.01) (Fig. 8C). Similarly, the paclitaxel-induced apoptosis rate of BMMSCs upon a 3-day induction of osteogenic differentiation was significantly lower in AQP5−/− BMMSCs (23.42%±4% vs. 53.55%±3.54% in AQP5+/+ BMMSCs, P<0.01) (Fig. 8D). These results demonstrated that AQP5 deficiency reduced the apoptosis rate of both undifferentiated and differentiating BMMSCs.
To further evaluate the role of AQP5 in the BMMSC apoptosis process, we analyzed the effect of the caspase-dependent apoptosis inhibitor Z-VAD-FMK on the adipogenic and osteogenic differentiation capacity of AQP5+/+ and AQP5−/− BMMSCs. As shown in Fig. 9A, Z-VAD-FMK increased the adipogenic differentiation capacity of both AQP5+/+ and AQP5−/− BMMSCs as quantified by flow cytometry of Nile Red- and Oil Red O-stained cells. Similarly, Z-VAD-FMK enhanced the osteogenic differentiation capacity of both AQP5+/+ and AQP5−/− BMMSCs as quantified by the calcium content and ALP activity of differentiated cells (Fig. 9B). Although Z-VAD-FMK tends to be more effective on AQP5+/+ than AQP5−/− BMMSCs, there is still a significantly higher differentiation capacity in AQP5−/− BMMSCs. As a separate set of evidence shown in Fig. 9C, we found that the protein level of transcription factors known to be involved in control of adipogenic (C/EBPα), and osteogenic (CBFA1) differentiation was higher in AQP5−/− BMMSCs. C/EBPα and CBFA1 were upregulated to a greater extent in AQP5+/+ than AQP5−/− BMMSCs by Z-VAD-FMK. These results suggested that reduced apoptosis is an important, but not the only, mechanism underlying the increased differentiation of BMMSCs capacity of AQP5−/− mice.

The effect of the apoptosis inhibitor Z-VAD-FMK on the differentiation capacity of AQP5+/+
and AQP5−/−
BMMSCs.
Discussion
To date, few studies reported the expression of AQPs in stem cells, with only one functional study by Kong et al., suggesting impaired proliferation and neuronal differentiation of ANSCs in AQP4 knockout mice [15]. Expression and function of AQPs in BMMSCs have not been identified previously, although AQP5 was used as a marker of adult alveolar type I epithelial cells differentiated from BMMSCs [30,31]. In the present study, we show AQP5 expression on BMMSCs and provide evidence for AQP5 involvement in the differentiation capacity of BMMSCs using an AQP5-deficient mouse model.
Previous reports about the role of AQPs on cell proliferation have been controversial. Hoque et al. first reported that overexpression of AQP1 simulates NIH-3T3 cell proliferation [5]. Kang et al. and Zhang et al. demonstrated that AQP5 expression increases proliferation of colon and lung carcinoma cells [32,33]. Interestingly, Woo et al. found that the phosphorylation of a cyclic adenosine monophosphate (cAMP)-protein kinase (PKA) consensus site of AQP5 plays a key role in the cell proliferative ability of AQP5 [34] and may be related to activation of the Ras signaling pathway [35]. Furthermore, data from Zhang et al. demonstrated that overexpression of AQP5 could activate epidermal growth factor receptor (EGFR), extracellular receptor kinase (ERK1/2), and p38 mitogen-activated protein kinase (p38 MAPK) signal transduction pathway in lung cancer cells, also suggesting a link between AQP5 and cell-signaling pathway [33]. In terms of stem cells, Kong et al. found that AQP4 deletion impaired the proliferation of cultured ANSCs [15]. Therefore, it is somewhat a surprise that our data indicated no effect of AQP5 deletion on the colony frequency and in vitro proliferation of BMMSCs. The above mechanisms promoting cell proliferation by AQP5 in cancer cells may not apply to BMMSCs. On the other hand, however, Hu et al. and Saadoun et al. showed that AQP-mediated plasma membrane water transport has no influence on cell proliferation in B16F10 melanoma, 4T1 mammary gland tumor cells [36], and astroglial cells [37], suggesting that AQP-facilitated cell proliferation is cell-type dependent.
Several independent studies suggested that the role of AQPs in cell differentiation may be also cell-type dependent. A previous study by Hara-Chikuma et al. indicated little involvement of AQP3 in the differentiation of mouse keratinocytes using an AQP3 knockout model and in neonatal human keratinocytes using AQP3 knockdown [38]. More recently, Liu et al. found increased expression of AQP9 during osteoclast differentiation. However, under normal physiological conditions AQP9 was not required for osteoclast function or differentiation [39]. On the other hand, Watanabe et al. reported that exogenous expression of AQP5 significantly increased the differentiated proportion of a human gastric adenocarcinoma cell line [40]. Kong et al. described that AQP4 deletion in ANSCs preferentially impaired the neuronal differentiation rather than glial differentiation. The reduced neuronal differentiation of AQP4−/− ANSCs was attributed to the decreased expression of connexin43 and L-type voltage-gated Ca2+ channel CaV1.2 [15]. Our results showed an opposite effect that AQP5 deletion facilitated adipogenic, osteogenic, and chondrogenic differentiation of BMMSCs, suggesting a common negative effect of AQP5 expression on differentiation of BMMSCs. Accelerated bone healing in AQP5−/− mice also supports a negative effect of AQP5 expression on osteogenic differentiation. The underlying mechanism may involve reduced apoptosis and upregulation of lineage-specific transcription factors in AQP5−/− BMMSCs during induced differentiation as indicated by our data.
Previous studies demonstrated an important role of apoptosis in differentiation of BMMSCs [24]. Kennea et al. reported that fetal MSCs show functional apoptotic pathways [41]. Oliver et al. found that human BMMSCs exhibited higher susceptibility to apoptosis inducers during induced adipogenic and osteogenic differentiation compared to undifferentiated BMMSCs [24]. In the present study, we found a remarkably increased apoptosis rate of mouse BMMSCs during induced adipogenic and osteogenic differentiation in culture. Therefore, apoptosis appear to be an important regulatory mechanism of differentiation of BMMSCs. In terms of the role of AQPs in apoptosis, most studies to date have indicated that AQP-mediated transmembrane water flux promotes the apoptosis process. Increased apoptosis by AQP expression was seen in various cell types, including thymocytes and Chinese hamster ovary cells [25], hepatocellular carcinoma cells [26], kidney cortical collecting duct cells [27], ovarian granulosa cells [28], and hepatic stellate cells [29]. The mechanism is likely through increasing the apoptotic volume decrease [6,26,27]. Our data indicated a reduced plasma membrane water permeability and a decreased apoptosis rate in AQP5−/− BMMSCs, consistent with these previous findings and providing a possible mechanism for the increased differentiation capacity of AQP5−/− BMMSCs. The apoptosis inhibitor Z-VAD-FMK exhibited a larger effect in increasing the adipogenic and osteogenic differentiation in wild-type than AQP5-deficient BMMSCs, further supporting the role of AQP5 in promoting BMMSC apoptosis. Therefore, the AQP-mediated apoptotic event appears to be an important determinant in differentiation of BMMSCs. The opposite effect that AQP4 deletion enhances ANSC apoptosis reported by Kong et al. [15] may involve different mechanisms of apoptosis regulation in neuronal stem cells.
The upregulation of lineage-specific transcription factors C/EBPα and CBFA1 (Runx2) in AQP5−/− BMMSCs during induced adipogenic and osteogenic differentiation suggested activation of related signaling pathways. It is not known whether the previously described AQP5-associated activation of the PKA/Ras pathway and the EGFR/ERK/p38 MAPK pathway [33 –35] negatively regulates differentiation of BMMSCs. Our results support the involvement of the AQP5-associated EGFR/ERK/p38 MAPK pathway in osteogenic differentiation of BMMSCs in that Sibilia et al. reported enhanced chondrocyte and osteoblast differentiation in EGFR knockout mice [42]. In view of the complex nature of signaling pathways regulating MSC differentiation [43], further studies are warranted to elucidate the detailed molecular mechanisms of AQP5-regulated BMMSC differentiation, particularly the signal pathways associated with AQP5 phosphorylation in the regulation of BMMSC differentiation and apoptosis.
In summary, we discovered the expression of AQP5 in BMMSCs and characterized its function in differentiation of BMMSCs. We conclude that AQP5-mediated high plasma membrane water permeability enhances the apoptosis rate of differentiating BMMSCs, thus decreasing their differentiation capacity. These data implicate AQP5 as a novel determinant of differentiation of BMMSCs and therefore a new molecular target for regulating differentiation of BMMSCs during tissue repair and regeneration.
Footnotes
Acknowledgments
The authors are grateful to Lianhui Dou, Wei Fan, and Qingyan Li for animal care and Shuqin Pan for assistance in histology. This study was supported by grants from the National Basic Research Program of China (973; No. 2009CB521908) and the National Natural Science Fund (No. 30670477).
Author Disclosure Statement
The authors declare that no competing financial interests exist.