
Abstract
The clinical use of stem cells in cell-based therapeutics for degenerative diseases requires development of criteria for defining normal stem cells to ensure safe transplantation. Currently, identification of abnormal from normal stem cells is based on extensive ex vivo and in vivo testing. Raman microscopy is a label-free method for rapid and sensitive detection of changes in cells' bio-molecular composition. Here, we report that by using Raman spectroscopy, we were able to map the distribution of different biomolecules within 2 types of stem cells: adult human bone marrow-derived stromal stem cells and human embryonic stem cells and to identify reproducible differences in Raman's spectral characteristics that distinguished genetically abnormal and transformed stem cells from their normal counterparts. Raman microscopy can be prospectively employed as a method for identifying abnormal stem cells in ex vivo cultures prior to clinical transplantation.
Introduction
T
Raman microscopy has recently demonstrated an ability to characterize heterogeneous cell populations [16 –18]. Raman spectra are unique molecular fingerprints obtained by measuring the vibration of molecules and comparing them to background vibrations following laser excitation and thus, provide “biochemical markers” via amplification of spectra at specific wavelengths that indicate modifications in biochemical composition of cells associated with functional changes in cellular phenotype. In addition, these changes can be measured by Raman spectroscopy in a quantitative manner by comparing relative intensities of spectral peaks which are proportional to concentrations of biochemical changes in the cell [19,20]. Previous reports using Raman spectroscopy in hESC [18,21], adult stem cells [22,23], and cancer cell lines [16] have identified a number of Raman spectral characteristics that can define the biological phenotype of the cell. Chan et al. [21] identified specific Raman spectra that can distinguish undifferentiated hESC from hESC-derived cardiomyocytes and human fetal left ventricle cardiomyocytes. Notingher et al. [18] used Raman spectroscopy to investigate murine embryonic stem cells and found reproducible differences in the Raman spectra between undifferentiated and differentiated cells. In addition, some studies have employed Raman spectroscopy to monitor osteoblast differentiation and in vitro mineralization capacity of MSC and osteoprogentior cells [17,24,25]. The high discriminative ability of Raman spectroscopy to reveal changes associated with specific cellular phenotype has been recently demonstrated in a study by Hedegaard et al. [16]. In this study, it was possible to distinguish between 2 isogenic breast cancer cell lines that are different in their in vivo capacity for metastasis. Interestingly, comparisons of these 2 cell lines using current global methods: proteomic profiling, and gene expression profiling using DNA microarrays, revealed differences between the 2 cell lines in few proteins and genes [16].
In the present study, we obtained reproducible submicrometer spatially resolved Raman images and clear Raman spectra using shorter integration times and less incident power and we demonstrated the potential use of these techniques to identify differences in biomolecular composition between normal and abnormal transformed stem cell lines.
Materials and Methods
Culture and preparation of cells
hESCs were derived and used in accordance with previous reports. KMEB2 were derived in house in accordance with Danish Governmental regulations and local ethical committee approval [26], Hues9 cells line was gifted by D. Melton, Harvard Medical School [27]. The creation of adult bone marrow derived, telomerized, stem cells has been previously reported [28]; hMSC-TERT were cultured in alpha MEM (Invitrogen, Taastrup, Denmark) supplemented with 10% fetal bovine serum (FBS; PAA, Pasching, Austria). Human primary, normal, MSC cells were derived from subcutaneous adipose tissue and cultured in Dulbecco's modified Eagle's medium (DMEM; Invitrogen) supplemented with 10% FBS (PAA). hESC were routinely cultured on a mouse embryonic feeder (MEF) inactivated feeder layer in Knockout DMEM supplemented with 15% Knockout serum replacement, 1%
Raman microscopy
Raman characterizations were performed at room temperature (∼20°C) during a 3–4 h interval which corresponded to the observed life time for these cells when removed from their customary culture conditions. Cell survival could be visually monitored since, in the case of cell death, we observed the discharge of cellular fluid as a result of the membrane destruction. The slide with cells was placed on the 3-dimensional scan stage of the confocal Raman microscope (Witec Alpha300R). Individual cells were identified and scanned using an excitation laser of 532 nm wavelength with a 600 lines/mm diffraction grating and a 50×objective (Numerical Aperture, N.A.=0.75). One scan usually took 12–15 min depending on the scan size, step, and integration time. The Raman images were formed by mapping the obtained Raman intensity integrated over selected spectral ranges of shifts between 600 cm−1 and 3,020 cm−1 for each point in the image. For all measurements the power was maintained at ∼3 mW and typically, the used scan size was ∼40×40 μm2 with sufficient step-size of 1 μm and integration time of 0.5 s at each point. After finishing each scan we visually verified that the cell was still alive before identifying the next cell for analysis. For each sample, we obtained a minimum of 14 successful scans (without visible membrane destruction) of cells with similar appearance.
The spectral peaks of the obtained data, from each scan, were analyzed and their distribution mapped within each cell using the commercial software procured from Witec. For identification of the cell constituents (such as DNA, RNA, cytochrome, etc.) responsible for each Raman peak, we used general available data found in the literature (eg, [18,30,31]).
To assess if patterns of high discrimination were observable in our data additional analysis was performed using principal component analysis (PCA) followed by linear discriminant analysis (LDA). Means of spectra were calculated from groups of spectra locally collected within internal cellular positions. These spectra were then selected by monitoring the intensities within the specific ranges (729–736, 1,495–1,550, 2,831–3,020 cm−1) in the Raman spectra and the generated images.
Results
Effects of different surfaces and substrate composition on Raman spectra
We carried out initial experiments to optimize conditions needed to obtain optimal Raman spectra. Initial experiments, performed using Permanox chamber slides without cells, demonstrated a strong Raman signal with many peaks arising from the slide coating that impeded identification of cellular specific Raman spectra (Supplementary Fig. S1a, b; Supplementary Data are available online at
Additionally, cells seeded on glass slides were tested over increasing lengths of time in culture before examination by Raman microscopy. No changes in spectral profiles were identified during a 5 day culture period (Supplementary Fig. S1f).
Raman spectra
Experiments were carried out in duplicate and with 14–17 cells examined in each analysis. Raman images were formed by mapping obtained Raman intensity, integrated over selected spectral ranges of shifts around the main Raman peaks. Raman spectral wavelengths were measured between 140 and 3,790 cm−1. We observed key changes in spectra between 600 and 1,800 cm−1 peak intensities and we analyzed only in this region.
Raman spectra (Supplementary Fig. S2) contained the typical cellular peaks for example, the symmetric ring breathing of phenylalanine 1,005 cm−1, CH deformation 1,450 cm−1, Amide-I vibration mode of peptide bonds 1,657 cm−1, CH2 stretching mode 2,851 cm−1 and 2,885 cm−1, and CH3 stretching mode 2,935 cm−1 and 2,956 cm−1 [18,31 –33]. In addition, the obtained Raman spectra contain peaks at 751, 1,128, 1,314, and 1,583 cm−1 corresponding to vibration modes of cytochrome c [33,34], and spectral peaks at 1,158 cm−1 and 1,523 cm−1 corresponding to C-C\C-N deformations and C=C vibrations, respectively [35]. The strong Raman peaks between the ranges of 2,825–3,020 cm−1 originate from CH2 and CH3 stretching vibrations in the hydrocarbon chain of lipid molecules which are the main components of cell membranes and various other cell parts.
Raman spectra in normal and abnormal hMSCs
Analysis of Raman spectra obtained in normal [28] and transformed, tumor forming hMSC with high telomerase activity (hMSC-TERT) [9], and primary normal MSC demonstrated a number of differences in peak identifications. Figure 1 demonstrates Raman images collected from both normal (hMSC-TERTnorm) (Fig. 1a, b, e) and transformed (hMSC-TERTtrans) cells (Fig. 1c, d, f) with their associated, mapped, spectral peaks (Fig. 1e, f) and the distribution of different biomolecules within the cell (Fig. 1a–d). Figure 2a demonstrates mapping of spectra and peak identification for hMSC-TERTnorm, hMSC-TERTtrans and MSC. Supplementary Table S1 lists the identification of peaks associated with hMSC-TERTnorm and hMSC-TERTtrans. Differences between hMSC-TERTnorm and hMSC-TERTtrans cells were noted at 1,005 cm−1 (phenylalanine); 1,583 cm−1 (cytochrome c); 1,450 cm−1 (CH def); and 1,657 cm−1 (Amide-I) where both hMSC-TERTnorm and MSC cells demonstrated small or weak spectral intensity, but more prominent peaks were observed in hMSC-TERTtrans. Spectra identified in hMSC-TERTtrans at 782, 788, and 811 cm−1 (all DNA/RNA); 1,258 and 1,341 cm−1 (both associated with proteins); 1,300 and 1,440 cm−1 (lipid) were all absent in hMSC-TERTnorm and MSC cells. Spectral peaks were identified at 1,196 cm−1 (phenylalanine) and 1,128 cm−1 (cytochrome c) in hMSC-TERTtrans, corresponding weak peaks in hMSC-TERTnom were identified. However no equivalent peaks were observed in MSC. Finally, no spectral peaks were observed in hMSC-TERTnorm at 1,158 and 1,523 cm−1 (protein: C-C/C-N and C=C respectively) however, peaks were identified at these locations in both hMSC-TERTtrans and MSC, albeit, the transformed cells demonstrated a 2–3 times increase in peak size. Thus, specific profiles for both hMSC-TERT in comparison with MSC and hMSC-TERTnom versus hMSC-TERTtrans were detectable.

Raman images and spectra of normal and transformed human telomerized stromal (mesenchymal) stem cell (hMSC-TERT).

Difference in Raman spectra between normal versus abnormal human embryonic and adult stem cells. Identification of spectral peaks in
Raman spectra in normal and abnormal hESCs
Spectral analysis of Raman data collected from 2 hESC lines: Hues9 [27] and KMEB2 [26], both with normal karyotypes, demonstrated remarkable similarities in their spectra (Supplementary Fig. S3a, b). However, when a secondary cell line of Hues9, which had acquired a gross karyotypic abnormality (47,XX, +20) during prolonged ex vivo culture (hESCabn) [14], was compared to its normal counterpart it exhibited a 2–3 times greater peak intensity at a wavelength corresponding to 1,583 cm−1 (cytochrome c) (Fig. 2b). Additionally, smaller increases in other peak intensities were also observed at: 751 (cytochrome c), 1,005 [symmetric ring breathing, phenylalanine (sym. ring br. Phe)], 1,158 (nucleotides: ribose-phosphate, protein), 1,196 (C-C sym. ring br. Phe), 1,258 (proteins, lipids), 1,300 (lipid), 1,341 (protein, DNA/RNA), 1,450 (protein, DNA/RNA, lipid), 1,523 (C=C), 1,657 (C=O stretch amide I α-helix), and 1,740 cm−1 (lipid). In addition, an increased number of spectral peaks known to be associated with proteins were observed (Fig. 2b).
We have also identified distinct differences in the expression patterns of biomolecules within hESC. Figure 3 illustrates the different spectral ranges for the distribution of cell components for normal (Fig. 3a) and abnormal (Fig. 3b) hESC. Raman shifts in the range between 2,825 and 3,000 cm−1 demonstrate differences in lipid patterning within a cell [Fig. 3a(1), b(1)]; 729–763 cm−1, corresponding to cytochrome c one of the proteins in the mitochondria respiratory process [Fig. 3a(2), b(2)]. Further, C-C\C-N and C=C molecules, revealed by the mapped intensity distribution of peaks in the range 1,505–1,541 cm−1, are part of proteins [Fig. 3a(3), b(3)], whereas the range 1,430–1,469 cm−1 given by CH deformations indicate the distribution of both protein, DNA/RNA, and lipids [Fig. 3a(4), b(4)]. Additionally, Supplementary Table S1 lists the peaks associated with normal and abnormal hESC.
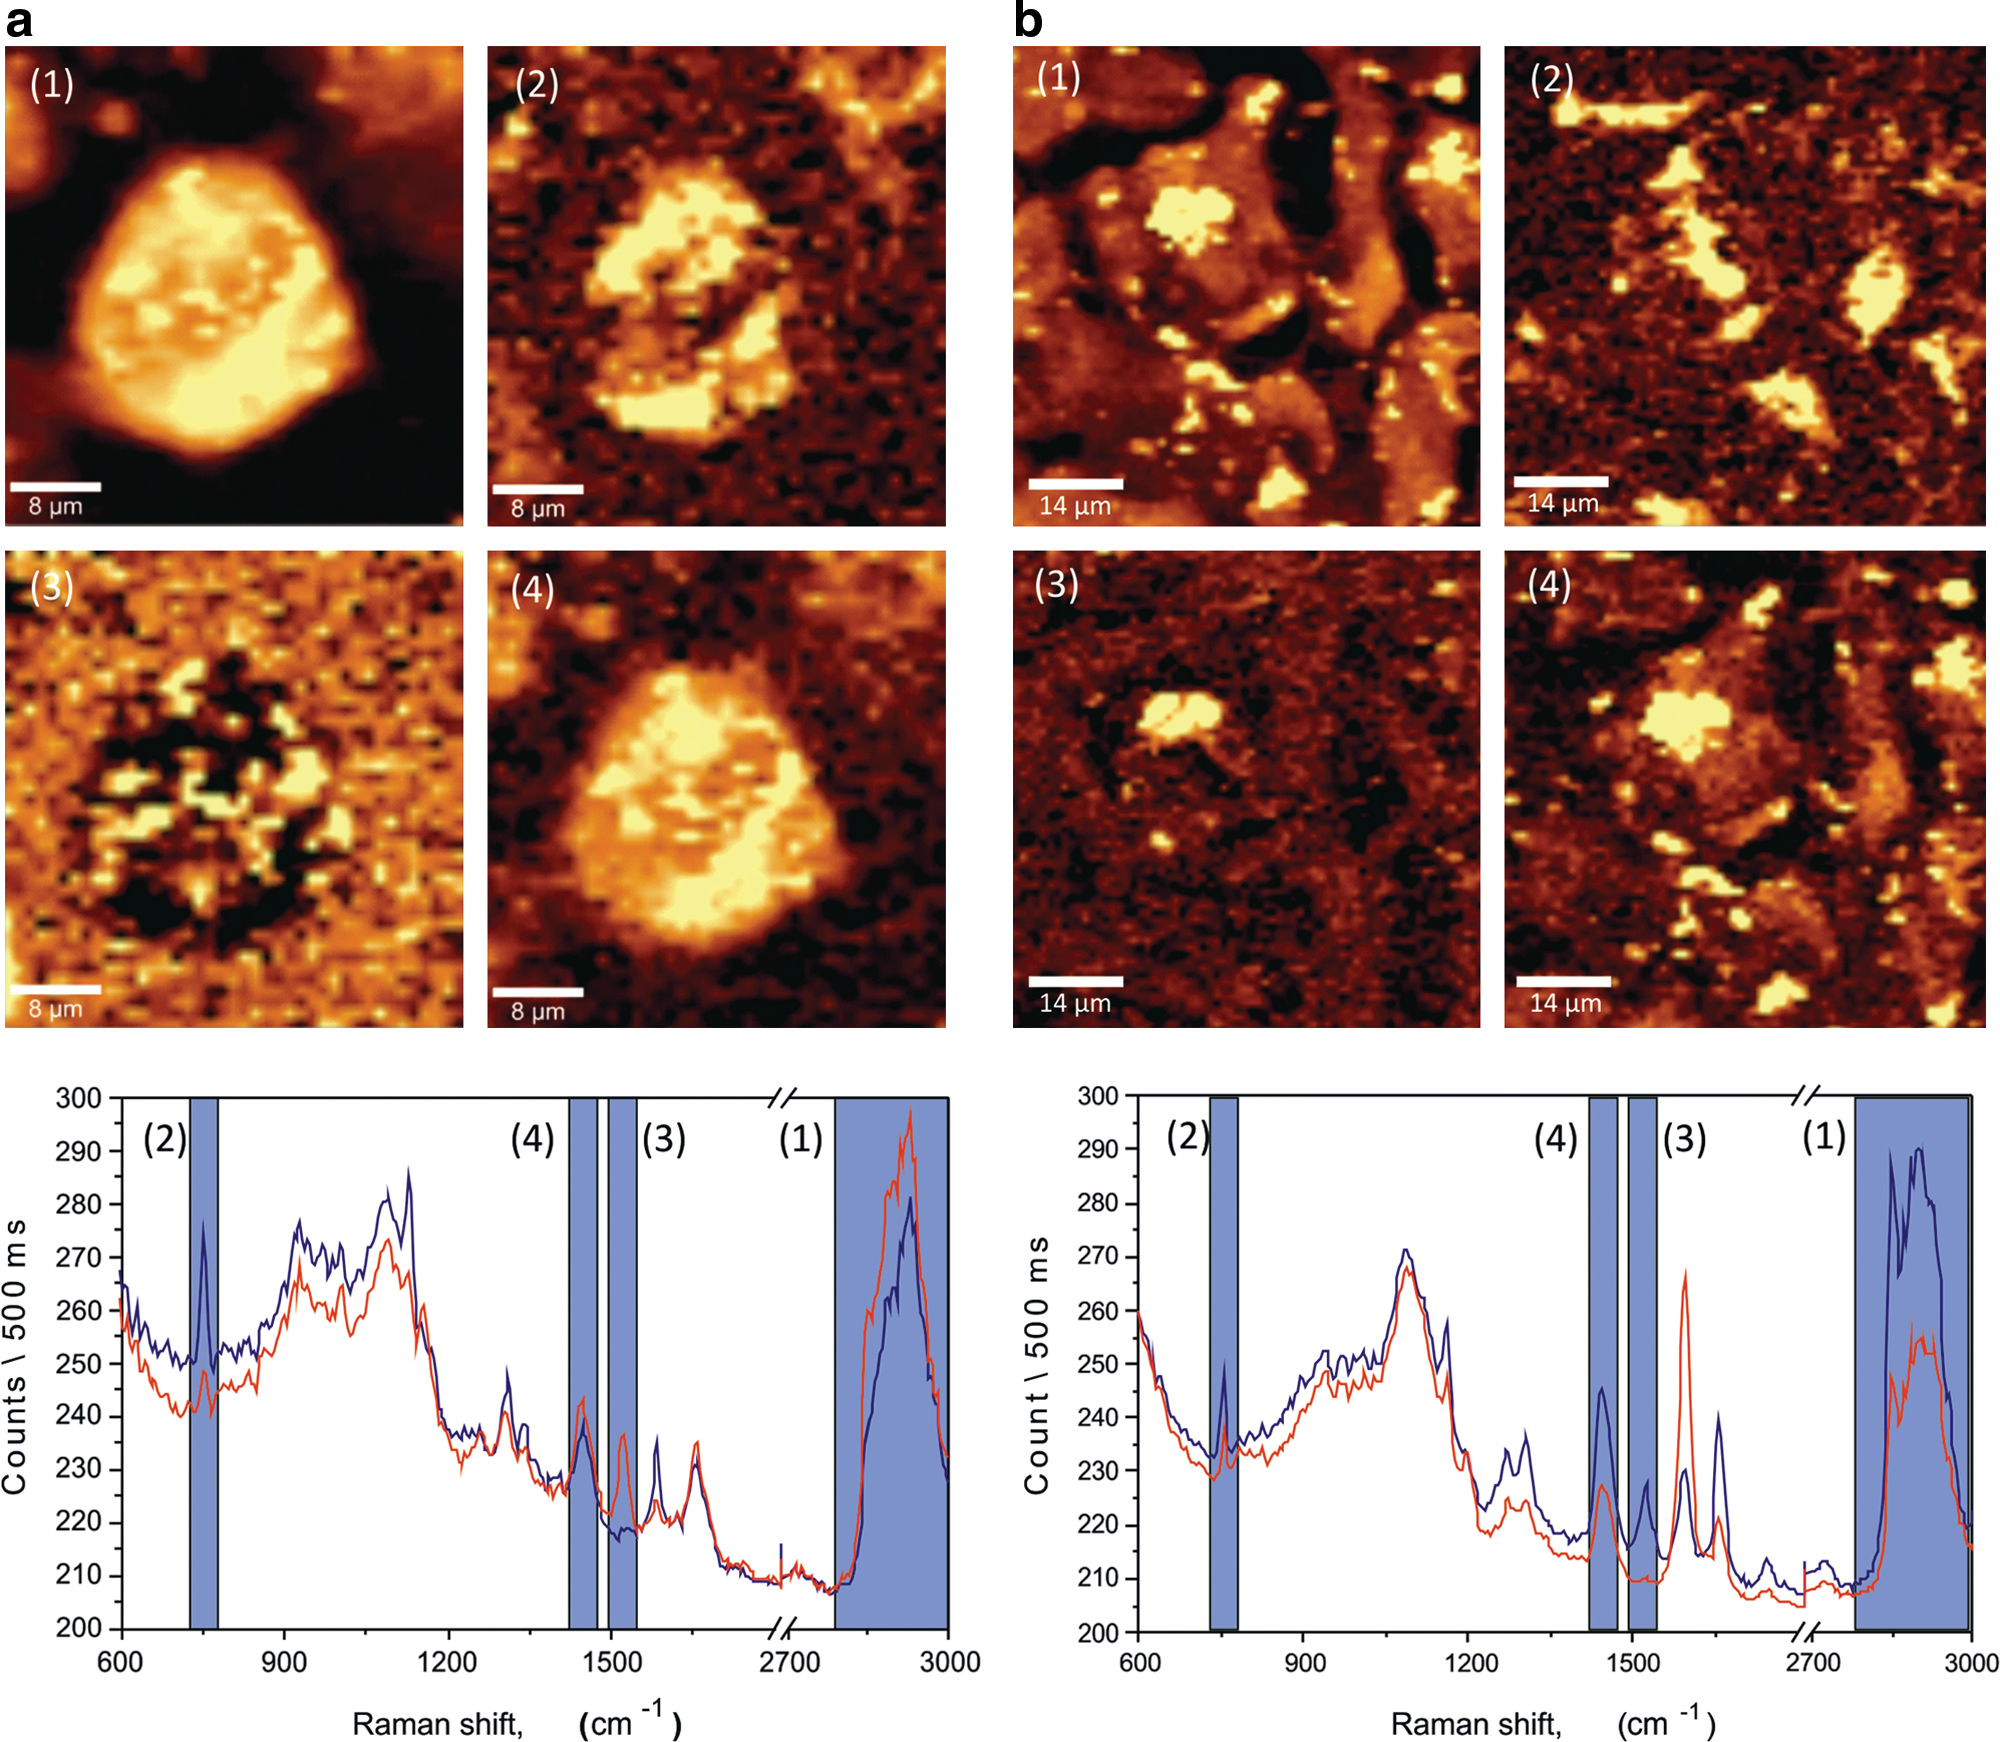
Raman images of hESCs obtained by mapping the intensity integrated over different ranges of the Raman spectrum for
Predictive classification of Raman data using PCA and LDA
To test for the predictive value of Raman spectra in distinguishing normal from abnormal hMSC, we employed PCA followed by LDA [21]. PCA enabled simplification of the spectra by representing the data using a few new completely uncorrelated principal component (PC) variables that capture the majority of variances and which can be ordered in succession of decreasing variance. In our case the first 9 PCs actually account for ∼99.6% of the total variance among the Raman spectra compared with the original much larger number of variables, here taken as each of the ∼1,024 channels in the Charge-coupled device (CCD) of the Raman spectrometer, but which are inherently very much correlated due to the physical continuity and spectral resolution in each collected spectra.
To visualize the extent of group separation, we included a sufficient number of the PCs into the LDA and generated a scatter plot based on the estimated first and second discriminant functions [36]. We included the first 9 PCs in the LDA to account for as much variance as possible, while obtaining, at the same time, the most definite group separation. As shown in Fig. 4, the LDA scatter plot demonstrates a clear separation of normal and abnormal hMSC. Although, the first 2 PCs account for ∼93% of the total variance and therefore could be interpreted as the most important ones, we experienced much better group separation by including an additional 7 PCs that accounted for ∼99.6% of the variance. Further, for the present dataset, including even more PCs above these first 9 leads to gradually decreasing group separation, thereby suggesting that the remaining PCs (up to ∼1,024) are less important and primarily due to (random and uncorrelated) noise in the CCD recorded spectra.
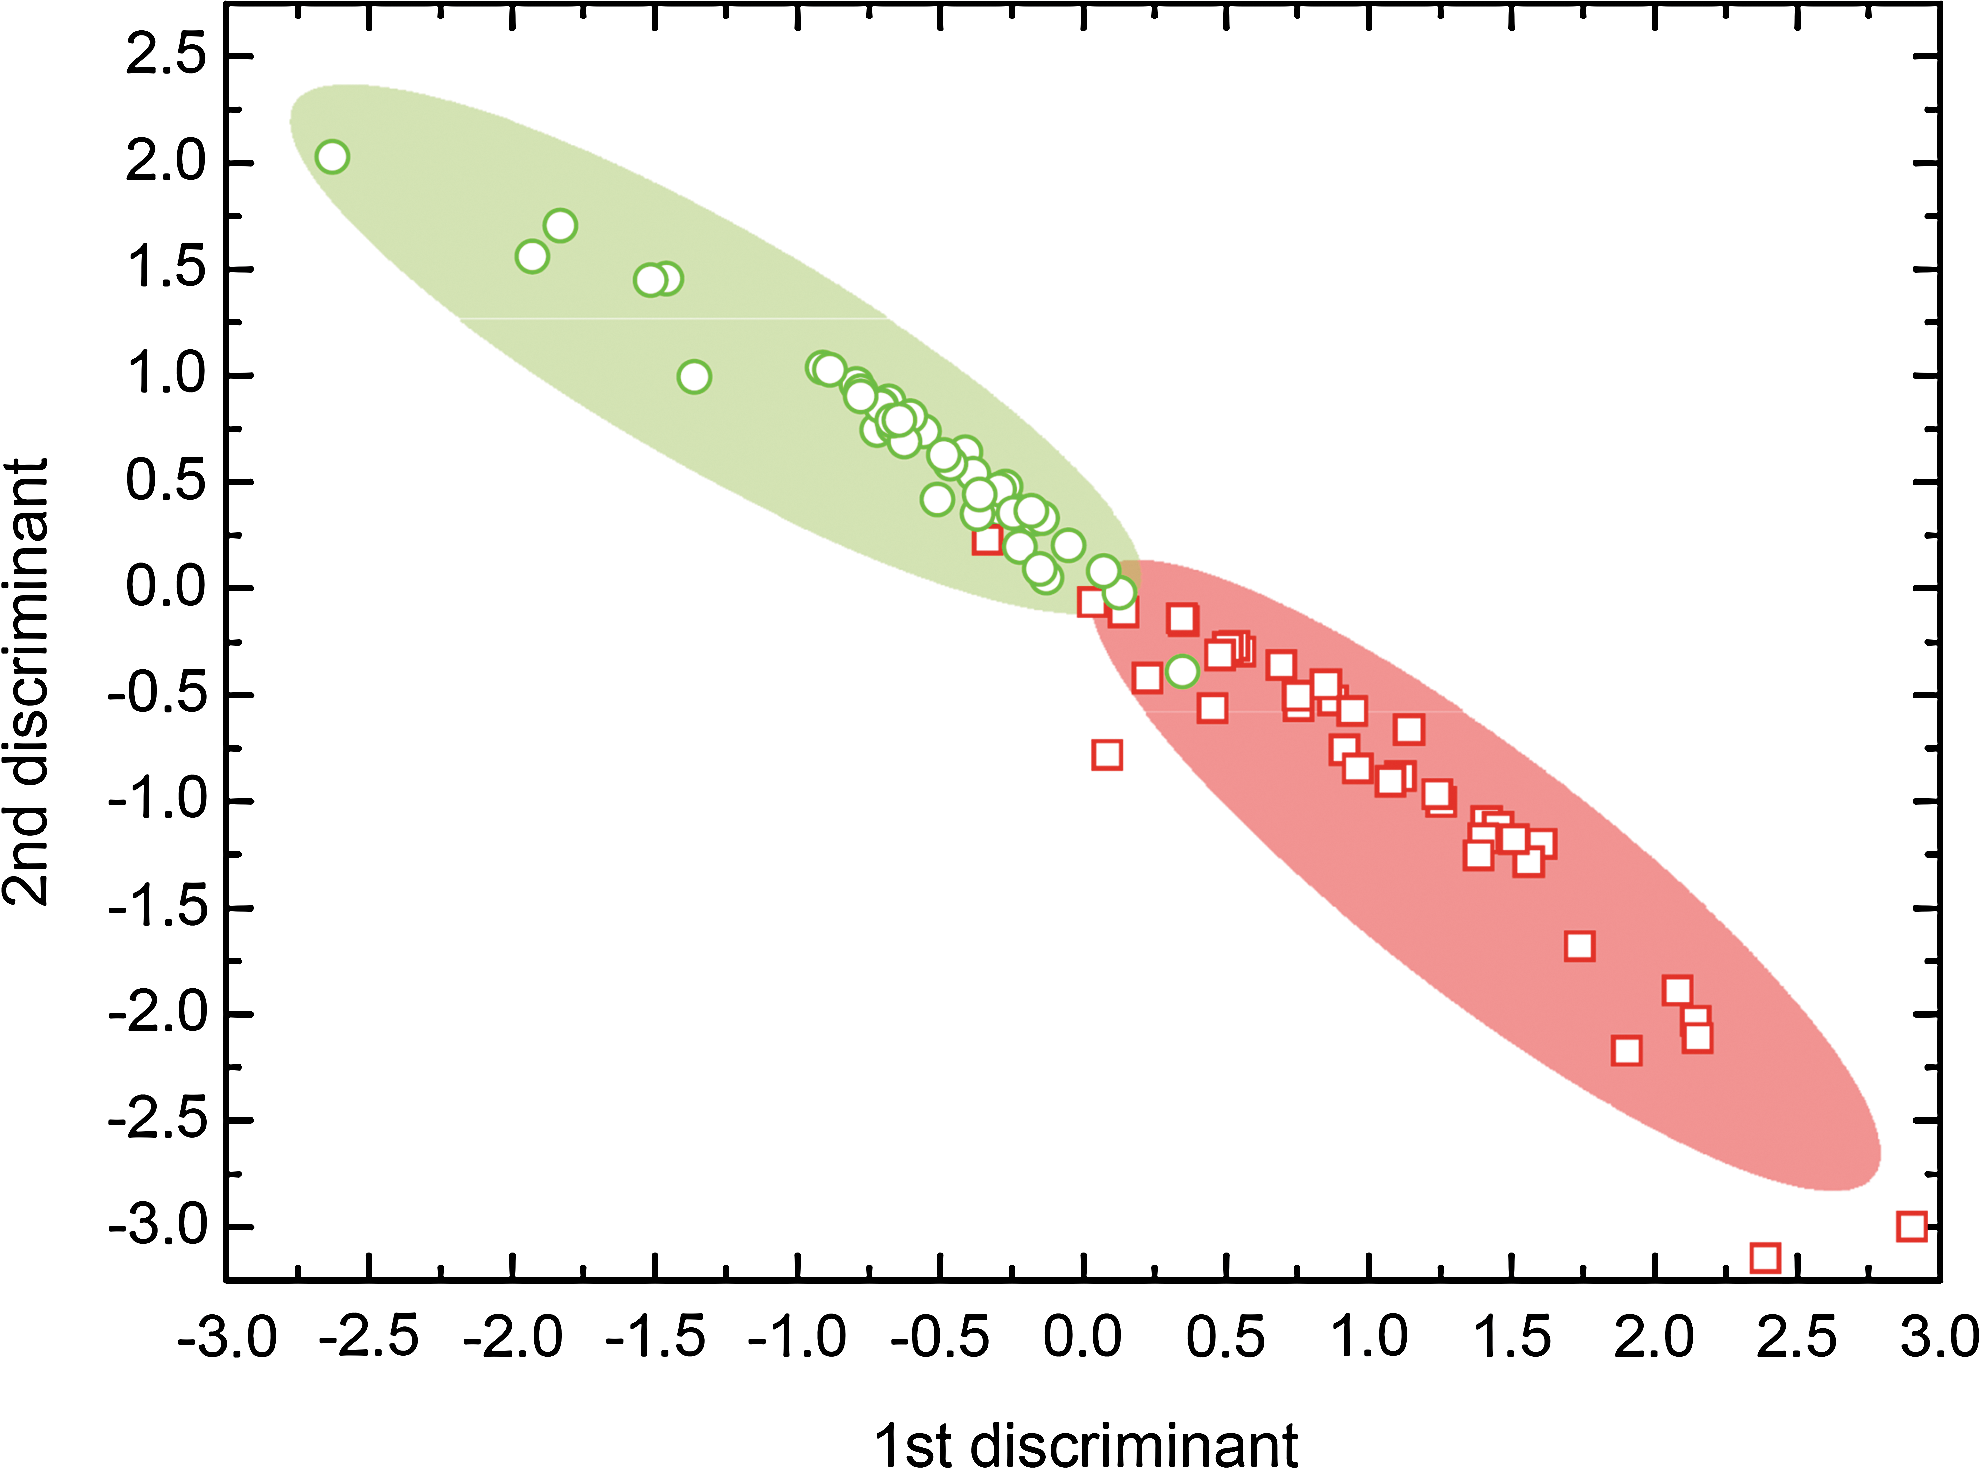
LDA scatter plot of normal (green) and abnormal (red) hMSC-TERT revealing significant group separation. The shaded regions overlaid on the data points serve as visual guides to the eye and, demonstrating that ∼95% of cells can be classified into the 2 groups. Color images available online at
To assess the accuracy with which Raman spectroscopy and PCA-LDA can distinguish hMSC-TERTnorm and hMSC-TERTtrans, a leave-one-out cross-validation (LOOCV) method was employed to predict the type of spectra. The obtained sensitivities for correct classification rate of hMSC-TERTnorm versus hMSC-TERTtrans was ∼95% (Supplementary Table S2) that is, out of 85 typical spectra, of which 45 and 40 were known to be from normal versus abnormal cells, respectively, LOOCV gave 4 misclassifications. Thus, PCA and LDA in combination with LOOCV facilitate significant separation and classification based on the Raman spectral differences of normal and abnormal hMSC-TERT. Further examination of these data sets demonstrated apparent differences located at 1,005 cm−1 (phenylalanine), 1,128 cm−1 (cytochrome C), 1,158 cm−1 (protein, C-C/C-N), 1,450 cm−1 (protein, DNA/RNA, lipids, CH-def), and 1,523 cm−1 (protein, C=C). All these peaks exhibited a clear increase for hMSC-TERTtrans compared with TERTnorm. However, peaks identified at 1,523 cm−1 and 1,158 cm−1 showed a relative larger difference that is, increase for abnormal cells.
Discussion
Raman spectroscopy has previously been employed in bio-medical research as it offers the possibility to noninvasively obtain chemical information on bio-molecular microenvironments in cells without labeling [37,38]. In the present study, we tested the possibility of using Raman spectroscopy as a sensitive method for rapid identification of abnormal stem cells in ex vivo cultures of a number of cultured normal and abnormal stem cells including normal hESC, karyotypically abnormal hESC, normal and transformed hMSC. We have demonstrated that differences in spectral peak identification and peak intensity can be employed to distinguish normal from abnormal stem cells.
We carried out several optimization procedures to obtain clear and reproducible Raman spectra. Choice of the right culture dishes (eg, glass slides provide clear spectra compared with commercial Permanox chamber slides), coating substrate of the cultures plates for example, the use of Matrigel, necessary for the maintenance of undifferentiated hESC when plated without feeders, did not interfere with the ability to identify distinct Raman spectra.
Commonalities in increased peak intensities in abnormal MSC and hESC were observed at 1,158, 1,196, 1,258, 1,300, 1,523 cm−1 when compared with their normal counterparts. Increases in spectra were associated with phenylalanine (1,196 cm−1), and protein/lipids (1,258 cm−1) and lipid (1,300 cm−1), and proteins (1,158 and 1,523 cm−1). DNA/RNA identifications at 782, 788, and 811 cm−1 were all identified as unique to the abnormal/transformed cell lines, additionally, protein identifications at 1,158 and 1,523 cm−1 and 1,258 cm−1 all demonstrated significant increases in spectral intensity when compared with their normal counterparts. Interestingly, peaks observed at 1,158 and 1,523 cm−1 intensities were either only detected in abnormal or transformed cells or demonstrated a significant increase in intensity thus suggesting a possible common “biomolecular signature” associated with transformation. It is not plausible that the observed differences were related to differences in growth rate since all cells were analyzed within 18–24 h postpassaging of the cells. Additionally, we did not observed differences in the Raman spectra between sub-confluent and confluent cultured cells (data not shown).
Current methods for identifying abnormal stem cells include karyotyping and teratoma formation after in vivo implantation of the cells in immune deficient mice. We have demonstrated that Raman spectroscopy can provide an alternative method that allows screening of samples of cultured stems cells for abnormalities prior to use in cells being processed for therapeutic applications. Employing PCA-LDA, it was possible to correctly predict normal from abnormal cells with around 95% correct classification rate. This demonstrates the high sensitivity of Raman spectroscopy to detect molecular changes within the cells. While Raman spectroscopy does not provide direct information regarding the nature of disturbances in the biochemical processes within the cells; it provides “biomarkers” for the abnormal stem cell phenotype. Additionally, identification of biomolecular signatures of the abnormal stem cells can provide a platform for further studies of the cause and consequences of these changes.
We did not carry out background subtraction (ie, baseline removal) of the spectra used for PCA. Our rationale is based on the following considerations. First, we do not regard the fluorescence in the spectra as an important confounder of our data. Second, we think that by “cleaning” spectra for fluorescence, it may lead to a loss of some fine details and introducing bias in our data. Finally, any significant variations in the fluorescence between cells will be estimated between the mean and contained in the calculated PCA. In our dataset 87% of the variance was contained in the first PC and 93% in the first 2 PCs which should be sufficient for the LDA. However, we still obtained much better cell group separation by additionally including 7 more PCs up to ∼99.6%, which may be related to the broad fluorescence part being included in the first PC(s) but not providing any clear influence on the LDA decision. Conversely, the remaining ∼12.6% (6.6%) accounted for the Raman specific differences between cell groups. Indeed, performing the LDA employing only the second to ninth PCs (12.6% of the variance) as foundation for the LDA decision, we were able to classify 77% of abnormal and 76% of normal cells correctly, which should still be considered significant. Using only the first PC, which accounted for 87% of variance, we were able to correctly classify 56% and 66% of the abnormal and normal cells, respectively. Including the third to ninth PCs (6.6% of variance) actually led to a relative improvement of this to correct classification of 61% abnormal and 69% normal cells, respectively. To summarize, Raman specific differences between cell groups allowed a significant number of cells to be classified correctly, a classification accuracy that was further enhanced by also including cell specific fluorescence contributions to achieve ∼95% correct classification of the cells.
In conclusion, Raman spectroscopy is a label free and sensitive method that can identify genetically abnormal and transformed stem cells and thus an additional, rapid, optical method for identification of abnormal tumorgenic stem cells prior to cell transplantation.
Footnotes
Acknowledgments
The study was supported by grants from the local government of Southern Denmark, the Danish Strategic Research Council, the Danish Council for Independent Research (FTP contract no. 09-072949), and from the Lundbeck Foundation (contract no. R49-A5871).
Author Disclosure Statement
The authors have no conflict of interest or competing financial interests.
References
Supplementary Material
Please find the following supplemental material available below.
For Open Access articles published under a Creative Commons License, all supplemental material carries the same license as the article it is associated with.
For non-Open Access articles published, all supplemental material carries a non-exclusive license, and permission requests for re-use of supplemental material or any part of supplemental material shall be sent directly to the copyright owner as specified in the copyright notice associated with the article.