
Abstract
Investigating the molecular mechanisms controlling the in vivo developmental program postembryogenesis is challenging and time consuming. However, the developmental program can be partly recapitulated in vitro by the use of cultured embryonic stem cells (ESCs). Similar to the totipotent cells of the inner cell mass, gene expression and morphological changes in cultured ESCs occur hierarchically during their differentiation, with epiblast cells developing first, followed by germ layers and finally somatic cells. Combination of high throughput -omics technologies with murine ESCs offers an alternative approach for studying developmental processes toward organ-specific cell phenotypes. We have made an attempt to understand differentiation networks controlling embryogenesis in vivo using a time kinetic, by identifying molecules defining fundamental biological processes in the pluripotent state as well as in early and the late differentiation stages of ESCs. Our microarray data of the differentiation of the ESCs clearly demonstrate that the most critical early differentiation processes occur at days 2 and 3 of differentiation. Besides monitoring well-annotated markers pertinent to both self-renewal and potency (capacity to differentiate to different cell lineage), we have identified candidate molecules for relevant signaling pathways. These molecules can be further investigated in gain and loss-of-function studies to elucidate their role for pluripotency and differentiation. As an example, siRNA knockdown of MageB16, a gene highly expressed in the pluripotent state, has proven its influence in inducing differentiation when its function is repressed.
Introduction
E
To overcome these complications, we used a previously developed optimized feeder-free culturing protocol for the CGR8 murine ESC line [2,6,7] and applied the “hanging drop” protocol for obtaining EBs [2,3,6]. To cover all the possible specific differentiation processes occurring in a narrow window time, RNA was isolated each day until day 7 and finally at day 10 (Fig. 1) for microarray hybridization. Stringent statistical criteria were applied to avoid false positive and false negative results.

Hanging drop protocol followed to generate embryoid bodies (EBs) to track the differentiation process from embryonic stem cells (ESCs) to 10-day old EBs. Color images available online at
Materials and Methods
ESC culture and EB formation
CGR8 ESCs (ECACC 95011018) were cultured without feeder cells in Glasgow minimum essential medium supplemented with 10% fetal bovine serum (FBS), 2 mM
RNA isolation and whole-genome gene expression profiling of ESCs and EBs of time kinetic study
The experimental procedures followed for microarray hybridization have been described previously [11]. Microarray data were deposited in the EBI ArrayExpress database:
Quantitative real-time–polymerase chain reaction analysis
Validation of the Affymetrix data was performed by quantitative real-time–polymerase chain reaction (qRT-PCR) analysis with ABI 7500 FAST Detection System (Applied Biosystems). One microgram of RNA from ES (day 0) and 4-, 7-, and 10-day-old EBs was reverse transcribed using SuperScript VILO cDNA synthesis kit (Invitrogen GmbH). qRT-PCR was performed in triplicates for every sample using SYBR-Green PCR Master Mix (QuantiFast qPCR Master Mix; Qiagen). Validation has been performed for Pou5f1 (NM_013633), Nanog (NM_028016), Mageb16 (NM_001113734), Ets variant gene 5 (Etv5) (NM_023794), ribonuclease P25 subunit (Rpp25) (NM_133982), and β-Actin (NM_007393) (for primer sequences see Supplementary Table S1; Supplementary Data are available online at
siRNA knockdown
siRNAs for Mageb16 [Mm_Mageb16 (2410003J06Rik_5): TAGGGAGAAGGGAGCGTCTTA; Mm_Mageb16 (2410003J06Rik_6): TACGGGCTAAAGCTGAAACTA] were purchased from Qiagen and used at a concentration of 5 nM. Lipofectamine 2000 (Invitrogen) was used as siRNA transfection reagent as instructed by the manufacturer. CGR8 cells (7×10⁴) seeded in 24-well plates with normal growth medium (containing LIF) were transfected the following day with siRNA-Lipofectamine complex. Negative transfection control labeled with Alexa Flour 488 provided by Qiagen (to monitor transfection efficiency with green fluorescence) was used as scrambled control; mock control (transfection agent only) also was included. After 6 h of transfection, normal growth medium was added. Cells were harvested after 48 h for RNA and protein isolation. Knockdown efficiency was measured with qRT-PCR at mRNA expression level and with western blotting at protein expression level. Expression of the pluripotency markers Pou5f1, Nanog, and Sox2 and early mesodermal, ectodermal, and endodermal markers T (Brachyury), FGF5, and HNF4α, respectively, was determined in untransfected ESCs and scrambled and Mageb16-knockdown samples using qRT-PCR. Nucleotide sequences of these primers are provided in Supplementary Table S1.
Western blotting
Separate knockdown experiment was set with Mageb16 siRNA along with negative transfection control (scrambled) and untransfected ESC control following the same protocol mentioned previously in siRNA knockdown method. Cells (4×10⁵) were seeded in 25 cm2 flask and the same 5 nM siRNA concentration was used. Cells were collected after trypsinization and washed with cold PBS and lysed in 150 mM NaCl, 1 mM EDTA, 20 mM Tris-HCl (pH 7.4), 1 mM phenylmethanesulfonyl fluoride, 1% Triton X-100, and 1% protease inhibitor cocktail (Sigma) at 4°C. Protein samples were quantified with the Bradford reagent (Sigma). From each sample 45 μg of protein was separated using 12% sodium dodecyl sulfate–polyacrylamide gel electrophoresis gels and transferred to polyvinylidene fluoride membrane. Membranes were blocked with 5% bovine serum albumin at room temperature. Membranes were incubated with Mageb16 polyclonal antibodies (Abgent Europe Ltd.) for overnight at 4°C on orbital shaking. After washing with PBST solution (PBS with 0.1% Tween-20), membranes were incubated with secondary antibodies and labeled with horseradish peroxidase for 1 h at room temperature. Mageb16 was detected using enhanced chemiluminescence Western detection system (Fisher Scientific GmbH).
Identifying significantly regulated transcripts related to pluripotency and self-renewal
Array data were quantile normalized using the RMA implementation of the R Affy package [12,13]. Probe sets marginally expressed in all conditions were rejected using the MAS5 present call (P<0.05) [14]. Differential expression of the remaining 23,142 of 45,101 has been determined by the linear model implementation of the R Limma package [15] followed by a Benjamini Hochberg multiple testing correction (1% FDR). To determine specifically regulated pluripotency-associated transcripts, the expression levels of undifferentiated ESCs (day 0) were pairwise compared with the levels of differentiated 3- to 7-day-old EBs since many pluripotency markers, such as Pou5f1, do not show significantly varying expression up to day 3. Of particular interest were transcripts that show high expression in the undifferentiated state and low expression levels throughout differentiation. Size of change was stated with threshold value of fold change (FC) 2 in absolute scale.
To have a highly consistent list of significantly regulated transcripts, intersection of significant regulated genes from the CGR8 time course and from the transgenic experiment cluster of CGR8 was implemented. To obtain a significant list of genes of the transgenic experiment cluster of CGR8, following transgenic cell lines of CGR8, such as α-myosin heavy chain (α-MHC) ESCs [9], BMP2 ESCs [16], T (Brachyury) ESCs [17], α-smooth muscle actin 2 (Acta2) ESCs [18], and CD31 ESCs [19]), were taken for pairwise comparisons against their corresponding mixed (multilineage) and purified populations. Clear description of the strategy followed to obtain the significant list of genes in the transgenic experiment cluster of CGR8 mentioned previously is outlined in Fig. 2.
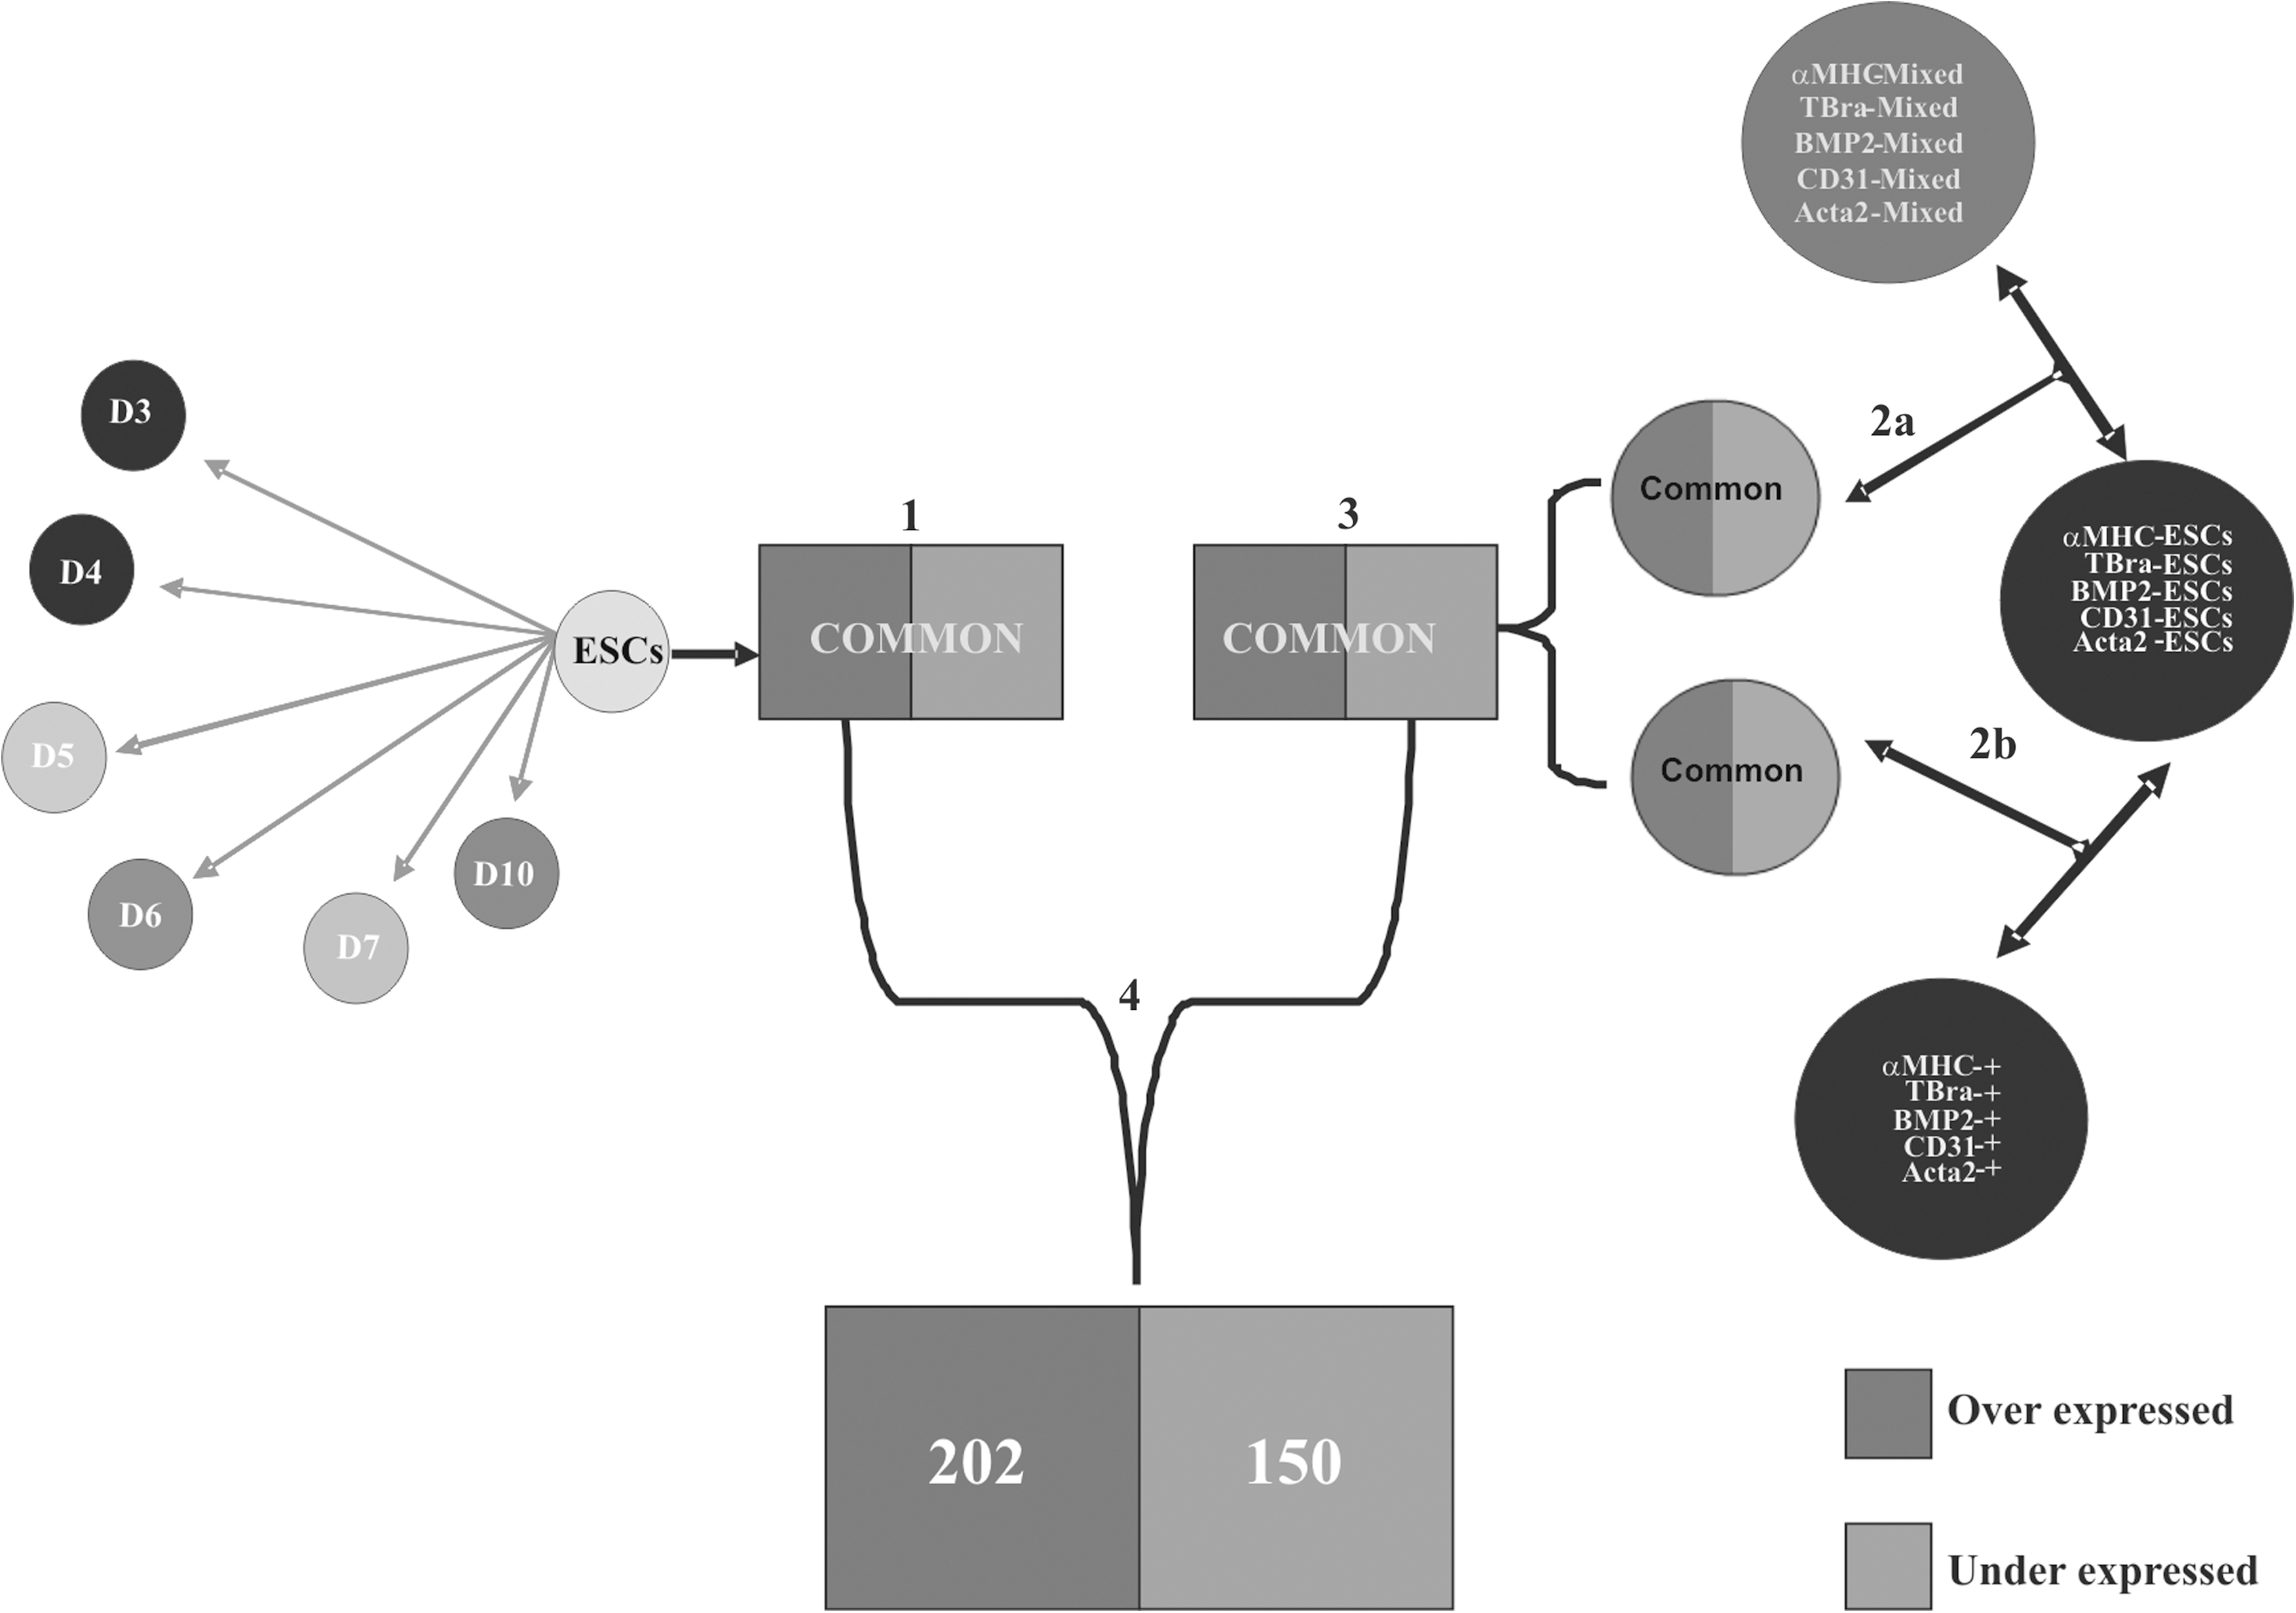
Methodology applied to identify differentially expressed transcripts pertinent to pluripotency. Step 1: Obtained list of differentially expressed transcripts is commonly found in all pairwise statistical comparisons between ESCs (day 0) and day 3–7 and 10 EBs. Step 2: (a) Identified differentially expressed transcripts common to pairwise statistical comparisons between transgenic undifferentiated ESCs and their generated mixed populations. (b) Identified differentially expressed transcripts common to pairwise statistical comparisons between transgenic CGR8 ESC population and their generated pure populations. Step 3: Intersection-resulted list of lists from Step 2a and b. Step 4: Intersection-resulted list of lists from Step 1 and 3, and from these, 202 upregulated transcripts and 150 downregulated transcripts are identified after redundancy removal.
From the list obtained from the intersection study performed, only significant transcription factors were chosen to prove their homogeneous expression pattern both in undifferentiated and differentiated states other than in CGR8 cell lines. For that a time series of the mouse ESC lines, R1, J1, and V6.5, dataset of an 11-point time course (Embryonic Stem Cell and Embryoid Body Time course) study [20] made public in Gene Expression Omnibus, was chosen.
Identifying significantly regulated transcripts in differentiating ESCs
To avoid biased interpretation of the large number of differentially expressed genes during differentiation of ESCs and to identify specific gene signature pathways, we used the gene ontology–analysis of variance (GO-ANOVA) application of the Partek Genomic Suite version 6.4 for our analysis. For each annotation the application sets up an ANOVA with 3 factors: array, transcript, and as an additional parameter the time course to identify genes that follow a particular expression pattern. GO annotations with an FDR<0.1% along the time course (n=5,772 of 6,455) were selected as differentially expressed. The selection was additionally restricted to level 5 GO annotations (n=1,453) to prevent overflowing overlap caused by the (multi-) hierarchical structure of GO. P values of consecutive points in time were −log10 transformed and afterward normalized to a mean of zero and a standard deviation of one. Estimation of the number of K-means clusters using the Davies-Bouldin procedure leads to K=7 groups.
Principal component analysis
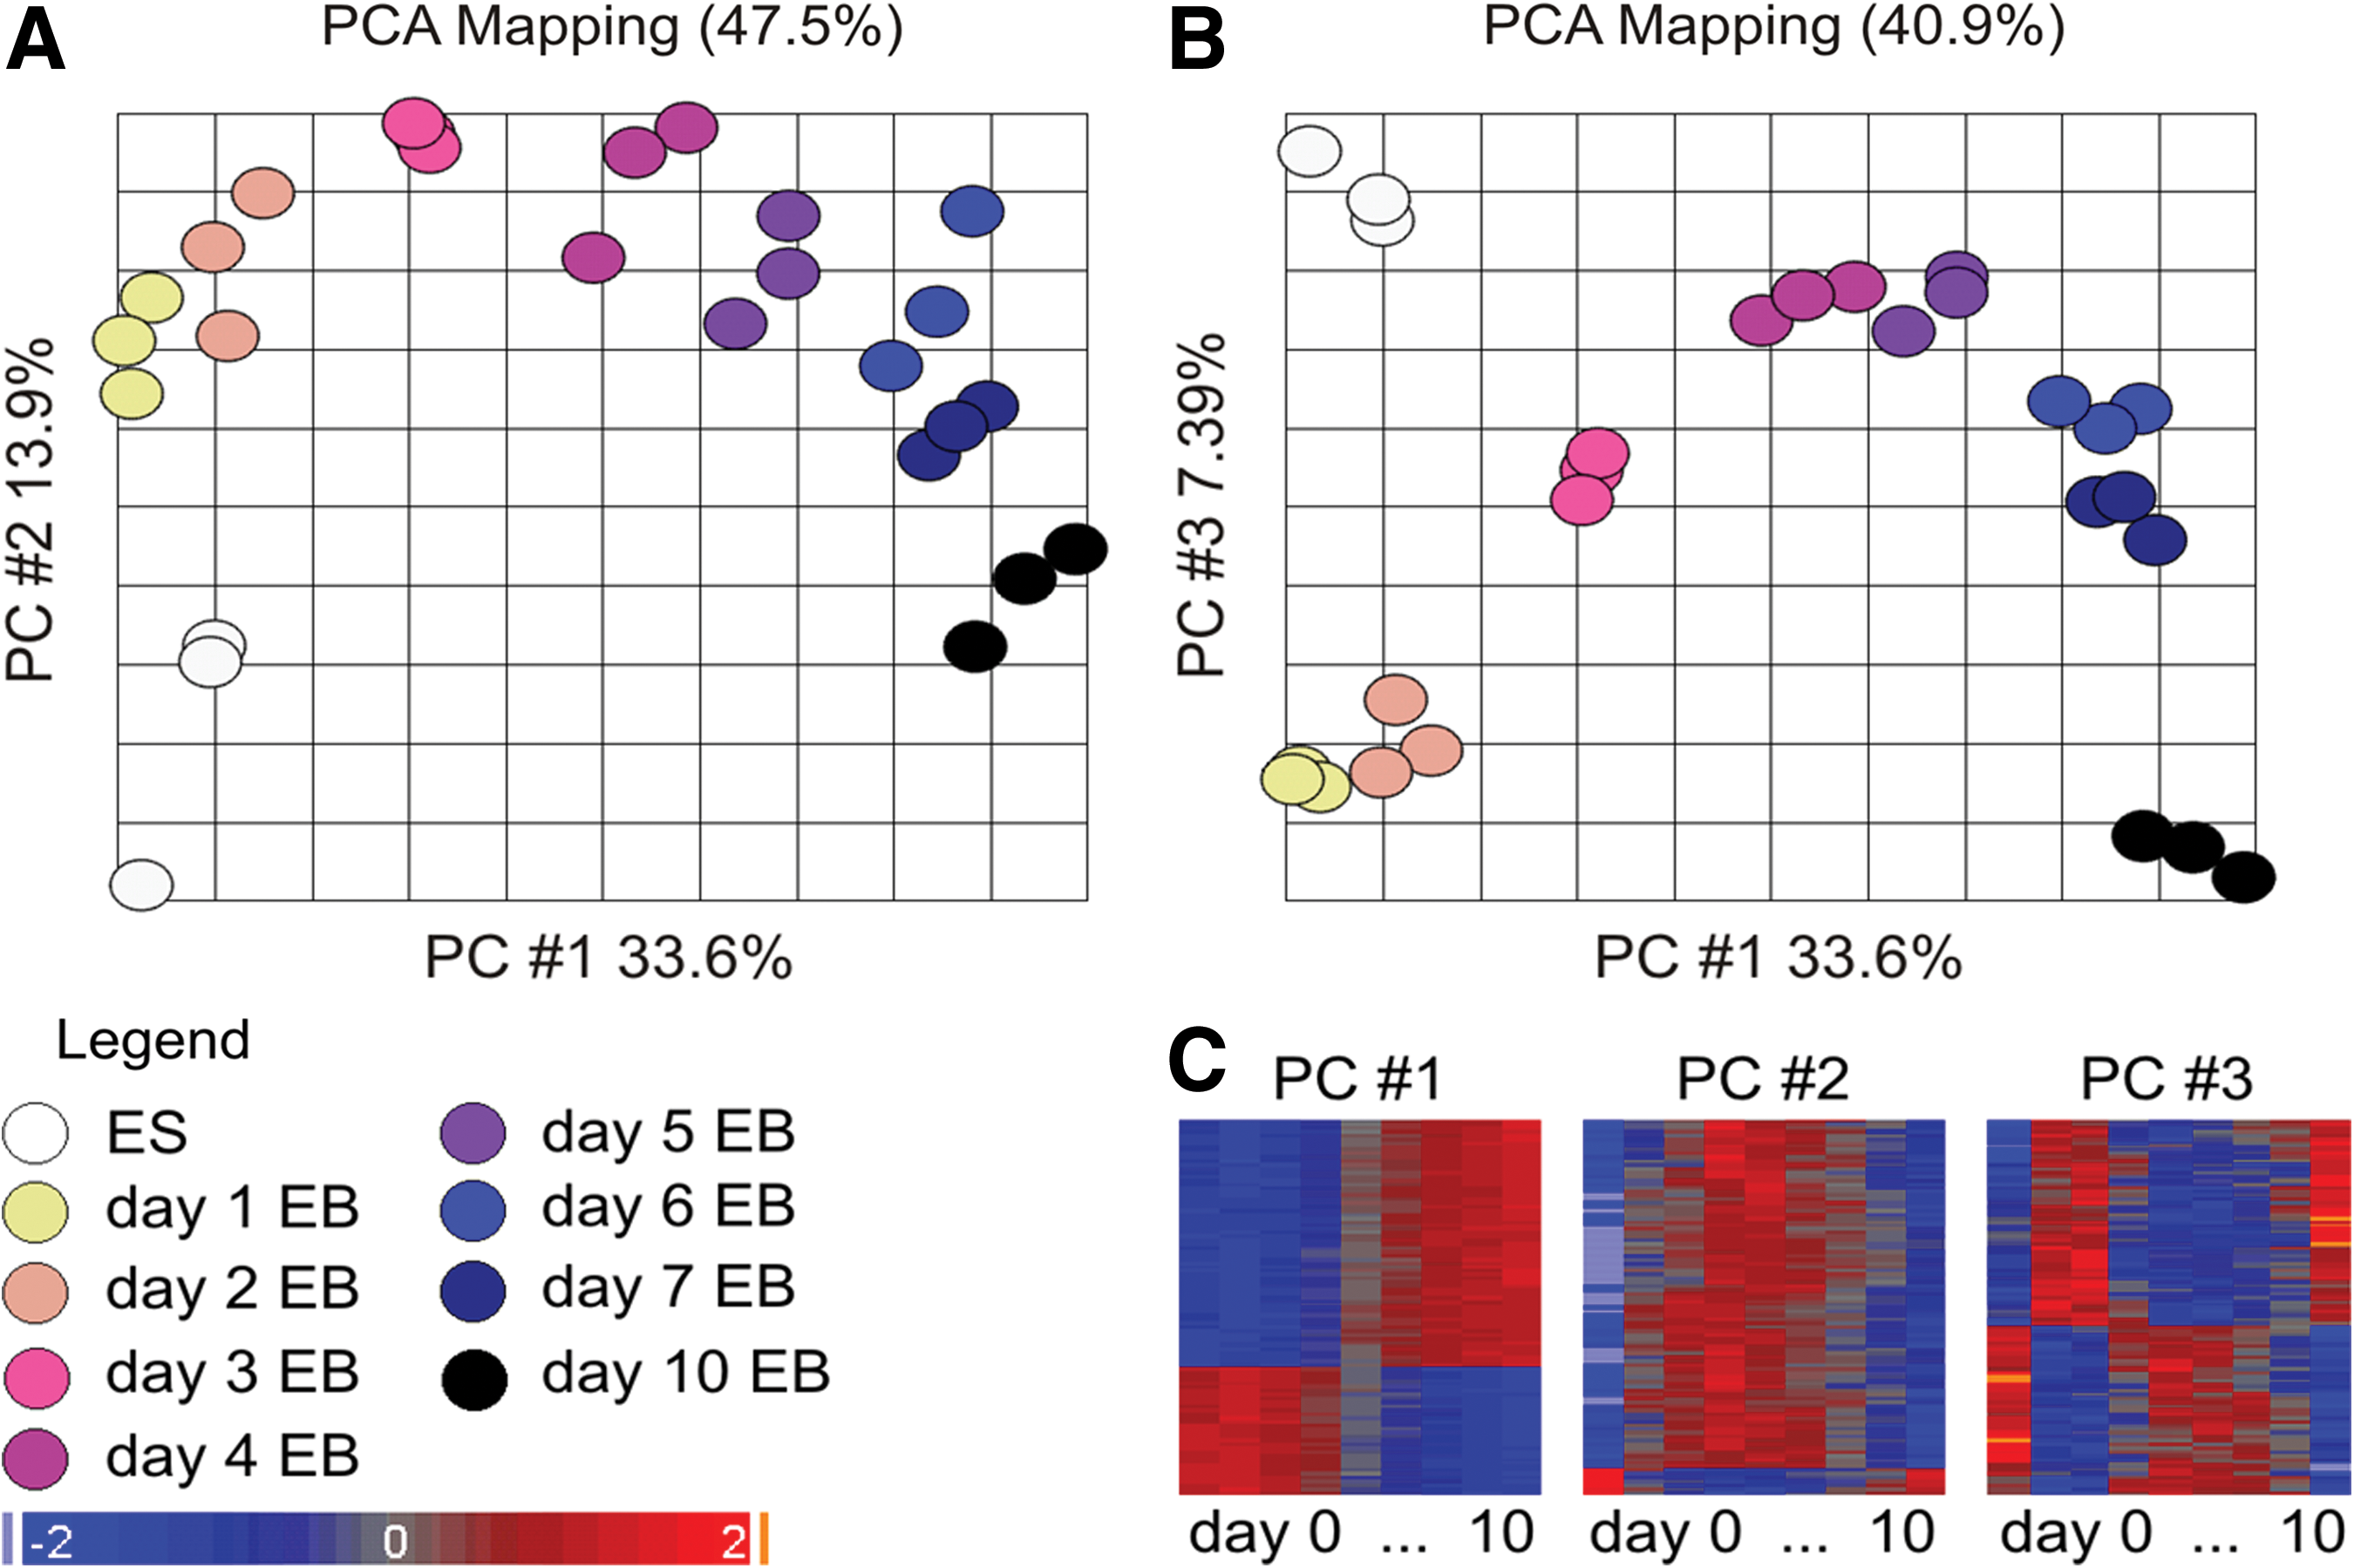
Principal component analysis (PCA) is performed using Partek Genomics Suite (Partek, Inc.) to visualize data variability in a multidimensional picture. Distance between the samples reflects the degree of dissimilarity between them. PCA mapping of the time kinetic data shows 54.9% of data variance in the first 3 principal components (PC1 33.6%, PC2 13.9%, and PC3 7.39%).
Results and Discussion
Visualization of transcriptome alteration at differentiation process
Early EB differentiation is characterized by fundamental changes of the transcriptome. PCA of the differentially expressed genes resulted in 3 characteristic principal components (PCs) that represent 54.9% of the dataset variance (Fig. 3A, B). The 100 most correlated probe sets in component loading of each PC [absolute (r)>0.8] have been visualized in a heatmap after hierarchical clustering to exemplify the characteristic of the PCs. PC1, PC2, and PC3 represent single, transient, and double-transient switches of the expression status, respectively (Fig. 3C). The most prominent switch time point in PC1 (33.6% of the dataset variance) is found between days 3 and 4; up to day 3 there is no significant change. Among the pluripotency-related core factors, Pou5f1 has its constant expression up to day 3 and even some of the other pluripotency-related regulatory genes stay without significant changes in their expression profile.
Principal component analysis (PCA) mapping of PCs 1 and 2
Significantly regulated transcripts pertinent to pluripotency
Intersection of significant regulated genes in the CGR8 time course and CGR8 transgenic experiment cluster resulted in 202 upregulated transcripts and 150 downregulated transcripts after redundancy avoidance (Supplementary Tables S2 and S3).
Among 202 high-expressed transcripts, there are 60 transcription factors (Supplementary Table S4) identified and so far reported pluripotency-associated markers are all present in these 60 genes. Among low-expressed genes, there are 26 transcription factors (Supplementary Table S5). Expression pattern wise, clear separation between high- and low-expressed transcription factors was observed (Fig. 4) in a time series of the mouse ESC lines R1, J1, and V6.5, when the pattern of expression of 54 significant transcription factors from the just outlined lists was visualized. Therefore, irrespective of different murine ESC lines, these identified common transcription factors seem to have similar regulatory mechanism at pluripotency network.
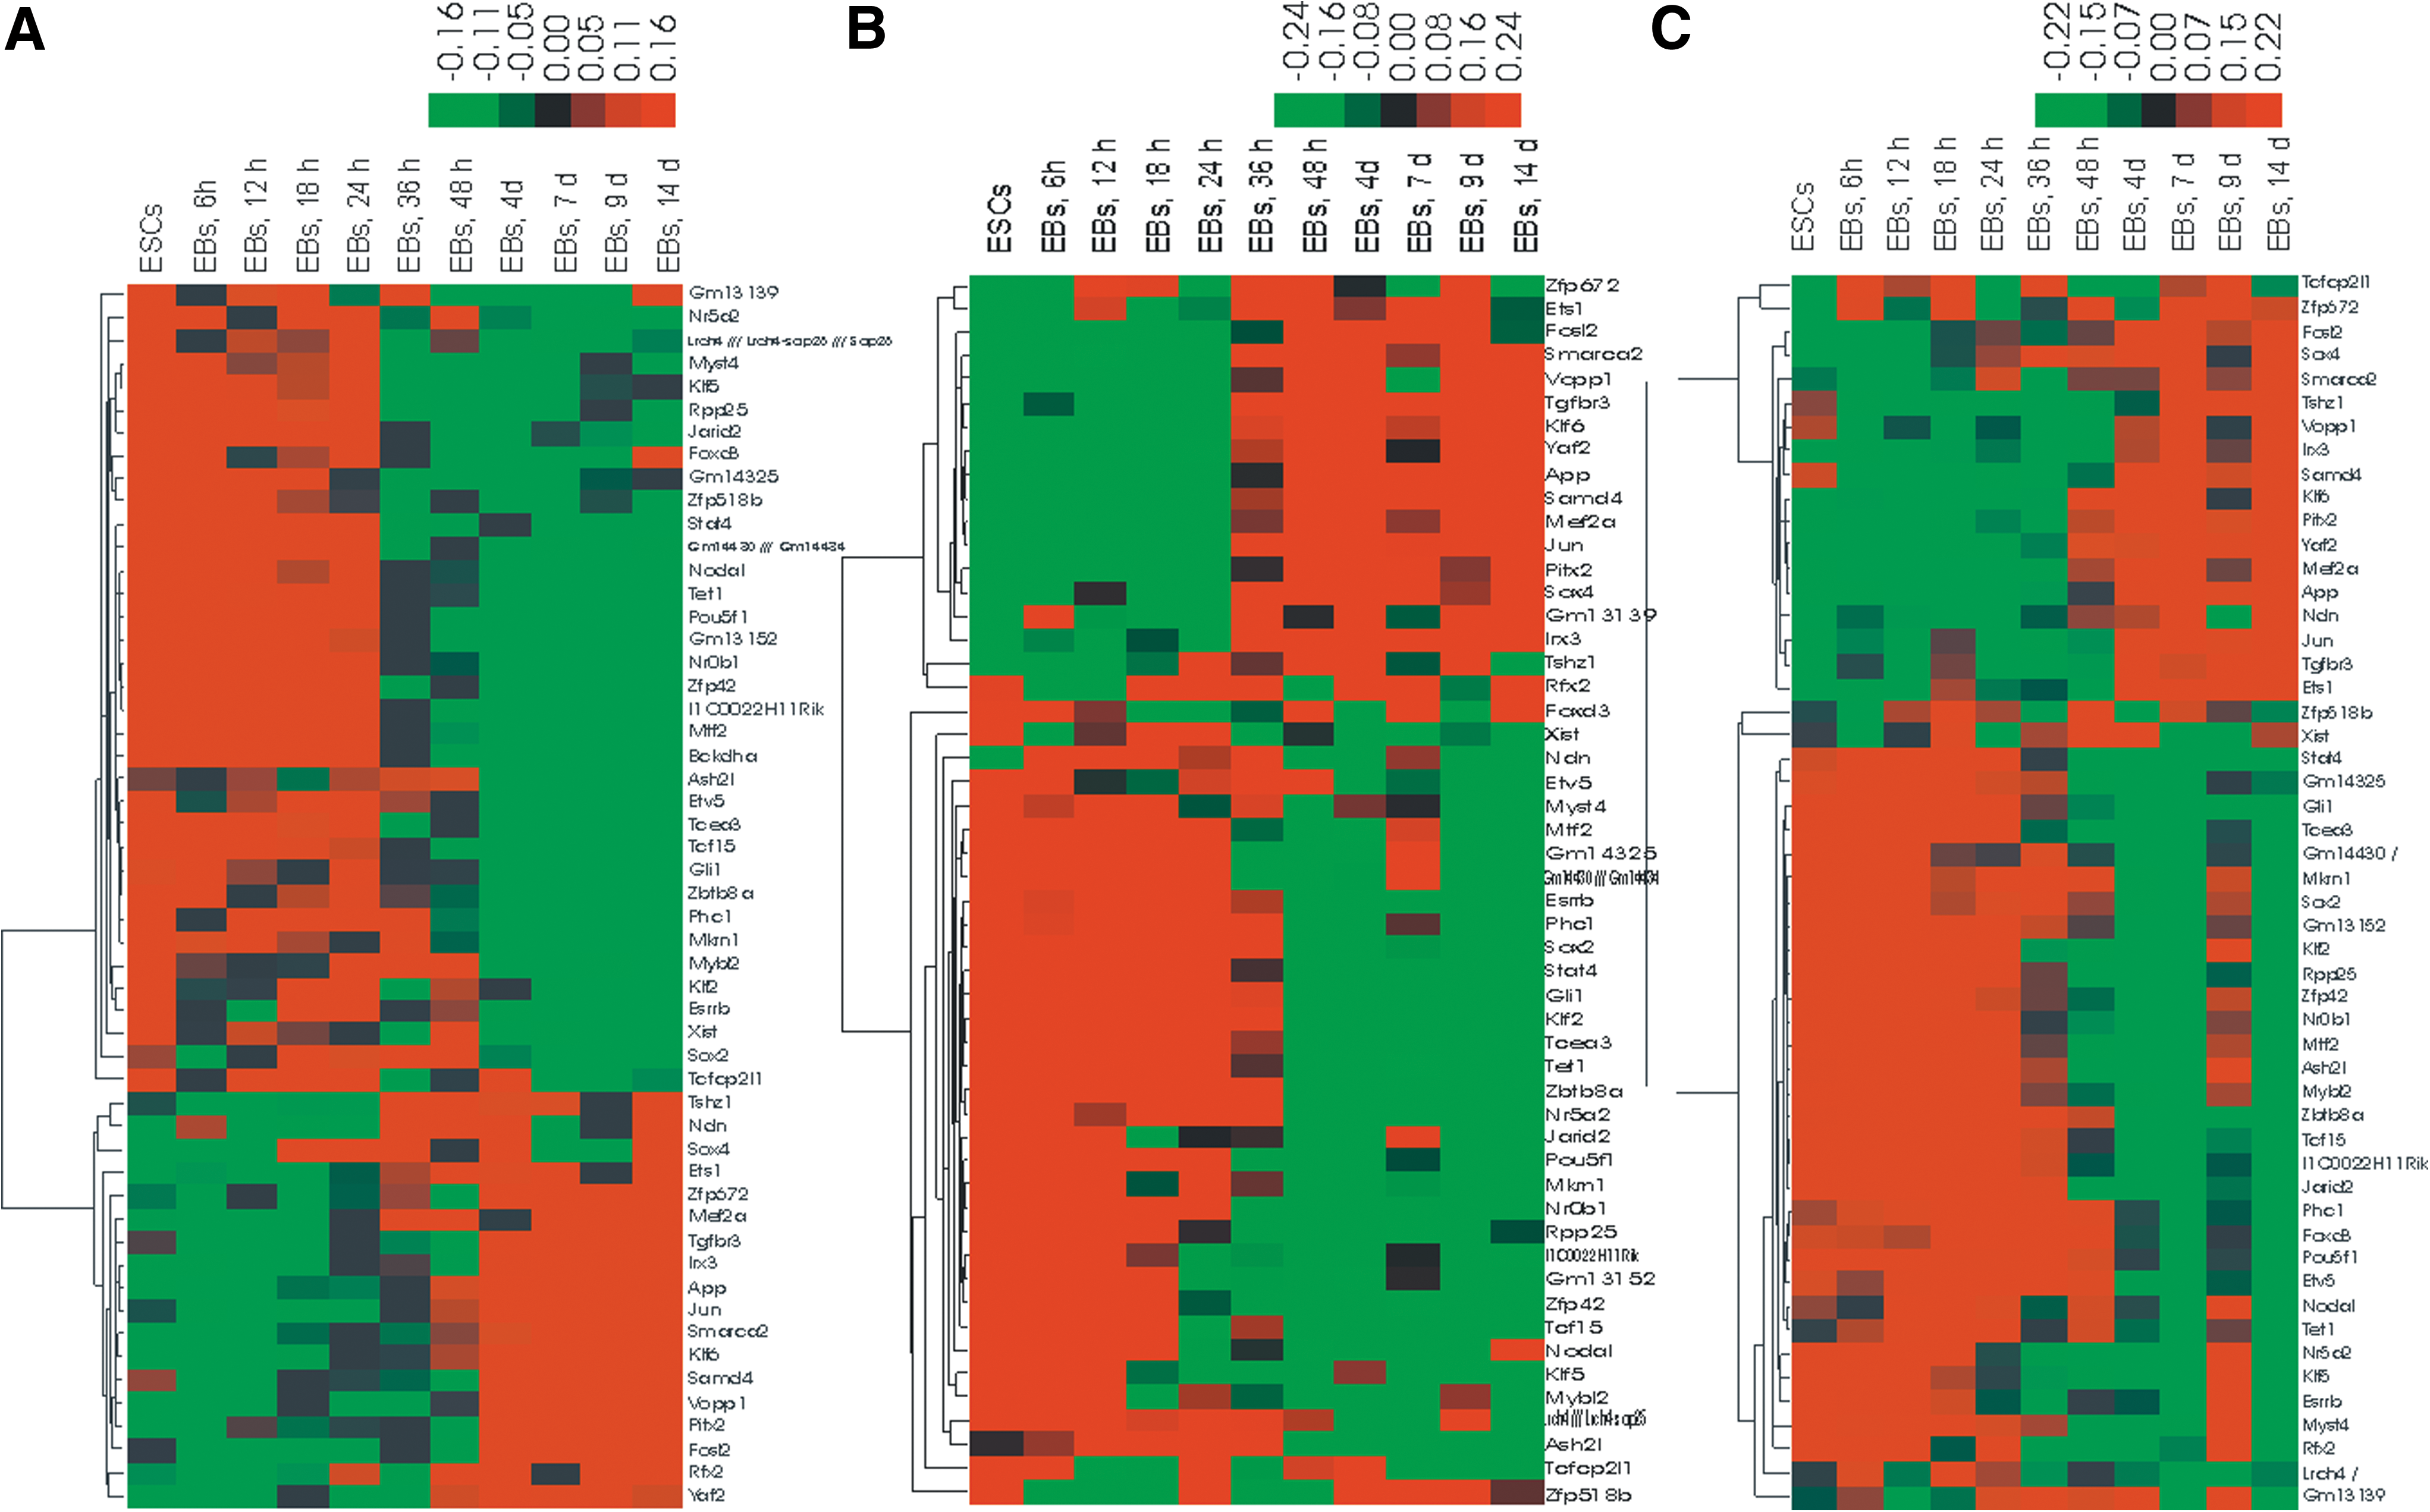
Expression pattern of significant transcription factors during progressive differentiation of the ESCs (ESCs to 10-day old EBs).
Transcription factors prominently expressed in the pluripotent state
Besides the well-known pluripotency-associated transcription factors, such as Pou5f1, Nanog, Sox2, Kruppel-like factor 4 (Klf4), other Klf factors—such as Klf2, Klf5, and Utf1—Esrrb, Tcfcp21l, Sall4, Dax1 (Nr0b1), Stat4, and Zfp42, few more regulatory genes (Table 1) were identified based on significant changes (downexpressed) of their expression level after the induction of differentiation. From this, only few transcription factors, which are neither discussed well with its pluripotency association nor taken for related genetic manipulation study, are reported in the following paragraph.
FC values in absolute scale are provided in comparison with the time point day 0.
FC, fold change; Foxd3, Forkhead box D3; Rfx2, regulatory factor X2; Dppa2, developmental pluripotency associated 2; Dnmt3l, DNA methyltransferase 3-like; Zbtb8a, zinc finger and BTB domain containing 8a; Etv5, Ets variant gene 5; Tcf15, transcription factor 15; Tdrd12, tudor domain containing 12; Mkrn1, makorin-ring finger protein; Gli1, Gli family zinc finger 1; Rpp25, ribonuclease P25 subunit; D1Pas1, DNA segment, Chr 1, Pasteur Institute 1; Abcb1a, ATP-binding cassette, sub family B, member 1A.
Among them, Polyhomeotic-like 1 (Phc1) is a core component of polycomb repressive complex 1 (PRC1), a polycomb group protein complex that is required for maintaining ESC pluripotency and plasticity during embryonic development [21]. Jardi2 (jumonji, AT-rich interactive domain 2), a factor that negatively regulates cell proliferation, is a regulatory subunit of PRC2. It regulates Prc2-mediated H3k27 methylation and eventually modulates ESC pluripotency and somatic cell reprogramming due to methylation along with other subunits of Prc2, MTF2, and esPRC2p48 [22]. Rbpj (recombination signal binding protein for immunoglobulin kappa J region) is involved in NOTCH signaling [23] and has been predicted to have an important role in maintaining pluripotency [24]. Forkhead box D3 (Foxd3) is essential for the development of endoderm, is expressed in ESCs, and is associated with early lineage-specific decisions with a coregulatory factor Pou5f1 [25]. More recently, it has been shown that tet oncogene 1 (Tet1) along with Tet2 is associated with the pluripotent state [26]. Regulatory factor X2 (Rfx2) that influences HLA class II expression is highly expressed in testis and is mentioned as Pou5f1-associated protein [27]. Also, it has been shown that depletion of developmental pluripotency associated 2 (Dppa2) initiated differentiation and in parallel repressed proliferation in murine ESCs [28]. DNA methyltransferase 3-like (Dnmt3l) is required for DNA methylation in stem cells and is not expressed in differentiating cells [29]. Monocytic leukemia zinc-finger protein (MOZ) along with MORF (MYST4) safeguards identity of stem cell through maintaining epigenetic integrity [30]. In ESCs, Moz expression is regulated by the cascade of Nanog, Pou5f1, and Sox2 [31]. Zinc finger and BTB domain containing 8a (Zbtb8a) is predicted to be one of the transcription factors having at least one preimplantation expressed sequence tag (EST) among many ESTs used to study the 7 stages of development from the unfertilized oocyte to the blastocyst stage [32]. Knockout studies of Etv5 have shown its involvement in the maintenance of spermatogonial stem cells by regulating chemokine production from Sertoli cells [33]. Etv5 is involved in the regulation of branching involved in mammary gland duct morphogenesis [34]. Transcription factor 15 (Tcf15) also known as Paraxis is involved in paraxial mesodermal development and regulates somite morphogenesis [35]. Tudor domain containing 12 (Tdrd12) also know as ECAT8 has been identified as one of the candidates of the LIF/Stat3-independent factor essential for pluripotent cells [36]. Makorin-ring finger protein (Mkrn1) is a putative downstream gene of Pou5f1 and is expected to play significant role at the maintenance of pluripotency [37]. Gli family zinc finger 1 (Gli1), a Hedgehog transcription factor, is involved in the positive regulation of cell proliferation, osteoblast differentiation, and in epidermal cell differentiation [38]. Rpp25 is involved in transcription and processing of tRNA and it also binds to H1 RNA in vitro [39]. DNA segment, Chr 1, Pasteur Institute 1 (D1Pas1) is expressed in germ cells of the testis and its expression is developmentally regulated [40]. However, its expression is much higher in ESCs compared with differentiated EBs. ATP-binding cassette, sub family B, member 1A (Abcb1a) along with other ABC transporters, such as Abcg2, Abcb1b and Abcc1 is expressed both in early germ cells and latter in testis [41]. The mouse-specific Zinc finger proteins zfp936, 1700029I01Rik, zfp229, and zfp819 also are significantly overexpressed in the undifferentiated state. However, so far nothing is known about a potential functional role of these zinc finger proteins for the pluripotency of the ESCs.
Highly expressed new candidate genes are critical to the pluripotency network
The following group contains the highly upregulated genes (Table 2) that have not yet been associated with stemness or pluripotency properties. Mageb16, melanoma antigen family B, that still remains functionally nonannotated shows higher level of expression in the undifferentiated state. Morc1 is located in the nucleus and is reported to be involved in spermatogenesis [42] and in “regulation of early meiotic prophase events involving chromosome synapsis or recombination” and even may perturb generation of male germ cells through meiosis [43]. Its role in cell cycle regulation and proliferation of NT2 embryonal carcinoma stem cells has also been studied. Cth, also known as cystathionine gamma-lyase (CSE), is involved in the negative regulation of cell growth and proliferation. CSE-knockout mice show increased proliferation rates of smooth muscle cells [44]. Solute carrier family 7 (Slc7a3) is found in the plasma membrane and is involved in amino acid transportation and the regulation of Target of rapamycin signaling [45]. Heat shock transcription factor 2 binding protein (Hsf2bp) is expressed in human testis and its involvement in modulation of HSF2 activation in testis has been proposed [46]. Gametocyte specific factor 1-like gene (Gtsf1l), mapped at chromosome 2, is expressed at testis and is essential for spermatogenesis beyond the early meiotic phase [47]. Lipase member H (Liph), mapped at chromosome 3, involves in lipid catabolic process and is found in membrane. Cordon-bleu (Cobl) is expressed in the axial structure of the gastrulating mouse embryo [48] and is involved in the biological process neural tube closure. Proteasome subunit alpha type 8 (Psma8) is involved in the positive regulation of ubiquitin-protein ligase activity that regulates mitotic cell cycle. Its high level of expression in testis and in murine ESCs is recorded at BioGPS gene annotation portal [49]. Oocyte expressed protein homolog (Ooep) (dog) is involved in in utero embryonic development and is found in the cytosol. Its expression is higher in oocytes and has been reported to be associated with Ces5, significantly regulated gene at murine ESCs [50]. Leucine-rich repeat containing 34 (Lrrc34) is highly expressed in murine ESCs and in testis. Pycard, containing PYD and CARD domain, is involved in signal transduction and regulation of the apoptosis pathway [51].
FC values in absolute scale are provided in comparison with the time point day 0.
Slc7a3, solute carrier family 7; Hsf2bp, heat shock transcription factor 2 binding protein; Gtsf1l, gametocyte specific factor 1-like gene; Liph, lipase member H; Cobl, Cordon-bleu; Psma8, proteasome subunit alpha type 8; Ooep, oocyte expressed protein homolog; Lrrc34, leucine-rich repeat containing 34.
Correlation between mRNA detected by microarrays and qRT-PCR
Verification of the homogeny of signal expression levels of few notable genes identified from microarray data analysis prominent at pluripotent state, such as Mageb16 (NM_001113734), Etv5 (NM_023794), and RPP25 (NM_133982) along with known markers Pou5f1 (NM_013633) and Nanog (NM_028016), was performed with qRT-PCR. As indicated, in Fig. 5A and B, results of the Affymetrix analyses clearly correspond to the results obtained from the qRT-PCR. Therefore, the list of transcripts identified is reliable. As a proof of concept, Mageb16, prominently expressed at pluripotent state, was chosen for knockdown study to observe the expression of ESCs and germ layers' marker genes.
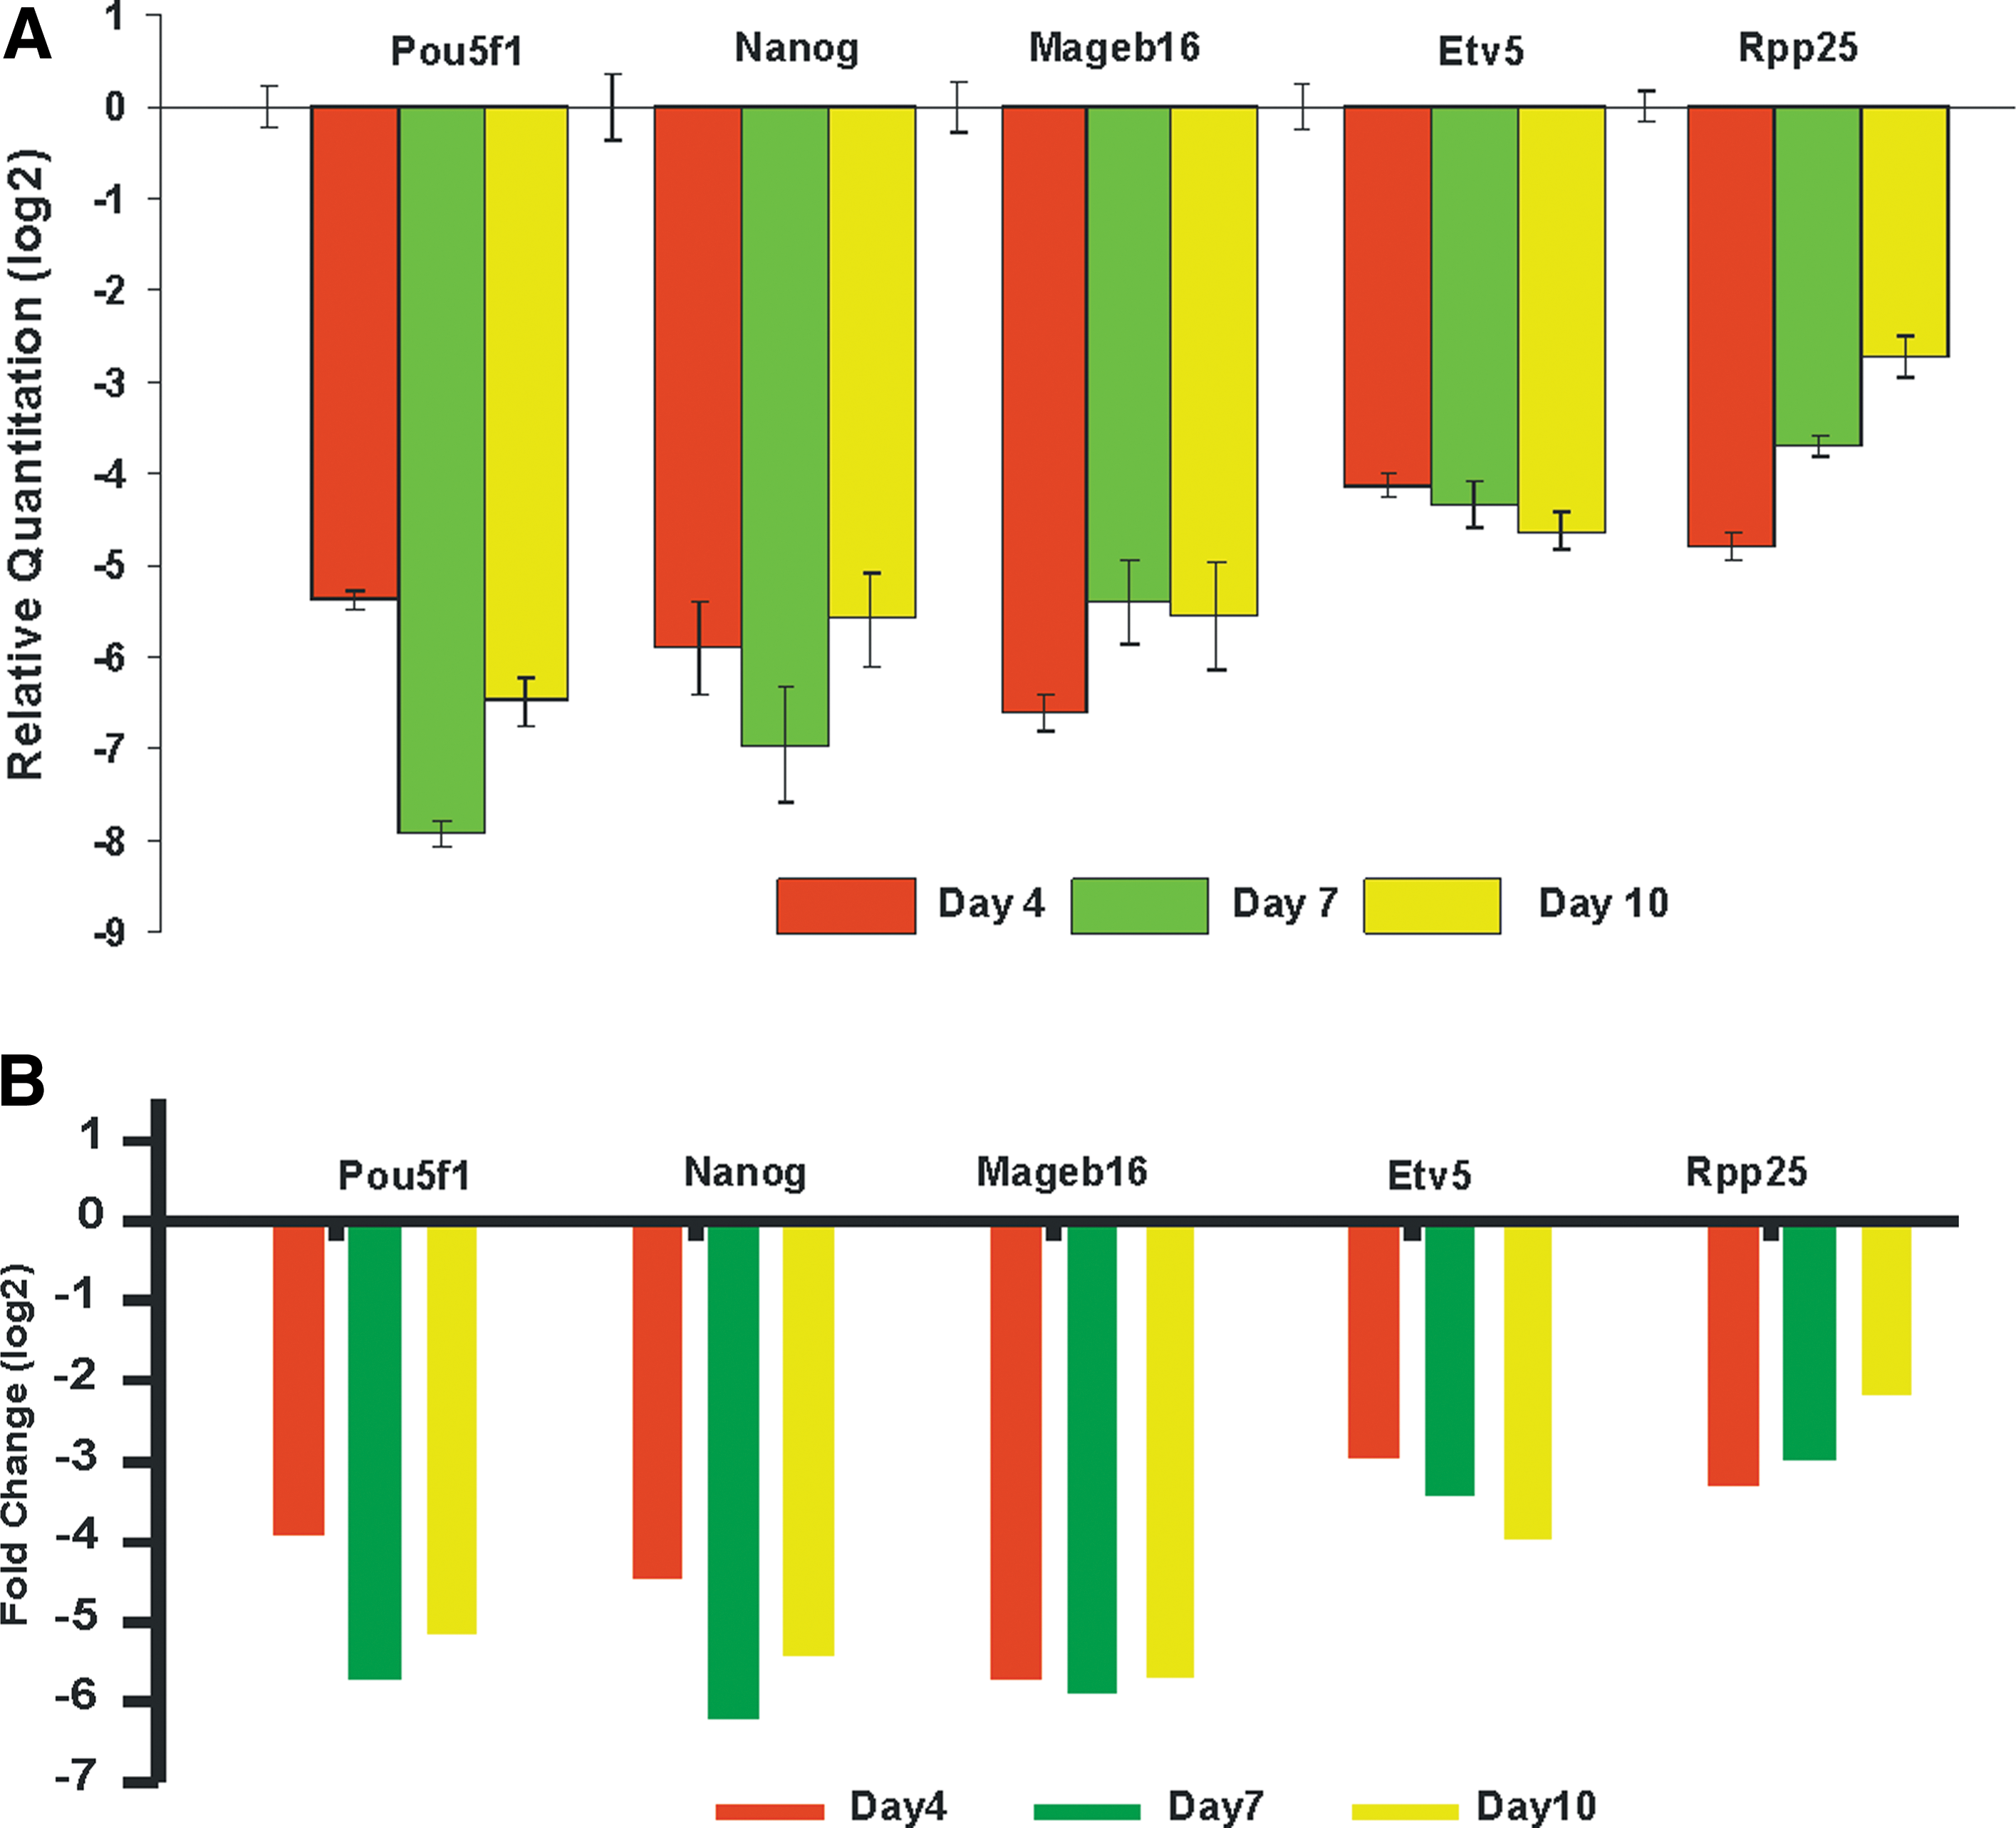
mRNA expression of Pou5f1, Nanog, Mageb16, Ets variant gene 5 (Etv5), and ribonuclease P25 subunit (Rpp25) derived from quantitative real-time–polymerase chain reaction (qRT-PCR)
Mageb16 knockdown activates differentiation even in the presence of LIF
From our study, it was identified that Mageb16 mRNA expression decreases drastically with the initiation of differentiation and its expression level is very low in somatic cells derived from ESCs. Moreover, it was also reported to be one of the significant gene among 782 upregulated genes in ESCs determined by a combined study of RNA seq profile and microarray profiles [52]. Therefore, it was selected for siRNA knockdown to explore a possible relation to pluripotency. Approximately 70% of knockdown efficiency was achieved 48 h after transfection. Compared with untransfected (ESCs), scrambled, and mock control samples, only 30% of Mageb16 mRNA expression was observed in siRNA-Mageb16 targeted ESCs (Fig. 6A) and the same knockdown efficiency was confirmed at protein expression level with western blotting (Fig. 6B). Mageb16 siRNA-treated cells did not show significant expression changes of pluripotency markers, such as Pou5f1, Nanog, and Sox2. Interestingly, almost 2-fold overexpression of early meso-, ecto-, and endodermal lineage markers (T Brachyury, FGF5, and HNFα) was observed in the knockdown ESCs (Fig. 6C). These findings clearly show that Mageb16 may also be essential for pluripotency via pathways that are independent of classic pluripotent genes, such as Pou5f1, Nanog, and Sox2. Even in the presence of LIF, under pluripotent conditions, knockdown of Mageb16 resulted in an upregulation of key genes required for the formation of the germ-layer-specific genes. Moreover, as shown in Fig. 5A, the expression pattern of Mageb16 is similar to that of Pou5f1 and Nanog. Therefore, the promoting actions of Mageb16 toward pluripotency cannot be excluded. The relationship between Mageb16 and the key pluripotency marker genes has to be elucidated. The subcellular localization of this protein is predicted by the Euk-mPloc 2.0 package [53] to be either in the nucleus or in the cytoplasm.

Expression of specific pluripotent and germ layer gene markers in Mageb16 knockdown ESCs mediated by 2 different siRNAs.
Identification of key differentiation gene clusters using K-means clustering pertinent to differentiation process
The K-means clustering (Fig. 7) using the Euclidean distance function resulted in straightforward and individual patterns of regulation between 7 of the 8 pairwise comparisons (Supplementary Table S6). The genes identified in these 7 clusters are all discussed here in terms of them enriching GO during the differentiation process. As shown in Supplementary Fig. S1, GO and probe set interconnections on this stage as given for cluster 1 (EB 4 to EB 5 differences) most probe sets are related to 1 GO annotation. Other probe sets are in central positions in the probes set to GO network interconnection. Probe sets have been selected as interconnectors if they (i) interconnect 4 or more GO annotations, (ii) are itself differentially expressed (FDR<0.1%) with an LSD P value minimum at the time frame specified by the GO annotation cluster (LSD P<10−3), and (iii) with significantly more interconnections in the specified cluster than in all other clusters together (Fisher's exact test FDR<5%). Consequently, the filter cannot map the entire picture of CGR8 differentiation but the selected interconnectors are interesting due to their extraordinary position and fulfill the statistical criteria to be candidate key players in differentiation.

K-means clustering of 1354 significant differentially expressed level 5 gene ontology annotations using the Euclidean distance function.
No prominent multilineage-related differentiation pathways noted in cluster 5 at ESCs versus day 1 EBs comparison
As shown in Supplementary Fig. S2 (part 1), 7 genes have been identified participating in 317 GO annotations in total. However, as indicated in the ArrayExpress Archive (
Early developmental processes are defined by the genes in cluster 4 (day 2 vs. day 3 EB comparison)
Interestingly, we identified in cluster 4 (day 2 vs. day 3 EBs) (Supplementary Fig. S2, part 1) 15 genes that are highly upregulated and interconnecting to 295 GOs participating mainly in early developmental processes such as the formation of the germ layers as well as on the development of derivative somatic cells. Among the genes are the key transcription factors T (Brachyury), FoxC1, FoxC2, FoxA2, HoxB1, LHX1, and Gata4. Clearly, in day 3 EBs, transcripts participating in the early differentiation processes of all 3 germ layers are predominantly expressed. The FOXC1, FOXC2, and FOXA2 genes belong to the forkhead family of transcription factors. FOXC1 and FOXC2 have been implicated in the regulation of many developmental processes, including foregut morphogenesis, proper lens formation, and hair follicle development (reviewed by Refs. [54 –56]). FOXC1 and FOXC2 are expressed in the paraxial mesoderm and somites [57 –59]. Knockout homozygous mutant mice for Foxc1−/−/Foxc2−/− lack expression of segmentation genes that are normally transcribed in anterior and posterior somites and somites fail to express the myogenic marker MyoD [60]. In summary several studies indicate that expression of Foxc1 and Foxc2 is crucial for the establishment of paraxial mesoderm, leading to skeletal myogenesis in the developing embryo [54].
Foxa2 regulates the specification, neurogenesis, and differentiation of dopamine neurons in the midbrain floor plate (for review see Ref. [61]). Further, it has been demonstrated that Foxa2 is also involved in the liver development in mouse [62]. Foxa2 and Gata4, highly expressed, act also as markers for definitive endoderm [63].
Lhx1 is expressed during embryogenesis in the mouse early in mesodermal tissue, and then later during urogenital kidney, liver, and nervous system development. Also, Lhx1 is required for regulating the vertebrate head development and the nervous system, as well as the female reproductive tract development (for review see Ref. [64]). The prototype T-box transcription factor T (brachyury) is a canonical marker for early mesoderm [65]. HoxB1 belongs to the homeobox family of genes encoding for a highly conserved family of transcription factors and are involved in developmental processes in all multicellular organisms. Altered segmental identity and abnormal migration of motor neurons in mice lack Hoxb. Lack of Hoxbi in Hoxb1-null mice demonstrated an important role for hindbrain patterning and development [66,67]. Hoxb1 expression is not limited to the developing hindbrain but occurs also in the paraxial mesoderm and cervical somites [67] as well as in the development of the vertebrate skeleton [68]. Hoxb1 controls cell fate specification and proliferative capacity of neural stem and progenitor cells in ESCs [69]. Taking into consideration all these findings it is obvious that the differentiation time point of days 2 to 3 defines the onset of the early differentiation processes.
Significant transcripts identified in day 3 versus day 4 EB comparisons, part of cluster 6
In cluster 6 (day 3 vs. day 4 EBs) (Supplementary Fig. S2, part 1), we identified only 3 genes, TGF-β, Col1a1, and ATP7a, that are highly upregulated and interconnecting to 277 GOs participating mainly to early developmental processes of the vasculature development, keratinocyte differentiation hematopoiesis (TGF-β), cartilage and epidermis development, bone trabecula formation, skeletal system morphogenesis, central nervous system neuron development, and limb morphogenesis. Based on mouse knockout and mutant analysis it has been demonstrated that TGF-β signaling plays an important role in the development of mesoderm formation, including the development of their organ derivatives such as heart, bone development, and keratin development, as well as in endoderm formation, including organ derivatives such as liver and gastrointestinal tract development (for review see Ref. [70]). COL1A1 encodes for the pro-alpha1 chains of type I collagen, the fibril-forming collagen found in most connective tissues that is abundant in bone, cornea, dermis, and tendon (for review see Ref. [71]). The copper-translocating ATP7A is involved in the Cu2+ homeostasis and in the biosynthetic incorporation of Cu into copper-dependent enzymes that are essential for the secretory pathway, Cu detoxification via Cu efflux, and mutations in ATP7 are associated with Menkes disease [72,73].
Insulin-like growth factor 1 is the prominent transcript in day 4 versus day 5 EB comparison (cluster 1)
In cluster 1 (day 4 vs. day 5 EBs), only insulin-like growth factor 1 (IGF1) has been identified as highly upregulated and participating into 136 GOs (Supplementary Fig. S2, part 1). IGF1 plays a central role in the growth and development of many tissues in the body and seems to be a key regulator of skeletal muscle development and repair [74]. Recently, mutations in human IGF1 gene and transgenic animal studies demonstrate that IGF1 plays an important role in the etiology of growth retardation [75]. IGF1 network with 6 GO annotations is provided in Supplementary Fig. S2 (part 1).
Onset of cardiomyocyte differentiation and blood cell development
In cluster 2 (day 5 vs. day 6 EBs), 8 highly expressed interconnecting genes participating to 101 GOs have been identified associated with contractile structure proteins of the heart Myh6 (myosin, heavy chain 6, cardiac muscle), Myl2 (myosin, light chain 2), Ttn (Titin), Mybpc3 (myosin binding protein C, cardiac), and others (Supplementary Fig. S2, part 2). These data clearly show that cardiomyocyte differentiation started between days 5 and 6. In cluster 3, 4 expressed interconnecting genes participating in 79 GOs have been identified associated with blood cell development and development of the immune response system: Ptprc, Igh-6, Fas, and Fcer1g.
Genes identified at day 7 versus day 10 comparison, part of cluster 7
In cluster 7, 13 expressed interconnecting genes participating to 248 GOs have been identified associated with general biological processes that are not associated with developmental processes (Supplementary Fig. S2, part 2). Interestingly, among them we found that CD83 antigen is highly upregulated. CD83 is a lectin that regulates the dendritic cells (DCs) [76] and the lymphocyte maturation and activation [77]. Fcgr (Fcgamma Receptors) is inflammatory immune system mediator protein located in the plasma membrane of leukocytes and eliciting the effects of immunoglobulin G antibodies on leukocytes resulting in an activation of the immune system [78]. Interestingly, Fcgr3 and Fcgr2b are highly upregulated in between 7- and 10-day EBs.
Also, Anxa1 has been found to be remarkably upregulated. AnxA1 and other annexins, such as AnxA6 and AnxA8, are Ca2+-binding proteins that show differences in their subcellular localization and mode of action. It has been shown that annexins are involved in the regulation of the EGF receptor activity via controlling the endocytic transport of the EGF receptor [79]. Recently, it has been shown that Annexin A1 plays a pivotal anti-inflammatory role in innate immunity and if it is absent inflammation is persisting. Therefore, Annexin A1 and its G protein-coupled receptor act as a target for anti-inflammatory therapeutics [80]. More recently, using AnxA1-KO mice it has been demonstrated that AnxA1 has pro-angiogenic functions for vascular endothelial cell sprouting, wound healing, and tumor growth and metastasis [81].
From our findings we may conclude that the developmental/differentiation processes in ESCs are hierarchical and reflect the ongoing of these processes under in vivo conditions. Moreover, our study also contributes to the understanding of the mechanisms involved in the pluripotency and differentiation of ESCs. In this context, the candidate genes that are prominently expressed at the pluripotent state other than well-reported genes can be considered for genetic manipulation to elucidate their participation into pluripotency network. This strategy has been demonstrated by the knockdown of Mageb16. We also suggest that a consequential application of this strategy may significantly accelerate the generation of knowledge required for a stem-cell-based therapy and an effective drug discovery.
Footnotes
Acknowledgments
This work was supported by a grant from the European Community (6th Framework Programme, Thematic Priority: Life sciences, genomics and biotechnology for health, Contract No: FunGenES LSHG-CT-2003-503494). We would like to thank Mr. James Mosedale, Abgent Europe Ltd., for supplying us with Mageb16 polyclonal antibodies (sale order S11072703W).
Author Disclosure Statement
No competing financial interests exist.
References
Supplementary Material
Please find the following supplemental material available below.
For Open Access articles published under a Creative Commons License, all supplemental material carries the same license as the article it is associated with.
For non-Open Access articles published, all supplemental material carries a non-exclusive license, and permission requests for re-use of supplemental material or any part of supplemental material shall be sent directly to the copyright owner as specified in the copyright notice associated with the article.