
Abstract
Cell therapy with adult bone marrow multipotential stromal cells/mesenchymal stem cells (MSCs) presents a promising approach to promote wound healing and tissue regeneration. The strong paracrine capability of various growth factors and cytokines is a key mechanism of MSC-mediated wound healing and tissue regeneration, and the goal of this study is to understand the underlying mechanism that supports the strong paracrine machineries in MSCs. Microarray database analyses revealed that early growth response-1 (EGR1) is highly expressed in MSCs. Our previous studies showed that epidermal growth factor (EGF) treatment induces growth factor production in MSCs in vitro. Since EGF strongly upregulates EGR1, we hypothesized that EGF receptor (EGFR)–EGR1 signaling plays a pivotal role in MSC paracrine activity. EGF treatment upregulated the gene expression of growth factors and cytokines, including EGFR ligands in a protein kinase C (PKC)- and/or mitogen-activated protein kinase–extracellular-signal-regulated kinase-dependent manner, and it was reversed by shRNA against EGR1. PKC activator phorbol 12-myristate 13-acetate enhanced EGFR tyrosyl phosphorylation and upregulated the gene expression of growth factors and cytokines in a heparin-binding EGF-like growth factor (HBEGF) inhibitor CRM197 sensitive manner, indicating an involvement of autocrined HBEGF in the downstream of PKC signaling. Moreover, stimulation with growth factors and cytokines induced the expression of EGFR ligands, presumably via EGR1 upregulation. These data indicate EGR1 as a convergence point of multiple signaling pathways, which in turn augments the production of multiple growth factors and cytokines by enhancing the autocrine signaling with EGFR ligands.
Introduction
C
Initially, MSC differentiation and direct incorporation into local tissues undergoing wound healing and tissue regeneration was regarded as the primary mechanism of MSC action; however, the strong paracrine capability of various growth factors and cytokines secreted by MSCs is now recognized as a key underlying mechanism of MSC-mediated wound healing and tissue regeneration [15]. The conditioned medium of MSCs, which contains these growth factors and cytokines, was shown to exert tissue regenerative effects as well as further support for the importance of this mechanism [16 –19]. This study was aimed to understand the molecular mechanism that supports the strong paracrine machineries in MSCs.
Early growth response-1 (EGR1) encodes a zinc finger transcription factor that exemplifies a group of immediate-early response genes, since a variety of stimulations, including growth factors, cytokines, and even noxious stimuli, rapidly and transiently induce its expression. The induced EGR1 in turn binds to the EGR response element in the promoter regions of growth factors and cytokines and upregulates these genes. Thus, EGR1 may function as a converging point for many signaling pathways [20,21].
Microarray database analyses revealed that EGR1 is highly expressed in MSCs. We and others showed that the treatment with epidermal growth factor (EGF) or transforming growth factor alpha (TGFα), another EGF receptor (EGFR) ligand, induces growth factor production in MSCs in vitro [22 –24]. Moreover, the pretreatment with TGFα was shown to confer additional organ-protective effects on the transplanted MSCs by enhancing paracrine activity of MSCs [25,26]. Since EGF is a strong inducer of EGR1 in MSCs (Fig. 2), we hypothesized that EGFR–EGR1 signaling plays a pivotal role in MSC paracrine activity.
Materials and Methods
Materials
Dulbecco's modified Eagle medium (DMEM) culture medium, cell culture supplements, and all of the reagents for polymerase chain reaction (PCR) were from Life Technologies. Fetal bovine serum (FBS) and Lentivirus Mission® shRNA vectors were from Sigma. All growth factors and cytokines were from Life Technologies or Peprotech. P42/44 mitogen-activated protein kinase–extracellular-signal-regulated kinase (MAPK-ERK) kinase (MEK) inhibitor PD98059 was from EMD Biosciences. Pan protein kinase C (PKC) inhibitor bisindolylmaleimide I (BIM) was from Cayman Chemical. All other reagents were from Sigma or Life Technologies, unless described otherwise.
This study was approved by the IBC committee of the University of Pittsburgh for recombinant DNA research and biohazard agents in obedience to National Institutes of Health Guidelines for Research Involving Recombinant DNA Molecules.
Cell culture
Human telomerase reverse transcriptase—immortalized human bone marrow MSCs were the kind gift of Dr. Junya Toguchida (Kyoto University, Kyoto, Japan) [27], and were cultured in DMEM supplemented with 10% FBS (Atlanta Biological), 2 mM L-glutamine, 1 mM pyruvate, and 100 mM nonessential amino acid. We confirmed the multipotency of the immortalized MSCs into osteogenic, adipogenic, and chondrogenic lineages previously [7,14].
Quantitative reverse transcription-PCR and PCR array
The level of mRNA transcripts was assessed by 2-step quantitative reverse transcription–polymerase chain reaction (qRT-PCR) for both Taqman® PCR (Life Technologies) and Sybr-green-based PCR array (Qiagen). Mx3005P (Stratagene) was used as a quantitative real-time PCR thermal cycler.
For Taqman PCR, total RNA was prepared with TRIzol plus according to the manufacturer's instruction. In brief, after DNase treatment for the removal of possible contaminated genomic DNA, cDNA was synthesized from total RNA with High Capacity RNA-to-DNA kit (Life Technologies) for Taqman PCR. Then, cDNA was mixed with Brilliant III Ultra Fast QPCR Master Mix (Agilent Technologies) and each Taqman gene-specific probe/primers and subjected to the following PCR: 95°C for 3 min, and then 40 cycles of 2-temperature PCR at 95°C for 15 s for denaturing and 60°C for 30 s for annealing and extension.
The Taqman probe/primers (Life Technologies) used in this study are listed in Table 1. Taqman probe/primers for human ribosomal protein, large, P0 (RPLP0) (4333761F) were used as an endogenous invariant control (housekeeping gene) (Life Technologies). All PCR primers were designed to span intron(s) to discriminate cDNA amplicons from genomic amplicons according to the manufacturer. Amplification efficacy of each PCR was assessed initially with serial dilution of control samples; those fell into 95%–105%. Comparative Ct method was utilized to assess the levels of each mRNA transcript relative to that level of RPLP0 mRNA transcript.
The Human Growth Factors RT2 Profiler™ PCR Array (PAHS-041) (Qiagen) was also utilized to profile the expression of 84 genes related to growth factors (Supplementary Table S1; Supplementary information is available online at
Gene knockdown with shRNA
The anti-EGR1 shRNA (TRCN0000273850: CCGGCATCTCTCTGAACAACGAGAACTCGAGTTCTCGTTGTTCAGAGAGATGTTTTTG) and nontarget shRNA control vector (CCGGCAACAAGATGAAGAGCACCAACTCGAGTTGGTGCTCTTCATCTTGTTGTTTTT) were purchased from Sigma-Aldrich. Immortalized MSCs plated on 24-well plate at 4.4×10³ cells were infected with shRNA lentivirus at MOI of 100 in the presence of 8 μg/mL polybrene.
Puromycin-containing selection medium was used after day 3 to isolate the cells stably expressing transfected shRNAs. Lentivirus-mediated nonspecific interferon response was evaluated by IFNr qRT-Primers (Invivogen) and was shown to be minimal (data not shown).
Cell signaling immunoassay
Luminex® xMAP® technology-based MILLIPLEX MAP Cell Signaling MAPmates™ multiplex assay kit (Millipore) was used for intracellular signaling immunoassays. Briefly, cells were lysed on ice in a MILLIPLEX MAP Lysis Buffer containing proteinase and phosphatase inhibitors (Millipore). After removing particulate matter by filtration, lysates were mixed with MILLIPLEX MAP Assay Buffer (Millipore) containing MILLIPLEX MAP capture beads (Millipore) for the target analytes and incubated overnight at 4°C. After removing the supernatant and washing, the beads were incubated with MILLIPLEX MAP Detection Antibodies (Millipore) for 1 h at room temperature in a light-protected condition. After removing supernatant and washing, the beads were re-suspended in MILLIPLEX MAP Assay Buffer (Millipore) and analyzed by Luminex 200™ (Luminex Corp.). Nonstimulated HeLa cell lysate (Millipore) was used as a negative cell lysate control, whereas EGF-stimulated A431 cell lysate (Millipore) was used as a positive cell lysate control.
Quantitation of secreted heparin-binding EGF-like growth factor and IL6
After rinsing with PBS, MSCs were cultured in 0.1% FBS-containing serum-free medium for 24 h during treatment with 10 nM EGF. The conditioned media were collected and the secreted heparin-binding EGF-like growth factor (HBEGF) and interleukin 6 (IL6) were measured by quantitative ELISA kits according to each manufactures' instructions (Siloam Biosciences, Inc.) (RayBiotech, Inc.). The readouts were adjusted per 1×10⁶ cells.
Microarray database analysis
DNA microarray dataset already deposited to the Gene Expression Omnibus (GEO) by Kubo et al. [28] (GSE9451) was used in this study. This dataset was generated from total RNA isolated from human iliac MSCs and human skin and gingival fibroblasts, which were obtained from commercial sources (BioWhittaker, Inc., now Lonza and KURABO) or from patients at Hiroshima University Hospital (Hiroshima, Japan) under the protocol approved by ethical authorities at Hiroshima University [28,29]. The DNA microarray dataset was further analyzed with the online ingenuity pathway analysis software [
According to the GEO database, the microarray dataset was produced by using KURABO GeneChip Custom Analysis Service with Human Genome U133 Plus 2.0 chips (Affymetrix, Inc.) for fibroblasts and MSCs in biological triplicate and deposited to the GEO after normalization by using GeneSpring (Silicon Genetics) [28].
Statistical analysis
All experiments were performed in duplicate or triplicate. Data were analyzed using Student's t-tests. Significance was set at P<0.05 or more stringent as noted in the text and figure legends.
Results
MSCs express EGR1 higher than fibroblasts in microarray database
By using GEO repository, we found that EGR1 expresses higher in MSCs than in fibroblasts in baseline condition in GSE9451 (Fibroblast, 325.5; MSC, 1223.8; P=0.002) [28]. This strong expression of EGR1 also indicates that cultured MSCs are in an activated state, as suggested by Caplan [15].
The encyclopedia of DNA elements (ENCODE) project consortium was launched with the aim to build a comprehensive parts list of functional elements in the human genome [30,31]. In the ENCODE database, EGR1 was shown to bind to the putative promoter regions of various growth factors and cytokines and their cognate receptors, including HBEGF; platelet-derived growth factor alpha (PDGFA); platelet-derived growth factor beta (PDGFB); vascular endothelial growth factor A (VEGFA); IL6; IL11; PDGF receptor, alpha (PDGFRA); PDGF receptor, beta (PDGFRB); met proto-oncogene (MET); IL6 receptor (IL6R); and IL11 receptor alpha (IL11RA) (data not shown).
PKC activator phorbol 12-myristate 13-acetate strongly induces EGR1 and multiple growth factor/cytokine production
One of the upstream signaling pathways strongly inducing EGR1 expression is the PKC pathway [32], which is activated by various growth factors and cytokines [33]. PKC pathway activator phorbol 12-myristate 13-acetate (PMA) upregulated the gene expression of various growth factors/cytokines, including HBEGF and amphiregulin (AREG), which are EGFR ligands (Fig. 1A, C), in addition to EGR1 (Fig. 1B). Besides growth factors and cytokines, PMA treatment also upregulated cognate receptors of these growth factors and cytokines (Fig. 1D, E), indicating the possible presence of autocrine loop(s), possibly via EGR1.

Effects of phorbol 12-myristate 13-acetate (PMA) stimulation on the gene expression in mesenchymal stem cells (MSCs). MSCs were treated with 100 ng/mL PMA for 1 h
EGFR ligand strongly induces EGR1 and upregulates the production of growth factors and cytokines including EGFR ligands
Among the growth factors and cytokines studied in Fig. 1, EGF, PDGF-AA, PDGF-BB, hepatocyte growth factor (HGF), and fibroblast growth factor-2 (FGF2) strongly induced EGR1 expression (Fig. 2A). These data strongly suggest that the PKC-EGR1 pathway is a common signaling pathway activated by multiple growth factors, and the pathway activation in turn upregulates the gene expression of various growth factors and cytokines. Among these growth factors and cytokines, we singled out EGFR ligands, because EGFR ligands are the only ligands that are strongly upregulated along with their cognate receptor EGFR by PMA treatment (Fig. 1) and in turn strongly induced EGR1 in MSCs (Fig. 2A). We initially chose EGF as a representative EGFR ligand, because it is the most-studied one [7,34]. EGF treatment also upregulated multiple growth factors and cytokines in mRNA transcripts (Fig. 2B, C). The EGF-initiated upregulation of growth factors and cytokines was further confirmed in protein levels for HBEGF (5.67±0.24 pg/106 cells under EGF stimulation; 2.03±0.10 pg/106 cells in vehicle control, P<0.005) and IL6 (1.07±0.06 ng/106 cells under EGF stimulation; 0.71±0.02 ng/106 cells in vehicle control, P<0.05) (Fig. 2D, E), as HBEGF is a representative EGFR ligand as well as the key molecule of the EGFR signaling in MSCs in this study, whereas previous publications suggested the critical roles of IL6 in MSC biology [35,36]. We have already published the protein concentrations of VEGF, HGF, and FGF2 in EGF-stimulated MSC supernatants [23]. Interestingly, EGF treatment upregulated other EGFR ligands, HBEGF and AREG (Fig. 2B–D).
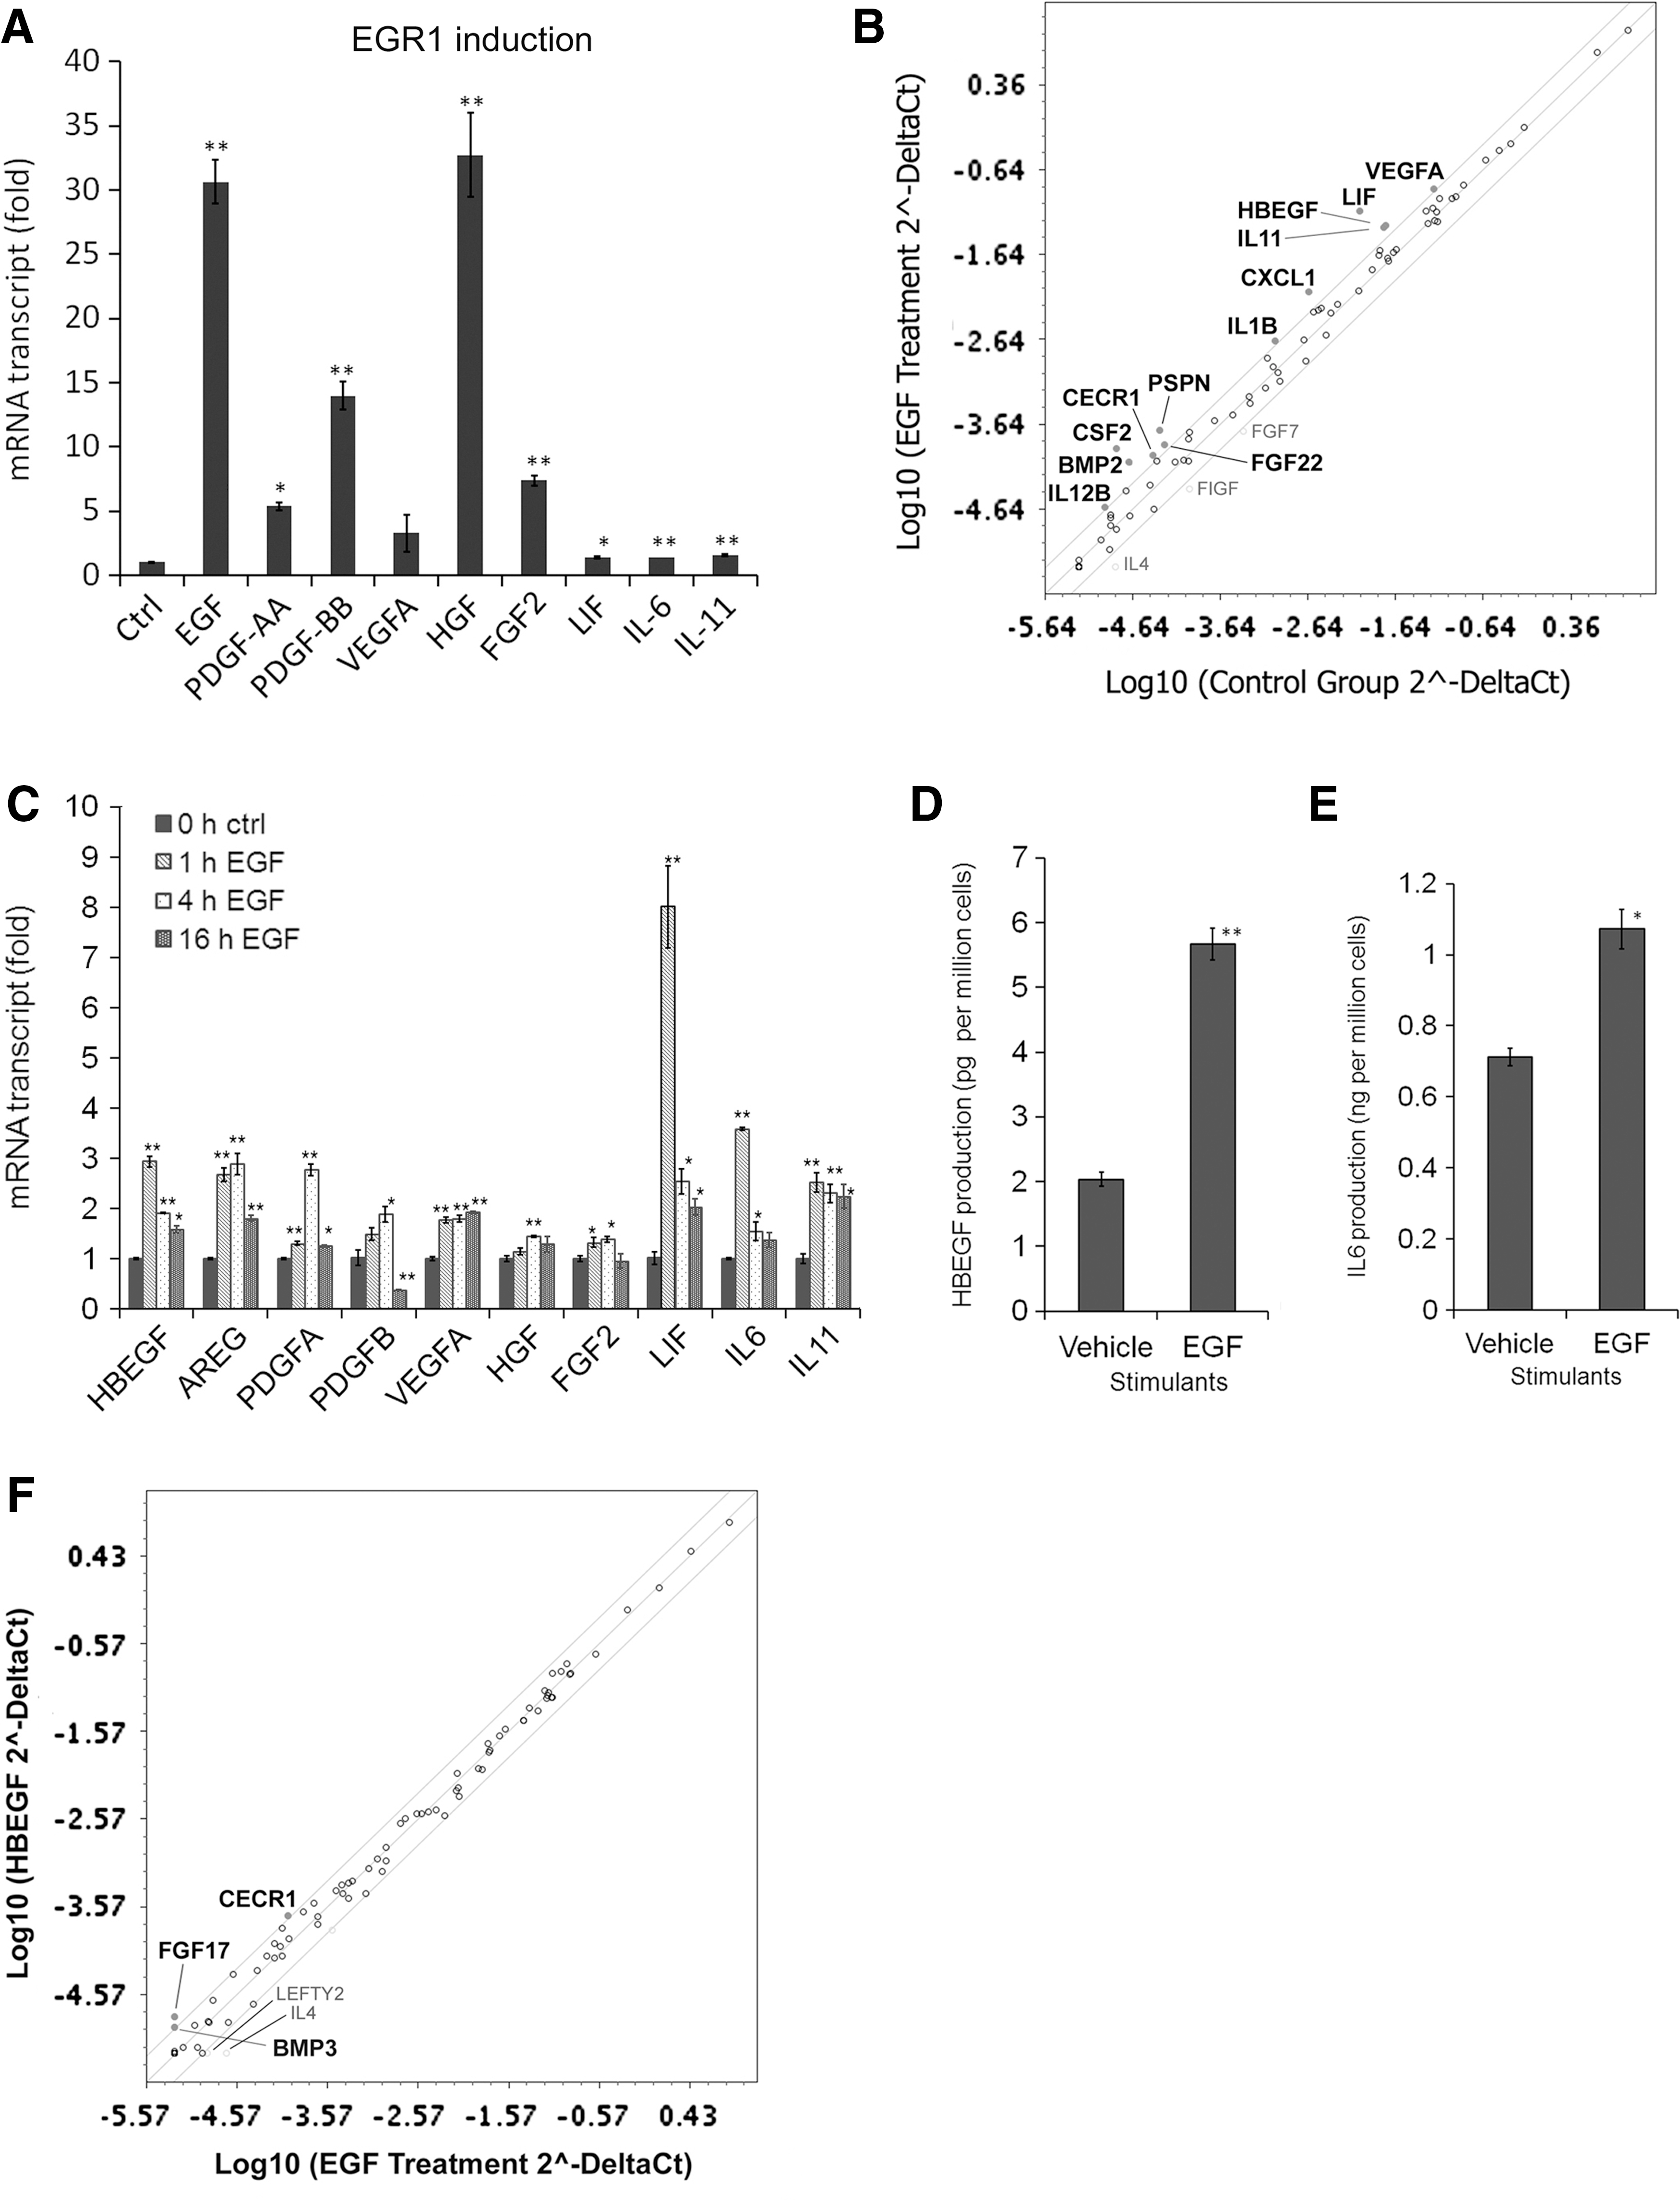
Though HBEGF is known to bind to v-erb-b2 erythroblastic leukemia viral oncogene homolog 4 (ErbB4) in addition to EGFR [37], MSCs express ErbB4 in only trace amounts in the microarray database GSE9451 [28] and ErbB4 protein expression was not observed in human MSCs [38]. Thus, EGFR should be the only functional receptor expressed on MSCs. Indeed, the intracellular signaling elicited by HBEGF stimulation should be similar to that by EGF stimulation, as we showed previously [7]. The gene expression profiles of growth factors and cytokines were also very similar between EGF-stimulated MSCs and HBEGF-stimulated MSCs (Fig. 2F).
Those data are indicative of possible existence of autocrine loops with EGFR ligands via EGR1 in MSCs.
EGF treatment upregulates the gene expression of EGR1, growth factors, and cytokines in a PKC- and/or MAPK-ERK-dependent manner
Next, we investigated the signaling pathways in the downstream of EGFR by using pharmacological inhibitors. Pan PKC inhibitor BIM, as well as MEK inhibitor PD98059, reduced the EGR1 induction by EGF (Fig. 3A). Similarly, the induction of PDGFA, VEGFA, IL6, and IL11 was reduced by BIM as well as by PD98059 (Fig. 3D, F, H, I). The HBEGF induction was reversed by BIM, but not by PD98059 (Fig. 3B), whereas the AREG induction was reversed by PD98059, but not by BIM (Fig. 3C). EGF stimulation activated MAPK-ERK and c-Jun N-terminal kinase (JNK) pathways in the downstream of EGFR tyrosyl phosphorylation in MSCs (Fig. 3J–L). Interestingly, BIM treatment appeared to increase the PDGFB and leukemia inhibitory factor (LIF) expression (Fig. 3E, G), even though the expression of those genes was induced by PKC activator PMA (Fig. 1C). The underlying mechanism remains unclear, but disinhibition of PKC-mediated EGFR signal inhibition by BIM [39,40] might induce the enhancement of EGFR downstream signaling (Fig. 3J–L) and cause this paradoxical increase of PDGFB and LIF expression (Fig. 3E, G).

Effects of pan protein kinase C (PKC) inhibitor bisindolylmaleimide I (BIM) and mitogen-activated protein kinase–extracellular-signal-regulated kinase (MAPK-ERK) kinase (MEK) inhibitor PD98059 on the gene expression of EGR1
EGR1 knockdown decreases the gene expression of growth factors and cytokines in baseline as well as under stimulation with EGF and PMA
Next, we evaluated the role of EGR1 on the production of growth factors and cytokines by knocking down EGR1 with shRNA against EGR1 (shEGR1). EGR1 knockdown reduced the gene expression of HBEGF, AREG, PDGFA, PDGFB, LIF, and IL11 upregulated by EGF as well as PMA (Fig. 4), confirming the crucial role of EGR1 in the production of these growth factors and cytokines.
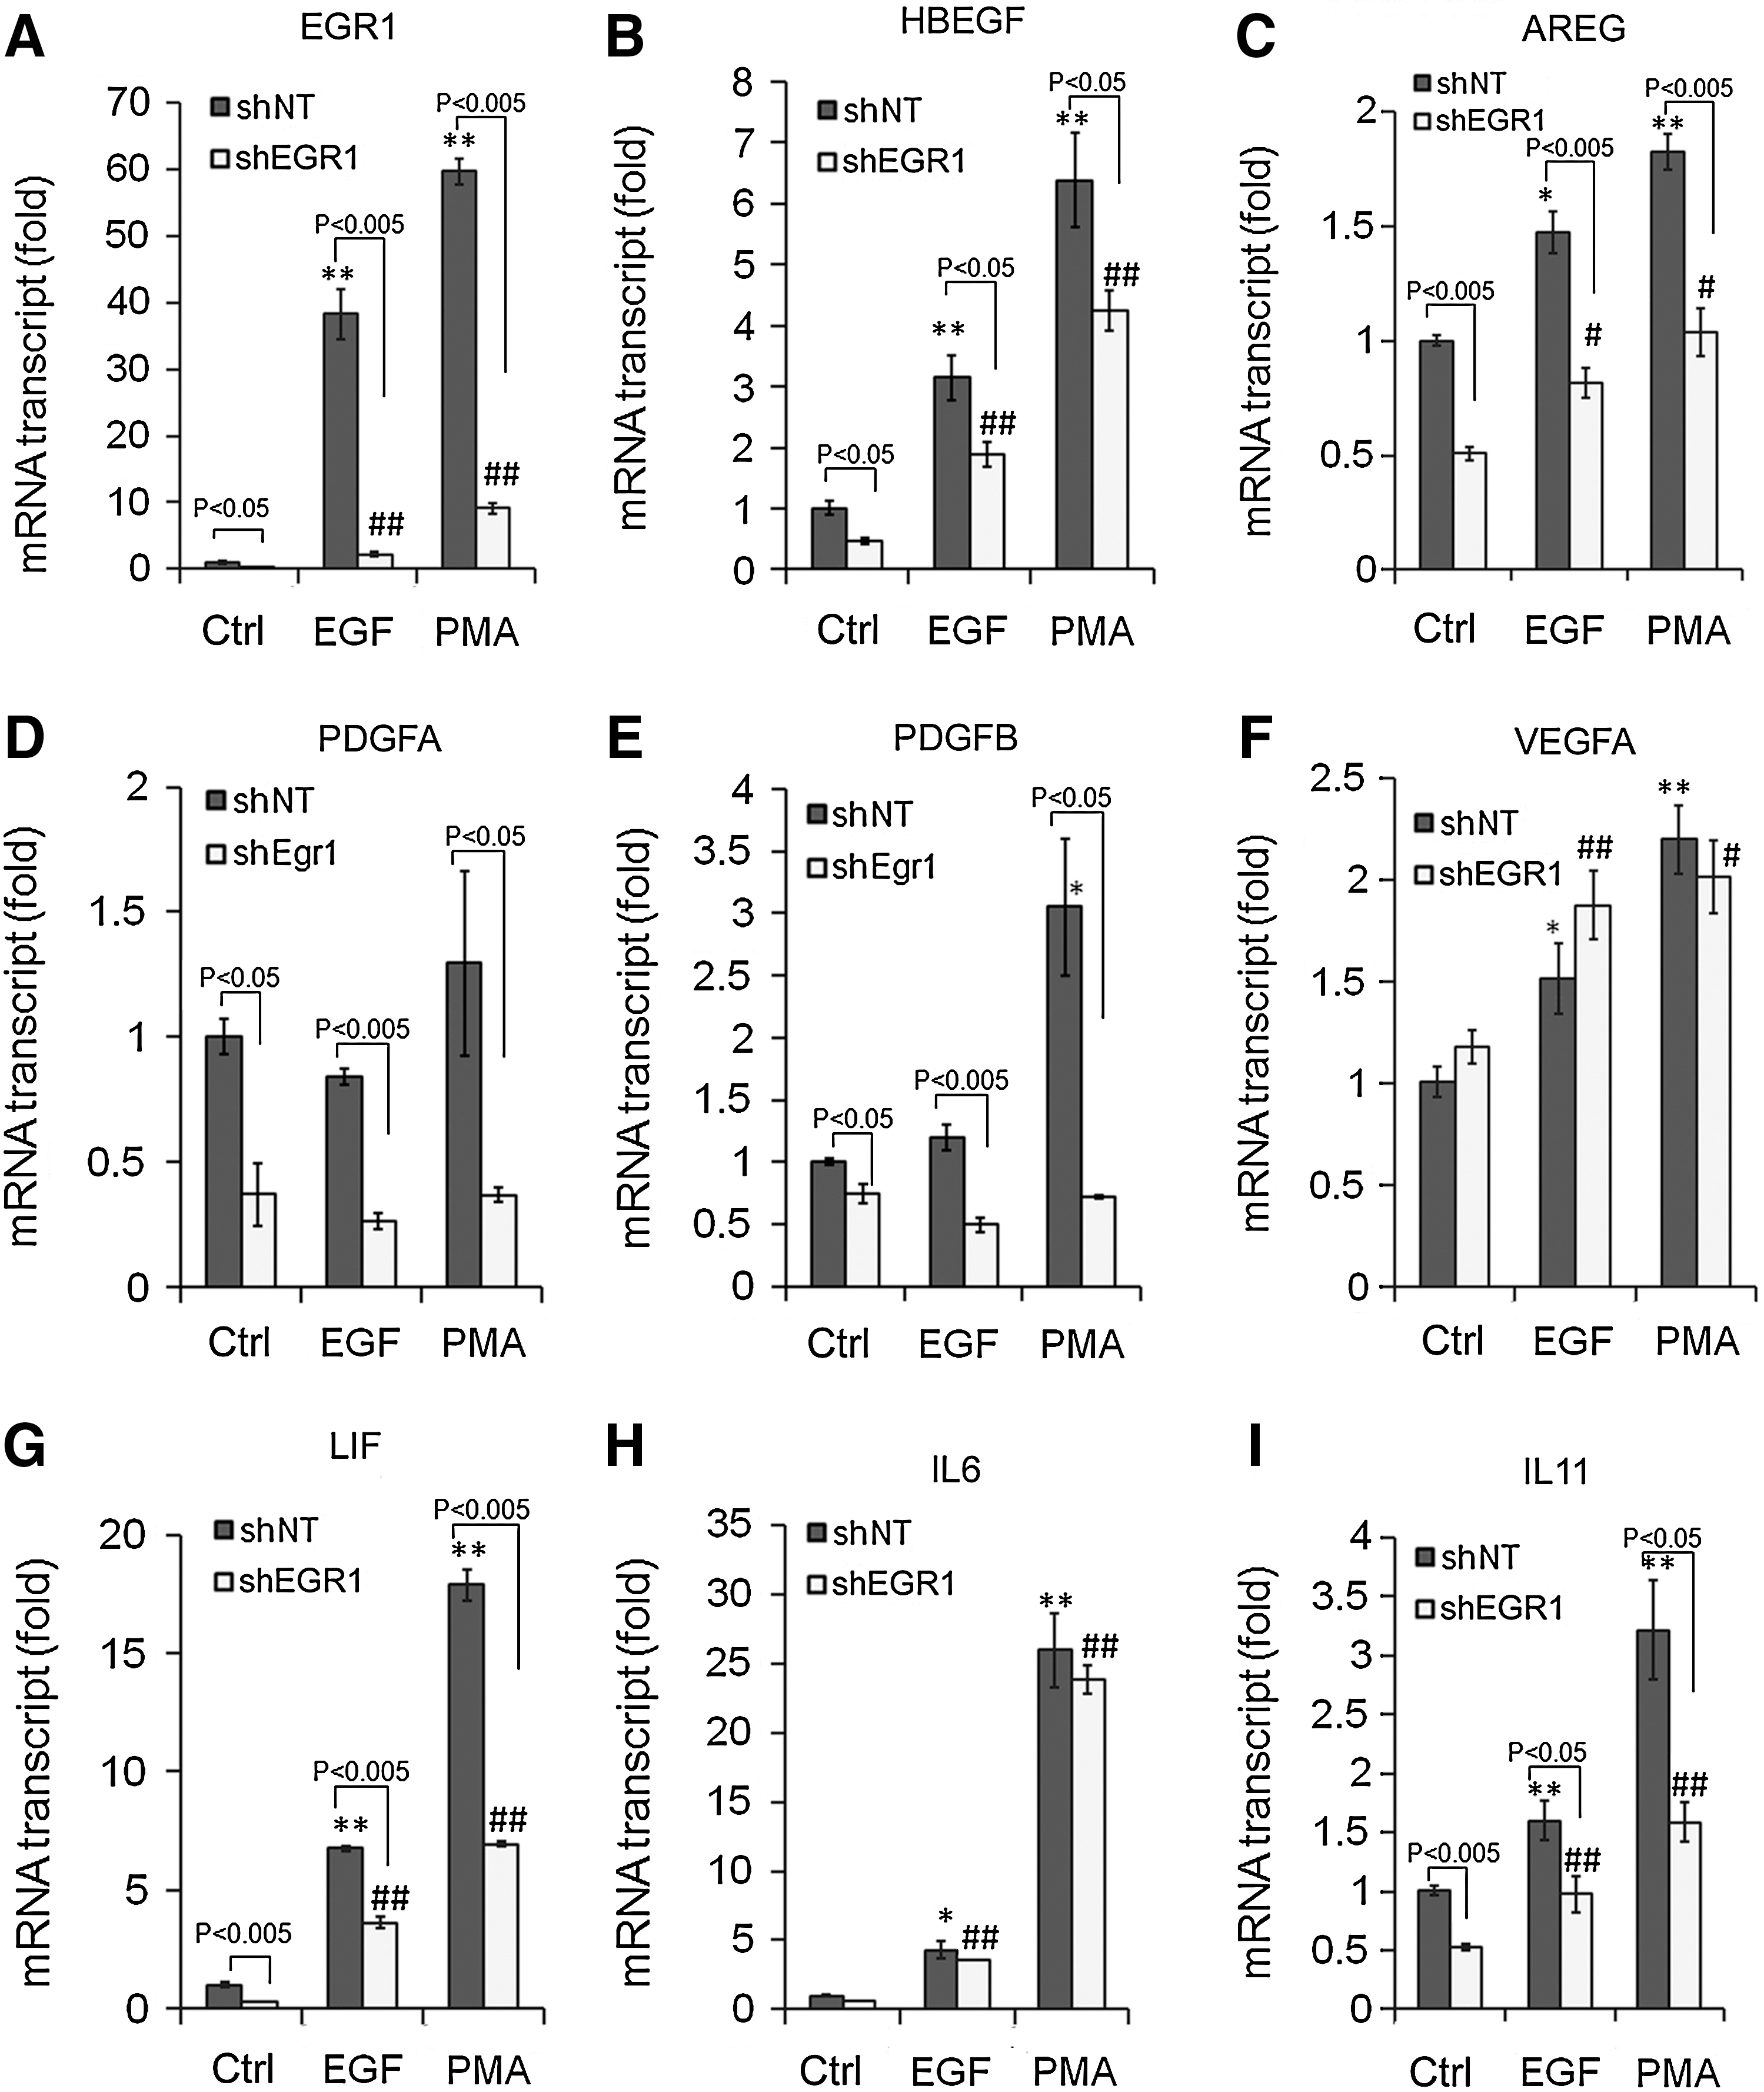
Effects of shRNA against Egr1 (shEGR1) on the gene expression of EGR1
HBEGF inhibitor CRM197 decreases the gene expression of growth factors and cytokines under PMA stimulation
There are several EGFR ligands expressed in MSCs; among them, HBEGF is the most abundantly expressed. Here, we evaluated the roles of HBEGF on the production of growth factors and cytokines.
If HBEGF expressed in MSCs plays any role in the production of growth factors and cytokines, then HBEGF inhibitor CRM197 [41] should alter the production of growth factors and cytokines even without exogenous HBEGF administration to MSCs. Indeed, CRM197 treatment decreased the production of HBEGF, AREG, VEGFA, LIF, and IL11 upregulated by PMA (Fig. 5B–I). PMA treatment caused EGFR tyrosyl phosphorylation, which was inhibited by CRM197 treatment at the 3 h time point (Fig. 5A). These data suggest that HBEGF produced and secreted by PMA-stimulated MSCs binds to EGFR and activates the EGFR signaling in an autocrine manner, and this EGFR signaling in turn upregulates the production of other growth factors and cytokines.
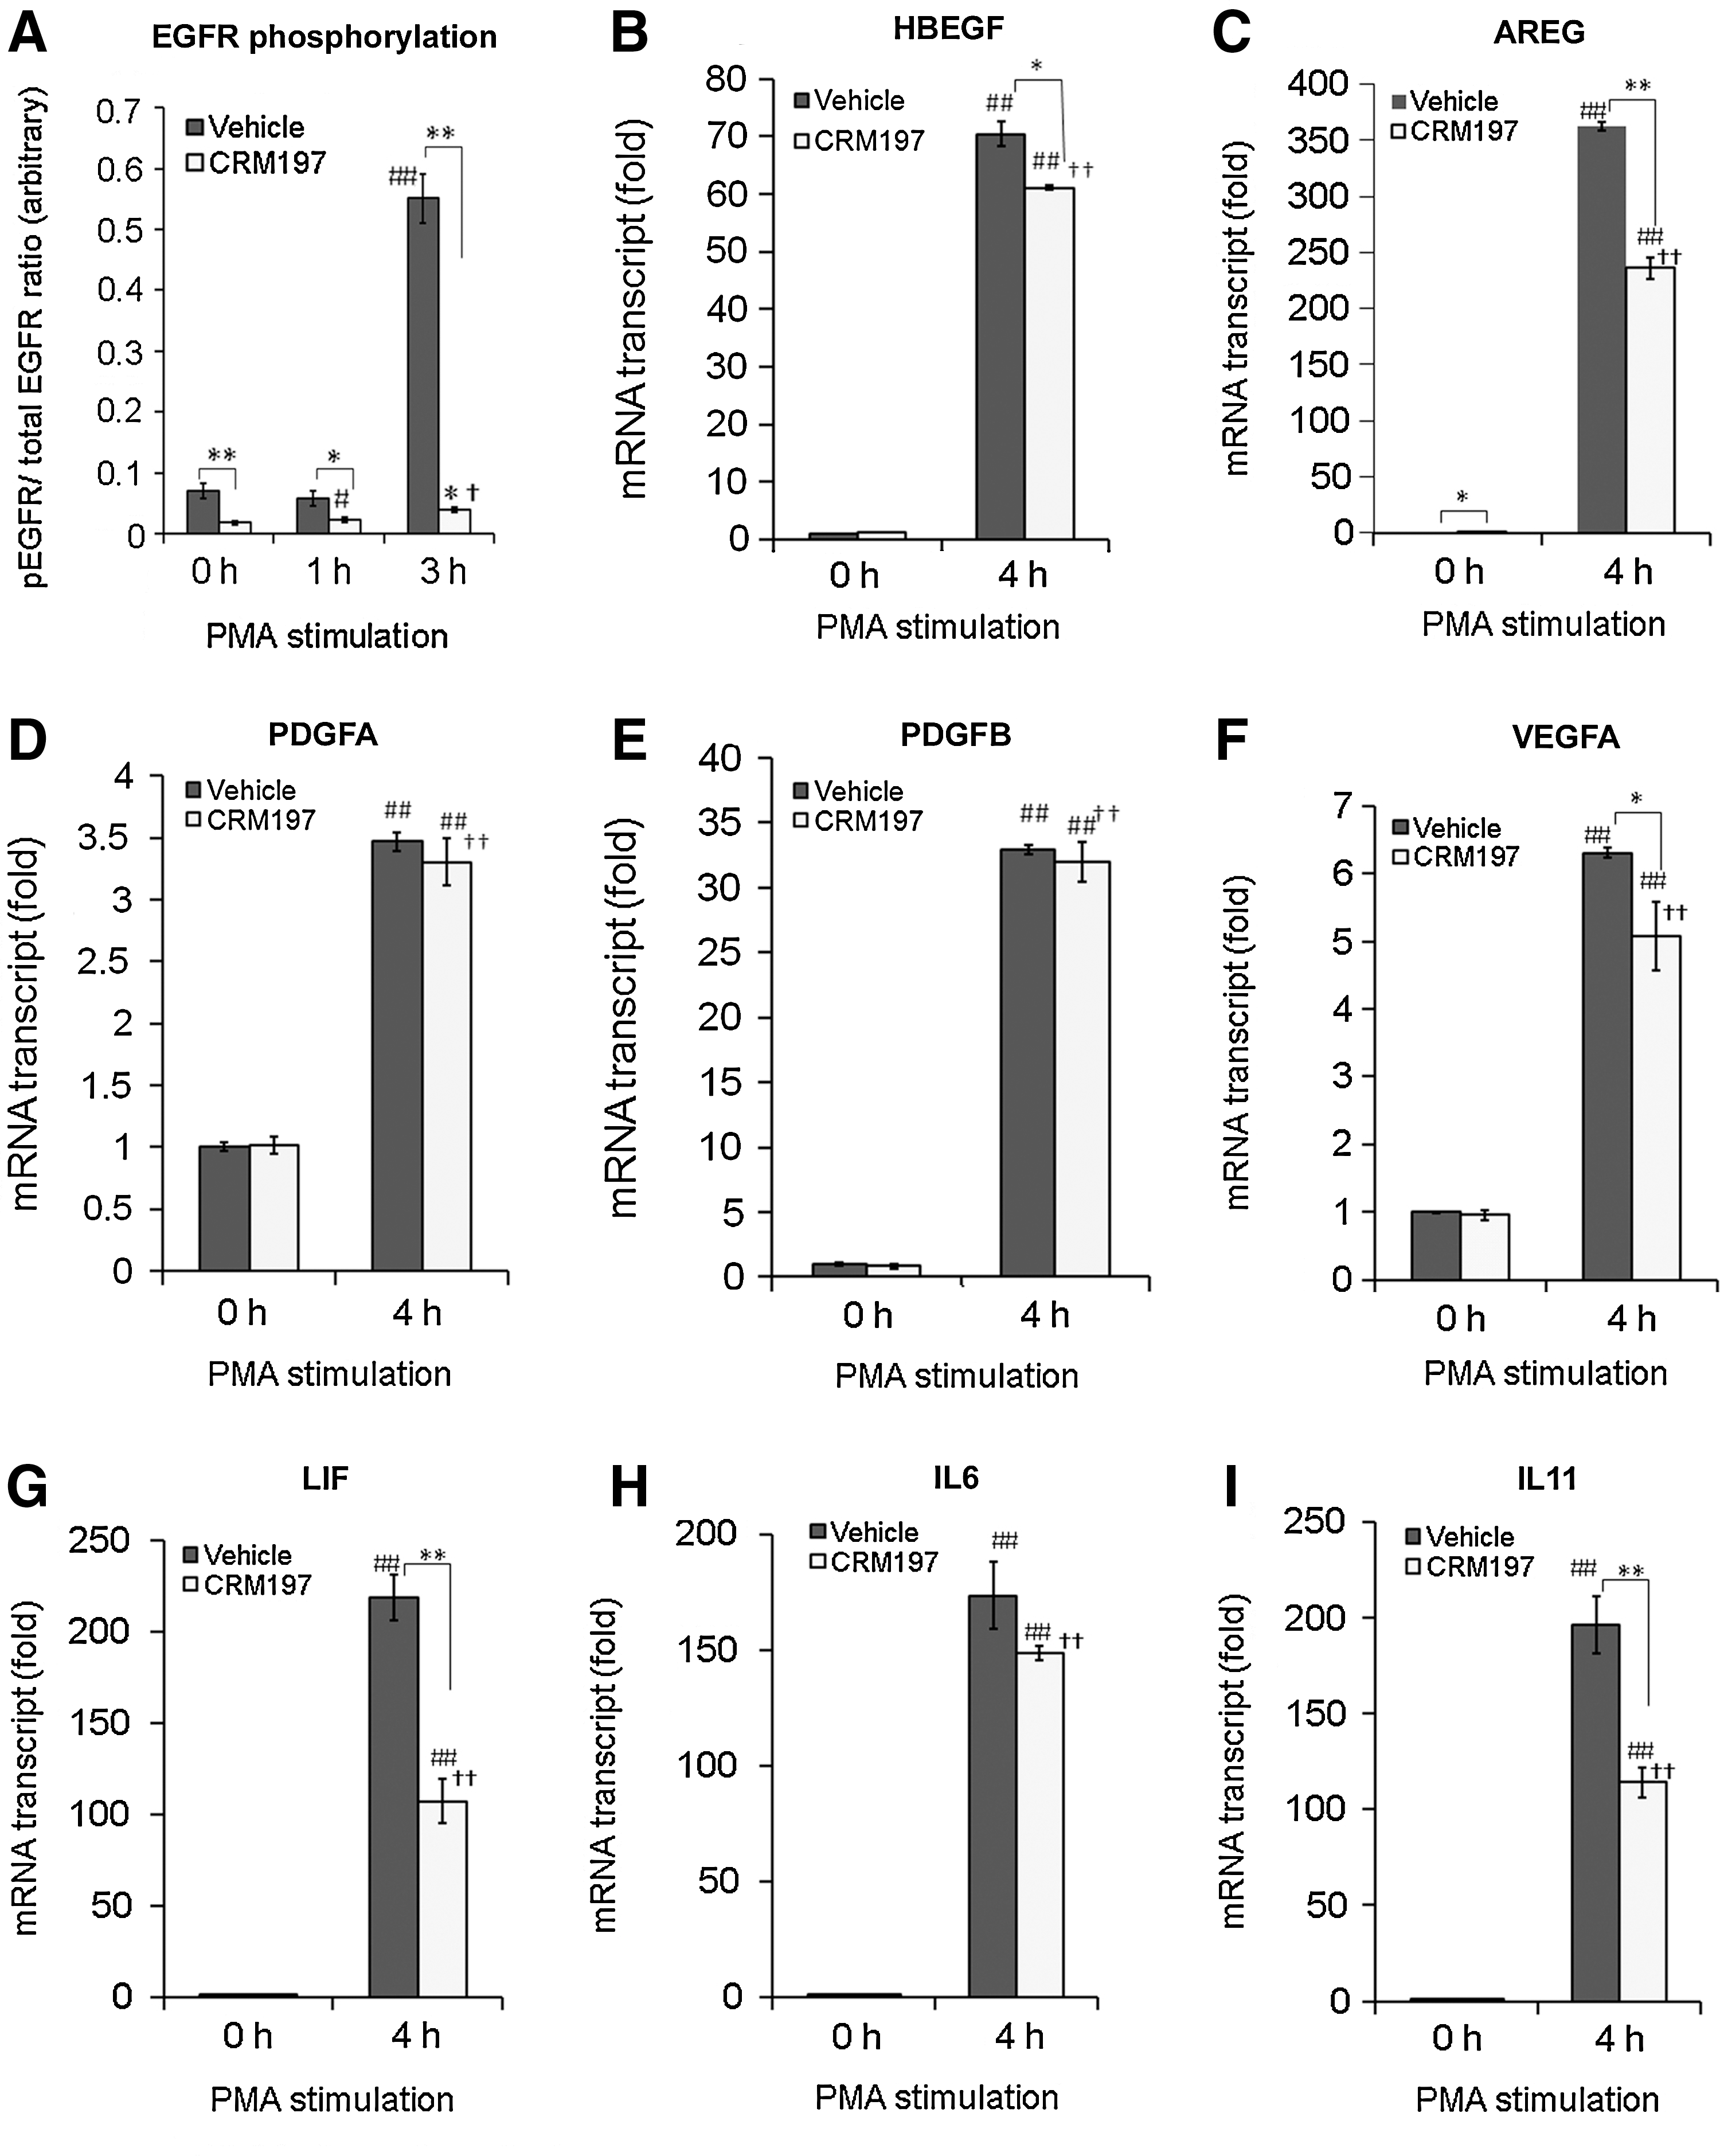
Effect of HBEGF inhibitor CRM197 on the PMA-induced EGFR phosphorylation
Stimulation with growth factors and cytokines upregulates HBEGF and AREG
Lastly, we evaluated the gene induction of HBEGF and AREG by other growth factors and cytokines, because multiple growth factors and cytokines upregulated EGR1 expression (Fig. 2A), and the gene expression of HBEGF and AREG is EGR1-dependent (Fig. 4B, C). As expected, the gene expression of HBEGF and AREG was also upregulated by EGF, PDGF-BB, HGF, and FGF2 (Fig. 6), in a similar way that these molecules upregulated EGR1 expression. These results further suggest that the downstream signaling from various growth factors and cytokines converges on EGR1, which in turn enhances the possible autocrine loop of EGFR through upregulation of HBEGF and AREG (Fig. 7).

Effect of MSC treatment with various growth factors and cytokines on the gene expression of HBEGF and amphiregulin (AREG). MSCs were stimulated with EGF (10 nM), platelet-derived growth factor-AA (PDGF-AA) (30 ng/mL), PDGF-BB (30 ng/mL), VEGFA (100 ng/mL), HGF(50 ng/mL), FGF2 (30 ng/mL), LIF (10 ng/mL), IL6 (10 ng/mL), and IL11 (10 ng/mL) for 1 h, and the total RNA was harvested for gene expression analysis by qRT-PCR with Taqman primers (*P<0.05, **P<0.005 to HBEGF in control; # P<0.05, ## P<0.005 to AREG in control).

Simplified diagram of autocrine loop with EGFR ligands and select growth factors and cytokines in MSCs.
Discussion
Because paracrine signaling is accepted as one of the primary mechanisms for MSC-based wound healing and tissue regeneration [42], understanding the molecular mechanism behind the signaling is important in order to maximize the wound healing and tissue regenerating potential of MSCs. Such knowledge should also help to develop serum-free culture media for in vitro MSC expansion without compromising or even with enhancing paracrine capability [43]. In this study, we indicate the possible existence of an autocrine loop with EGFR in MSCs, and this autocrine loop is most likely mediated by EGFR ligands HBEGF and AREG, which activate the MAPK-ERK, JNK, and/or PKC pathways followed by induction of the EGR1 transcription factor. The activation of this autocrine loop also upregulates the production of other growth factors and cytokines, which further augments the EGFR autocrine loop through induction of EGR1 (Fig. 7). These signaling mechanisms possibly contribute to the strong paracrine machinery of MSCs, and EGR1 would be a converging point of these signaling pathways (Fig. 7).
MAPKs, phospholipase γ and PKCs, phosphatidylinositol 3-kinases, and signal transducers and activators of transcription are the major signaling molecules known to mediate the intracellular signaling from EGFR [34,44]. Among them, the MAPK-ERK pathway is well known to strongly upregulate EGR1 expression via Elk1 [21] and p90 ribosomal S6 kinase-CAMP responsive element binding protein 1 [45]. Other MAPK pathways, such as the JNK or p38 MAPK pathway, are also known to induce EGR1 expression as well [21]. The PKC pathway is also known to upregulate EGR1 expression through activation of the MAPK-ERK, JNK, and p38 MAPK pathways via Raf [21,32,33].
The MAPK-ERK-EGR1 pathway seems to be responsible for the EGF-initiated upregulation of AREG, LIF, and IL11 (Figs. 3 and 4). Although the induction of VEGFA and IL6 was reversed by MAPK-ERK pathway inhibitor PD98059 (Fig. 3), it was not reversed by shEGR1 (Fig. 4), suggesting that the upregulation of VEGFA and IL6 is EGR1 independent. There are other immediate-early response genes such as c-fos activated in the downstream of MAPK-ERK. EGF stimulation also upregulates EGR2 and EGR3, in addition to EGR1 in MSCs (data not shown). These molecules might be responsible for the induction of VEGFA and IL6 in the downstream of EGFR; however, it is beyond the scope of the current study.
The EGF-initiated upregulation of HBEGF and PDGFB was reversed by shRNA against EGR1 (Fig. 4), but not by PD98059 (Fig. 3), suggesting that the MAPK-ERK pathway might not play a significant role in the upregulation of HBEGF and PDGFB. Similarly, the EGF-initiated upregulation of PDGFA was reversed by shRNA against EGR1 (Fig. 4), but the contribution of MAPK-ERK appears minimal (Fig. 3). JNK might possibly link EGFR to the upregulation of HBEGF, PDGFA, and PDGFB, because the JNK pathway is also activated in the downstream of EGFR (Fig. 3), and it could induce EGR1 via Elk1 as well [21].
Although PKC activator PMA clearly upregulated HBEGF, AREG, PDGFA, PDGFB, VEGFA, LIF, IL6, and IL11 (Fig. 1), pan PKC inhibitor BIM did not reverse the EGF-initiated upregulation of AREG, PDGFB, and LIF (Fig. 3), despite PKC being one of the main signaling pathways in the downstream of EGFR [34,44]. Moreover, pan PKC inhibitor BIM tended to augment the phosphorylation of MAPK-ERK and JNK (Fig. 3K–M), even though the PKC pathway is located in the upstream of these MAPKs [32,33]. The apparent reason for this paradoxical enhancement is unclear, but one explanation is the possible enhancement of EGFR signaling by BIM, which leads to the overall augmentation of EGFR downstream signaling including MAPK-ERK and JNK pathways. In agreement with our data (Fig. 3) and speculation, PKC-mediated downregulation of EGFR signaling has been reported [39,40].
Still, PMA stimulation caused EGFR tyrosyl phosphorylation at the 3 h time point, most likely via autocrined HBEGF produced in the downstream of the PKC pathway (Fig. 5A). We speculate that the PKC-mediated EGFR inhibition would decrease within 3 h, allowing the secreted HBEGF to activate EGFR signaling.
MSCs are known to support hematopoiesis in the bone marrow through production of hematopoietic cytokines, such as granulocyte colony-stimulating factor (G-CSF) or IL6 [46]. Since EGF treatment induces the expression of G-CSF (data not shown) and IL6 in MSCs, EGFR signaling might also play a positive role in MSC-mediated support of hematopoiesis in the bone marrow.
In summary, EGFR signaling upregulates multiple growth factors/cytokines, including HBEGF and AREG, through induction of EGR1, and PKC and/or MAPK-ERK pathways relay most of the signaling. Stimulation with growth factors and cytokines in turn upregulates EGR1, which in turn upregulates HBEGF and AREG. These data indicate the possible presence of autocrine signaling with EGFR and EGFR ligands, and this autocrine loop is further augmented by stimulation with other growth factors and cytokines through EGR1.
Footnotes
Acknowledgments
This work was supported by American Heart Association grant 09BGIA2050227 to K.T. We would like to thank Dr. Junya Toguchida (Kyoto University, Kyoto, Japan) for kindly providing the immortalized human MSCs and Dr. Alan Wells (University of Pittsburgh) for critical insights and discussions.
Author Disclosure Statement
No competing financial interests exist.
References
Supplementary Material
Please find the following supplemental material available below.
For Open Access articles published under a Creative Commons License, all supplemental material carries the same license as the article it is associated with.
For non-Open Access articles published, all supplemental material carries a non-exclusive license, and permission requests for re-use of supplemental material or any part of supplemental material shall be sent directly to the copyright owner as specified in the copyright notice associated with the article.