
Abstract
The mammalian target of the rapamycin (mTOR) signaling pathway functions in many cellular processes, including cell growth, proliferation, differentiation, and survival. Recent advances have demonstrated that differentiated somatic cells can be directly reprogrammed into the pluripotent state by overexpression of several pluripotency transcription factors. However, whether the mTOR signaling pathway is involved in this somatic cell-reprogramming process remains unknown. Here, we provide evidence that an elaborate regulation of the mTOR activity is required for the successful reprogramming of somatic cells to pluripotency. The reprogramming of somatic cells collected from the Tsc2−/−
embryo, in which the mTOR activity is hyperactivated, is entirely inhibited. By taking advantage of the secondary inducible pluripotent stem
Introduction
I
The important mammalian target of the rapamycin (mTOR) signaling pathway is recognized as a key component of a nutrient and energy effector pathway that converts signals from activated growth factor receptors into downstream events that affect cell proliferation, growth, and death [12,13]. The atypical serine/threonine kinase mTOR is present in 2 distinct complexes. The mTOR complex 1 (mTORC1) is composed of mTOR, Raptor, and mLST8. Earlier studies demonstrated that rapamycin interacts with the immunophilin FKBP12, which binds to mTORC1 and inhibits its ability to phosphorylate downstream substrates [14,15]; 2 of these substrates are the p70 s6 kinase 1 (p70S6K1) and the eukaryotic initiation factor 4E (eIF4E)- binding protein 1 (4E-BP1) [16 –21]. The 40S ribosomal protein S6 is phosphorylated by p70S6K1, which is proposed to also be involved in the translation of 5′-terminal oligopyrimidine tract mRNAs [22,23]. The phosphorylation of 4E-BP1 disrupts its binding to eIF4E, and the released eIF4E enhances translation through the formation of a functional translation initiation complex [24,25]. Ras homolog enriched in brain (Rheb) in the active GTP-bound state either acts directly on mTOR or influences mTOR signaling downstream of p70S6K1 and 4E-BP1 [26]. Additionally, the tumor suppressor complex associated with the autosomal-dominant genetic disorder tuberous sclerosis complex, TSC1 and TSC2, suppresses the mTOR signaling pathway by driving Rheb into the inactive guanosine diphosphate (GDP) state [27 –29]. The mTOR complex 2 (mTORC2) is composed of mTOR, Rictor, GβL, and Sin1 and promotes cellular survival by activating Akt [30,31]. In the PI3K/Akt/mTOR pathway, Akt is downstream of the phosphatase and tensin homolog, and upstream of the TSC1/TSC2 heterodimer [29,32,33]. Deletion of TSC1/TSC2 leads to reduced Akt activation and hyperactivation of mTOR, which is partially due to reduced the platelet-derived growth factor (PDGFR) expression [34].
An essential role of mTOR in regulating the long-term undifferentiated growth of human embryonic stem cells (hESCs) was recently discovered [35]. A study showed that mTOR activation is more restricted in hESCs than it is in differentiated fibroblast-like cells, and that activation of the mTOR downstream factor p70 S6K induces the differentiation of hESCs, which suggests that hESCs tightly regulate mTOR signaling-mediated protein translation to maintain a pluripotent state [36]. Similarly, previous studies have shown that mTOR is necessary for growth and proliferation in early mouse embryos and ES cells, and that disruption of the mouse mTOR gene prohibits ES cell development [37,38]. Moreover, mTOR has emerged as a critical effector of the cell signaling pathways that are commonly deregulated in human cancers [39]. The hyperactivation of the mTOR activity in cells may lead to the upregulation of p53 and to cell senescence [33]. It has been recently shown that the p53 signaling pathway plays a critical role in somatic cell reprogramming [40 –44]. The upregulation of p53 expression, which leads to cell proliferation defects (senescence) and impairs somatic cell reprogramming, was observed in somatic cells when 4 transcription factors were ectopically expressed. Subsequently, the downregulation of p53 expression in somatic cells could dramatically increase the efficiency of iPSC generation. Therefore, it has been suggested that the acquisition of immortality is a crucial step toward the establishment of pluripotency in somatic cells [44]. Although the p53 pathway has been recognized as a major player in somatic cell reprogramming, it remains to be discovered if the mTOR signaling pathway also functions in somatic cell reprogramming. A recent study has suggested that the mTOR pathway might be involved in transcription-factor-induced somatic cell reprogramming [45,46].
In this study, we used several different strategies to investigate the role of mTOR in somatic cell reprogramming. Our results indicate that for successful reprogramming, the mTOR activity must be elaborately regulated during the reprogramming process.
Materials and Methods
Mice and cell cultures
The specific pathogen-free (SPF) mice were housed in the animal facility of the National Institute of Biological Sciences, Beijing. All of our study procedures were consistent with the National Institute of Biological Sciences Guide for the care and use of laboratory animals.
Mouse embryonic fibroblast (MEF) cells were derived from 13.5 day post coitum (dpc) embryos. The 129-rtTA MEF cells were derived from the embryos of female 129/Sv mice that had been mated with Rosa26-M2rtTA mice [47]. Similarly, OG2-rtTA MEF cells were derived from the embryos of female OG2 mice [48] that had been mated with Rosa26-M2rtTA mice. The 129-rtTA-iPS mice MEF cells, adult tail tip fibroblast (TTF) cells, and OG2-rtTA-iPS mice MEF cells were derived from iPS mice that were produced from 129-rtTA iPS and OG2-rtTA iPSCs through tetraploid complementation as previously described [9]. Tsc2−/− MEF cells and their revertant cells were produced according to a previously published protocol [33,49,50].
R1 ES cells and all iPSC lines were cultured on mitomycin C-treated MEF cells in an ES medium containing DMEM (Gibco Invitrogen) supplemented with 15% (v/v) fetal bovine serum, 1 mM
Plasmid construction and iPSC generation
LV-tetO-Oct4, Sox2, Klf4, and c-Myc vectors were generously provided by Dr. Rudolf Jaenisch's laboratory at the Whitehead Institute for Biomedical Research. For first-round iPS induction, 293T cells were transfected with the LV-tetO-Oct4, Sox2, Klf4, and c-Myc vectors or an additional rtTA-M2 vector (Addgene) in specific groups together with the packaging plasmids psPAX2 and pMD2.G using the Vigofect reagent (Vigorous Biotechnology). The medium was replaced 12 h after transfection, and the virus supernatants were harvested after an additional 36 h. MEF cells at passage 2 or 3 were incubated at a cell density of 1×10⁵ cells/dish in 60-mm dishes with filtrated viral supernatants containing 5 μg/mL polybrene. The infection medium was replaced after 12 h with the ES medium supplemented with 1 μg/mL doxycycline. In certain experimental groups, the ES medium was supplemented with 5 μM rapamycin or 50 μg/mL vitamin C (Vc). In the Tsc2-knockdown experiment, 293T cells were transfected with either the pSicoR-RFP control vector or with the Tsc2 shRNA together with packaging plasmids psPAX2 and pMD2.G; the virus produced was used to infect the MEF cells by the procedure described above. For secondary iPS induction, the 129-rtTA-iPS mouse-derived MEFs or the OG2-rtTA-iPS mouse-derived MEFs were induced to form secondary iPSCs in the ES medium supplemented with 1 μg/mL doxycycline.
shRNA vector design
Following the Jackson Lab protocol, we constructed the knockdown vector that targets the Tsc2 gene with the targeting sequence GGTGTCATATGAGATTGTTCT [51]. Primers (5′-TGGTGTCATATGAGATTGTTCTTTCAAGAGAAGAACAATCTCATATGACACCTTTTTTC-3′ and 5′-TCGAGAAAAAAGGTGTCATATGAGATTGTTCTTCTCTTGAAAGAA CAATCTCATATGACACCA-3′) were designed for cloning into the pSicoR vector, which also expresses red fluorescent protein (RFP) under the control of the cytomegalovirus promoter. Primers were annealed and cloned under the control of the U6 promoter in the reconstructive pSicoR-RFP vector.
Alkaline phosphatase staining, immunostaining, and cell sorting
After viral transduction, the MEF cells were cultured in the ES culture medium containing doxycycline for 12 days. Then, the medium was gently aspirated, and the cells were rinsed with 0.25 mL of phosphate-buffered saline (PBS). Alkaline phosphatase (AP) staining was performed with the Alkaline Phosphatase Detection Kit (Millipore) in accordance with the manufacturer's recommendations.
For SSEA-1 immunostaining and cell sorting, trypsinized cells were washed with fluorescence-activated cell sorting buffer (2% FBS in PBS), incubated on ice for 30 min, and stained with Alexa Fluor 647-conjugated anti-mouse/human SSEA-1 antibody (eBioscience). SSEA-1-positive cells were sorted using a MoFlo XDP (Beckman Coulter) cell sorter.
Western blotting
Cells were harvested using trypsin/ethylenediaminetetraacetic acid (EDTA) and lysed in the sodium dodecyl sulfate (SDS) lysis buffer (50 mM Tris-HCl, pH 7.5; 150 mM KCl; 1% Triton X-100; 0.1% SDS; 1 mM EDTA) containing a protease inhibitor cocktail (Roche Diagnostics) and 1 mM dithiothreitol (Bio Basic, Inc.). Lysates containing the equivalent of 1×10⁵ cells per lane were separated using SDS-PAGE (10% polyacrylamide gel), and the proteins were transferred onto polyvinylidene difluoride membranes. The membranes were blocked for 1 h with a 5% fat-free milk solution. The samples were probed with antibodies against p-S6 and S6 at a 1:3,000 dilution and an anti-Akt1/2 antibody (1:1,000 dilution, catalog no. sc-1619; Santa Cruz Biotechnology), anti-phospho-Akt antibody (1:500 dilution, catalog no. AF887; R&D Systems), anti-p21 antibody (1:1,000 dilution, catalog no. sc-397, Santa Cruz Biotechnology), anti-TSC2 antibody (1:1,000 dilution, catalog no. sc-893; Santa Cruz Biotechnology), and anti-tubulin antibody (1:2,000 dilution, catalog no. T6199, Sigma-Aldrich), and incubated at 4°C overnight. Antibody binding was detected with either an ECL™ peroxidase-labeled anti-mouse antibody (1:10,000 dilution, catalog no. NA934VS; Amersham Biosciences) or an ECL peroxidase-labeled anti-rabbit secondary antibody (1:10,000 dilution, catalog no. NA931VS, Amersham Biosciences). For detecting p53 expression, the samples were probed with HRP-conjugated p53 antibody (1:5,000 dilution, kindly provided by Dr. Xiaodong Wang from National Institute of Biological Sciences, Beijing) for 2 h at room temperature. Antibody binding was then visualized with an eECL Western Blot Kit (CWBIO). The anti-p-S6 (Ser235/236) and anti-S6 antibodies were used as described previously [34]. To quantify western blot results, we used the Gel Analysis method in ImageJ from the National Institutes of Health, from which we obtained the absolute intensity values for each sample. To calculate a relative intensity, we used Tubulin as the endogenous control. We then divided the absolute intensity of each sample band by the absolute intensity of Tubulin to obtain a relative intensity for each sample band.
BrdU incorporation and flow cytometry analysis
Bromodeoxyuridine incorporation analysis was performed with the FITC BrdU Flow Kit (BD PharMingen) in accordance with the manufacturer's recommendations. At least 10,000 events were analyzed using the MoFlo XDP (Beckman Coulter) cell sorter.
Cell death assay
Cells were collected with 0.25% trypsin without EDTA and washed with cold PBS once. Then, 70% ethanol was used to fix the cells at 4°C for 3–4 h. The fixed cells were washed with PBS once and then treated with 10 μg/mL RNaseA in a 37°C water bath for 30 min. Propidium iodide (PI) staining was then performed with 5 μg/mL PI (P4170; Sigma-Aldrich) at 4°C for 30 min. At least 10,000 events were analyzed using the MoFlo XDP (Beckman Coulter) cell sorter.
Polymerase chain reaction analysis
For the real-time polymerase chain reaction (PCR) and reverse transcription-PCR analyses, RNA was extracted from MEF cells, cells undergoing reprogramming, and iPSCs and R1 ES cells using the TRIzol reagent (Invitrogen), and the RNA was reverse transcribed using a reverse transcription system (Promega) in accordance with the manufacturer's recommendations. Semi-quantitative real-time PCR was performed using a SYBR Green-based PCR Master Mix (ABI) with published primers [1]. The primers used for detecting the expression of exogenous factors were as follows: Oct4-F, 5′-AGTATTGAGTATTCCCAACGAG-3′; Sox2-F, 5′-CATGACCAGCTCGCAGAC-3′; Klf4-F, 5′-GAACTGACCAGGCACTACCG-3′; c-Myc-F, 5′-ACGACAAGAGGCGGACAC-3′; and WPRE-R, 5′-AGCGTATCCACATAGCGTAA-3′. The primers used for detecting the endogenous gene expression were as follows: Oct4-endo-F, 5'-TCTTTCCACCAGGCCCCCGGCTC-3'; Oct4-endo-R, 5'-TGCGGGCGGACATGGGGAGATCC-3'; Sox2-endo-F, 5'-TAGAGCTAGACTCCGGGCGATGA-3'; Sox2-endo-R, 5'-TTGCCTTAAACAAGACCACGAAA-3'; Nanog-F, 5'-AGGGTCTGCTACTGAGATGCTCTG-3'; Nanog-R, 5'-CAACCACTGGTTTTTCTGCCACCG-3'. The primers used for analyzing Tsc2 gene expression were as follows: F, 5′-GAGCTGATTAACTCGGTGGTC-3′ and R, 5′-GGCCAGGTCCCTTTCTTCC-3′. Gapdh (primers 5′-TGGCAAAGTGGAGATTGTTGCC-3′ and 5′-AAGATGGTGATGGGCTTCCCG-3′) was used as an endogenous control.
Statistical analysis
The experimental data for multiple comparison tests were analyzed using Tukey's honestly significant difference comparison test after obtaining a significant difference with 1-way analysis of variance. The comparison of 1 pair of data was analyzed by nonparametric t-tests. Values of P<0.05 were considered statistically significant.
Results
The hyperactivation of mTOR blocks 4-factor-induced somatic cell reprogramming
It is well known that the TSC1 and TSC2 complexes suppress the mTOR/Raptor signaling pathway by driving Rheb into the inactive GDP state. To investigate the effects of the hyperactivation of mTOR on iPSC generation, we first utilized MEF cells derived from the Tsc2−/−
embryo [33,49,50] as the starting somatic cells for reprogramming. Tsc2-deficient MEF cells were infected with Tet-on-inducible lentiviruses carrying the cDNAs that encode the 4 transcription factors (Oct4, Sox2, Klf4, and c-Myc) together with a Tet-on transactivator (rtTA-M2) plasmid [52,53]. In parallel, the Tsc2 transgene-containing revertant MEF cells [33,49,50], in which Tsc2 expression could be rescued, were used as controls (Supplementary Fig. S1 and Supplementary Table S1; Supplementary Data are available online at
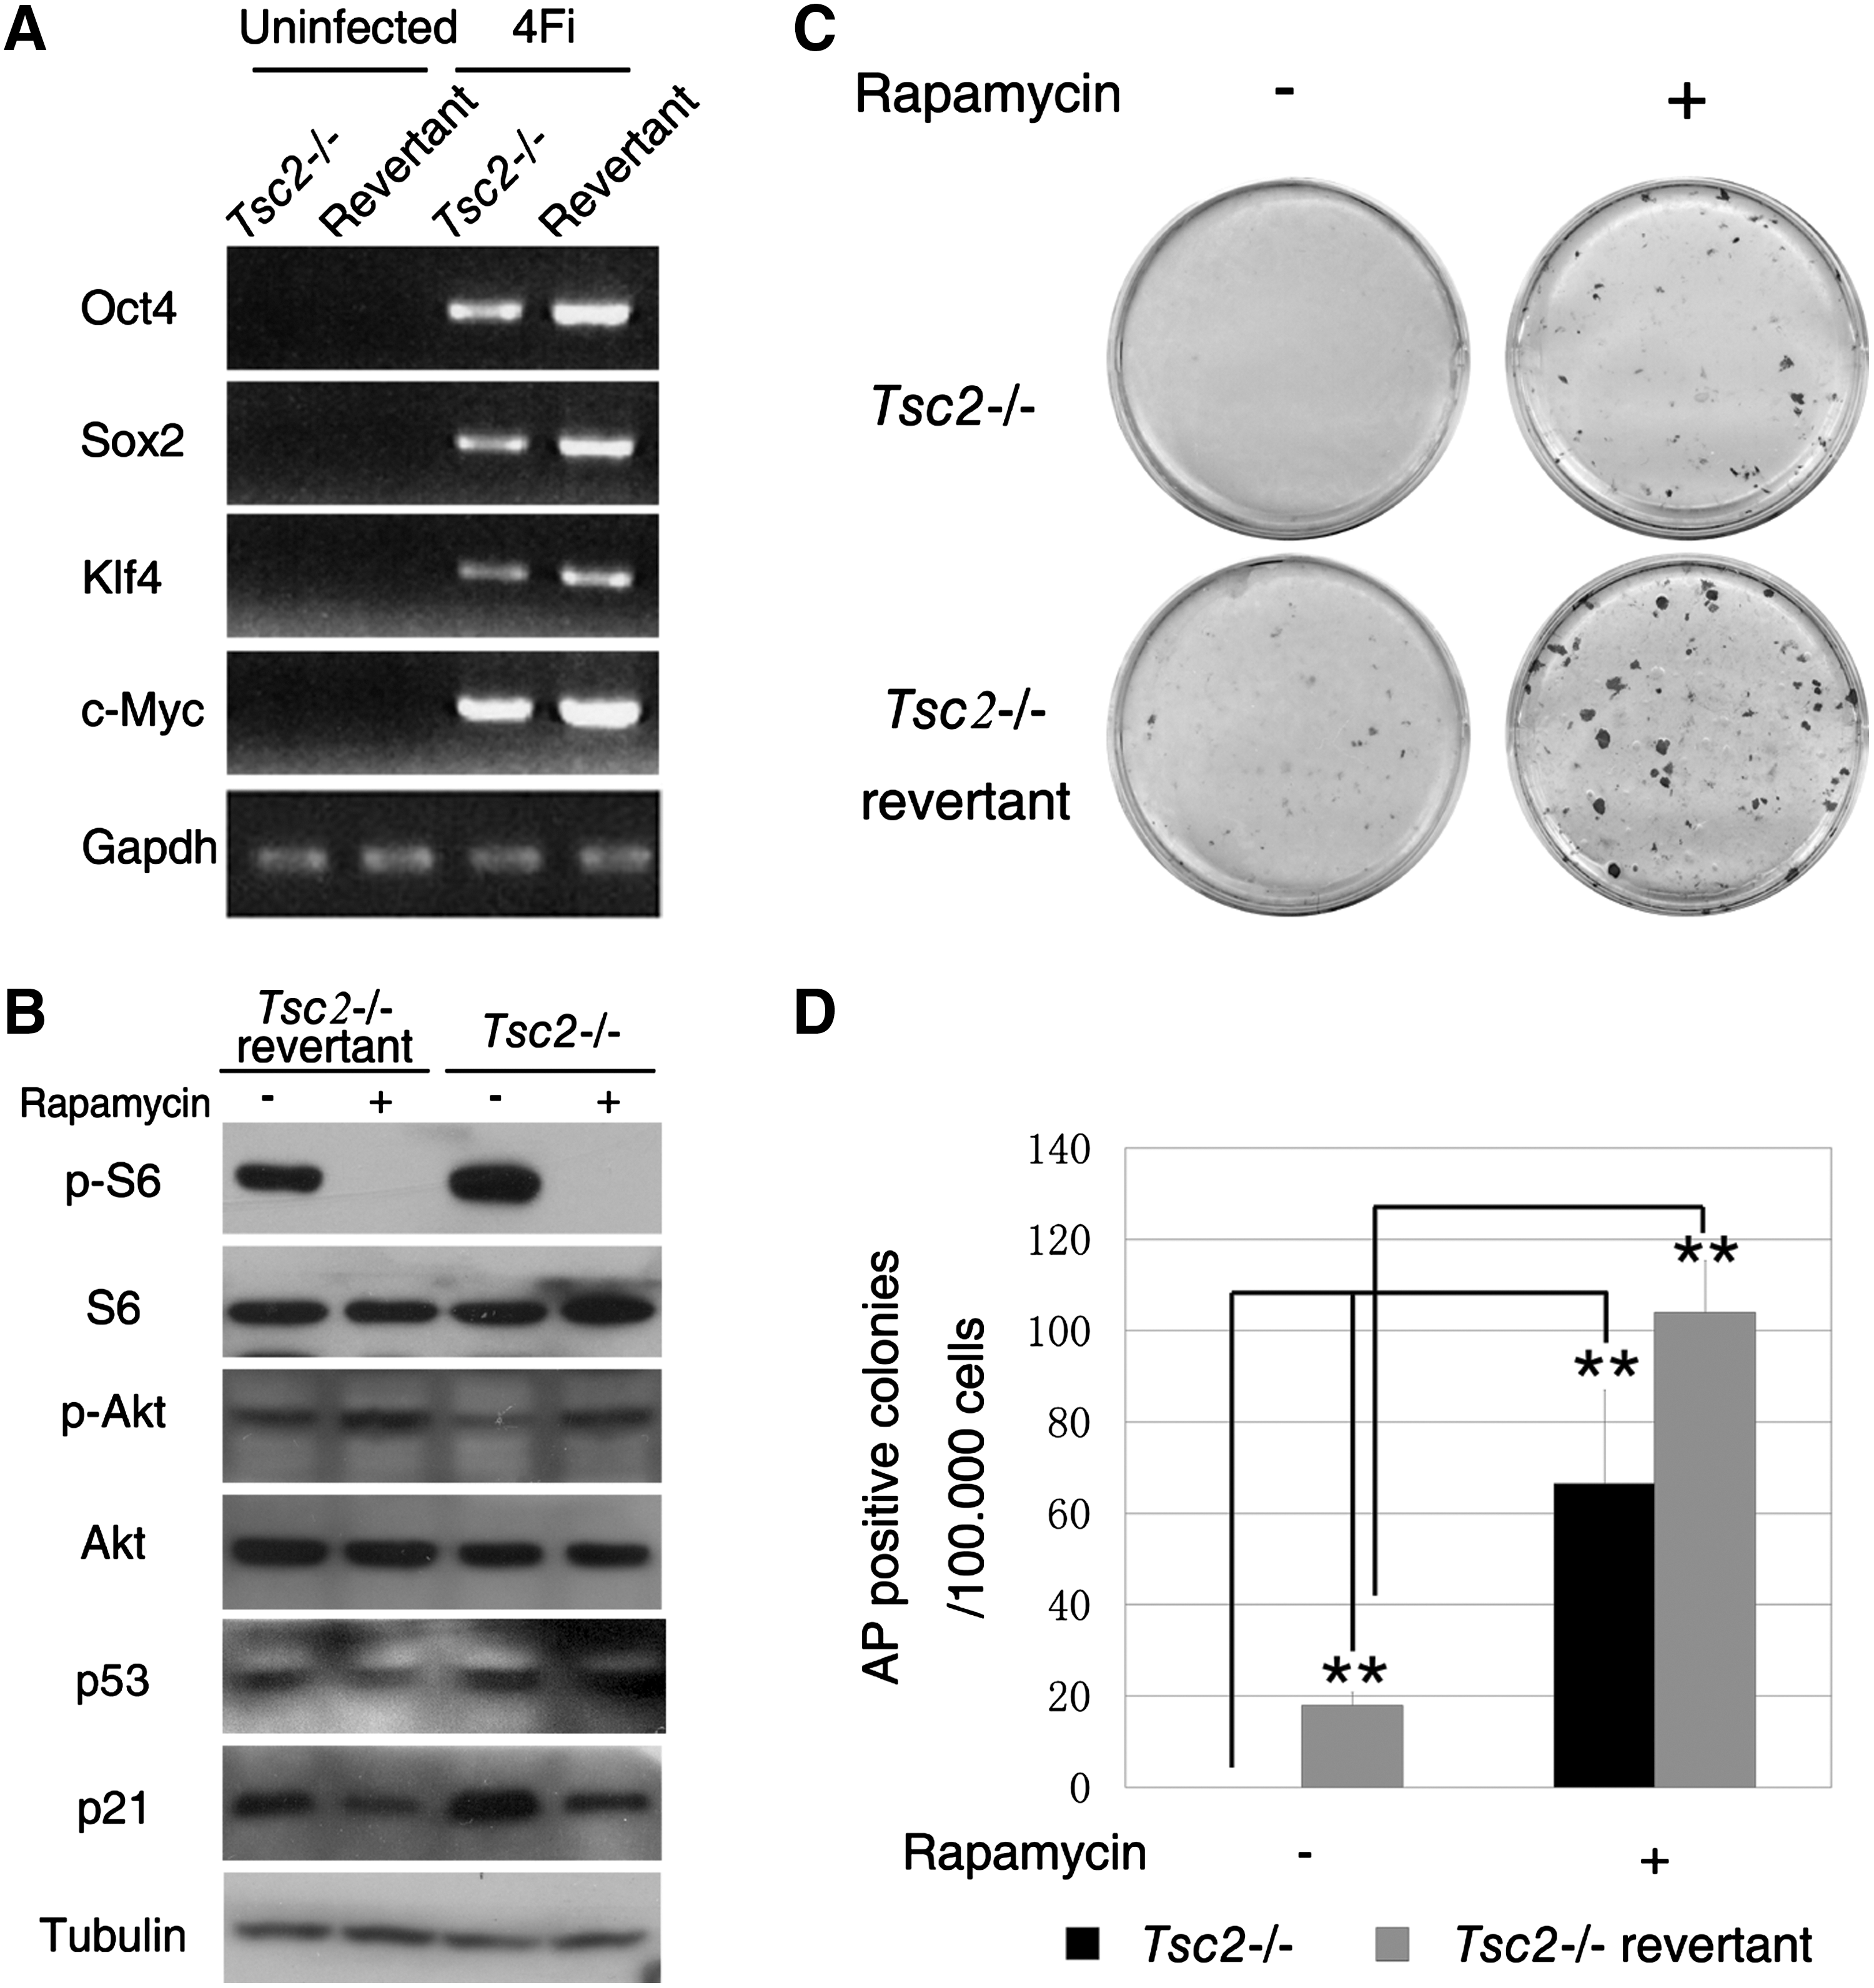
Aberrant activation of mammalian target of rapamycin (mTOR) by knockout of Tsc2 suppresses cell reprogramming.
To further confirm these results, we used a more stringent approach to evaluate the efficiency of iPSC induction by taking advantage of the Oct4-reporter system. We examined the effect of mTOR activation on iPS induction using MEF cells collected from OG2-rtTA embryos. Using these cells, induced iPSC colonies could be monitored by Oct4-green fluorescent protein (GFP) expression. We first confirmed that Tsc2 gene expression and its protein level could be significantly downregulated in MEF cells by Tsc2 shRNA (Fig. 2A, B). Subsequently, we determined that the mTOR activity increased markedly in the Tsc2-knockdown cells compared with cells transduced with the pSicoR-RFP control vector (Fig. 2B). The 4 transcription factors were then introduced into the cells, and the appearance of the iPS colonies was monitored with GFP fluorescence. After introduction of the 4 transcription factors, a significant reduction in the frequency of GFP-positive iPS colonies was observed in the Tsc2-knockdown cells (Fig. 2C, E). To further exclude variations resulting from differences in lentivirus infection efficiency, we used a secondary reprogramming system in which the MEF cells were collected from iPS mice produced by tetraploid complementation with OG2-rtTA iPSCs. We consistently found that the generation of GFP-positive iPS colonies significantly decreased in the Tsc2-knockdown cells (Fig. 2D). The amount of cell proliferation seems comparable between the Tsc2 knockdown cells and the control cells (Fig. 3A). However, we observed a significant increase in cell death during reprogramming after Tsc2 knockdown (Fig. 3B), which might be one of the reasons for the decreased efficiency. Taken together, these data indicate that the hyperactivation of mTOR in somatic cells suppresses 4-factor-induced somatic cell reprogramming.

Hyperactivation of mTOR by depletion of Tsc2 decreases the efficiency of reprogramming.

Tsc2 depletion leads to severe cell death during reprogramming.
Blocking mTOR activity reduces iPSC formation
Because mTOR hyperactivity exhibited adverse effects on iPSC induction, we tested the effect of suppressing mTOR activity on somatic cell reprogramming by using its inhibitor, rapamycin. We employed both first-round and secondary iPSCs [54,55] to test the effect. For the first round of reprogramming, we used OG2-rtTA-MEFs infected with lentivirus that expressed the 4 transcription factors (Oct4, Sox2, Klf4, and c-Myc), and the appearance of Oct4-GFP-positive colonies was considered to be a marker of full reprogramming (Supplementary Fig. S3). For the secondary reprogramming, we used MEF cells or adult TTF cells from the tetraploid-complemented mice produced from either OG2-rtTA-iPSCs or 129-rtTA-iPSCs to induce secondary iPSC formation by adding doxycycline. During the secondary reprogramming, the number of AP-positive colonies from the 129-rtTA-iPS mouse-derived MEFs was reduced by rapamycin (>1 nM) treatment at both early and late stages of reprogramming. The effect was more severe when rapamycin was added at the late stage of reprogramming than at the early stage (Fig. 4A, B). The most severe effect was observed when rapamycin was administered throughout the entire process (Fig. 4C). During the first round of reprogramming, no GFP-positive colonies appeared in the group that was treated with 10 nM rapamycin throughout the entire process, whereas hundreds of GFP-positive colonies appeared when cells were cultured with the ES culture medium containing doxycycline, but without rapamycin (Fig. 4D). We obtained a similar result using OG2-rtTA-iPS mouse MEFs to carry out the secondary reprogramming: a significant decrease in the number of GFP-positive colonies occurred with the addition of rapamycin throughout the entire process (Fig. 4E). In summary, in both the first-round and secondary reprogramming, treatment with rapamycin at concentrations >1 nM during the entire induction process severely impaired iPSC formation. These results indicate that proper mTOR activity is indispensable for transcription factor-induced reprogramming.
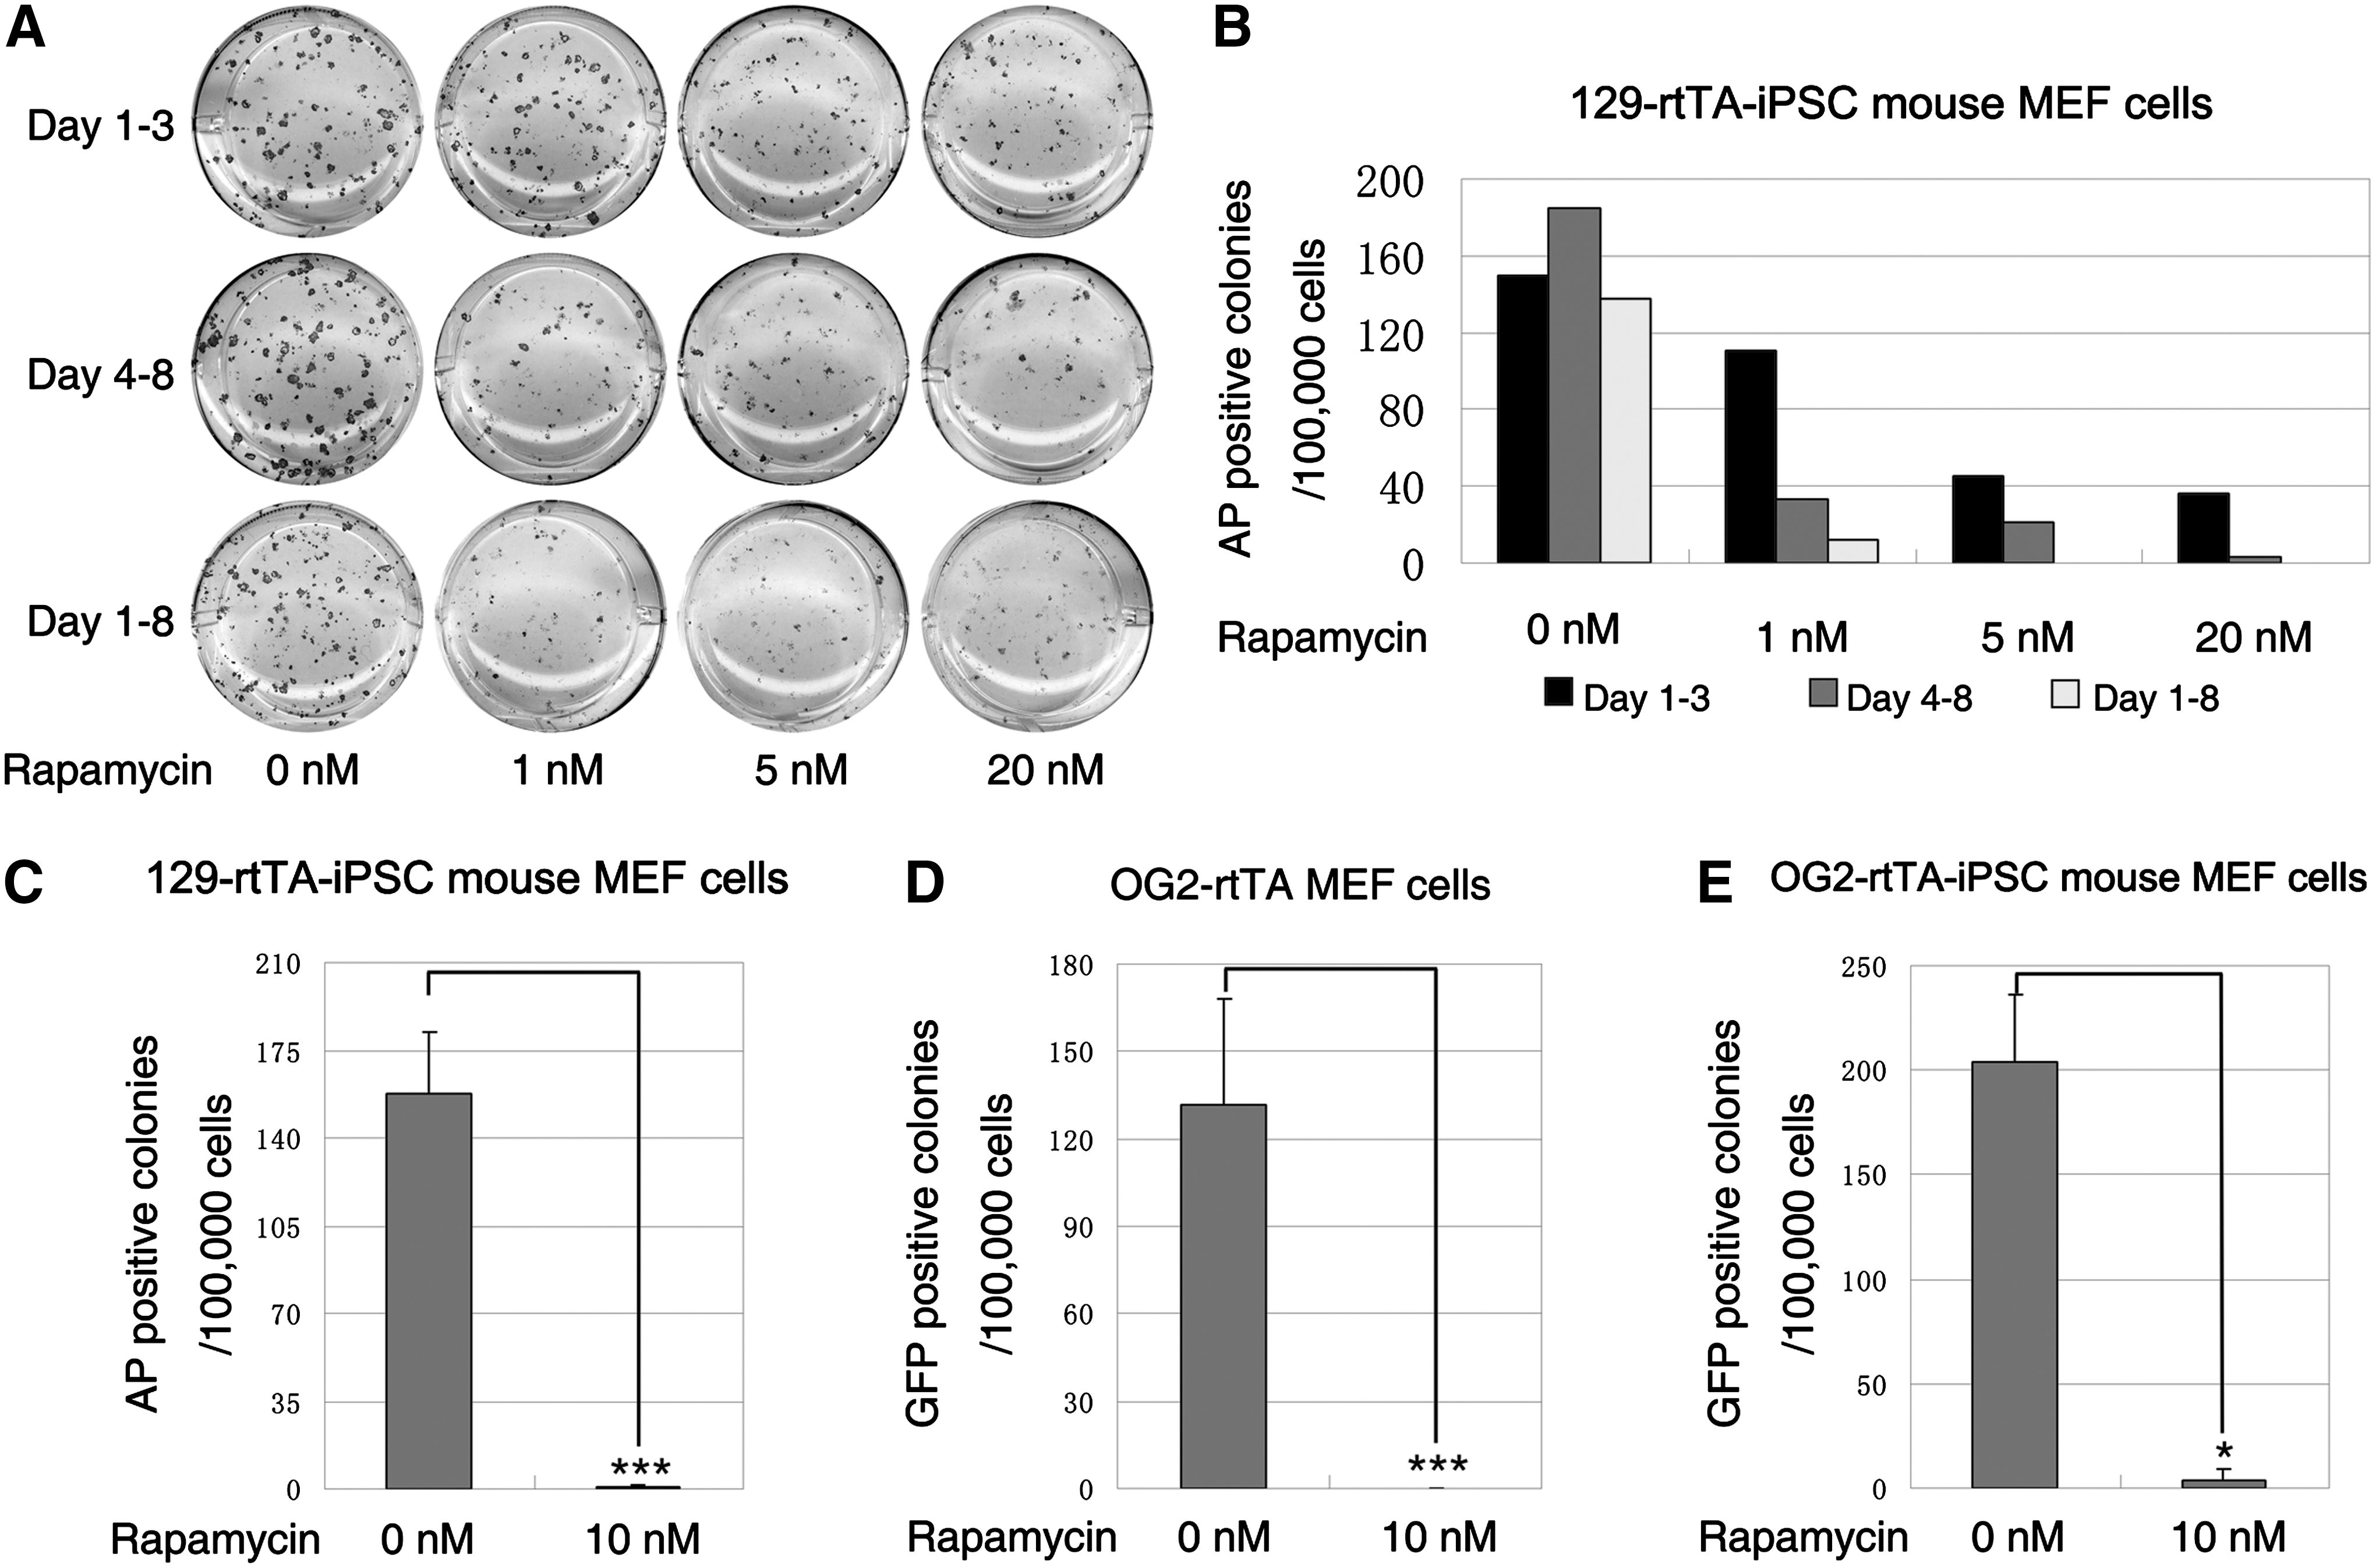
Inhibition of mTOR prevents iPSC formation from normal somatic cells.
Vc partially abolishes the suppression of somatic cell reprogramming by rapamycin
It has been reported that Vc can enhance the generation of iPSCs from somatic cells. Here, we applied Vc during the second round of reprogramming. For 129-rtTA-iPS mouse MEF cells, we observed a six-fold increase in AP-positive colonies with Vc treatment, whereas rapamycin treatment led to a decrease in AP-positive colonies. The addition of Vc to the rapamycin-treated group led to an increase in AP-positive colonies compared with the rapamycin only-treated group, although the number was not comparable with that of the Vc alone-treated group (Fig. 5A, B, Supplementary Fig. S4). Consistently, when OG2-rtTA-iPS mouse MEFs were used for secondary induction, the number of GFP-positive-iPSC colonies and the endogenous pluripotent gene expression of Oct4, Sox2 and Nanog significantly increased with the addition of Vc to the rapamycin-treated groups (Fig. 5C, Supplementary Fig. S5). However, Vc did not rescue the activity of mTOR that was inhibited by rapamycin (Fig. 5D). In addition, rapamycin had a preferable effect on reducing the p53 pathway than Vc. This finding indicates that Vc can partially rescue the reprogramming efficiency that is caused by the mTOR inhibitor; this effect was independent of the restoration of mTOR activity or the downregulation of p53.

Vitamin C (Vc) partially rescued the reduced efficiency caused by rapamycin.
An elaborate regulation of mTOR activity is important for somatic cell reprogramming
Studying the dynamic events during reprogramming was difficult because of the low efficiency of reprogramming [2 –5]; there was a very small proportion of iPSCs and a large number of non-reprogrammed cells. In our secondary reprogramming system, the 129-rtTA-iPS mouse MEF cell line showed extensive cell death during the early reprogramming stage at day 3. To dynamically evaluate the mTOR activity in the process of somatic cell reprogramming, we measured the mTOR activity in the cells at several time points after inducing the expression of the 4 transcription factors. The group treated with Vc showed an early emergence of AP-positive colonies and an increased number of colonies. In both the normal induction group and the induction group with Vc, a decrease in the mTOR activity was observed (Fig. 6A). For the other cell lines, such as the OG2-rtTA-iPS mouse MEF cells, there was not a dramatic level of cell death during the early stage and no obvious change in the mTOR activity. It has been reported that SSEA1 activation marks an intermediate step in reprogramming [52], so we sorted the cells with an SSEA1-positive signal at the middle stage of reprogramming. The sorted SSEA1-positive cells showed a higher level of endogenous pluripotent gene expression (Supplementary Fig. S6). The western blot results indicate that the SSEA1-positive cells had a lower mTOR activity than the SSEA1-negative cells (Fig. 6B). These results were consistent with the downregulation of the mTOR activity during 129-rtTA-iPS mouse MEF cell reprogramming. We observed reduced mTOR activity during somatic cell reprogramming, especially in the first 3 days; to investigate if the downregulation of mTOR is important for reprogramming, we tried using a series of lower concentrations of rapamycin to reduce the mTOR activity. From the western blot result, we confirmed that 10 nM rapamycin had a severe effect on blocking the mTOR activity, while 0.03 nM rapamycin was only able to slightly downregulate the activity of mTOR (Fig. 6C). Subsequently, we found that GFP-positive colonies significantly increased when 0.01 and 0.03 nM of rapamycin was administered (P<0.05), while higher concentration (0.3 nM) of rapamycin exhibited detrimental effects on reprogramming (Fig. 6D). Since the mTOR signaling is correlated with cell proliferation, we then measured the cell number during the reprogramming (Supplementary Fig. S7). There was no significant difference among the groups treated with 0.03 nM, 0.3 nM, or without rapamycin. Therefore, the different reprogramming efficiency observed was not due to cell proliferation, but higher concentration (3 nM) of rapamycin treatment reduced cell proliferation rate within 5 days, and this might be part of the reason of decreased reprogramming efficiency observed. Collectively, these results indicate that an elaborate regulation of the mTOR activity is important for successful somatic cell reprogramming.
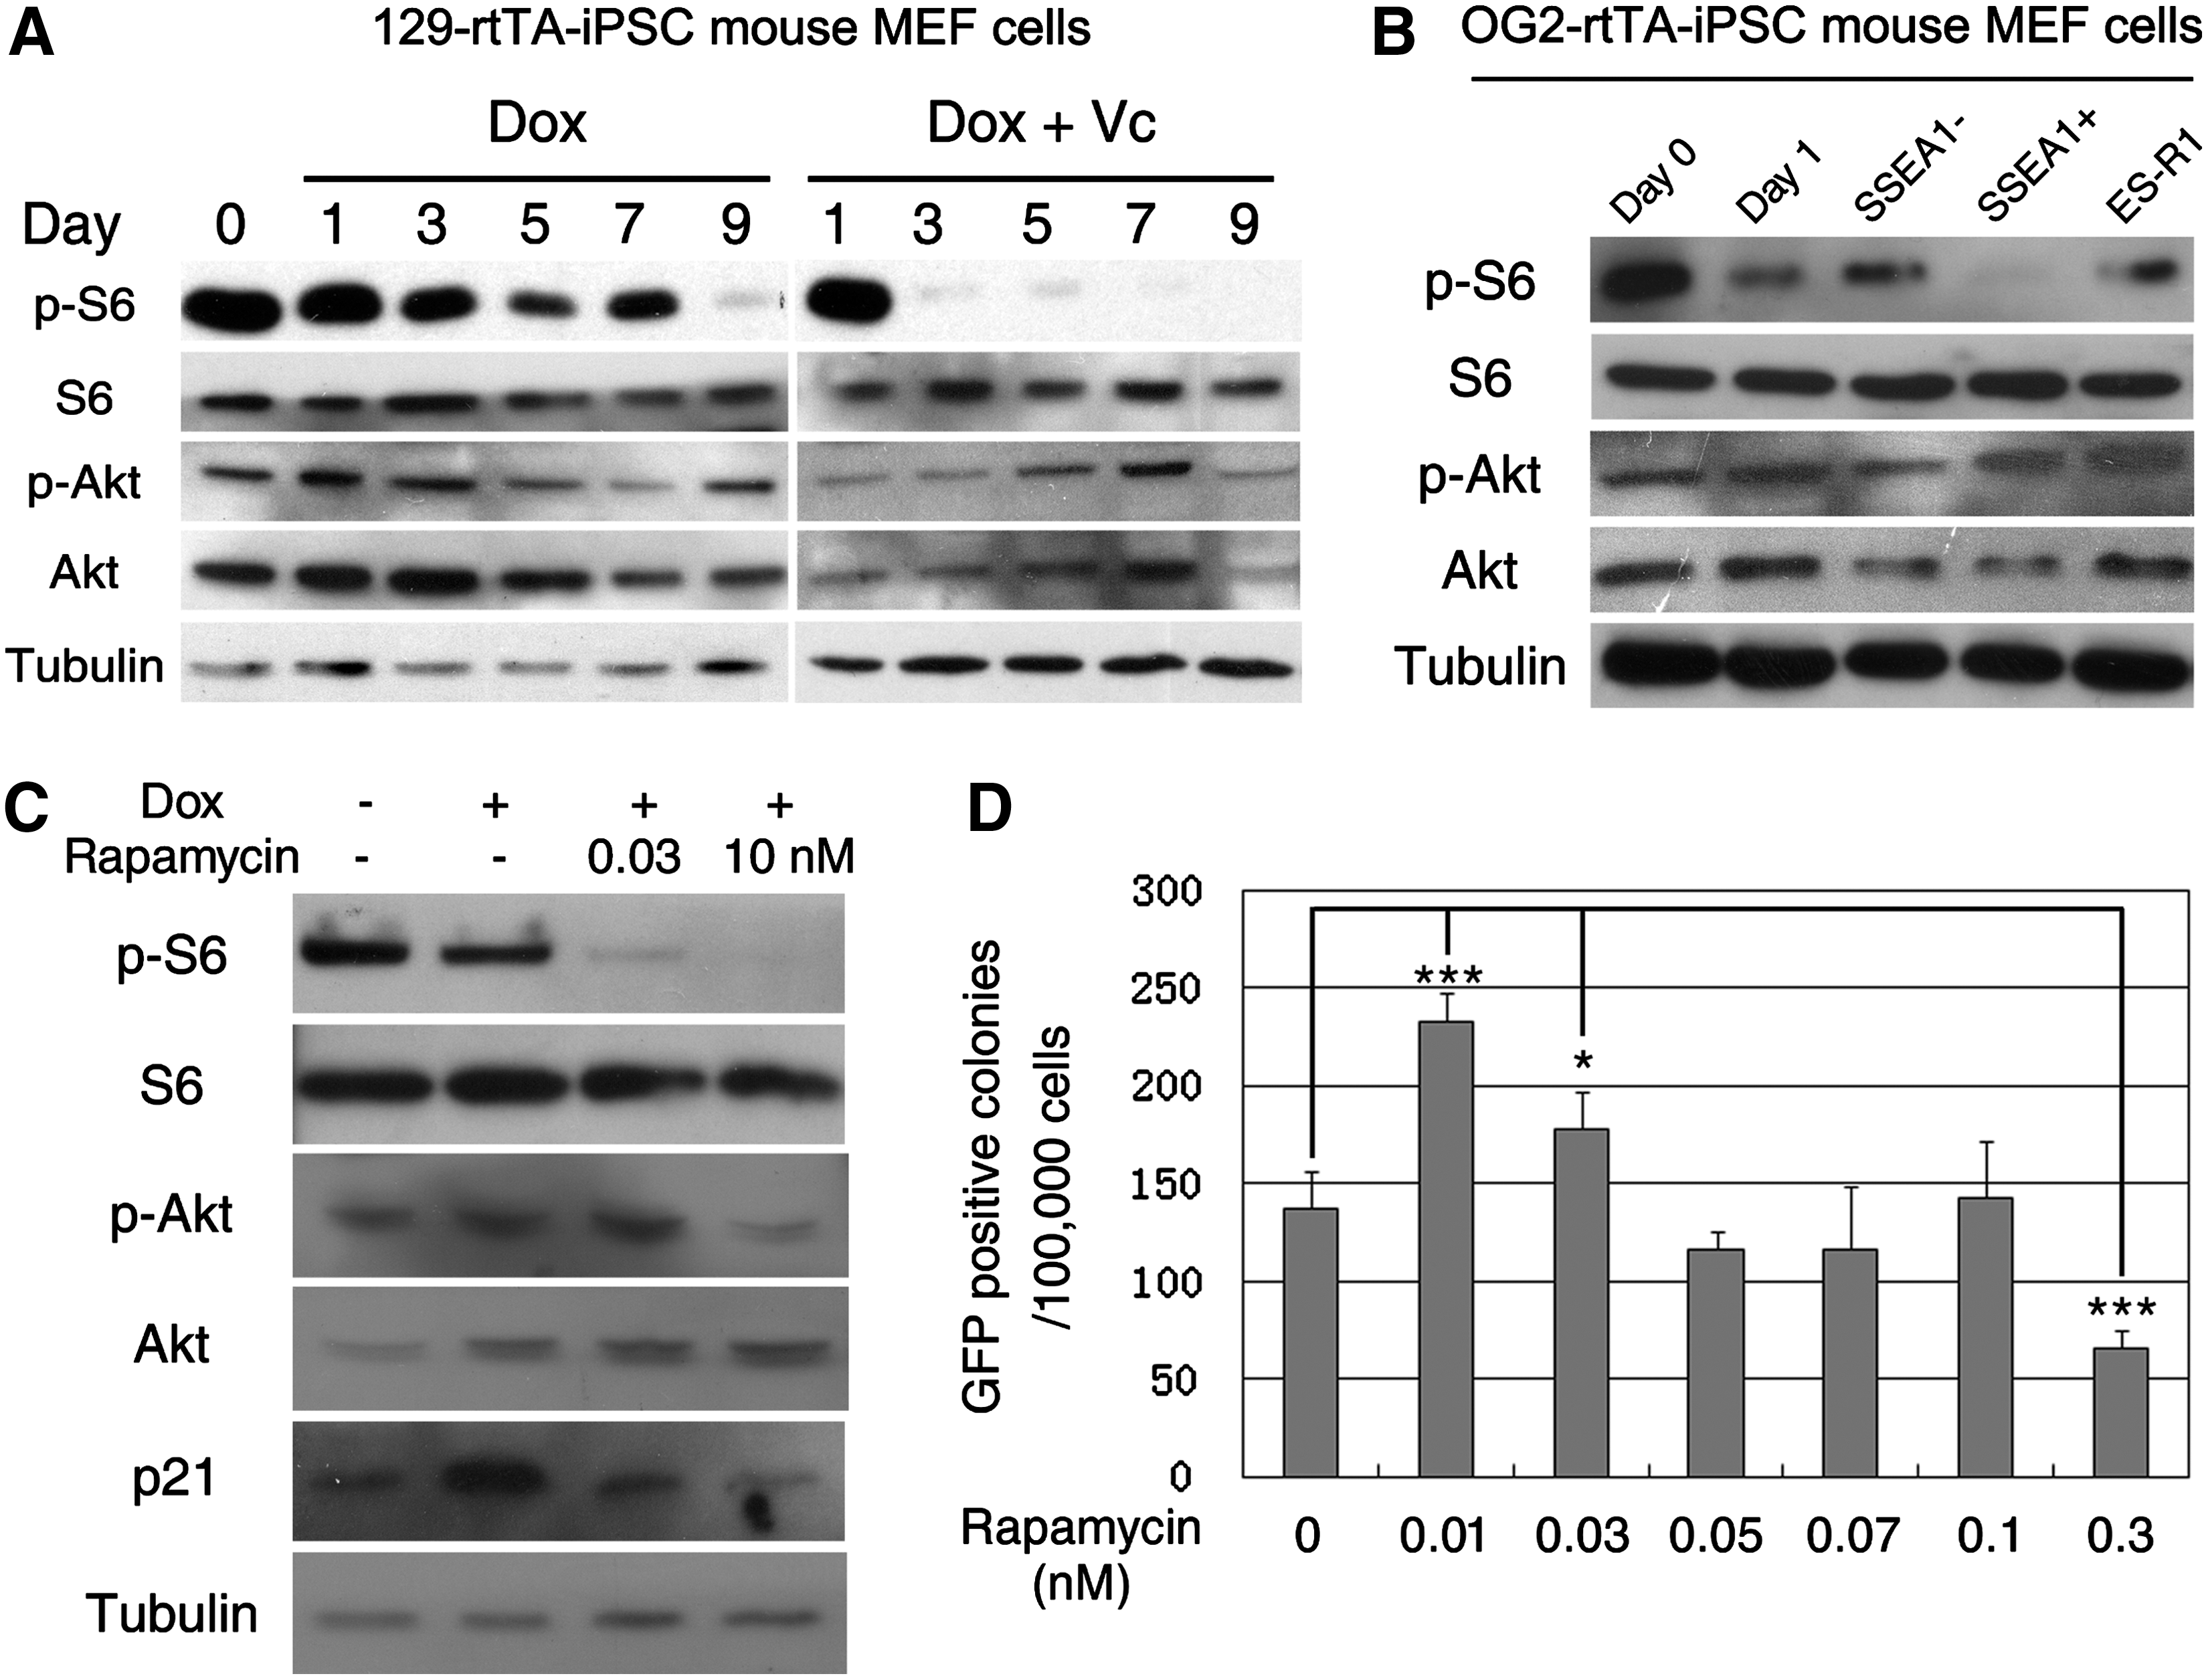
mTOR activity was decreased during the reprogramming process.
Discussion
Our study provides evidence showing that an elaborate regulation of mTOR activity in cells plays an important role in the successful reprogramming of somatic cells into pluripotent stem cells. Either elevating the mTOR activity or completely blocking the mTOR activity impairs the formation of iPSCs.
Increased mTOR activity caused by either Tsc2 depletion or Tsc2 knockdown greatly reduced the number of AP-positive colonies or Oct4-GFP-positive colonies during reprogramming. The transcription factor-induced somatic cell reprogramming was shown to be a cell proliferation-dependent process. In the cells that had a hyperactivation of mTOR signaling, cell proliferation was accelerated. However, the rapid cell proliferation did not show a beneficial effect on reprogramming efficiency, possibly, in part, because of the increased p53-p21 signaling in these cells, as the p53-p21 pathway has been shown to be a barrier for iPSC generation [40 –44].
We observed that the mTOR activity was higher in fibroblast cells than in ES cells and iPSCs, and decreased during the process of reprogramming. However, we observed that in both our first-round and secondary reprogramming, the complete blocking of the mTOR activity with rapamycin did not improve iPSC formation. The high concentration of rapamycin that blocked the mTOR activity acutely had more undesirable effects on iPSC generation; these undesirable effects could be partially rescued by Vc. Recently, another study reported that the treatment of cells with 0.3 nM rapamycin could enhance the generation of mouse iPSCs by 4- to 5-fold [46]. In our system, the 0.3 nM rapamycin could not enhance the efficiency, and the even lower concentration of 0.01 and 0.03 nM could only slightly downregulate the mTOR activity and exhibit beneficial effects on reprogramming. The different concentration effects observed might be due to the quality of the inhibitor used or the variations in the first-round reprogramming protocol used by the other study, in which the variable expression of exogenous transcription factors (as result of variations in the viral infection efficiency or differential transgene insertion) might affect the final outcome of iPSC generation.
In summary, we investigated transcription factor-induced somatic cell reprogramming under different levels of mTOR signaling activity and found that an elaborate regulation of mTOR activity is required for efficient iPSC generation. This essential signaling pathway functions in the reprogramming process by regulating cell survival and interacting with other important signaling pathways, including the p53-p21 pathway.
Footnotes
Acknowledgments
We are grateful to the colleagues in our laboratories for their assistance with the experiments and with the preparation of this article. This project was supported by the Chinese Ministry of Science and Technology (2010CB944900 and 2011CB964800 to S.G., and 2011CB965002 to H.Z.).
Author Disclosure Statement
The authors declare no potential conflict of interests.
References
Supplementary Material
Please find the following supplemental material available below.
For Open Access articles published under a Creative Commons License, all supplemental material carries the same license as the article it is associated with.
For non-Open Access articles published, all supplemental material carries a non-exclusive license, and permission requests for re-use of supplemental material or any part of supplemental material shall be sent directly to the copyright owner as specified in the copyright notice associated with the article.