
Abstract
Hyperthermia treatment has at times been associated with increased platelet levels in humans. The heat shock protein HSP70, which can be induced by hyperthermia in megakaryocytes and erythrocytes, was recently shown to protect GATA-1 from degradation and to be required for erythroid differentiation. Based on these findings, we hypothesize that mild hyperthermia (MH), such as fever (39°C), could impact the differentiation of hematopoietic progenitors into erythrocytes and their subsequent maturation. Cell growth and erythroid differentiation increased dramatically in cord blood CD34+ cell cultures incubated under MH. Erythroid maturation was also strongly promoted, which resulted in an increased proportion of hemoglobinized and enucleated erythroids. The rise in erythroid development was traced to a strong synergistic activity between MH and erythropoietin (EPO). The molecular basis for this potent synergy appears to originate from the capacity of MH to increase the basal activation of several signaling molecules downstream of the EPO receptor and the transcriptional activity of GATA-1. Moreover, the potent impact of MH on erythroid development was found be dependent on increased intracellular levels of reactive oxygen species. Thus, fever-like temperatures can promote the differentiation of progenitors along the erythroid lineage and accelerate their maturation through normal regulatory circuitry.
Introduction
M
Regulation of erythropoiesis is orchestrated partly by EPO, which binds to and activates the EPO receptor (EPO-R) expressed on erythroblasts. Stem cell factor/kit-ligand (SCF/KL) also plays a pivotal role, as both cytokines have a strong synergistic action on erythroblasts [4,5]. While EPO is not required for the differentiation of multipotent hematopoietic progenitor cells (HPCs) into erythroid progenitors, it is essential for their survival and maturation [6].
EPO's proliferative and differentiation activities are modulated through the activation of several signaling pathways (reviewed in [7]). EPO binding to its receptor leads to its activation through the phosphorylationof key tyrosine residues by EPO-R-bound JAK2, which then leads to the activation of a number of signaling cascades that regulate proliferation, survival, and differentiation/maturation of erythroblasts. These pathways are (1) signal transducer and activator of transcription 5a and 5b (referred herein as STAT5), (2) phosphoinositide 3-kinases (PI3K), which activates AKT (PKB), and (3) the Ras-signaling pathway leading to the activation of the extracellular-signal-regulated kinases 1 and 2 (ERK1/2). STAT5 is vital to erythropoiesis by protecting early erythroblasts from apoptosis through the upregulation of Bcl-XL [8]. PI3K and AKT are important for the survival and proliferation of human erythroblasts [9 –11], whereas ERK1/2 is important for the proliferative activity of EPO and the strong synergistic activity of EPO with SCF on erythroid cell expansion [12 –14]. These pathways then converge to regulate the expression of key regulators of erythropoiesis such as GATA-1 and Bcl-XL, which are required for the differentiation and maturation of erythroblasts and for their survival, respectively.
Conversely, intracellular levels of reactive oxygen species (ROS) have been shown to increase after cytokine stimulation [15 –17]. In this context, ROS have been shown to act as second messengers that can induce or potentiate signal transduction pathways downstream of growth factors such SCF and EPO [15,16]. Hence, ROS have been implicated in the cell-cycle entry of quiescent cells [18] and cell growth of CD34+ primary cells [19]. Conversely, inhibition of ROS with the antioxidant N-acetyl-L-cysteine (NAC) inhibited IL-3- and EPO-induced phosphorylation of their respective receptor and of Jak2, STAT5, Akt, MEK, and ERK [16].
In line with the impact of WBH on platelet levels, we previously demonstrated that expansion and differentiation of cord blood (CB) CD34+ cells along the megakaryocytic (MK) lineage were significantly increased under MH (ie, 39°C) [20]. MH-mediated acceleration of MK differentiation and maturation was shown to be rapid [21], associated with increased levels of the heat shock protein HSP70 [20] and of several transcription factors implicated in erythroid and megakaryocyte differentiation [21]. Given that the erythroid and MK lineages are closely related, we have investigated herein whether erythropoiesis could also be promoted when CB CD34+ cells are induced to undergo erythroid differentiation under MH. The prospect of increasing the yields of erythroid production by incubating primary cell cultures under MH could be of significant interest for those developing such processes for future transfusion purposes. The results presented herein demonstrate that MH synergizes with EPO to promote and accelerate the development of erythroid cells ex vivo. Interestingly, this synergistic activity appears to be mediated by the combined activation of known key regulators of erythroid development.
Materials and Methods
CD34-enriched CB, cell cultures, and UT7/EPO cells
Human umbilical CB cells were collected from the umbilical cord of full-term newborn infants born vaginally and cryopreserved as described previously [22]. CD34+ cells were enriched by negative selection using an EasySep® human progenitor cell enrichment kit to a purity ≥85% (StemCell Technologies). CD34+ cells were cultured in a previously described serum-free medium [23] supplemented with 20 ng/mL SCF and 2 U/mL EPO (Feldan Bio) or as indicated. Cells were diluted with a fresh medium on days 4, 7, and 10. All cultures were maintained in a humidified incubator at 37°C or 39°C with 10% CO2. To study the short-term impact of MH (15 min up to 2 days), CD34+ cells were first expanded for 4 days at 37°C and then maintained at 37°C and 39°C as indicated. In some cultures, the following inhibitors were added at 20 μM (diluted in DMSO; Sigma): JAK inhibitor I (Calbiochem), LY294002 (Cayman Chemical Company), and PD98059 (Sigma). Cytometry analyses of these cultures were done on the second day of treatment. Dose–response tests were first conducted (0–100 μM) with the human EPO-dependent leukemic UT7/EPO cell line and confirmed that 20 μM was sufficient to inhibit phosphorylation of STAT5, AKT, and ERK1/2 (data not shown). NAC (20 mM) was also added at day 4 in some cultures. Where indicated, a 5-min H2O2 (Sigma) treatment (9 mM) was performed in some cultures. UT7/EPO cells were grown in the Dulbecco's modified Eagle's medium with 10% fetal bovine serum (FBS) (Invitrogen) and 2 U/mL of EPO (kindly provided by Dr. J. Galipeau, Lady Davis Institute, Montreal). Cell counts and viability were assessed using Trypan blue dye exclusion.
Flow cytometry, cell cycle, and apoptosis analyses
About 1–2×10⁵ cells were analyzed for erythroid cell surface marker expression by flow cytometry (FACS-Cy Flow ML; Partec) after staining with 5 μg/mL of propidium iodide (PI, Sigma) and the following monoclonal antibodies (mAb): CD34-fluorescein isothiocyanate (FITC), glycophorin A-Phycoerythrin (PE) (GPA/CD235a), CD36-Allophycocyanin (APC), CD71-APC, and CD44-FITC. All mAbs were purchased from Becton Dickinson (BD) Pharmingen except for the mAb CD34 (Immunotech, Beckman Coulter). Isotype-matched control mAbs were purchased from the same companies. At least 7,500 PI-negative cell events were acquired during each acquisition. For cell cycle analysis, cells were rinsed with phosphate buffered saline (PBS)-glucose, fixed with 2% formaldehyde for 5 min, and then permeabilized with 0.1% of Triton X-100. Rinsed cells were then marked with the mAb Ki-67-FITC (BD Bioscience), washed, and then resuspended in 0.5 mL of PBS-1% FBS-0.01% azide7-Amino-actinomycin D following the manufacturer's instructions (BD Biosciences). Apoptosis analysis was done using the Vybrant Apoptosis Assay kit following manufacturer's instructions (Invitrogen). ROS were measured using CellRox Deep Red Reagent following the manufacturer's instructions (Invitrogen). Flow cytometry data were analyzed using FCS Express software (De Novo Software).
Flow cytometry analysis of intracellular proteins
For analysis of phosphoprotein levels, CD34+ cells were expanded for 4 days with 40 ng/mL of SCF and 4 U/mL of EPO at 37°C; cells were then rinsed twice with PBS and incubated without cytokines at 37°C for 2 h prior incubation at 39°C. In some experiments, the fluorescent cell barcoding technique [24] was used to compare the intracellular levels of phosphoprotein between samples. In brief, test and control cells were first rinsed and then fixed with 3% formaldehyde for 15 min, rinsed, and then permeabilized with 90% methanol. The samples were then stained (30 min) with different concentrations (final concentration of 0.78, 3.91, 15.63, and 62.5 μM) of carboxyfluorescein diacetate succinimidyl ester (CFSE; Molecular Probes, Invitrogen). Stained samples were then rinsed twice with PBS-1% bovine serum albumin (BSA) and resuspended in 450 μL PBS-1% BSA. Next, 50 μL of each sample was combined into individual tubes. Each tube was then used to compare the expression level of phosphoproteins; mAb-CD235-PE (dilution 1/8) and mAb-phosphoprotein (dilution 1/8) were added to each tube. The mAbs used were pT202-ERK1/2, pS473-AKT, pY701-STAT1, pY705-STAT3, pY694-STAT5a/b, pS529-NF-kBp65, pS473-PKA-RIIα, pT180/pY182-P38, and pY759-PLCγ2, all conjugated to APC and purchased at BD Biosciences.
For Bcl-XL, day-6 cells [grown first in SCF (20 ng/mL) and EPO (2 U/mL)] were incubated overnight with 0, 0.1, and 1 U of EPO without SCF, stained with mAb-CD235-PE, fixed (formaldehyde 2% on ice), and then permeabilized with PBS-0.01% NaN3-0.1% saponin (Fluka, Sigma) in the presence of mAbBcl-XL-PE (Santa Cruz Biotechnology, Inc.). Stained cells (Bcl-XL or phosphoproteins) were rinsed and resuspended with PBS-1% BSA before cytometry analysis.
Wright-Giemsa and benzidine staining
For morphology (Wright-Giemsa stain) and hemoglobin (benzidine stain) expression detection, 50,000 cells were centrifuged (Cytospin 3, Shandon) at 500 rpm on CytoSlide™ (Shandon) and then fixed for 5 min with 100% methanol, air-dried, then stained with Wright-Giemsa (Sigma) diluted 1/20 with water for 15 min, and finally rinsed twice with water. Morphological analyses were done by counting at least 100 cells per slide using an inverted microscope (Nikon Eclipse TE 2000-5) at a final magnification of 100×. For benzidine staining, 60 mg of o-diansidine (substitute for benzidine, Sigma) was dissolved in 29.7 mL H2O and 0.5 mL glacial acetic acid. Before staining, 1 part H2O2 was diluted with 10 parts of o-diansidine solution (dissolved solution). For quantitative measurement of benzidine+ cells, 1 part of the dissolved solution was mixed with 10 parts of the cell culture; cells were then scored as positive or negative on a hemocytometer using an inverted microscope. For qualitative observations, cytospin preparations were prepared by mixing 1 part of the dissolved solution with 10 parts of the cell culture; after centrifugation, the slides were counterstained with Wright-Giemsa.
Western blots analysis
To measure protein expression in cultured cells, an average of 5×10⁵ primary cells were rinsed twice with PBS, then resuspended in 80 μLof PBS, lyzed with the addition of 40 μL of sample buffer 3 times (187.5 mM Tris-HCl, 150 mM DTT, 6% sodium dodecyl sulfate (SDS), 6% glycerol, and 0.3% bromophenol blue), and then heated for 5 min at 95°C. Proteins were extracted from UT7/EPO cells by lyzing the cells in an RIPA buffer (1×PBS, 1% Nonidet P-40, 0.5% Sodium deoxycholate, and 0.1% SDS) for 30 min on ice. The lysates were then spun down at 14,000 g for 20 min at 4°C, and the aqueous phase was isolated. Lysis solutions were supplemented with the Protease Inhibitor Cocktail (Sigma) and sodium orthovanadate (phosphatase inhibitor; Sigma). Protein concentrations were measured using the Bradford Protein Assay (Bio-Rad). About 1 to 25 μg of protein cell extracts was resolved on 10% SDS-PAGE gels and then transferred to Immobilon P-PVDF (Millipore) or nitrocellulose membranes [AmershamHybond-enhanced chemiluminescence (ECL); GE Healthcare]. The following antibodies were used: mouse-GATA-1 (Santa CruzBiotechnology); mouse-pS310-GATA-1 and mouse-HSF-1 (SignalwayAntibody); mouse-pS326-HSF-1 (Abcam); rabbit-Actin (Sigma); mouse-HSP70 (Stressgen); mouse-Phospho-p44/42 MAPK (Erk1/2) (Thr202/Tyr204); rabbit-p44/p42;rabbit-phospho-Akt (Ser473); rabbit-Akt; mouse-phospho-Stat5 (Tyr694); rabbit-Stat5; and rabbit-phospho-Jak2 (Tyr1007/1008; Cell Signaling Technologies). Blots were washed in TBST and then incubated with secondary antibodies conjugated to HRP (goat x-mouse IgG or goat x-rabbit IgG; Jackson Immuno Research), and ECL was performed to visualize the proteins (GE Healthcare Biosciences, Inc.). Actin was probed on the same blot after stripping with the Restore Western Blot Striping Buffer (Pierce).
Luciferase gene reporter assay
To measure the transcriptional activity of GATA-1 in UT7/EPO cells, 15 μg of pGL3-Basic (empty plasmid used as negative control; Promega Corporation) or PGL3αIIb (luciferase gene under the transcriptional regulation of a GATA-1 element) [25] was co-electrophoresed (60 μF, 280 V; Gene pulser™, Bio-Rad) with 1 μg pEYFP-C1 (Clontech) into 5×10⁶ UT7/EPO cells in 800 μL of the DMEM with 0.4-cm cuvette (Invitrogen). The proportion of pEYFP+ cells was measured 48 h later by flow cytometry before cell extraction. Cell extraction and luciferase assays were done using the Luciferase Assay System with Reporter Lysis Buffer following the manufacturer's instructions (Promega Corporation) and an Ascent microplate luminometer (The Thermo Scientific Luminoskan). The luciferase activity of each sample was normalized with the proportion of EYFP+ cells, and then normalized with the value obtained with the pGL3-Basic negative control.
Statistical analysis
GraphPad InStat version 3.00 was used for statistical analyses. Significant differences between responses obtained at 37°C and 39°C were determined using 2-tailed paired t tests or when indicated by the analysis of variance (Turkey-Kramer). Differences were considered statistically significant with a P value<0.05.
Results
MH stimulates cell cycle entry of quiescent CD34+ cells and improves cell expansion
To investigate the impact of MH on erythroid development from multipotent HPCs, CB CD34+-enriched cells were cultured in a serum-free medium supplemented with EPO (2 U/mL) and SCF (20 ng/mL) and incubated at 37°C or 39°C for up to 14 days. Cell expansion was strongly increased in cultures maintained at 39°C (Fig. 1A). This increase in cell expansion was detectable as early as day 3, and was statistically significant (P<0.05) between day 5 and day 10 (Fig. 1B).
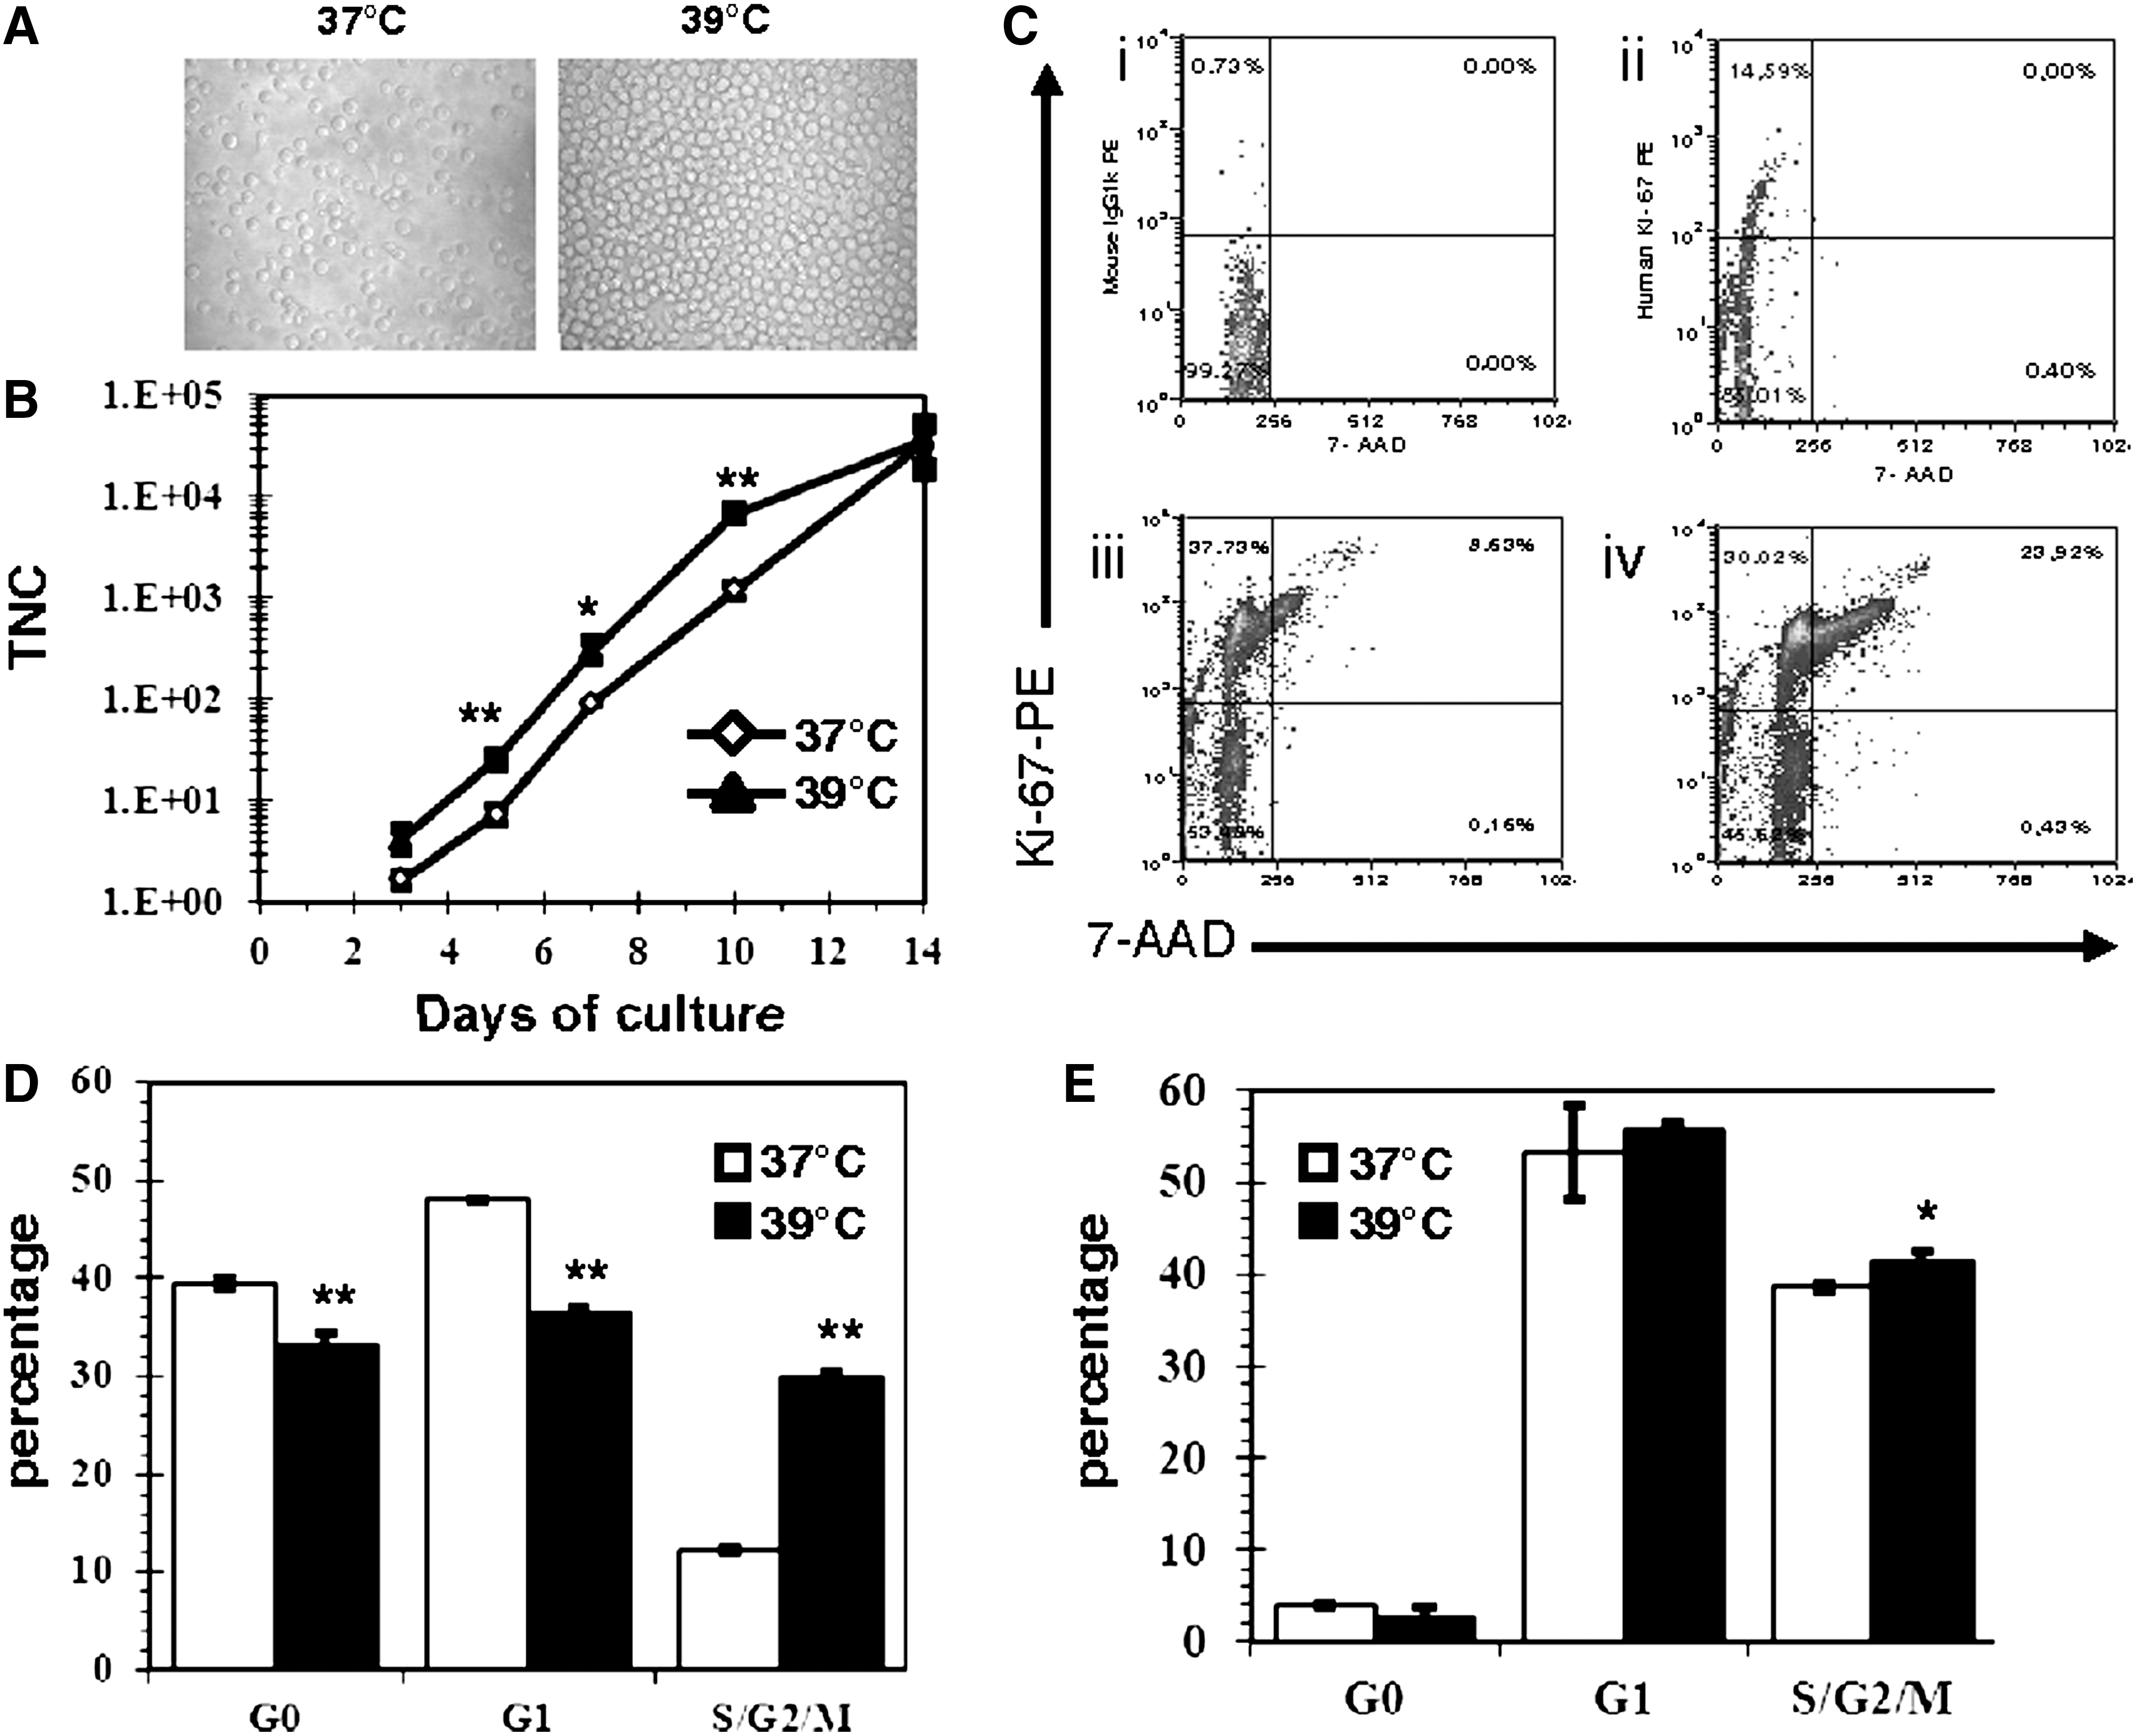
Impact of mild hyperthermia (MH) on cord blood (CB) cell growth.
Since the rise in cell growth occurred early in culture (Fig. 1B), we analyzed the impact of MH on the cell cycle kinetics of the CB cells at day 3 and day 5 of culture. As expected, the majority of the CD34+-enriched cells at day 0 were quiescent (G0, ∼85%) or in G1 (∼15%, Fig. 1Cii). After 3 days of culture at 37°C, close to 50% and 12% of the CD34+ cells were in G1 or in S/G2/M, respectively (Fig. 1Ciii, D). Based on the increased appearance of the nuclear proliferative marker Ki-67 at day 3, CB CD34+ cells incubated under MH exited G0 significantly faster (P<0.01) at 39°C than at 37°C (Fig. 1Civ, D). This was accompanied by a 2.4-fold (P<0.01) increase in the fraction of cells that had progressed passed G1 (30% in S/G2/M phases, Fig. 1Ciii, D). By day 5, the majority of the cells (total) at both incubation temperatures were actively cycling, though the proportion of cells in S/G2/M remained significantly greater under MH (Fig. 1E).
Increased expansion of CB cells under MH is associated with increased and accelerated erythroid differentiation and maturation
The expression of CD36 and glycophorin-A (GPA) was monitored using flow cytometry analyses. CD36 is often used as a marker for erythroid progenitors [26], and its expression precedes that of GPA [27]. MH had a significant impact on the appearance of both CD36+ and GPA+ cells. During the first week of culture, the frequencies of CD36+ cells were significantly greater for the culture incubated at 39°C (Fig. 2A, B). In addition, the transition from CD36+GPA− to CD36+GPA+ double-positive state also occurred more rapidly at 39°C (Fig. 2A), though this remained below statistical significance (Fig. 2A, data not shown).

Impact of MH on erythroid differentiation of CB CD34+ cells.
The kinetics of appearance of GPA+ cells was even more profoundly disturbed by MH. This was evident as early as day 3, but only became statistically significant by day 5, at which time the proportion of GPA+ cells at 39°C almost doubled that observed at 37°C (Fig. 2C). No significant differences were observable beyond 10 days of culture, though the plateau reached under MH tended to be greater (Fig. 2C). Consistent with the increase in cell expansion (Fig. 1B) and proportion, the absolute number of GPA+ cells was 3- to 7-fold greater at 39°C (P<0.05, Fig. 2D). The faster appearance of CD36+ and GPA+ cells at 39°C was also confirmed using CD34+CD36−-enriched cells; a significant 1.2-fold (P<0.05) and 1.4-fold (P<0.01) increase in the proportion of CD36+ and GPA+ cells was observed at 39°C after 3 and 5 days of culture, respectively (data not shown).
Next, the maturation and the detection of hemoglobin-expressing cells were investigated by microscopy using Wright-Giemsa and Benzidine staining, respectively. Staining revealed a striking acceleration of erythroid maturation in cultures maintained at 39°C (Fig. 3). Hence, at day 7, the majority of the erythroid cells at 37°C were basophilic erythroblasts, while those at 39°C had already passed to the next stage of maturation (polychromatic, Fig. 3A, right panel), and the proportion of piknotic erythroblast tended to be greater at 39°C at day 10. Finally, a 3-fold (P<0.02) increase in the proportion of enucleated erythroids was observed at day 14 (Fig. 3A). Hemoglobinized erythroblasts also appeared earlier in cultures maintained at 39°C (Fig. 3B, C) and were present in greater proportions between day 7 and day 12 of culture (Fig. 3B, C). Cell pellets prepared from 39°C cultures were consistently redder, confirming the above observations (Fig. 3D). Taken together, these results demonstrate that MH promotes the differentiation of CB CD34+ cells along the erythroid lineage and accelerates their maturation.

Impact of MH on erythroid maturation.
MH strongly synergizes with EPO to promote erythroid development
To ascertain the activity of MH on erythroid development, decreasing concentrations of EPO were tested under a constant SCF level (20 ng/mL) in CB cultures maintained at 37°C or 39°C for 6 days. Dose-dependent decreases in erythroid differentiation with decreasing EPO concentrations were evident at both temperatures (Fig. 4). In the absence of EPO, the frequency of GPA+ cells tended to be greater at 39°C, and the total number of GPA+ cells generated ex vivo was increased by 50% (P<0.02) at 39°C (Fig. 4A). Consistent with the original observations, MH strongly promoted erythroid differentiation (% GPA+ and number of GPA+ cells) in the presence of EPO at any concentration. Notably, the expansion and differentiation responses at 39°C with 0.1 U/mL of EPO were identical to those seen at 37°C with 5 times more EPO (0.5 U/mL).

MH has modest erythroid-supporting activity, but strongly synergized with EPO to promote erythroid development.
The impact of MH on cell viability under reducing concentrations of EPO (1 to 0.05 U/mL) was also investigated by annexin V staining. No significant differences in the percentages of viable, apoptotic, and necrotic cells in cultures maintained at 37°C or 39°C were observed in the presence of EPO (data not shown). These results demonstrate that MH possesses a limited level of erythroid-supporting activity in the absence of EPO, but more importantly that it strongly synergizes with EPO to promote erythroid development.
The impact of MH on erythroid differentiation is mediated in part through STAT5, AKT, and ERK1/2
To identify the mechanisms responsible for the acceleration of erythroid differentiation induced by MH, we developed a culture strategy that would provide sufficient cells for such investigations. A pre-expansion of 4 days of the CD34+-enriched cells at 37°C was found to support a significant level of cell expansion (4.4±2.7-fold, 17.7±1.6% GPA+) and to provide cells that still responded to MH, as confirmed by GPA cytometric analysis for cells grown overnight or for 2 days at 39°C starting at day 4 [see control cultures (CTL) in Fig. 6A].
Next, we investigated the impact of MH on the phosphorylation of key signaling molecules downstream of the EPO-R. To quantitatively compare the level of phosphoproteins in GPA+ cells incubated at 37°C or 39°C, we used fluorescent cell barcoding [24]. Cytokine-deprived expanded CD34+ cells were incubated without EPO at 37°C or 39°C for 15 or 60 min, as well as overnight with EPO (2 U/mL). For each incubation, cells from each condition were stained with CFSE at different concentrations. The samples were then mixed together, stained with an mAb-phosphoprotein and mAb-GPA, and then analyzed by cytometry (so-called simultaneous deconvolution analysis).
In preliminary experiments, no significant differences were observed in the level of phospho-STAT1, phospho-STAT3, phospho-Nf-kB, phospho-PKA, and phospho-p38-MAPK in GPA+ cells incubated at 37°C and 39°C (n=3, data not shown). In contrast, marked differences were detected for p-STAT5, p-AKT, and p-ERK1/2. MH increased the level of pY694-STAT5 by 26%, pS473-AKT by 21%, and pT202-ERK1/2 by 45% in the complete absence of EPO (Fig. 5A, B). Activation of AKT and ERK1/2 by MH was mostly transient, whereas the level of pY694-STAT5 remained greater in GPA+ cells incubated overnight with EPO at 39°C (+33.5%, data not shown). Although the differences mentioned above failed to be significant, increases in pSTAT5 and pERK1/2 and pAKT were observed in all or 2 out of 3 independent experiments, respectively. Moreover, the positive effects of MH on the phosphorylation of all 3 proteins were confirmed in UT7/EPO cells (Fig. 5C, D).
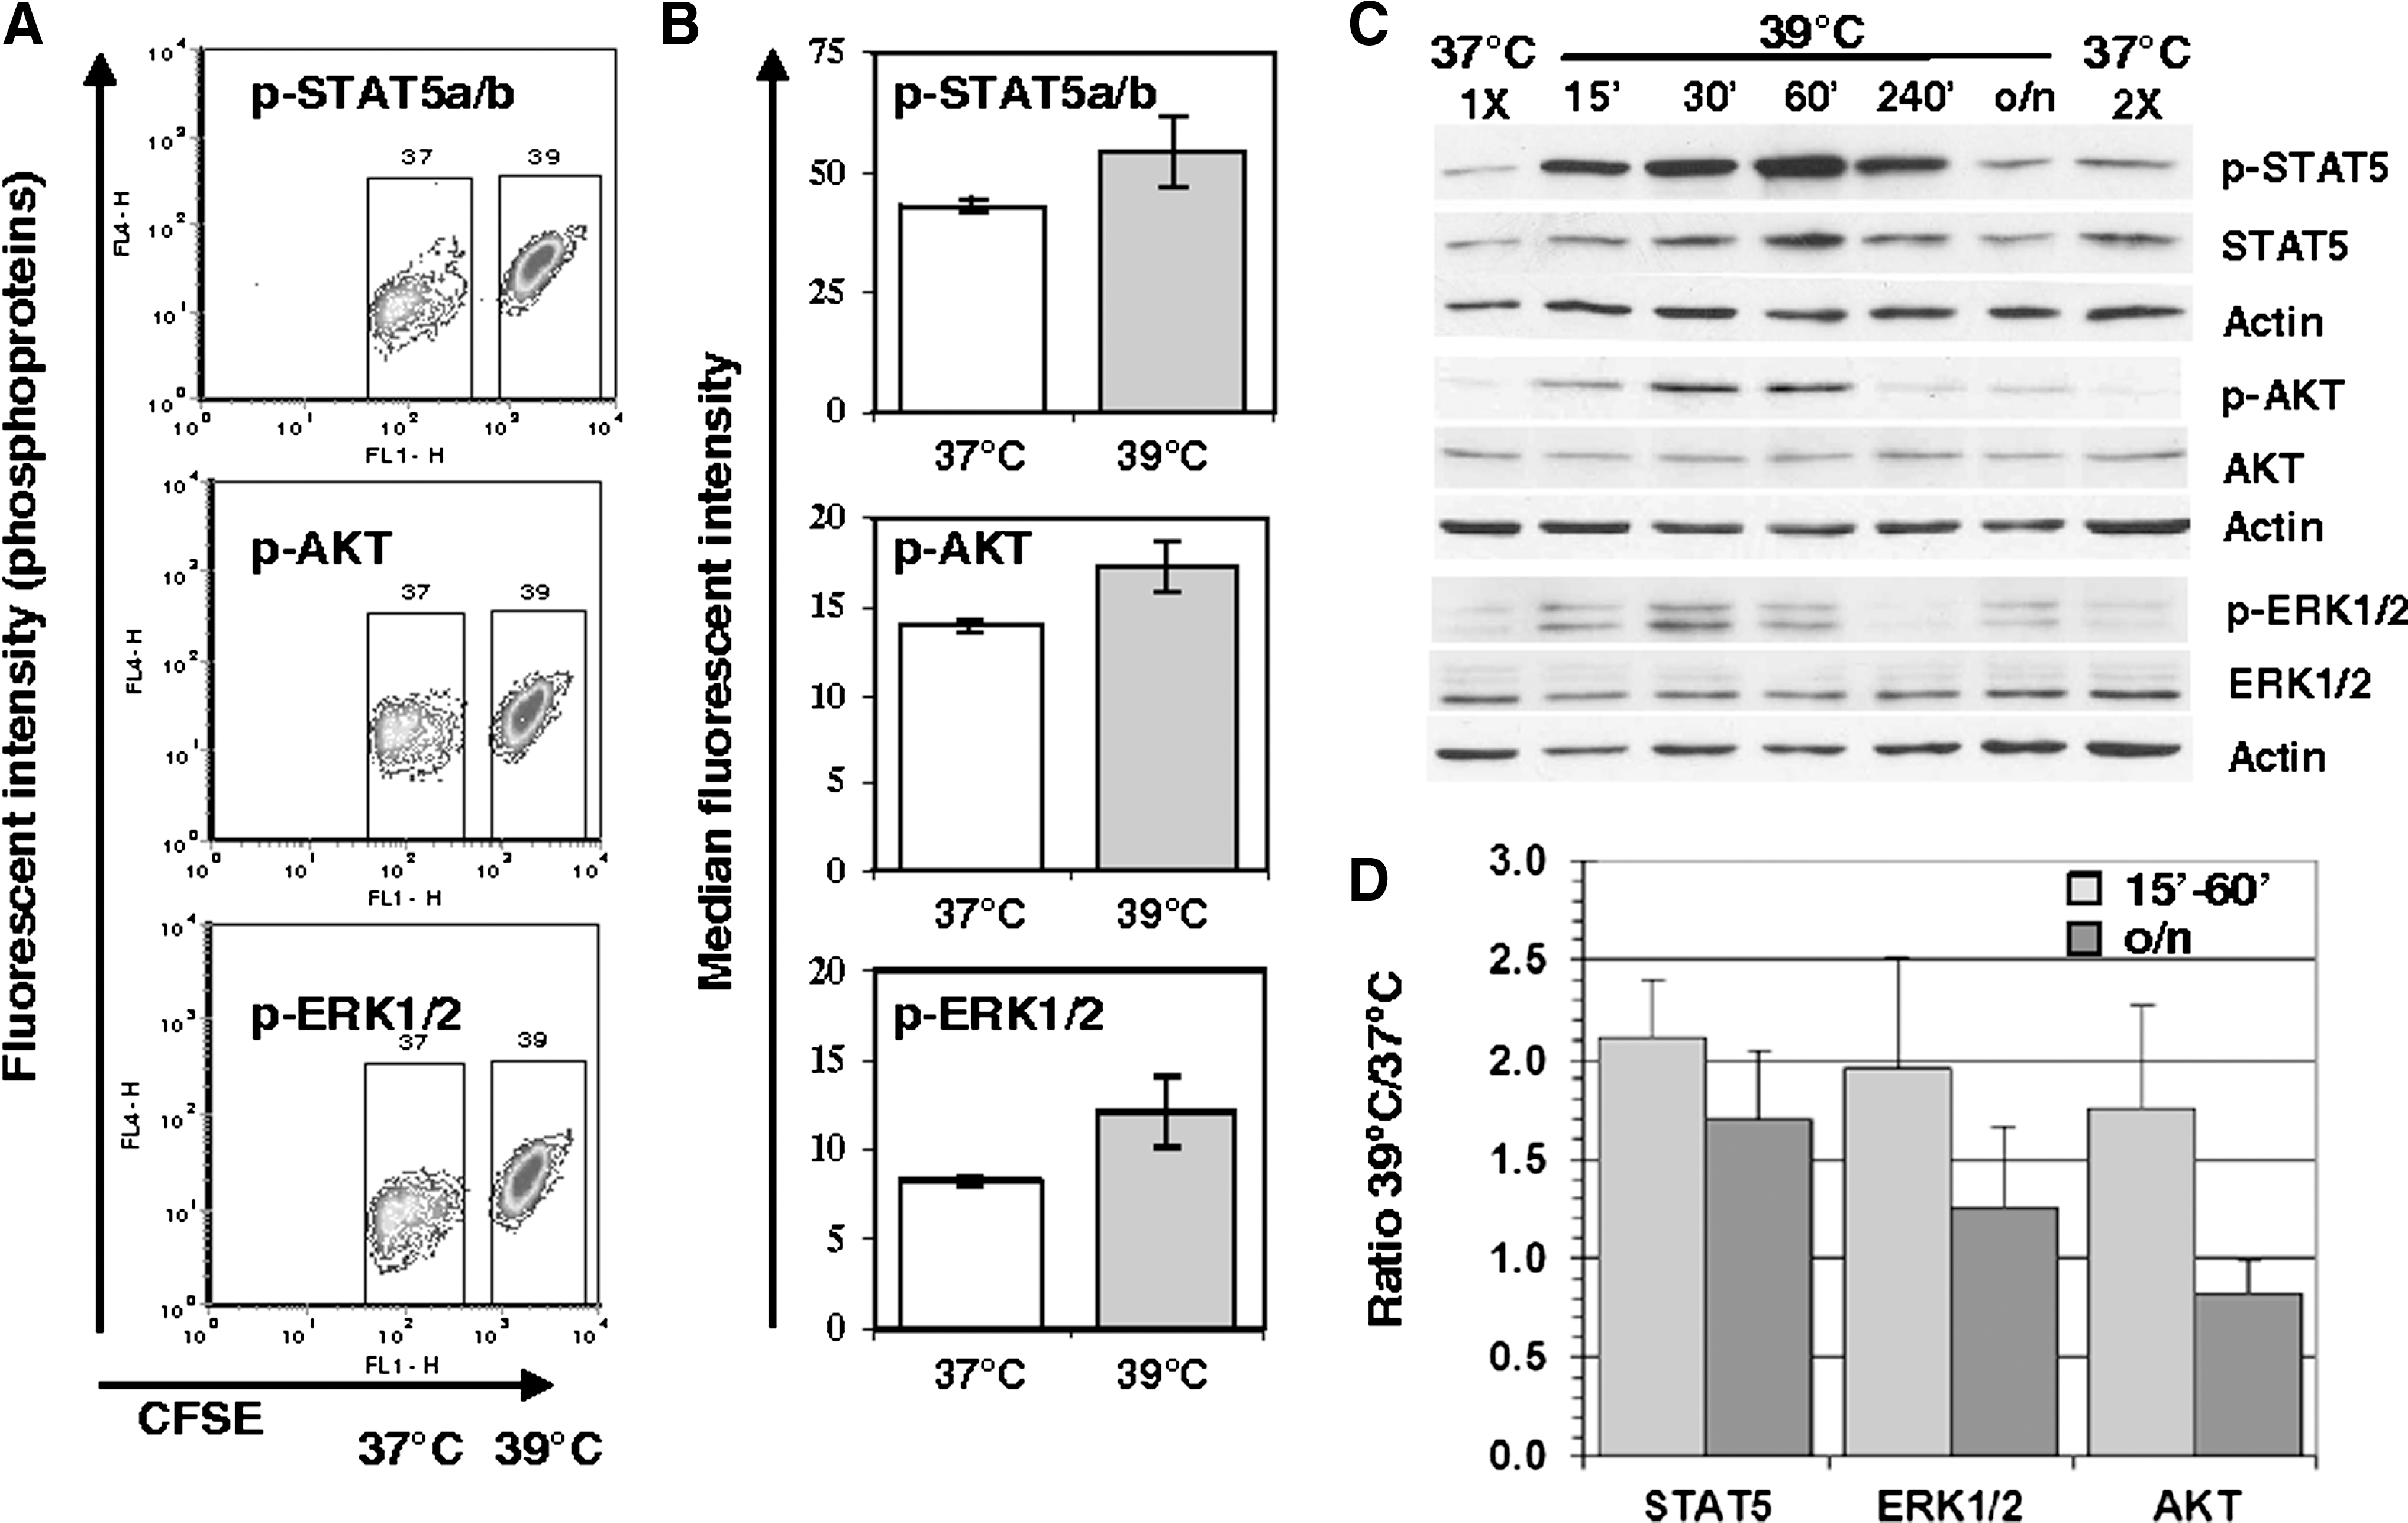
MH increases the phosphorylation of STAT5, AKT, and extracellular-signal-regulated kinases 1 and 2 (ERK1/2) in GPA+ cells.
To determine whether STAT5, AKT, and ERK1/2 were implicated in the mediation of MH-accelerated erythroid differentiation, we tested the impact of their inhibition on erythroid differentiation using the chemical inhibitors, JAK Inhibitor I, PI3K inhibitor Ly294002, and MEK inhibitor PD98059. JAKs, PI3K, and MEK are upstream kinases that activate STATs, AKT, and ERK1/2, respectively. Dose–response experiments determined that 20 μM of each inhibitor was sufficient to inhibit the phosphorylation of STAT5, AKT, and ERK1/2 in UT7/EPO cells, while limiting the toxicity of these drugs (data not shown).
The inhibitors were added at day 4 in cultures previously expanded at 37°C, and the proportion and numbers of GPA+ cells generated in their presence were determined 2 days later. Accelerated erythroid differentiation in cultures incubated at 39°C was maintained in the presence of the inhibitors solvent DMSO (Fig. 6A). Addition of the JAK and PI3K inhibitors strongly reduced the proportion of GPA+ cells at 39°C, to levels similar or lower to that observed with the DMSO control at 37°C (Fig. 6A). These inhibitors also reduced the frequency of GPA+ cells at 37°C. To take in account the effects observed at 37°C and to better highlight the impact of these inhibitors on the capacity of MH to promote erythroid development, the increase in the proportion of GPA+ and the number of GPA+ cells obtained at 39°C was calculated. This revealed that the JAK and PI3K inhibitors significantly reduced the capacity of MH to promote erythroid development (Fig. 6A). The percentages of GPA+ cells remained greater at 39°C, suggesting that the blockage was only partial. Inhibition of MEK1/2 with PD98059 had opposing effects, since it tended to increase the proportion of GPA+ cells at 37°C. However, a clear trend of reduced erythroid development under MH was evident, but this failed to be significant (Fig. 6B, C). Taken together, these results demonstrate that MH increases the level of pY694-STAT5, pS473-AKT, and pT202-ERK1/2, and that inhibition of 2 of these pathways severely impairs the promotion of erythroid development induced by MH.
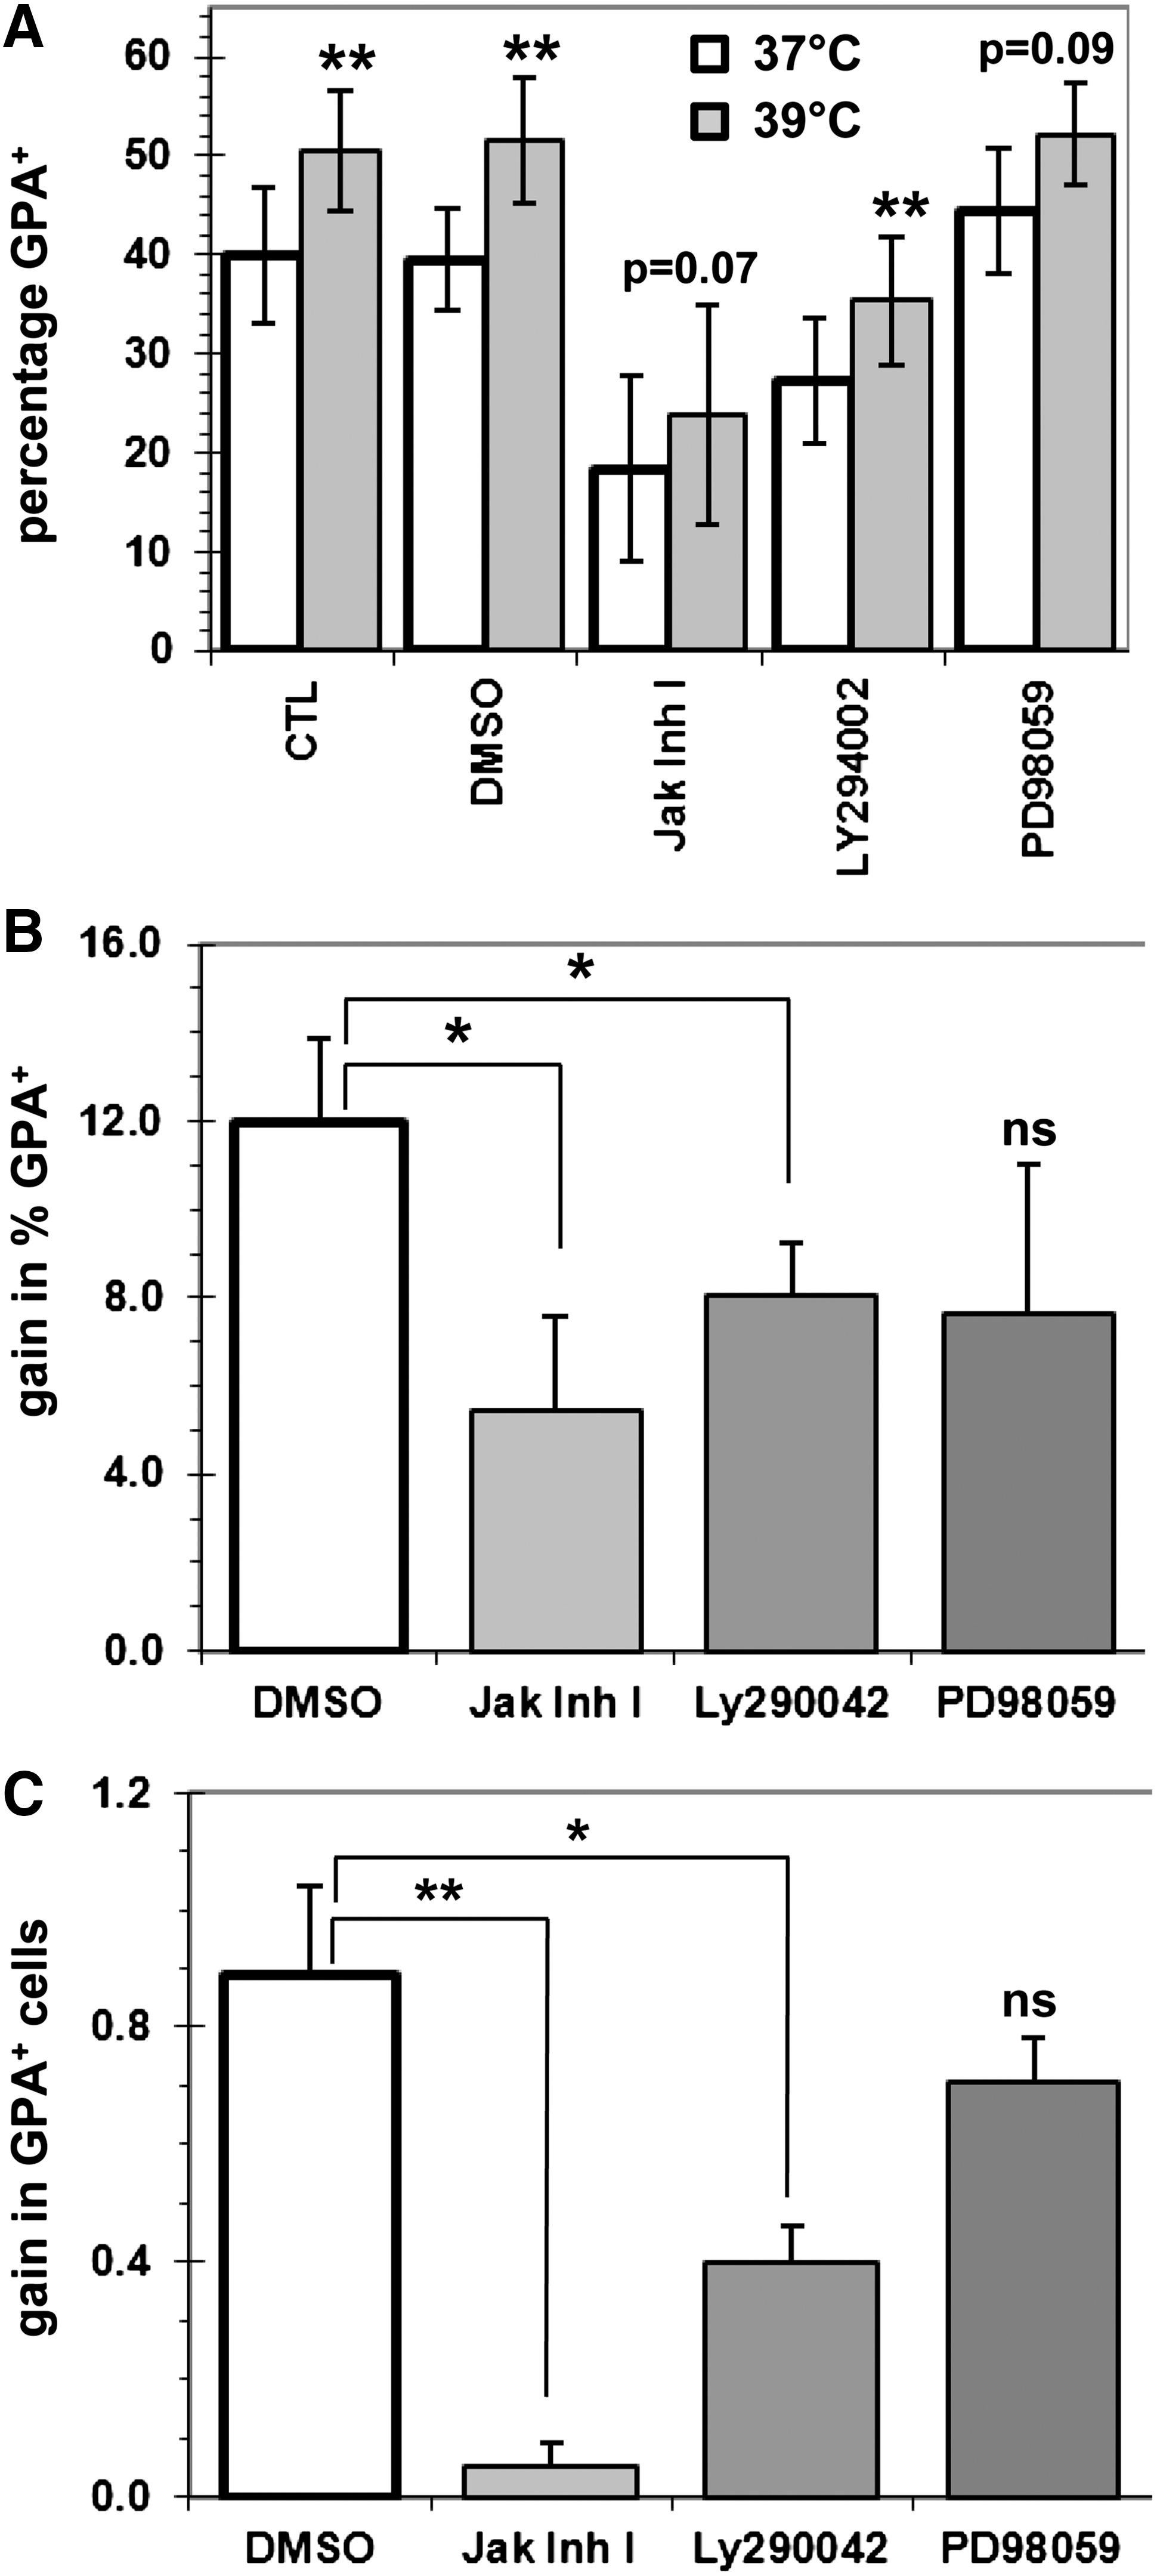
MH-mediated accelerated erythroid development is mediated in part by the JAK/STAT and phosphoinositide 3-kinase (PI3K)/AKT pathways. CD34+ cells were first expanded for 4 days at 37°C, and then cultures were treated for 2 days with DMSO or 20 μM of each inhibitor and incubated at 37°C or 39°C.
GATA-1 transcriptional activity is increased in UT7/EPO cells incubated under MH
Zhao and colleagues previously demonstrated that EPO activation of the transcription factor GATA-1 is mediated in large part by the PI3K/AKT axis [28]. Given the increased phosphorylation of AKT, we investigated the impact of MH on the transcriptional activity of GATA-1 using a luciferase reporter plasmid containing the αIIb promoter responsive to GATA-1 [25,29]. Forty hours post-transfection, UT7/EPO cells were incubated for 1 to 4 h at 39°C before luciferase assays. A slight, but nonsignificant increase in luciferase activity was noticed after 1 h at 39°C, whereas a significant 2.5-fold (P<0.05) increase was obtained after 4 h (Fig. 7A).

Impact of MH on the transcriptional activity of GATA-1 and on the Bcl-XL expression.
Next, we sought to determine whether Bcl-XL levels would be increased in erythroblasts incubated at 39°C, given the results suggesting increased activation of GATA-1 and STAT5 under MH. Intracellular levels of Bcl-XL in GPA+ cells incubated overnight with EPO (0, 0.1 or 1 U/mL) were indeed increased at 39°C (Fig. 7B, cumulative mean of +14%, P=0.01). The increased expression of Bcl-XL in GPA+ cells provides further support that GATA-1 and STAT5 activities are increased under MH.
MH-mediated promotion of erythroid development is dependent on ROS
While the previous results indicated that MH promoted erythropoiesis through the upregulation of known key erythroid regulators, it remains unclear on how these pathways are activated by MH. Hence, we investigated the possibility that ROS could mediate the effects of MH, since ROS-inducing agents can promote proliferation through the activation of signaling molecules [15,16].
CD34+ cells expanded for 4 days at 37°C were used as starting material, as done previously. Cells incubated under MH consistently had greater intracellular ROS levels compared to controls (cumulative mean increase of 30%, P=0.016). Indeed, MH raised ROS levels, whether it was a short or a long exposition (Fig. 8A, left graph). In addition, ROS levels upon H2O2 challenge in cells incubated 24 h under MH were also greater in all 4 independent experiments (Fig. 8A, right graph). The latter results suggest that the ROS-buffer capacity of cells incubated under MH is significantly diminished likely due to the already increased intracellular ROS levels.
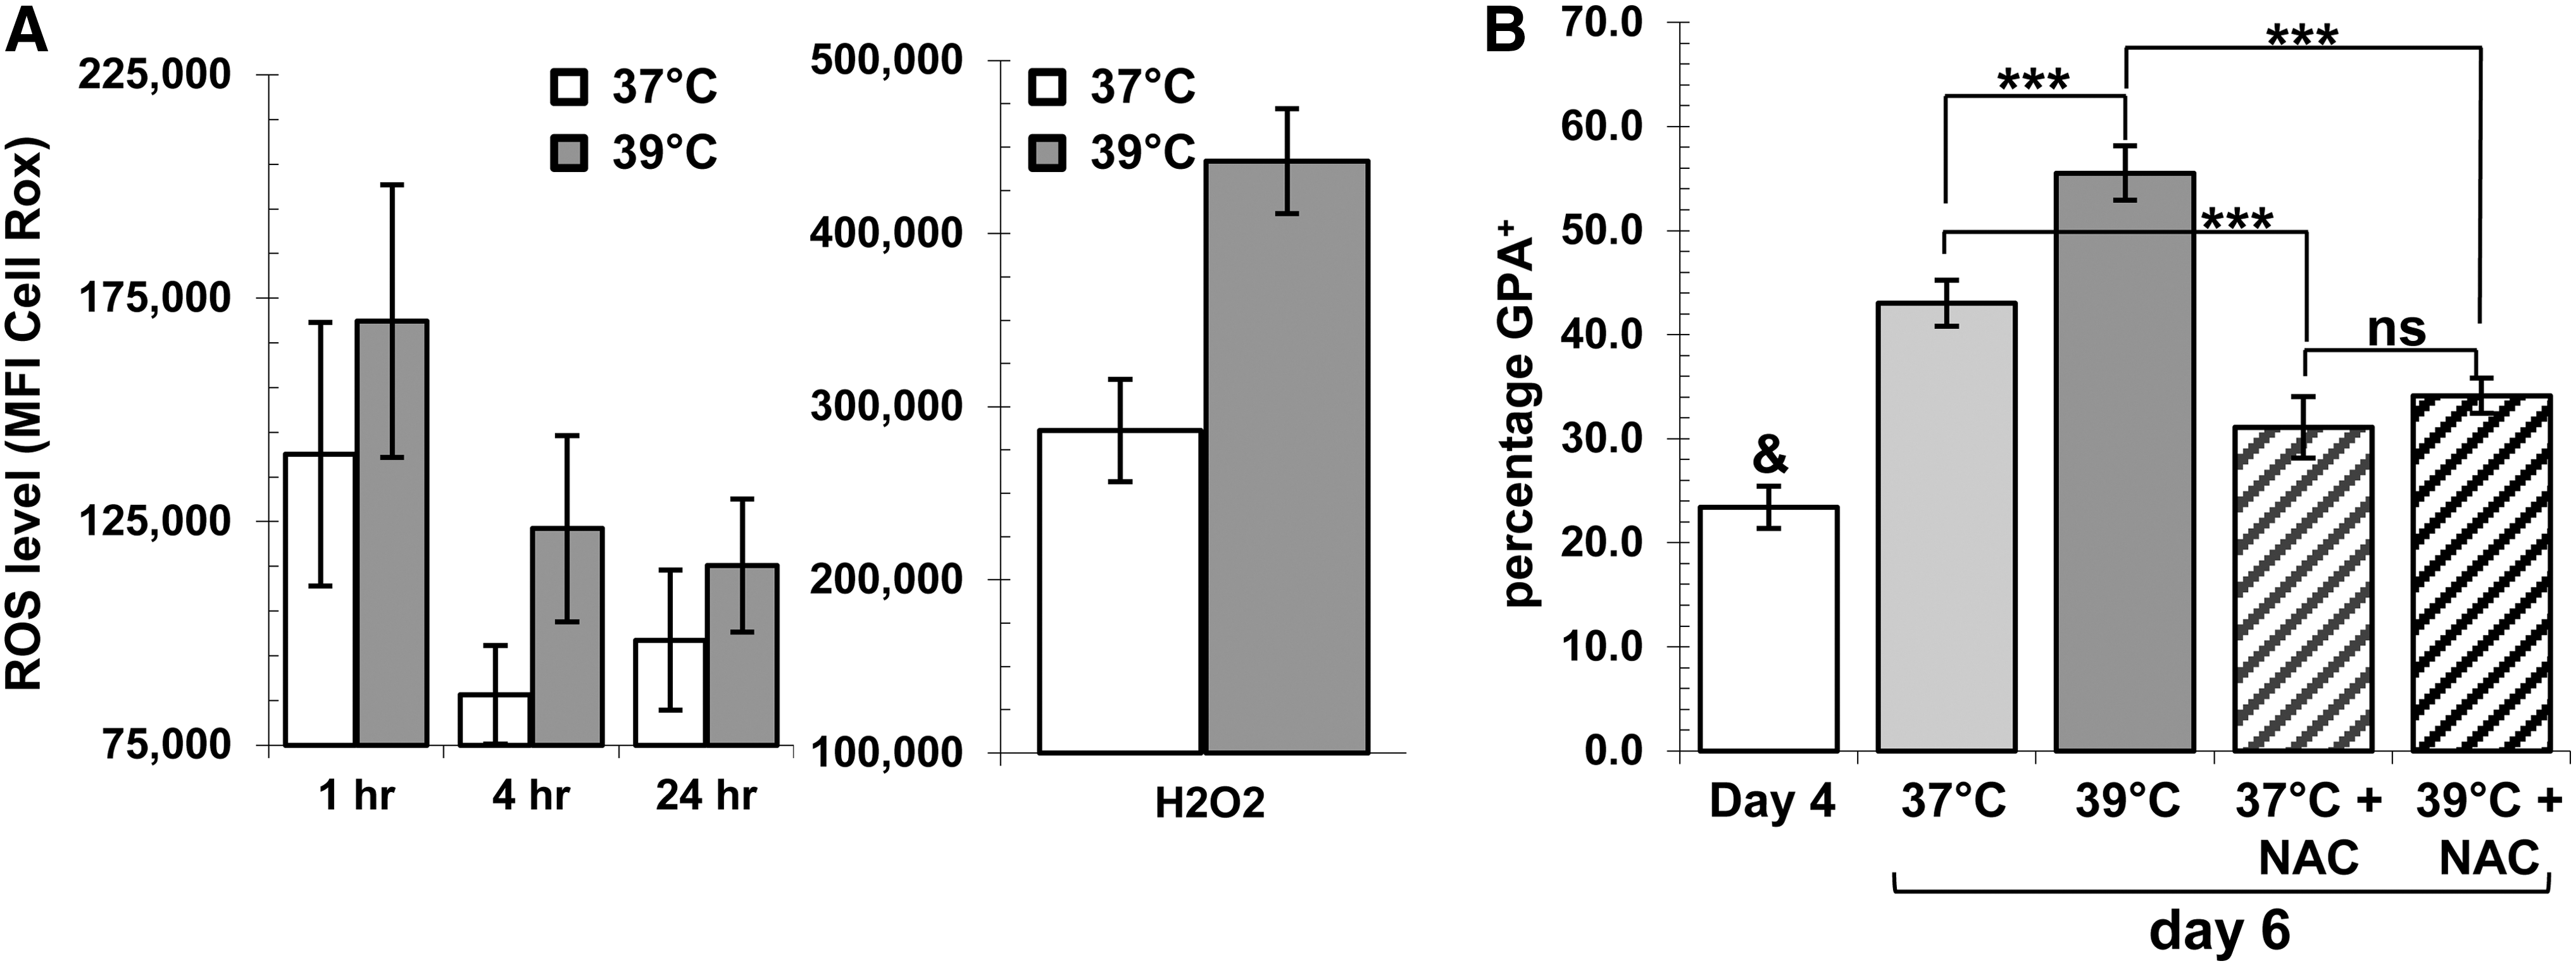
Impact of MH on Reactive Oxygen Species (ROS) levels in GPA+ cells.
The expanded cells were then pretreated 2 h with the antioxidant NAC to probe the importance of ROS levels on MH-accelerated erythroid development. Addition of NAC reduced, but did not block erythroid development at both incubation temperatures (Fig. 8B). However, the promotion of erythroid cell development induced by MH was completely abrogated by NAC, as the percentage of GPA+ cells at 39°C is similar to that obtained at 37°C (Fig. 8B). Together, these results suggest that modulation of ROS levels by MH might be the initial event responsible for the increased and accelerated development of erythroid cells.
Discussion
The principal finding of this work is that MH strongly synergizes with EPO to promote the development of red blood cells from multipotent HPCs in ex vivo culture. The principal impacts of MH on erythroid cell cultures were increased cell expansion and accelerated erythroid differentiation and maturation.
The growth and differentiation kinetics of multiple hematopoietic lineages, including erythroid, has previously been shown to be modulated by various physical parameters, including oxygen tension [30], pH [31], and nitric oxide [32]. The small increment of temperature under MH had no impact on the pH (7.27±0.02) of the culture medium and should have no effect on the level of oxygen saturation given the level used here (air; 21% O2). Thus, the strong impact on erythropoiesis reported herein is a direct consequence of MH. Consistent with this, several investigations have shown that the temperature of incubation can impact the growth and differentiation of primary bone marrow cells [20,33 –35].
The rise in cell expansion is explained largely by the potent impact of MH on the cell cycle entry of the quiescent- and G1-resting CD34+ cells (2.4-fold increase) in the early phase of culture. Cell cycle entry of G0 and G1 cells is regulated by D-type cyclins, which associate with cyclin-dependent kinases [36,37]. Han et al. previously demonstrated that MH could induce cyclin D1 expression in quiescent fibroblasts independent of serum through multiple Ras-signaling pathways [38]. Whether similar events occur in G0/G1 HPCs cultured under MH remains to be determined in future studies. In addition, we also showed increased intracellular ROS levels in cells incubated at 39°C. In recent years, ROS have been implicated in cell cycle entry of hematopoietic cells [16,17,19,39]. Interestingly, Juntilla et al. recently reported that loss of both AKT1 and AKT2 in murine hematopoietic cells resulted in reduced ROS levels and increased quiescence [39]. These results are consistent with ours that increased ROS levels were associated with increased AKT phosphorylation and increased proliferation.
In the body, erythropoiesis is primarily regulated by the levels of EPO, a glycoprotein hormone secreted in the kidney and the liver. Binding of EPO to its receptor triggers the activation of several signaling pathways, including JAK2/STATs, PI3K/AKT, and Ras/MAPK, which promote erythroid cell development (reviewed in [7]). The results presented here demonstrate that MH enhances activation of these molecules through phosphorylation (AKT, ERK1/2, and STAT5) in the absence or presence of EPO. Moreover, promotion of erythroid development was dependent on MH-increased ROS levels, since addition of NAC abolished this effect. These results suggest that the rise in ROS levels precede or is required for the activation of molecules downstream of the EPO-R. In support of this, others have shown that ROS induction by H2O2 induces the phosphoactivation of Jak2, Stat5, Erk1/2, and Akt in 32Dcl3 cells [16], and we confirmed that addition of H2O2 to cytokine-deprived primary GPA+ cells induces the rapid phosphoactivation of AKT, STAT5, and ERK1/2 (data not shown). Taken together, these results provide a rational molecular explanation for the strong synergistic activity observed between EPO and MH, and for the low potential of MH to support erythroid development in the absence of EPO. These assertions are corroborated by the results obtained with some of the pharmacological agents tested, which abolished in part or in full the impact of MH on erythroid differentiation.
The observed increased activation of STAT5 under MH is highly significant, given its well-established role in supporting and promoting erythropoiesis. Indeed, strong activation of STAT5 through phosphorylation correlates intimately with erythroid differentiation in CD34+ cell cultures, and expression of a constitutively activated (CA) form was shown to increase cell expansion and erythroid differentiation in primary cultures [40,41]. Moreover, overexpression of CA-STAT5 or Bcl-XL in CFU-E-enriched human cells was also shown to support the expansion of erythroid progenitors and their maturation with or without EPO [41]. GATA-1, another transcription factor key to erythroid development, was also found to be positively modulated by MH. Consistent with the impact of MH on STAT5 phosphorylation and on GATA-1 transcriptional activity, Bcl-XL protein levels were found increased in GPA+ erythroblasts maintained at 39°C under various concentrations of EPO.
The impact of fever on the levels of red blood cells in human remains poorly characterized at this time. One study studying the effect of WBH (40.5°C or 41.8°C) in canine reported no significant differences [3]. The present study proposes that erythropoiesis may as megakaryopoiesis respond to the MH stimulus. Just recently, Giarratana et al. reported the first transfusion of red blood cells produced in culture [42]. The cost associated with such procedure is, however, a significant challenge that remains to be solved before it can be integrated by blood agencies. Certainly, transient [21] or constitutive incubation of ex vivo red blood cell culture production protocols under MH represents an interesting avenue to perhaps raise and reduce the efficiency of such process, respectively.
Footnotes
Acknowledgments
We would like to thank Dr. Adam N. Goldfarb for generously providing the PGL3αIIb plasmid. The authors also wish to thank Carl Simard for his precious technical help for setting up the fluorescent barcoding technique and Dr. Sonia Neron for helpful discussions and advice.
Author Disclosure Statement
The authors have no competing financial interests to disclose.