
Abstract
The stemness state is characterized by self-renewal and differentiation properties. However, stem cells are not able to preserve these characteristics in long-term culture because of the intrinsic fragility of their phenotype easily undergoing senescence or neoplastic transformation. Furthermore, although isolated from the same original tissue using similar protocols, adult stem cells can display dissimilar phenotypes and important cell clone/species contamination. Finally, the lack of a clear standardization contributes to complicate the comprehension about the stemness condition. In this context, cell lines displaying a particularly stable phenotype must be identified to define one or multiple benchmarks against which other stem cell lines could be reliably assessed. The present paper demonstrates that it is possible to isolate from the rat dental pulp a stem cell line (MUR-1) that does not display neoplastic transformation in long-term culture. MUR-1 cells stably express a broad range of stemness markers and are able to differentiate into adipogenic, osteogenic, chondrogenic, neurogenic, and cardiomyogenic lineages independently of the culture passages. Moreover, serial in vitro passages have not changed their immunophenotype, proliferation capacity, or differentiation potential. The uniqueness of these characteristics candidates MUR-1 as a model to reliably improve the understanding of the mechanisms governing the stem cell fate in the same as well as in other stem cell populations.
Introduction
T
In the last decade, stem cells have been identified in almost all body tissues [4], from which they have been isolated based on their intrinsic characteristics of self-renewal and potency. Among others, adult mesenchymal stem cells (MSCs) have attracted great attention for their ability to generate different cell lineages [5 –7], fueling the assumption that they could be the panacea to regenerate all injured tissues. Nevertheless, the clinical worthiness of MSCs to repair injured organs remains a chimera. In fact, owing to the poor knowledge of some MSCs' intrinsic features together with the inadequacy of current handling and engraftment protocols, clinically reliable cell treatments are still lacking.
In mammals, MSCs are segregated in particular tiny regions (niches) in which the microenvironment governs their quiescence, self-renewal, and/or commitment [8]. Each niche is thus responsible for MSC features and behavior in terms of growth and differentiation potential. In bone marrow, MSCs represent only a small percentage (0.5%–10% depending on the anatomical site) of the total cell population [8 –10] and are often hardly identifiable for their morphological and biochemical camouflage with the differentiated surroundings [8,11]. Moreover, even if correctly isolated, MSCs are not able to retain their stemness condition when cultured in vitro for long term [12], very likely because of the lack of niche control. Consistently, stem cell primary cultures undergo senescence, and their capabilities of self-renewal and multi-potency are faded by an innate drift toward commitment linked to in vitro conditions [13,14]. On the other hand, MSCs, when apparently not affected by senescence after prolonged in vitro culture, may acquire cytogenetic abnormalities prompting unwanted neoplastic transformations [15].
Furthermore, although isolated from the same tissue following identical protocols, primary MSC cultures can display dissimilar phenotypes, corresponding to different stages of cell immaturity along the differentiation pathway [16 –18] and/or important contamination problems [13,19 –24]. Consistently, similarly to the Hindu “Blind men and an elephant” tale [25], different investigators have described the same stem cell population using a plethora of often nonspecific Cluster of Differentiations markers. As result, the lack of standardized procedures in stem cell research [26] confuses and complicates the comprehension about the stemness condition, consequently frustrating the regenerative medicine philosophy itself. On this evidence, it is of paramount importance to identify populations that can be used as benchmarks to validate further advancements in stem cell research. In this context, the aim of the present study has been to verify the phenotypic stability in long-term culture and the capability to differentiate upon specific stimuli of a stem cell population (MUR-1, from latin Mòrsus/Múrsus=muzzle) isolated from the dental pulp of rat continuously growing incisors. Indeed, the results have shown that MUR-1 cells are adult MSCs characterized by geno/phenotypical stability and nontumorigenicity in long-term culture. These characteristics candidate them as a benchmark in stemness/differentiation studies as well as to assess the potency of other stem cell populations.
Materials and Methods
Cell isolation and purification
Dental pulp stem cells (DPSCs) were isolated from mandible incisive teeth of 5-month-old male Wistar rats (Charles River, Monza, Italy). The dental pulp was gently removed through the apical foramen. The resulting tissue was washed twice in phosphate-buffered saline (PBS) and centrifuged for 5 min at 1,000 rpm; subsequently, the dental pulp was digested, washed, and seeded as previously described [27]. After 24 h, nonadherent cells were removed, whereas the remaining cells were cultured in RPMI-1640 supplemented with 10% fetal calf serum, 100 U/mL penicillin G, 40 μg/mL gentamicin sulfate, and 2.5 μg/mL amphotericin B (all from Sigma-Aldrich, St Louis, MO) at 37°C in a humidified 5% CO2 atmosphere. The final clone selection was conducted by serial dilutions in 96-well plates. Only wells enclosing homogeneous population were considered for further expansion. Among them, one clone (named MUR-1) was chosen for subsequent experimentations.
MUR-1 culture conditions and cryopreservation
Cells were cultured in 75-cm2 TPP® flasks (TPP AG, Switzerland) as above described, without any feeder layer. Cells were harvested twice a week with 0.25% trypsin solution (Sigma-Aldrich). A standard 1:4 dilution ratio was used for cell expansion, while MUR-1 was cryopreserved in the same culture medium added of 10% DMSO.
FACS analysis, cell growth kinetics, and colony-forming units fibroblastoid assay
Cell volume and morphological complexity were assessed by a FACScalibur (Beckton Dickinson Italia SpA, Buccinasco, Italy) instrument, after suspension at the density of 5×10⁵ cells/mL. Doubling time (DT) of the cell line was calculated as previously described [28] in cells (1×10⁵) seeded into 25-cm2 flasks and cultured in a complete medium. The clonogenicity of DPSCs was determined by means of the Colony-Forming Units Fibroblastoid (CFU-F). Cells were seeded in 25-cm2 flasks at the density of 2, 5, or 10 cells/cm2. After 2 weeks, the adherent cells were toluidine blue-stained, and macroscopic colonies were counted. All experiments were performed in triplicate.
Light and electron microscopy
MUR-1 cell morphology in adherent conditions was investigated in cells cultured on coverslips (DelChimica, Napoli, Italy), stained with hematoxylin/eosin, and observed by light microscopy. For electron microscopy, cells were processed as previously described [29].
Karyotype analysis
Chromosome analysis was performed every 6 months of culture by adopting a conventional G-banding karyotype protocol. Briefly, cells undergoing active division were blocked at metaphase by colchicine and actinomycin D, detached from the growth surface by trypsin–EDTA, and subsequently swollen by exposure to a hypotonic KCl solution. Cells were then fixed in methanol/acetic acid solution and glass-mounted, and finally metaphase dishes were identified by a light microscope and photographed. Chromosomes were identified according to the Committee for a Standardized Karyotype of Rattus norvegicus [30].
mRNA and protein expression analysis
Total RNA was extracted with the TRI Reagent solution (Sigma-Aldrich) according to the manufacturer's instructions. One microgram of RNA was purified from contaminating DNA through a Deoxyribonuclease I kit and retrotranscribed with Random Hexamer Primer according to the M-MuLV Reverse Transcriptase manufacturer's instructions (all reagents were from Fermentas International, Inc., Burlington, Canada). PCRs were carried out using 2.5 μL cDNA, 2.5 μL 10×PCR Buffer II (Roche Applied Science, Indianapolis, IN), 1.5 μL 25 mM MgCl2, 0.5 μL 10 mM dNTP (Fermentas), 0.75 μL of each specific 10 μM primer (Sigma-Genosys), and 0.05 U/μL Taq DNA Polymerase (Fermentas) to a final volume of 25 μL. Specific primer sequences are summarized in Table 1. Amplification products were separated by agarose gel electrophoresis. DNA bands were stained with ethidium bromide and digitally captured by Kodak ImageStation. As positive controls, cDNAs extracted from brain [for Thy1, cKit, Oct4, Stella, stage-specific embryonic antigen 1 (SSEA1), tubulin β3 (Tubb3), and Sox2], fetal brain [myogenic enhancer factor 2C (MEF2C)], heart [GATA4, alpha cardiac actin (ACTC1), connexin 43 (CX43), and ADRB1], pancreas (Islet1), lung [ADRB2, Fragilis1, nontissue-specific alkaline phosphatase (ALPL), and HLA-DR], and liver [histone deacetylase 6 (HDAC6)] were used.
Thy1, CD90; c-Kit, CD117; SSEA1, stage-specific embryonic antigen 1; ALPL, alkaline phosphatase, tissue-nonspecific; HDAC6, histone deacetylase 6; MEF2C, myogenic enhancer factor 2C; Adbr1, adrenergic receptor β1; Adbr2, adrenergic receptor β2; ACTC1, alpha cardiac actin; CX43, connexin 43; TubB3, tubulin β3.
Protein expression was assessed by immunocytochemistry analysis. MUR-1 cells were cultured on poly-D-lysine-coated coverslips, incubated with specific primary antibodies overnight at 4°C and then with appropriate secondary antibodies for 1 h at room temperature. Primary antibodies are reported in Table 2. Image acquisition of CD90, CD117, YAP1, vimentin, Nkx2.5, CD45, and CD34 expression was carried out with a LSM 510 confocal laser microscopy system (Zeiss, Jena, Germany), whereas fetal liver kinase 1 (FLK1), alpha smooth muscle actin (αSMA), cMyc, CD105, and GATA4 expression was visualized under a Leica DRMB microscope equipped with a digital camera.
FLK1, fetal liver kinase or KDR (kinase-insert domain receptor) or VEGFR2; ASMA, α smooth muscle actin; YAP1, YES-associated protein.
Differentiation culture conditions
The adipogenic differentiation was induced by growing MUR-1 cells in RPMI-1640 containing 10% fetal calf serum, 1.7 μM insulin, 1 μM dexamethasone, and 0.5 mM methylisobutylxanthine (Sigma-Aldrich) [31]. After 5 days of induction, cells were fixed with 4% paraformaldehyde for 20 min, washed with PBS, incubated with Nile Red (Sigma-Aldrich) for 10 min to emphasize lipid vesicles occurrence [32], and then observed by a confocal laser microscope. For electron microscopy, differentiated cells were processed as previously described [29].
Osteogenic differentiation was induced in MUR-1 cells cultured in a complete medium supplemented with 10 mM β-glycerophosphate, 0.05 mM ascorbic acid, and 100 nM dexamethasone [33]. After 3 weeks, osteogenic differentiation was evaluated by an alkaline phosphatase staining kit (BioOptica Milano SpA, Milano, Italy).
MUR-1 chondrogenic differentiation was induced by a complete medium supplemented with 10 ng/mL TGF-β3, 0.025 mM ascorbic acid, and 100 nM dexamethasone [34]. After 3 weeks, differentiated cells were highlighted with toluidine blue staining as described elsewhere [35].
MUR-1 neuroglial differentiation was induced by pretreating cells with 1 mM β-mercaptoethanol in a complete medium for 24 h and then with 35 ng/mL retinoic acid for 72 h. Subsequently, MUR-1 cells were grown in a complete medium supplemented with 5 ng/mL platelet-derived growth factor, 10 ng/mL basic fibroblast growth factor, 252 ng/mL glial growth factor, and 14 μM Forskolin for 2 weeks [36]. The induction of the neuroglial phenotype was confirmed by specific immunostaining for neuron growth-associated protein 43 (GAP43-Goat, 1:100; Santa Cruz Biotechnology, Santa Cruz, CA), glial fibrillary acidic protein (GFAP—Mouse, 1:50; DakoCytomation, Dako Italia SpA, Milano, Italy), and S100 protein (Rabbit, 1:400; Sigma-Aldrich). MUR-1 cells without differentiation factors were prepared in the same conditions and used as negative controls.
Myocardial differentiation was induced through direct coculture of MUR-1 with murine neonatal cardiomyocytes in a complete medium for 7 days. Neonatal cardiomyocytes were obtained as described elsewhere [37] and plated at the concentration of 5×10⁴ cells/cm2 onto fibronectin– (2 μg/mL)–laminin (0.2%) precoated glass chamber slides (BD Biosciences, San Jose, CA). Twenty-four hours later, MUR-1 cells, previously labeled with 1,1′-dioctadecyl-3,3,3′3′-tetramethylindocarbocyanine perchlorate (DiI, Vybrant™; Molecular Probes, Life Technologies Italia, Monza, Italy), were seeded onto cardiomyocytes at a 1:5 ratio. MUR-1 without cardiac cells and vice versa were prepared in the same conditions and used as controls. The induction of myocardial differentiation was assessed by evaluating sarcomeric α-actinin (Mouse, 1:700; Sigma-Aldrich), CX43 (Rabbit, 1:100; Sigma-Aldrich), and Troponin I (Rabbit, 1:50; Santa Cruz Biotechnology) expression.
Colony formation and tumorigenicity assay
Soft-agar assay was carried out to evaluate the possibility that MUR-1 cells could undergo anchorage-independent growth. Briefly, 1×10⁵ MUR-1 cells were seeded into a 10-mm Petri dish in a 0.3% agar-complete medium. Cells were cultured for 21 days, and then colony formation was assessed by means of light microscopy. MUR-1 tumorigenicity was evaluated in vivo by injecting 1.0 or 10×106 cells between the shoulder blades in 6 male Wistar rats randomly divided into 2 groups. Animals were followed for 60 days, evaluating whether masses were developing in the injection area. At 10, 30, and 60 days, 1 rat for each group was anesthetized and sacrificed. Tissues surrounding the injection area were excised and processed for histological analysis by standard hematoxylin/eosin stain. The whole experimentation was performed according to the Ethics Committee of the University of Turin, Italy.
Statistical analysis
DT and CFU-F were expressed as arithmetical mean±standard deviation. DT results were analyzed with a 2-tailed paired t-test, whereas 1-way analysis of variance (ANOVA) and Newman-Keuls Multiple Comparison Test (for post-ANOVA comparisons) were used to evaluate the statistical significance of the CFU-F differences. All analyses were carried out with GraphPad Prism version 5.00 (GraphPad Software, San Diego, CA;
Results
CFU-F, growth kinetic, karyotype and morphological characteristics
Under light microscopy (Fig. 1A), adherent MUR-1 cells showed a fibroblastoid shape; after hematoxylin/eosin staining (Fig. 1B), they displayed an irregular and eosinophilic cytoplasm with a central round nucleus. Electron microscopy revealed a pale, eccentric, and irregularly shaped nucleus with one or more nucleoli located near the MUR-1 perinuclear cisternae (Fig. 1C, D). Chromatin was spread throughout the nucleus, except for a thin dense layer located immediately inside the perinuclear cisternae (Fig. 1D, E). The cytoplasm was rich in mitochondria and ribosomes predominantly associated with the endoplasmic reticulum (Fig. 1F, G). Yet, ultrastructural observation showed that the irregularities of the plasma membrane seen by light microscopy were due to small pseudopodia located all around the cells (Fig. 1C, H).
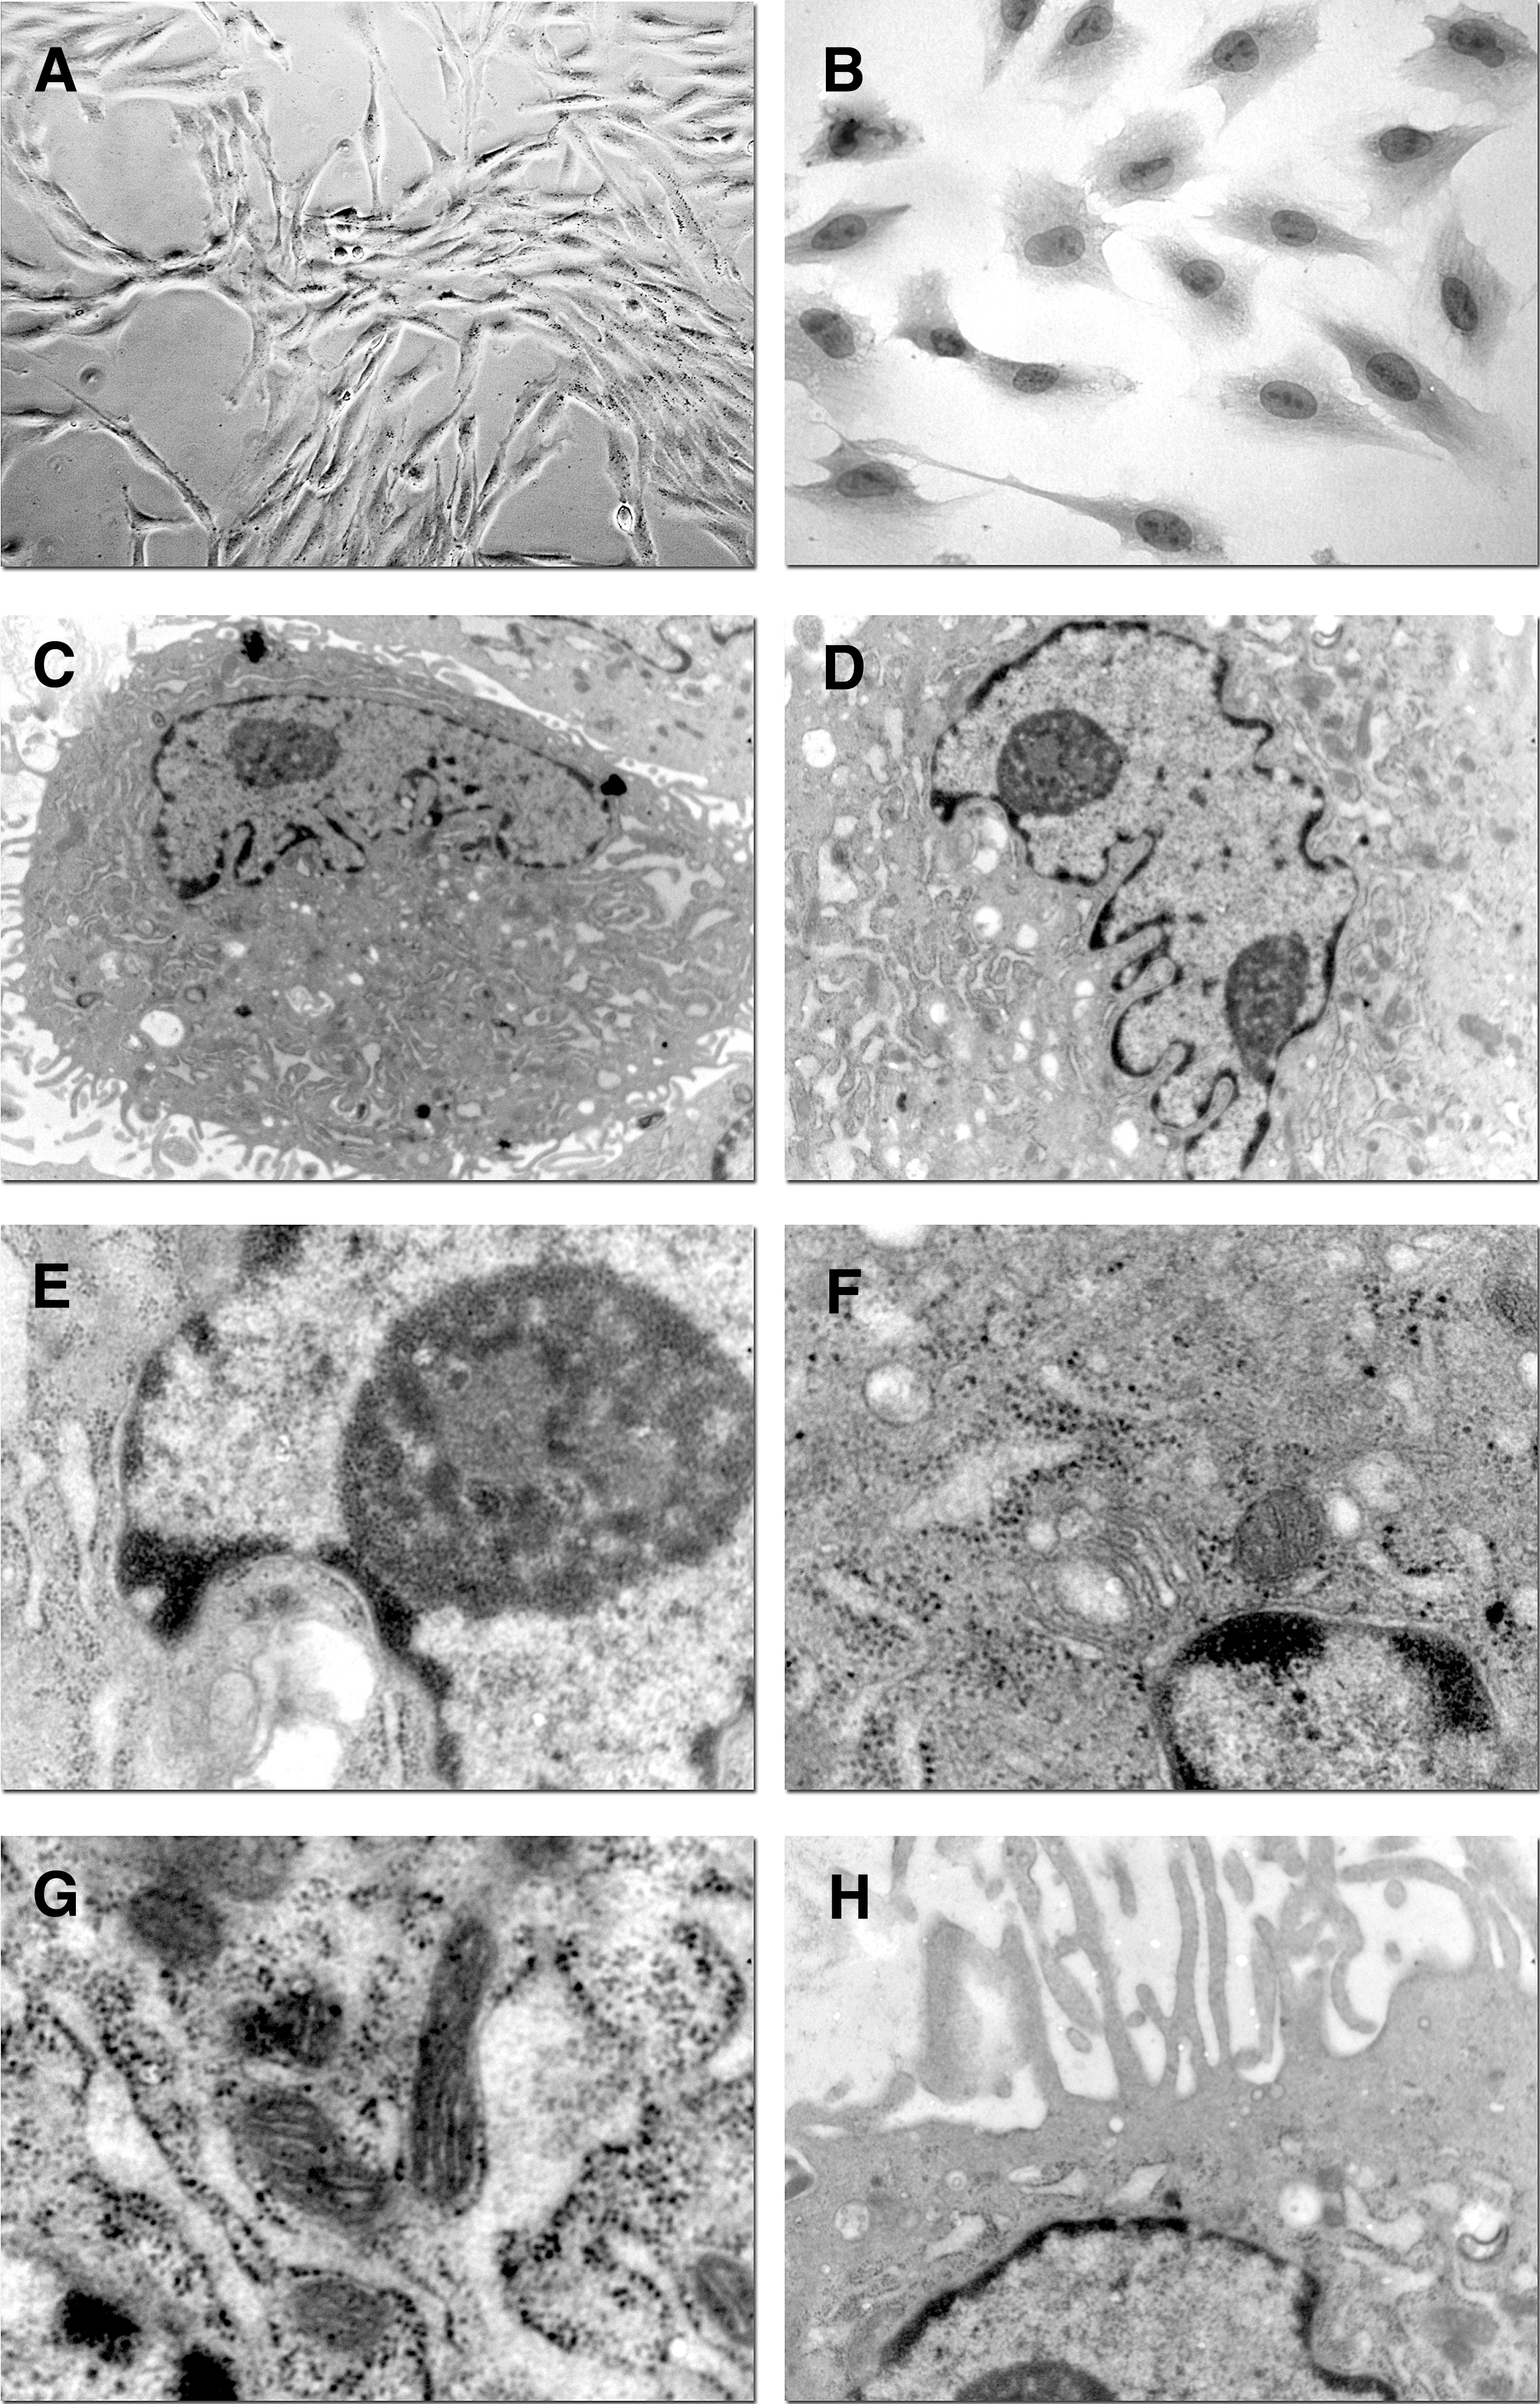
MUR-1 morphology.
MUR-1 cells were characterized by an estimated DT of 25.4±2.2 and 23.2±1.8 h at the exponential growth phase, when assessed after 30 (P30) and 200 (P200) culturing passages, respectively (P30 vs. P200, P=0.120). The frequency of CFU-F was proportional to the cell-seeding density (P=0.0028 and P=0.001 at P30 and P200, respectively). The CFU-F corresponding to 2, 5, and 10 cells/cm2 was 73.7±14.4, 179.7±23.7, and 250.0±55.9 for MUR-1 at P30, and 77.0±10.5, 147.3±26.8, and 256.7±43.8 for MUR-1 at P200, respectively (Fig. 2A). Results did not show any significant differences in terms of CFU-F between P30 and P200 passages. As evinced by the FACS analysis, MUR-1 was a population with homogeneous dimensions and morphological complexity (Fig. 2B). During the entire cell culture time, the G-banding cytogenetic analysis of MUR-1 cells did not reveal macroscopic chromosome alterations, if compared with the reference rat karyotype (Fig. 2C). In addition, cryopreservation did not affect MUR-1 characteristics, in accord to what already described [38].
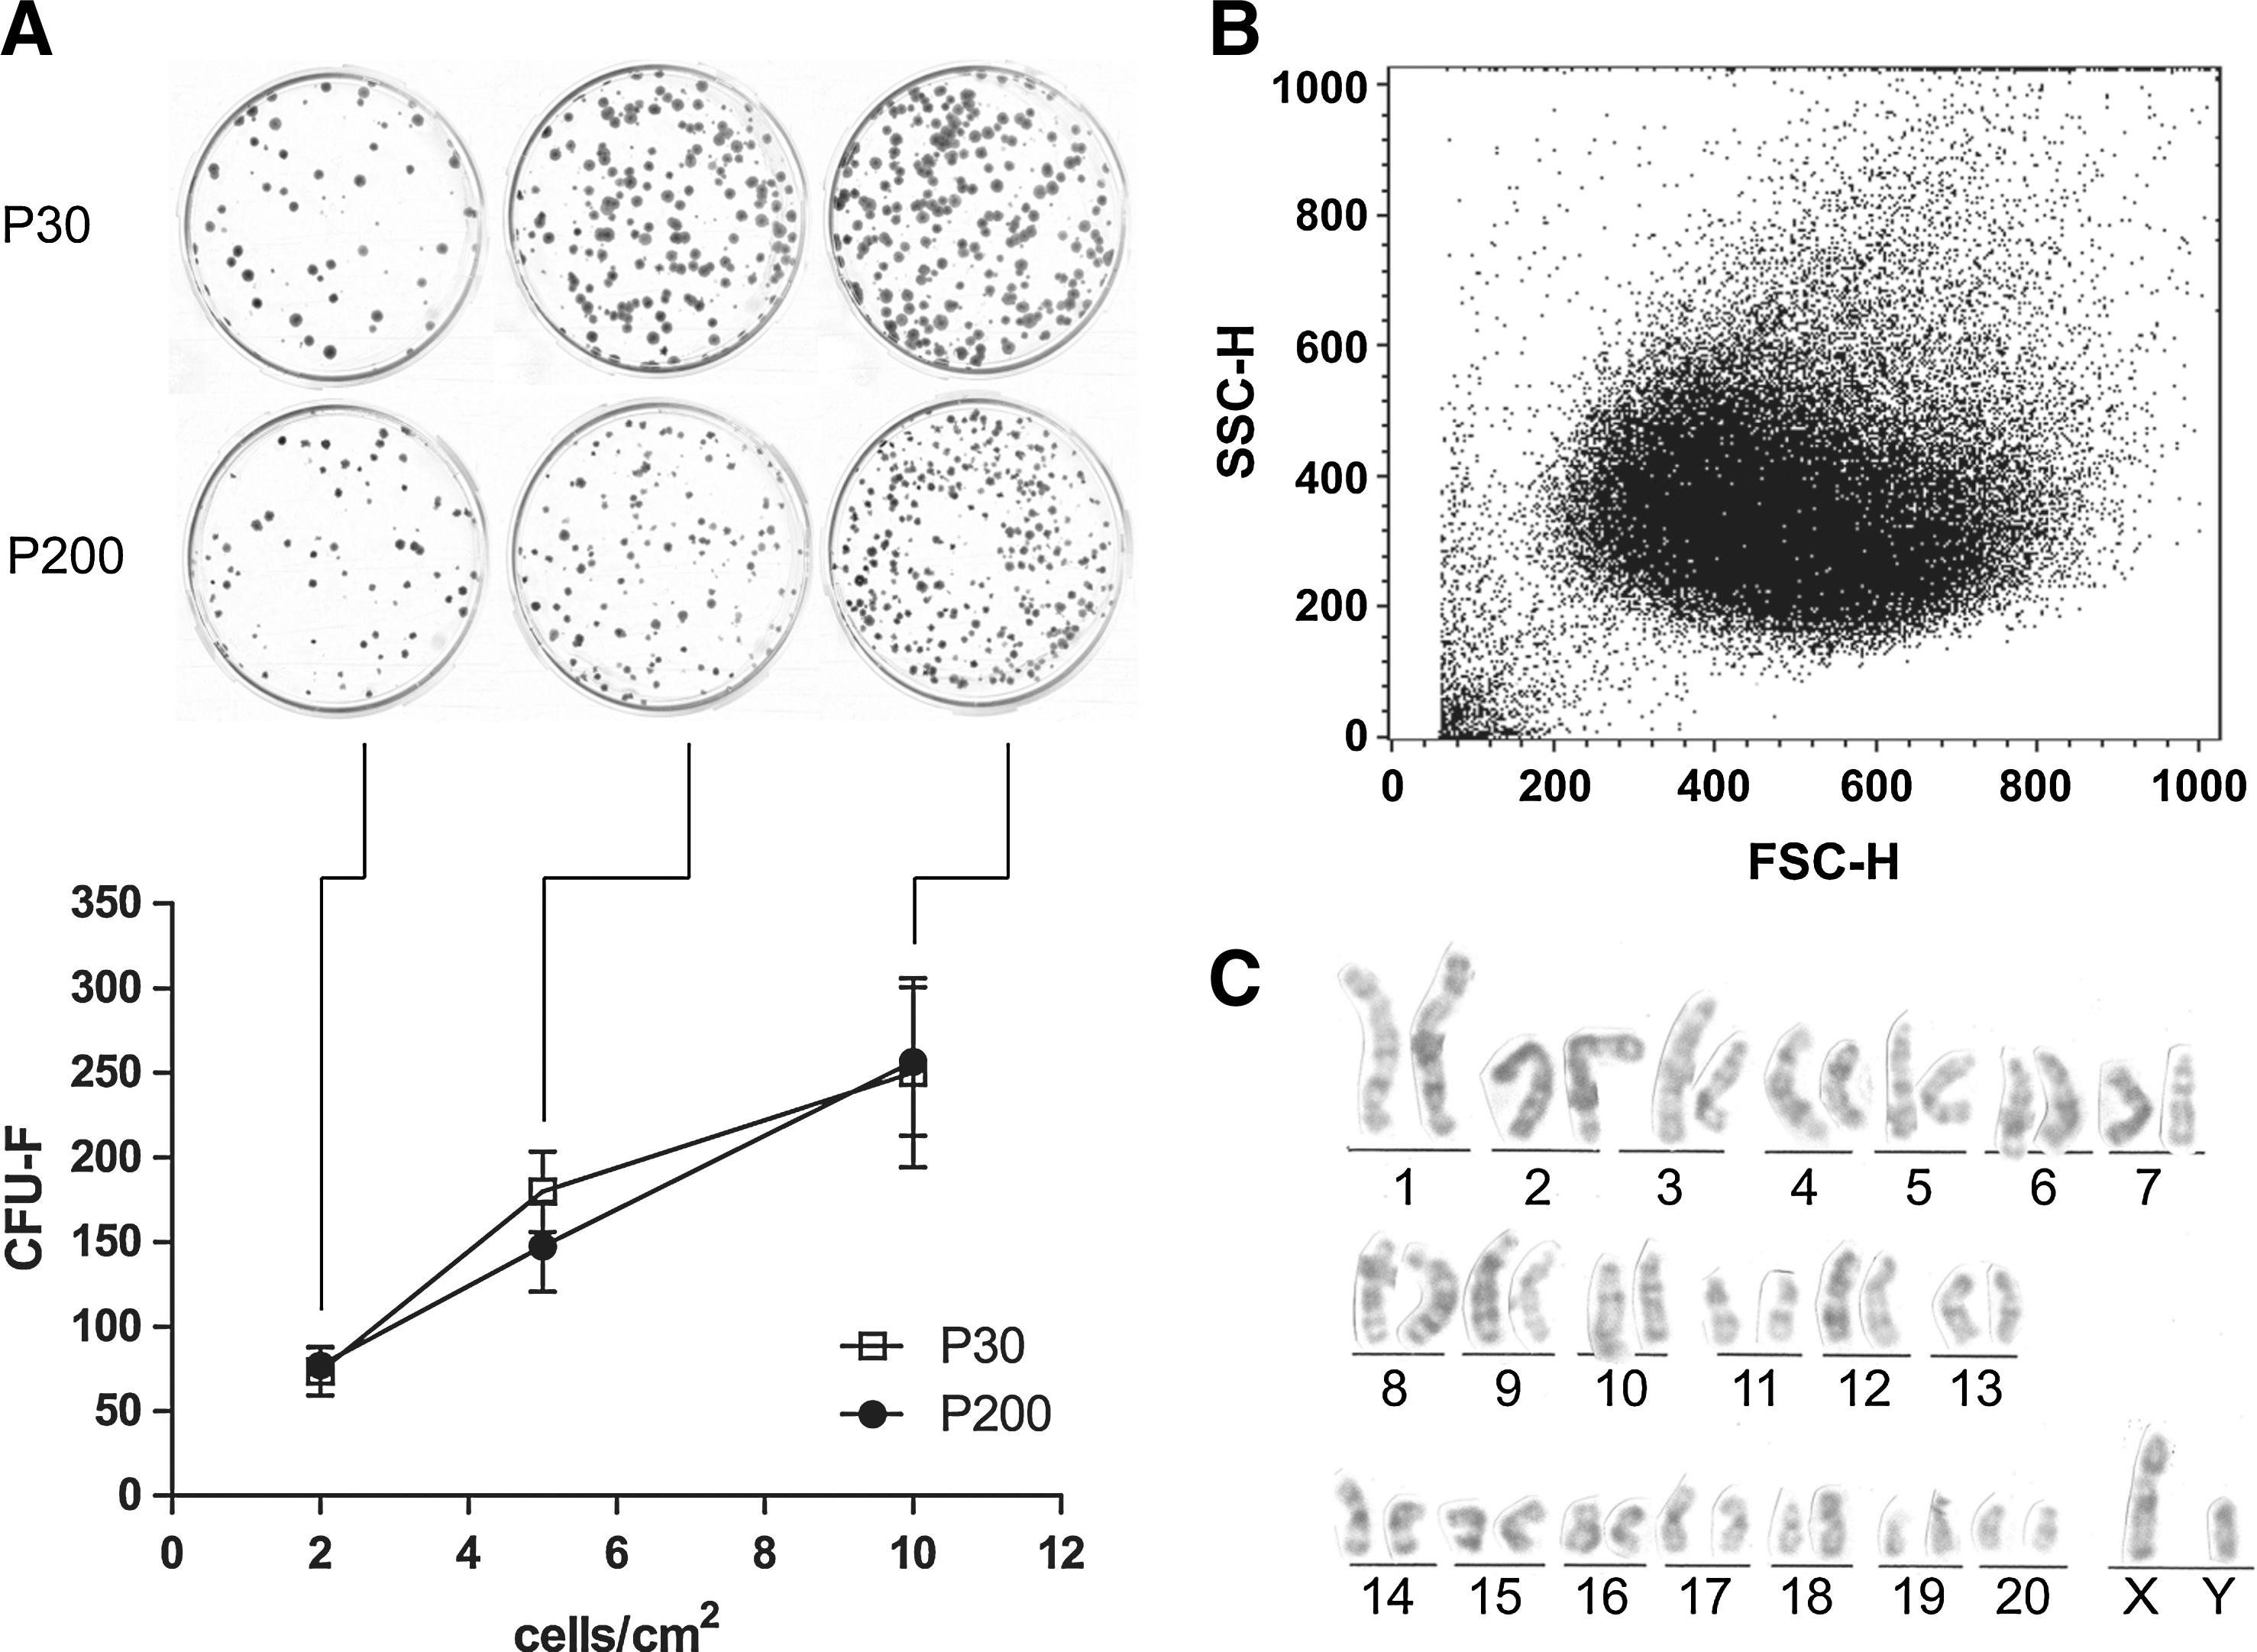
MUR-1 gross characteristics.
MUR-1 gene and protein expression
Analysis of mRNA expression (Fig. 3) revealed that MUR-1 cells transcribed several genes related to the embryonic/pluripotent-undifferentiated status as the transcription factor OCT4 (POU5F1), the membrane glycoprotein Thy-1 (CD90), the tyrosine-kinase receptor c-Kit (CD117), the developmental pluripotency-associated protein 3 (Stella), the SSEA1, the interferon-induced transmembrane protein 1 (Fragilis 1), and the HDAC6, but not the SRY-box2 transcription factor (SOX2). Contextually, commitment transcripts were present: MUR-1 cells expressed mRNAs encoding for the transcription factors GATA4 and MEF2C, as well as the cytoskeleton components ACTC1 and tubulin β3, the gap-junction CX43, and the receptor ADRB2, but they did not transcribe those for the ISL-1 transcription factor (islet-1), ADRB1 receptor, the ALPL, and the major histocompatibility complex HLA-DR.

MUR-1 mRNA expression. Specific amplicon bands are cropped. Left bands represent the positive controls, whereas right ones are MUR-1 samples. SSEA1, stage-specific embryonic antigen 1; ALPL, alkaline phosphatase, tissue-nonspecific; HDAC6, histone deacetylase 6; MEF2C, myogenic enhancer factor 2C; Adbr1, adrenergic receptor β1; Adbr2, adrenergic receptor β2; ACTC1, alpha cardiac actin; CX43, connexin 43; TubB3, tubulin β3.
At the protein level (Fig. 4), the expression of stem cell antigens CD90 and CD117 was further confirmed. Consistently, the presence of c-MYC transcription factor, TGFβRIII receptor Endoglin (CD105), FLK1 receptor (VEGFR2 or CD309), CX43, important transcription factors (NKX2.5, GATA4, and YAP1), intermediate filament vimentin, and αSMA was highlighted. MUR-1 cells did not express typical blood lineage commitment markers, namely CD34 and CD45.

MUR-1 antigenic phenotype by fluorescence and confocal laser microscopy. Nuclei are blue-stained, whereas specific antigen expression is highlighted in green or red. FLK1, fetal liver kinase or KDR (kinase-insert domain receptor) or VEGFR2; ASMA, α smooth muscle actin; YAP1, Yes-associated protein. All images were at 400×magnification with the exception of cMyc and CD105 (200×), and CD45 and CD34 (630×). Color images available online at
Plasticity of MUR-1 cells
Adequately treated MUR-1 cells have been able to successfully differentiate in precursors of different histotypes, also after prolonged culture (P200). After adipogenic stimuli, the presence of lipid-rich cells was detectable with the lipophilic Nile Red dye (Fig. 5A): indeed, ultrastructural observation indicated the presence of lipid droplets inside the cells (Fig. 5B). If compared with untreated MUR-1 cells (Fig. 5C), the chondrogenic medium led to the formation of round-shaped cell clusters characterized by a basophilic cytoplasm (Fig. 5D). Similarly, osteogenic stimulation induced the aggregation of clusters of alkaline phosphatase-stained round-shaped cells surrounded by a dense extracellular matrix (Fig. 5E, F).
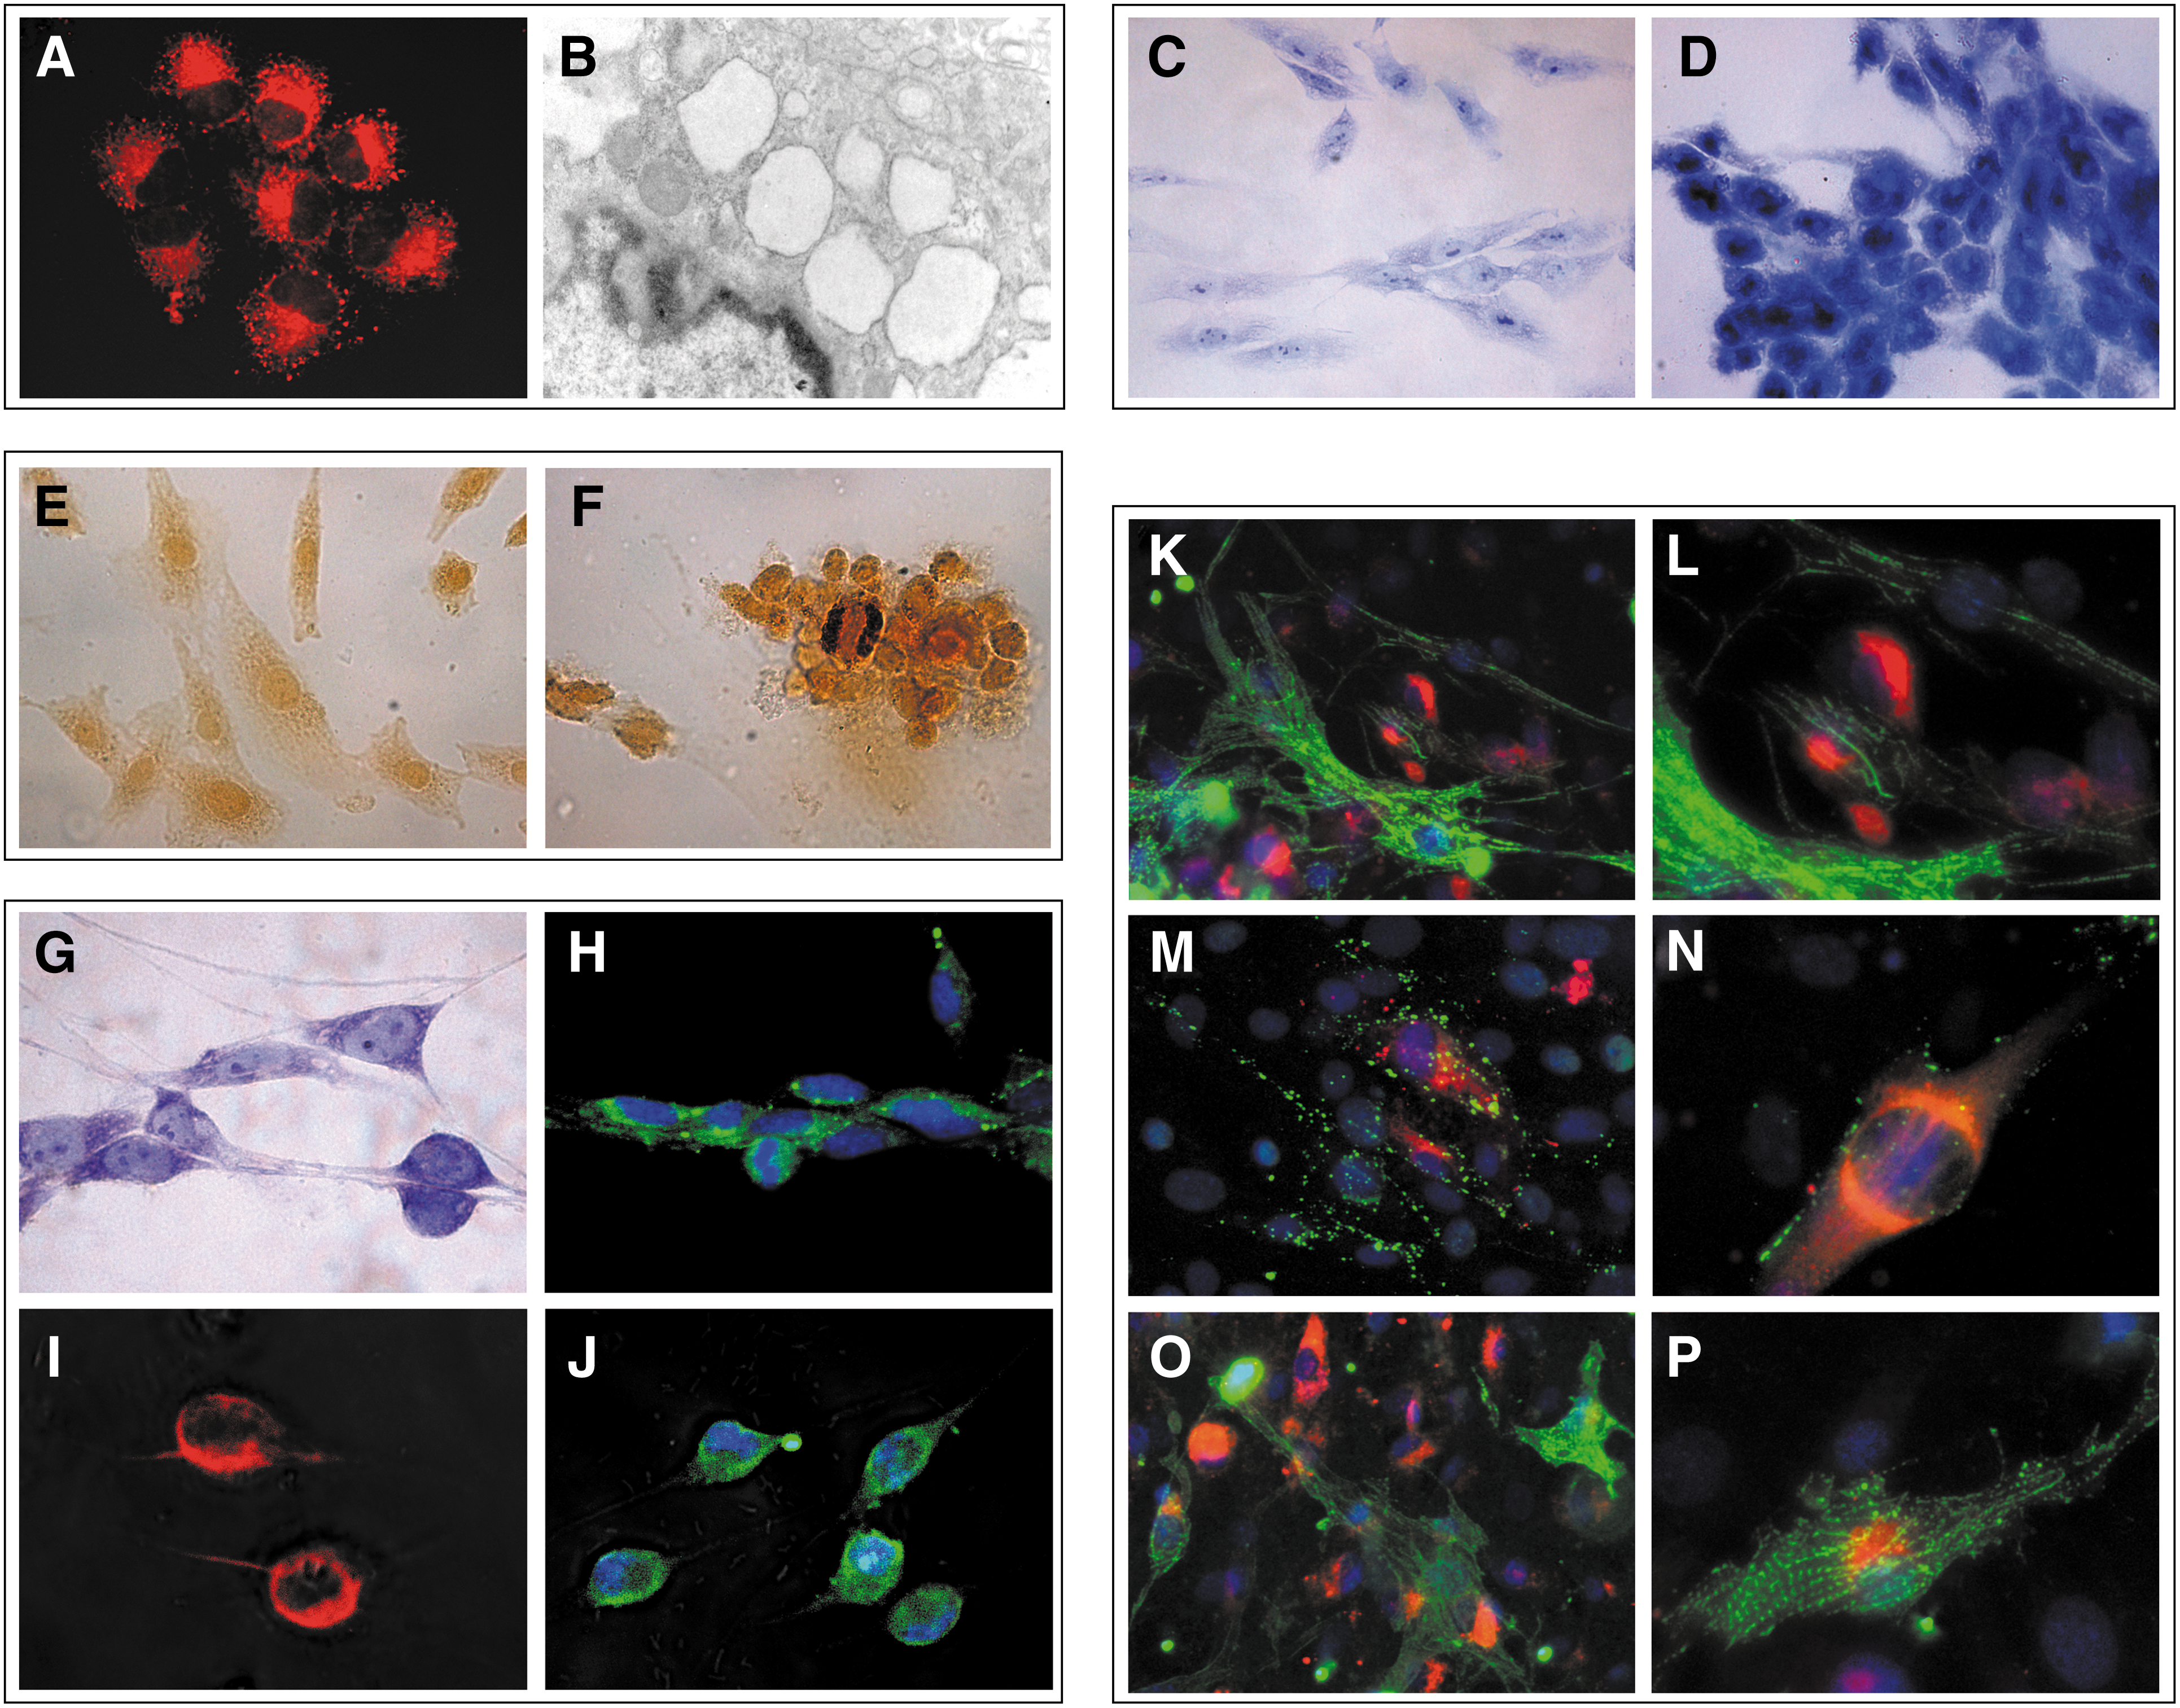
MUR-1 potency.
MUR-1 cells were also able to transdifferentiate into other cell types. If cultured with appropriate growth factors (see Materials and Methods section), MUR-1 may acquire neuronal morphologies, including bipolar one (Fig. 5G), and express neuroglial markers, such as GAP43 (Fig. 5H), GFAP (Fig. 5I), and S100 (Fig. 5J), within 2 weeks of incubation.
The coculture of MUR-1 with neonatal cardiomyocytes induced cardiac differentiation as demonstrated by the expression of troponin I (Fig. 5K, L), CX43 (Fig. 5M, N), and α sarcomeric actinin (Fig. 5O, P), assembled in sarcomeric bands within the cells.
Soft-agar and isograft assay
After more than 6 months of continued culture, MUR-1 cells were assessed for their tumorigenic potential. Both in vitro and in vivo tests showed no cell colony and mass development in the soft-agar test and in subcutaneously injected tissues, respectively. Also, the autoptic analysis of isograft areas of injection did not reveal the presence of any inflammatory infiltrates (data not shown).
Discussion
Dental pulp holds promise to be an interesting source of different adult stem cell populations generally characterized by an enhanced differentiation potential [39 –41], although the gene/antigen expression profile is comparable to bone marrow stem cells [27]. Nevertheless, the actual potential of DPSCs has been underestimated, since investigations have predominantly been focused on obtaining cells for in vivo dental/calcifying-tissue recovery.
The present study demonstrates that, among DPSCs, it is possible to isolate a cell line (MUR-1) displaying uncommon properties and behavior, even though morphological features strictly resemble those of MSCs [27]. Ultrastructural analysis of MUR-1 cells reveals a finely dispersed euchromatin, presence of numerous mitochondria, featuring tightly pleated cristae, and several ribosomes associated to the endoplasmic reticulum, clues of easy access to transcription factors, enhanced energy production, and protein synthesis, respectively. Furthermore, MUR-1 cells transcribe and translate the classical CD90+/CD117+/CD34−/CD45− profile without commitment to blood lineages, typically depicting the undifferentiated mesenchymal condition [7]. This expression pattern associates with that of both c-Myc and Oct4, which are essential to induce self-renewal in embryonic stem cells and are pivotal to sustain pluripotency [42]. Intriguingly, MUR-1 cells also express Stella, a further clue of self-renewal and multi/pluripotency. In fact, Stella has been observed, up to now, only in the embryo inner mass cells and in the germ cells line [43], where it acts as protector of the DNA demethylation, as demonstrated by its involvement in epigenetic reprogramming [44]. In addition, MUR-1 cells express the embryonic SSEA1 marker, which is also specific for neural crest cells [45,46], and Fragilis 1, which is mainly present in the mesoderm and the pharyngeal arch during the embryo development [47]. Finally, the expression of YAP1, a marker of epithelium–mesenchyma transition [48], could represent the remnant of the ectomesenchymalization process underlying the dental pulp development. Indeed, the dental pulp originates from a unique mesenchyma–epithelium cross talk, in which the epithelium of the first pharyngeal arch interacts with the neural crest, considered as the mesenchymal counterpart [49 –51].
This evidence indicates that MUR-1 cells are characterized by a very early differentiation status, as also confirmed by their high proliferation rate and clonogenic potential. Notably, both phenomena remain unchanged up to the 200th culture passage. Since cells cultured in vitro for extended periods could escape senescence when affected by genetic aberrations and neoplastic transformation, MUR-1 cells have been repeatedly karyotyped without any evidence of macroscopic chromosomal alterations. Furthermore, they were neither able to grow in vitro without adhesion support nor able to provoke mass development after injection in living experimental animals. Taken together, these evidences indicate that long-term cultured MUR-1 cells cannot be considered cancerous.
Beside these characteristics, MUR-1 cells translate both CD105 and Flk1 antigens strengthening the mesenchymal feature, though they are also typical endothelial markers [52,53]. Notably, although being negative for ADRB1, MUR-1 cells display a cardiac-/vascular-like CD117+/Flk1+/NKX-2.5+/MEF2C+ profile, together with the low expression of the endoderm marker GATA4. Such a pattern concurs to postulate a parenting with those cells driving cardiogenesis during the embryo development [54,55]. In addition, CX43 is functionally organized in cell membranes, likewise the high-motility neural crest cell subpopulation that arises in the endothelium of the aortic arch arteries and the septum between the aorta and the pulmonary artery [56] and portions of the cardiac conduction system [57]. These data suggest that MUR-1 cells could share a neural crest ancestral progenitor, whereas prone to differentiate to cardiomyocytes. Additionally, MUR-1 cells express ADRB2 that is involved in both adipo- and osteogenic differentiations [58,59], and vimentin, a marker of early neural phenotype [60], but also generally related to the mesenchymal status [61]. Finally, markers of differentiations, such as ALPL or HLA-DR, have not been detected.
This broad profile of the MUR-1's gene and antigen expression is reflected by their potency. Indeed, MUR-1 cells are able to adopt an adipocyte, chondrocyte, and osteocyte phenotype, as evinced by the intracellular lipid vesicles development and the basophilic cytoplasm and alkaline phosphatase activity, respectively. These capabilities are substantially equivalent to those of stem cells from bone marrow. Furthermore, beside the above-mentioned differentiating capabilities, MUR-1 cells can generate neuronal and glial precursors expressing typical markers, such as GFAP, GAP43, and S100, which are involved in neurite formation and elongation [62,63]. Finally, they can differentiate to cardiomyocytes expressing troponin I and α sarcomeric actinin in properly assembled Z-disks; conversely, CX43 expression and location remain as in undifferentiated MUR-1 cells. Notably, the MUR-1-extended differentiating potential remains unchanged independently of the cell passage and is not significantly affected by supplement/feeder-layer-free culture conditions, such as when they are cultured in low-antioxidant high-glucose RPMI-1640. This is a very peculiar feature of MUR-1 cells, since the increment of the reactive oxygen species level within stem cells is believed to be inversely correlated with the maintenance of their stemness state [64].
It can be speculated that MUR-1's peculiar characteristics could be related to the continuous growth of Myomorpha teeth during the entire animal life; however, adult stem cells deriving from other continuously growing tissues do not display a similar behavior. For example, when bone marrow-MSCs are cultured in vitro, they lose the capability to self-renew within 30–50 population doublings [65,66].
All these observations indicate that the MUR-1 cell phenotype can be properly maintained even after isolation from their native niches. This is in apparent contrast with the notion that the niche is crucial in regulating stem cell proliferation, self-renewal, and differentiation potential [67]. It can be conjectured that, under some respect, culture conditions mimic the native niche environment.
To conclude, MUR-1 is a cell population phenotypically stable in conventional culture conditions and, at the same time, endowed with a very extensive differentiating potential that can be easily activated with specific stimuli. This makes MUR-1 a reliable model to study the mechanisms regulating the stemness state and to test biologically active substances of potential pharmacological interest. Furthermore, MUR-1 could represent a benchmark to assess the characteristics and potential of many other stem cell populations, whose phenotypic instability has so far hampered to deepen the knowledge about their behavior.
Footnotes
Acknowledgment
We are thankful to Dr. M. Pautasso, Dr. M. Lo Iacono and Mrs. L.M. Marinos for their technical supports. We thank Prof. A Ceccarelli for providing critical assistance. F. Di Scipio is supported by a grant of Compagnia di San Paolo, Turin, Italy.
Author Disclosure Statement
None of the authors has any disclosure to declare. No competing financial interests exist.