
Abstract
Cranial neural crest cells give rise to ectomesenchymal derivatives such as cranial bones, cartilage, smooth muscle, dentin, as well as melanocytes, corneal endothelial cells, and neurons and glial cells of the peripheral nervous system. Previous studies have suggested that although multipotent stem-like cells may exist during the course of cranial neural crest development, they are transient, undergoing lineage restriction early in embryonic development. We have developed culture conditions that allow cranial neural crest cells to be grown as multipotent stem-like cells. With these methods, we obtained 2 independent cell lines, O9-1 and i10-1, which were derived from mass cultures of Wnt1-Cre; R26R-GFP-expressing cells. These cell lines can be propagated and passaged indefinitely, and can differentiate into osteoblasts, chondrocytes, smooth muscle cells, and glial cells. Whole-genome expression profiling of O9-1 cells revealed that this line stably expresses stem cell markers (CD44, Sca-1, and Bmi1) and neural crest markers (AP-2α, Twist1, Sox9, Myc, Ets1, Dlx1, Dlx2, Crabp1, Epha2, and Itgb1). O9-1 cells are capable of contributing to cranial mesenchymal (osteoblast and smooth muscle) neural crest fates when injected into E13.5 mouse cranial tissue explants and chicken embryos. These results suggest that O9-1 cells represent multipotent mesenchymal cranial neural crest cells. The O9-1 cell line should serve as a useful tool for investigating the molecular properties of differentiating cranial neural crest cells.
Introduction
N
Depending on the site of origin along the anterior–posterior axis of the embryo, neural crest cells fall into 3 populations, cranial, cardiac, and trunk, each with a unique developmental potential. The cranial neural crest, which originates in the portion of the neural tube from the neural fold anterior to rhombomere 6, has the ability to produce a greater diversity of derivatives than other crest populations: Cranial neural crest cells give rise to derivatives of the ectoderm, including peripheral nerves, as well as mesenchymal cell types, including skeletal bone, cartilage, dentin, smooth muscle, and corneal endothelial cells [6]. Trunk neural crest cells form a more limited set of cell types, including peripheral nerves, melanocytes, and the adrenal medulla [6]. Cardiac neural crest cells contribute to the smooth muscle lining of the outflow tract [7].
Clonal culture experiments have shown that trunk neural crest cells include a population of self-renewing multipotent stem cells [8]. Whether other neural crest populations also contain such populations is not clear. In the case of cranial neural crest cells, individual cells derived from quail embryos have been shown to be multipotent [9,10]. However, these cells have not been maintained as stable, long-term cell lines; consequently, the question of whether these cells have the ability to self-renew has not been addressed.
One of our main long-term goals is to test the hypothesis that the cranial neural crest contains a population of self-renewing stem cells. For this purpose, we have sought to develop clonal culture conditions that will allow us to evaluate the differentiation potential of individual cranial neural crest cell clones. As a first step toward this goal, we have identified conditions that enable murine cranial neural crest cells to be cultured en masse, and conditions in which such mass-cultured cranial neural crest cells to be maintained in vitro in a multipotent state. We have isolated 2 multipotent non-clonal cell lines, one of which we have characterized extensively. The cell line designated O9-1 has the capacity to differentiate in vitro into osteoblasts, a defining characteristic of cranial neural crest cells, as well as chondrocytes, smooth muscle, and glial cells. In vivo, O9-1 cells can contribute to cranial mesenchymal derivatives, including osteoblasts and smooth muscle cells. The O9-1 cell line can be passaged extensively, stably maintaining its multipotency. Whole-genome expression profiling suggests that the O9-1 cell line has characteristics of both cranial neural crest and stem cells. We believe that the O9-1 cell line will be a powerful asset in the investigation of the molecular properties of cranial neural crest cells.
Materials and Methods
Culture medium
The basal medium for neural crest culture was prepared as following. The Dulbecco's modified Eagle's medium (DMEM), 15% fetal bovine serum (FBS), 0.1 mM minimum essential medium (MEM) non-essential amino acids, 1 mM sodium pyruvate, 55 μM β-mercaptoethanol, 100 U/mL penicillin, 100 μg/mL streptomycin, and 2 mM L-glutamine, was conditioned by STO feeder cells (ATCC) for an overnight. The medium was filtered (0.22-μm pore size) and supplemented with 25 ng/mL basic fibroblast growth factor (bFGF; R&D Systems) and 1,000 U/mL leukemia inhibitory factor (LIF; Millipore).
Neural crest cell culture
Cranial neural crest cells labeled with Wnt1-Cre; R26R-GFP [7,11,12] were obtained from E8.5 mouse embryos. Cranial tissues above the level of the second pharyngeal arch were dissected in DMEM supplemented with 10% fetal calf serum (FCS), washed by phosphate-buffered saline (PBS), and then incubated in 0.025% trypsin, 1 mg/mL collagenase in 0.25 mM EDTA for 5 min at 37°C. Cells were dissociated by gentle pipetting and neutralized in DMEM with 10% FCS. Then, cells were initially expanded on a Matrigel- (Becton Dickinson) coated plate with the basal medium at 37°C, 5.5% CO2. Confluent culture was subjected to fluorescence-activated cell sorting (FACS) by the MoFlo cytometer (cytomation), and GFP-positive cells were seeded on a Matrigel-coated plate with the basal medium. Cells were seeded at 10,000–15,000 cells/cm2, and it took 3–4 days before they reach to the confluence. For passaging, cells were rinsed with PBS twice and treated with 0.05% trypsin in 0.5 mM EDTA at 37°C for 3 min. Cells were neutralized in 10% FCS in DMEM and gently pipetted. Cells were maintained in logarithmic growth, and as a standard procedure, culture was diluted 2 to 3 times with aimed seeding density ∼0.8–1.0×10⁵ cells/cm2. Under this condition, cranial neural crest cells can be passaged for an extended time.
Cell differentiation
To induce differentiation, cells were cultured in the following conditions: osteogenic differentiation medium [α-MEM, 10% FBS, 100 U/mL penicillin, 100 μg/mL streptomycin, 0.1 μM dexamethasone, 10 mM β-glycerophosphate, 50 μg/mL ascorbic acid, and 100 ng/mL BMP2 (gift from B. Frenkel)], smooth muscle differentiation medium (DMEM, 10% FBS, 100 U/mL penicillin, and 100 μg/mL streptomycin), and glial differentiation medium [DMEM/F12, 1× B27 (Invitrogen), 2 mM L-glutamine, 50 ng/mL BMP2, 50 ng/mL LIF (Millipore), 1% heat-inactivated FBS, 100 U/mL penicillin, and 100 μg/mL streptomycin]. For chondrogenic differentiation, monolayer culture was initially treated with the osteogenic medium for 3 days. Then, cells were trypsinized and cultured as a micromass format in a chondrogenic medium [α-MEM, 5% FCS, 1% ITS (BD Biosciences), 100 U/mL penicillin, 100 μg/mL streptomycin, 10 ng/mL TGF-β3 (R&D systems), 50 μg/mL ascorbic acid, 10 ng/mL BMP2, 0.1 μM dexamethasone, and 1 mM sodium pyruvate] for additional 7 days.
Osteogenic and chondrogenic differentiation was assessed by Alizarin red, alkaline phosphatase (ALP), and Alcian blue staining [13]. To detect smooth muscle and glial cell differentiation, immunofluorescence was performed with anti-α-smooth muscle actin (αSMA; Sigma), anti-Fabp7, and anti-GFAP (Millipore) antibodies.
Primers
Primers used in this study are shown in Supplementary Data S1 (Supplementary Data are available online at
FACS analysis
O9-1 and i10-1 cells were immunophenotyped by phycoerythrin-conjugated anti-CD44 and allophycocyanin-conjugated anti-Sca-1 antibody, as well as isotype controls purchased from eBioscience. The cells were incubated with 1/200 diluted antibodies at 4°C for 30 min and washed. Analysis was performed by MoFlo (Cytomation).
Microarray analysis
RNA samples were extracted from a triplicated culture of O9-1 cells grown in the basal medium (passage13) and purified using a PicoPure RNA Isolation Kit (Arcturus). Genome-wide RNA expression profile of O9-1 cells was conducted using Illumina MouseRef-8 V2.0 Expression BeadChip (Illumina). The raw intensity data were imported into Illumina GenomeStudio v3 and subsequently exported to Partek Genomic Suite v6 (PGS; Partek, Inc.) using a plug-in script provided by Partek without normalization and background correction. As controls, GEO data sets generated from E8.25 mouse ectoderm ([14], GSE13040) and E12.5 mouse dorsal root ganglia (DRG) ([15], GSE24730) were directly imported into PGS. All data sets were combined and then subjected to log transformation and quantile normalization [16]. To detect differentially expressed genes (DEG) in O9-1 cell line versus the control tissues, a one-way ANOVA was performed using the gene expression workflow in PGS. Lists of the most significant DEG were generated with stringent criteria: a false discovery rate corrected P<0.05 using the Benjamini-Hochberg step-up procedure [17] to account for multiple testing and the difference in mean gene transcript level was at least 2-fold in either direction. We used the same approach to identify DEG of the human trunk neural crest cell lines ([18], GSE14340) versus human Schwann cells (GSE4030).
Analysis of developmental potency of cultured neural crest cells by microinjection into mouse and chick embryos
To assess the ability of cultured neural crest cells to undergo osteogenic and smooth muscle differentiation, we cultured the upper half of E13.5 mouse heads as described [19] with some modifications. In typical experiments, ∼3.5×10⁶ of O9-1 cells were resuspended in 100 μL of 10% FBS in DMEM. O9-1 cells (P18) were injected with a mouth pipette into area adjacent to the frontal bone primordium. Explants were cultured in the BGjb medium for 3 days (see Fig. 4). In the case of the smooth muscle lineage, O9-1 cells were prepared as described above and injected into the frontonasal prominence of the HH stage17 chicken embryos by following to [20]. Embryos were cultured for 24 h and harvested. Both mouse organ explants and chicken embryos were fixed in 4% paraformaldehyde and cryosectioned. In the case of mouse explants, injected cells were visualized by means of immunohistochemistry with anti-GFP antibody (Invitrogen) or immunofluorescence with the TSA tyramide system (PerkinElmer) due to a high level of host autofluorescence. Osteogenic differentiation was assessed by ALP staining [13], and smooth muscle differentiation was assessed by immunofluorescence with anti-αSMA antibody, followed by anti-mouse IgG Rhodamine (Invitrogen) staining.
CD44 immunofluorescence
Cranial tissues of E8.5 through E10.5 Wnt1-Cre; R26R-GFP mouse embryo were fixed in 4% paraformaldehyde and cryosectioned. Tissues were stained with anti-CD44 antibody (eBioscience) and visualized by anti-Rat IgG Alexa568 (Invitrogen).
Results
Mass-cultured cranial neural crest cells sustain stem-like potency
We isolated cranial neural crest cells from E8.5 mouse embryos by means of FACS (Fig. 1). The cells were labeled with a Wnt1-Cre; R26R-GFP reporter. We found that by using a combination of Matrigel-coated culture dishes and a medium conditioned by STO feeder cells and supplemented with bFGF and LIF, we were able to obtain sustained growth of mouse cranial neural crest. bFGF is essential for adequate growth of these cells. We have thus far isolated 2 independent mass culture lines, O9-1 and i10-1. When cultured with various differentiation media, both of these cell lines were capable of differentiating into several different cell types, including osteoblasts, chondrocytes, smooth muscle cells, and glial cells (Fig. 1; data not shown). Neither cell line showed a neuronal phenotype when exposed to conditions that were capable of causing neuronal differentiation [21], and melanocyte conditions were not tested.
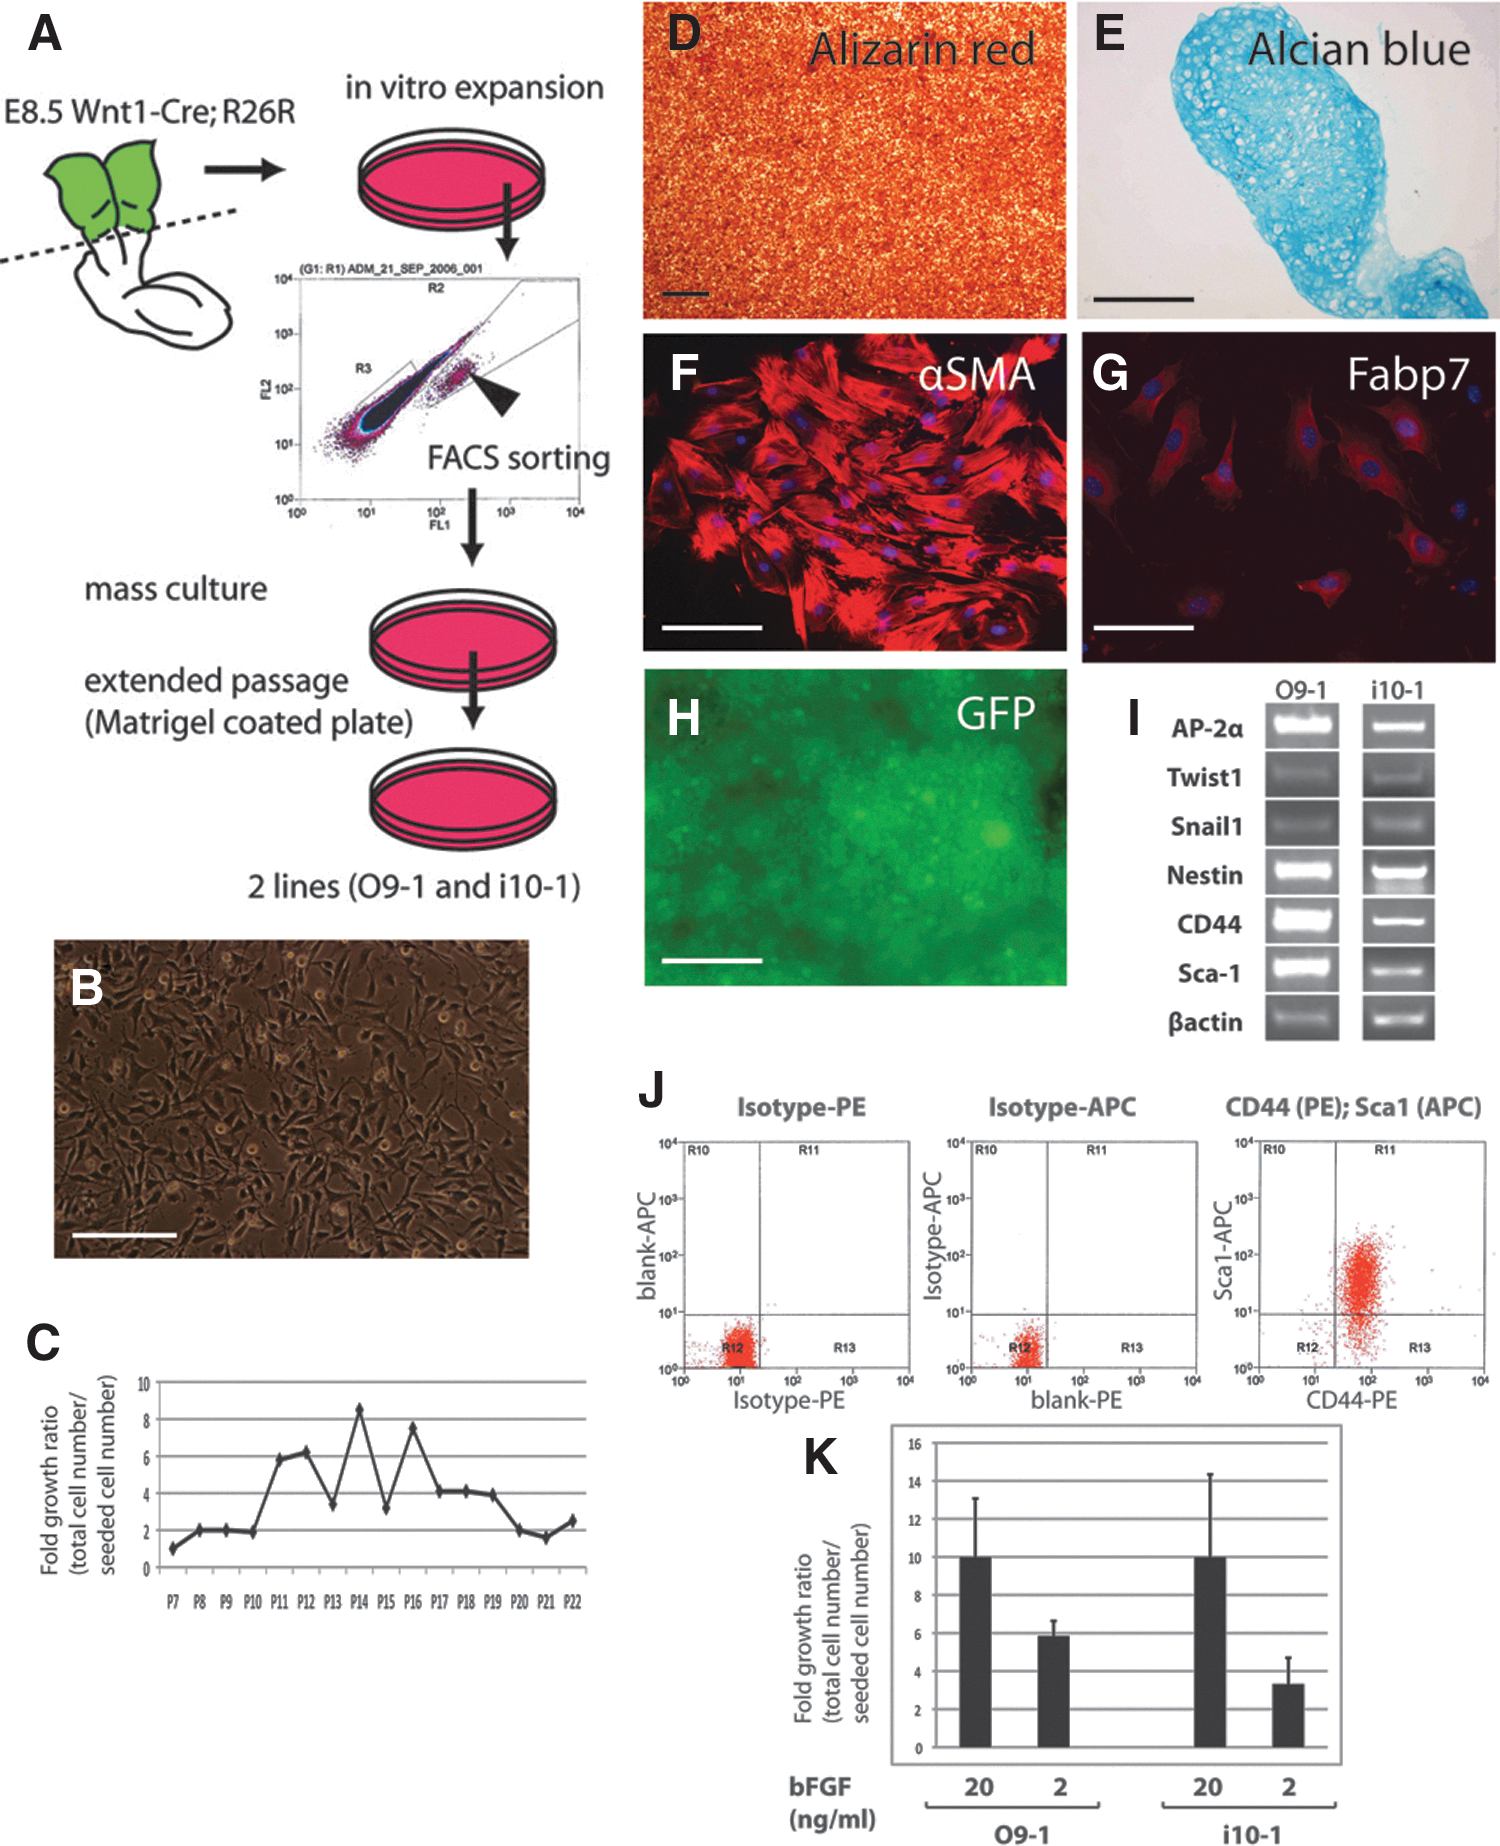
Sustainable stem-like potency of cranial neural crest cell lines.
By performing reverse transcriptase polymerase chain reaction (RT-PCR) analysis at different passages, we found that both cell lines continually express the neural crest markers, AP-2α, Twist1, and Snail1, and the stem cell markers, nestin, CD44, and Sca-1 (Figs. 1 and 2; data not shown). Flow cytometry analysis showed that more than 84% of O9-1 cells are positive for both CD44 and Sca-1. In the case of i10-1, the CD44-Sca1 double-positive fraction was more than 97% (Fig. 1). O9-1 cells stably maintained their multipotency as well as the expression of key markers through passages P17 and P22 (see Fig. 2).
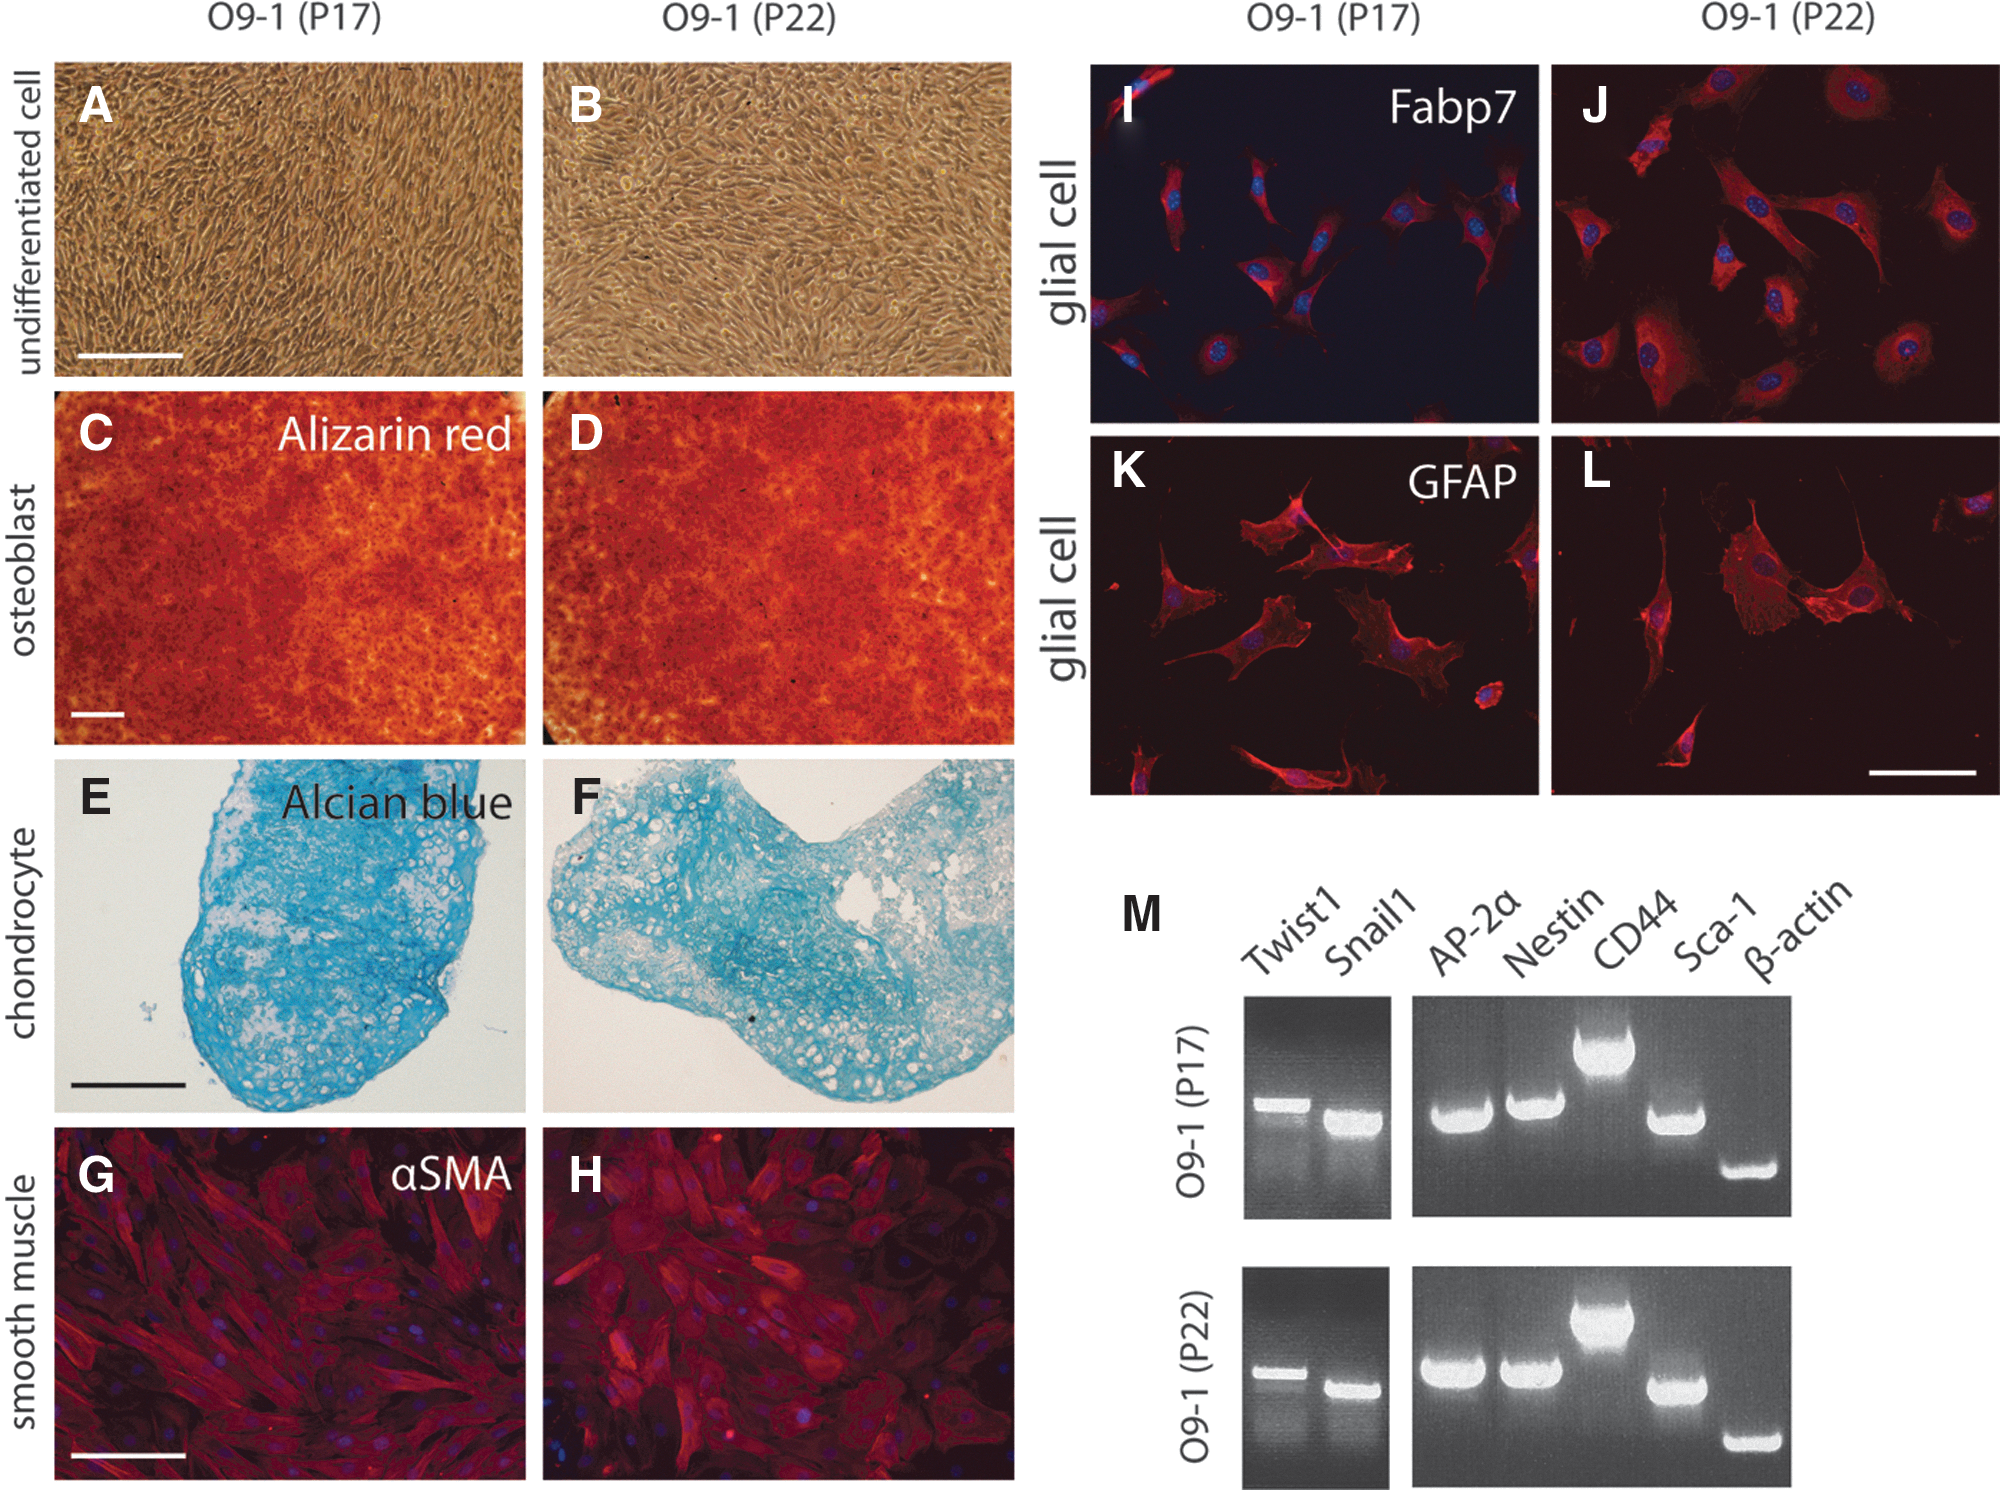
O9-1 cells exhibit sustainable multipotency and expression of marker genes for neural crest and stem cells.
Findings of sustainable differentiation potential, multipotency, and expression of neural crest markers suggest that these mass-cultured cells have key properties expected of cranial neural crest cells. Since O9-1 and i10-1 cell lines had equivalent marker gene expression profiles, proliferation ratios, and differentiation potential (Figs. 1 and 2; data not shown), we chose to focus on the O9-1 cell line in subsequent analyses.
Whole-genome expression profiling revealed that the O9-1 cell line exhibits characteristics of mesenchymal cranial neural crest
Initial marker analysis with RT-PCR suggested the O9-1 cell line has features of neural crest cells as well as mesenchymal and neural stem cells. To further test the hypothesis that the O9-1 cell line represents a native state of developing cranial neural crest cells, we carried out whole-genome expression analysis by means of Illumina microarrays (Illumina). To detect DEG, E8.25 mouse ectoderm ([14] GSE13040) and E12.5 mouse DRG ([15] GSE24730) were used as controls. E8.25 ectoderm should contain few or no neural crest cells, whereas E12.5 DRG is formed entirely from a trunk neural crest population differentiating into neuronal, glial, and smooth muscle cells. Thus, comparison of O9-1 cell line with E8.25 ectoderm should highlight the difference between neural crest and non-neural crest cells, whereas comparison with E12.5 DRG should illuminate differences of undifferentiated versus differentiated neural crest, as well as cranial versus trunk neural crest cells.
Markers of neural crest were increased significantly in the O9-1 cell line relative to both ectoderm and the DRG cell line (fold change >2; P<0.05): these include Tcfap2a (AP-2α), Twist1, Sox9, Myc, Ets1, Dlx1, Dlx2, Crabp1, Epha2, and Itgb1. Additional neural crest markers (a total of 25) also showed higher levels of expression (Table 1 and Supplementary Data S2). Snail1 and Msx1 were increased in the O9-1 cell line in comparison with E12.5 DRG cell line, but not in comparison with ectoderm.
We did not detect an increase in the expression of Foxd3 or Sox10 in O9-1 cells, as would be expected of cells capable of ectodermal fates. We noted a higher level of Sox9 expression and a lower level of Sox10 expression, characteristics of cranial neural crest cells that have migrated into the pharyngeal arches and become committed to mesenchymal fates [22 –24]. These data suggest that the O9-1 cell line models the ectomesenchymal cells in the cranial region.
Expression profiling of O9-1 cells showed some similarity to neural crest stem cells found in the enteric nerve (enNCSCs) [25,26]. The O9-1 cell line expresses Bmi1, Arpc1b, CD9, and Cyba, which are highly expressed in enNCSCs. These results suggest that the O9-1 cell line may represent an undifferentiated subpopulation of cranial neural crest. In agreement with this, additional stem cell markers, including CD44, CD47, Ly6a (Sca-1), and Klf4, were highly expressed in O9-1 cells. Markers that represent differentiating neural crest showed a lower level of expression [Tkrb and Tkrc (neuronal cell differentiation); Mbp, Plp and Gap43 (Schwann cell differentiation); and Col2a1 (chondrogenic differentiation)]. A downregulation of differentiation markers was more obvious in comparison with DRG. Such markers include neuronal (Neurod1, Neurod4, Nefm, and Prph1), glial (Fabp7 and Slc1a3), and smooth muscle (αSMA) lineage markers (see Table 1). These results suggest that the cell line O9-1 exhibits properties expected of cranial neural crest cells committed to a multipotent ectomesenchymal lineage.
Thomas and colleagues [18] established stable trunk neural crest cell lines from the human fetus (trunk hNCC). These cells can be passaged multiple times in vitro during which time they continuously express neural crest markers [18]. The culture also contains cells that express smooth muscle, neuronal, or glial cell markers [18], suggesting that these cells differentiate into the derivatives of trunk neural crest. We first determined DEG in the human trunk neural crest cell lines (GSE14340) versus human Schwann cells (GSE4030), and then asked whether these results are relevant to the DEG in the O9-1 and mouse DRG (see above). Intriguingly, these comparisons showed certain similarities in the expression of genes involved in neural crest development. Some neural crest markers were increased (Twist1, Myc, Snail1, Sox9, Epha2, Rarg, Rac1, and Cald1), while others were decreased or unchanged [Sox10, Ngfr (p75), and Ednrb] (Supplementary Data S3). In addition, neuronal (Neurod4 and Nefm) as well as glial differentiation markers (Mbp, GAP43, and Fabp7) were both decreased (Supplementary Data S3). These results suggest that the O9-1 and trunk hNCC cell lines both retain certain properties of neural crest and negatively regulate neuronal lineage differentiation. Differences between the O9-1 and trunk hNCC cell lines were also evident. For example, some of the key markers expressed in the O9-1 cell line were not detected in the trunk hNCC lines (Crabp1, Ets1, Dlx1, Dlx2, CD44, Bmi1, Barx1, Prrx1, Arpc1b, CD9, and Cyba, Table 1, not shown). In addition, Hox cluster genes were significantly decreased in O9-1 cells (total of 21 Hox genes), whereas they were increased in the trunk hNCC lines (total of 19 Hox genes) (Supplementary Data S2 and S3, data not shown). The observed differences between O9-1 and trunk hNCC lines in the expression of Hox genes were consistent with the expected differences between cranial versus trunk neural crest cells [6]. The trunk hNCC lines were reported to have a spontaneous expression of the smooth muscle marker, αSMA [18]. Our analysis also detected an increased level of αSMA expression, together with other smooth muscle markers TAGLN (SM22) and CNN1 (Calponin 1). In contrast, O9-1 cells exhibit reduced expression of αSMA (see above) and no change in Tagln and Cnn1 (not shown). Thus, it seems that spontaneous differentiation of smooth muscle is more efficiently repressed in the O9-1 cell line than in the human trunk neural crest cell line.
The osteogenic differentiation of O9-1 cells can be controlled precisely by extrinsic conditions
Osteogenic potential distinguishes cranial neural crest from other neural crest populations [6]. We therefore investigated the osteogenic differentiation of O9-1 cells in more detail. We placed cells in osteogenic conditions and monitored cellular morphology and the expression of various osteogenic markers at different time points (day 0, 1, 3, 5, 7, and 10).
The morphology of O9-1 cells began changing on the second day (day 1). The cells lost their fibroblastic appearance and became more cuboidal (Fig. 3B). The cells formed aggregates by day 5 (Fig. 3D) and nodule-like structures by day 10 (Fig. 3F).

Osteogenic differentiation of O9-1 cells.
Initially, the expression of osteogenic markers [ALP and osteocalcin (OCL)], as well as the osteogenic regulator, Msx2 [27], was undetectable. Within 1 day, the expression of these markers was readily apparent (Fig. 3). Also, Runx2 and osteopontin (Spp1) expression rose from barely detectable to prominent during the course of the experiment. That O9-1 cells do not differentiate spontaneously along an osteogenic pathway, but instead require an osteogenic medium, for such differentiation shows that the induction of osteogenic differentiation of O9-1 cells is governed by extrinsic conditions, and occurs in a controlled manner.
O9-1 cells assume mesenchymal cranial neural crest fates when injected into embryos
We made use of a mouse organ culture system as well as chicken in ovo culture system to ask whether the O9-1 cell line can integrate into differentiating cranial structures derived from cranial neural crest. Undifferentiated cells propagated in the basal medium were injected into E13.5 mouse periorbital prominences, which were then cultured in the BGjb medium for 3 days. We also injected O9-1 cells into the frontonasal prominence of chicken embryos and cultured them for 24 h (Fig. 4). We examined mesenchymal neural crest derivatives for contributions of O9-1 cells. We found that injected O9-1 cells differentiated into osteogenic and smooth muscle lineage cells, which are mesenchymal derivatives (Fig. 4). Of 14 injected mouse explants, over 25% showed integration into the osteogenic lineage, and over 20% showed differentiation into smooth muscle. In surviving chicken embryos, 1 of 3 showed smooth muscle differentiation. These results provide evidence that the O9-1 cell line closely approximates undifferentiated ectomesenchymal cells derived from the cranial neural crest.

Ectomesenchymal potential of the O9-1 cells in differentiating mouse organ explants and chicken embryo. To verify the differentiation ability of the O9-1 cell line in the cranial tissues, we performed microinjection experiments with an in vitro organ culture model.
CD44 marks migratory and postmigratory cranial neural crest cells in mouse
As noted above, O9-1 cells express the stem cell marker, CD44. This molecule is expressed in migratory and postmigratory cranial neural crest cells in Xenopus [28] and migratory cranial neural crest cells in chicken [29]. In Xenopus, downregulation of CD44 by morpholino antisense resulted in delayed migration of cranial neural crest, suggesting that CD44 has an essential role in neural crest migration [28]. However, the expression pattern of CD44 in murine neural crest has not been described in detail. Thus, to verify the utility of CD44 as a marker of neural crest cells in the mouse, we assessed its expression in mouse embryos at E8.5–E10.5. We found that CD44 is expressed in cranial neural crest cells in both the migratory and post-migratory phases from E8.75 through E9.5 (Fig. 5, data not shown), supporting the hypothesis that the O9-1 cell line represents a population of cranial neural crest in the migratory through post-migratory stages. At E8.75, virtually no positive cells were found in the early phase of migration (not shown), whereas a majority of the late migratory or post-migratory cells were positive (Fig. 5). Expression of CD44 in cranial neural crest was markedly reduced by E10.5 (not shown).
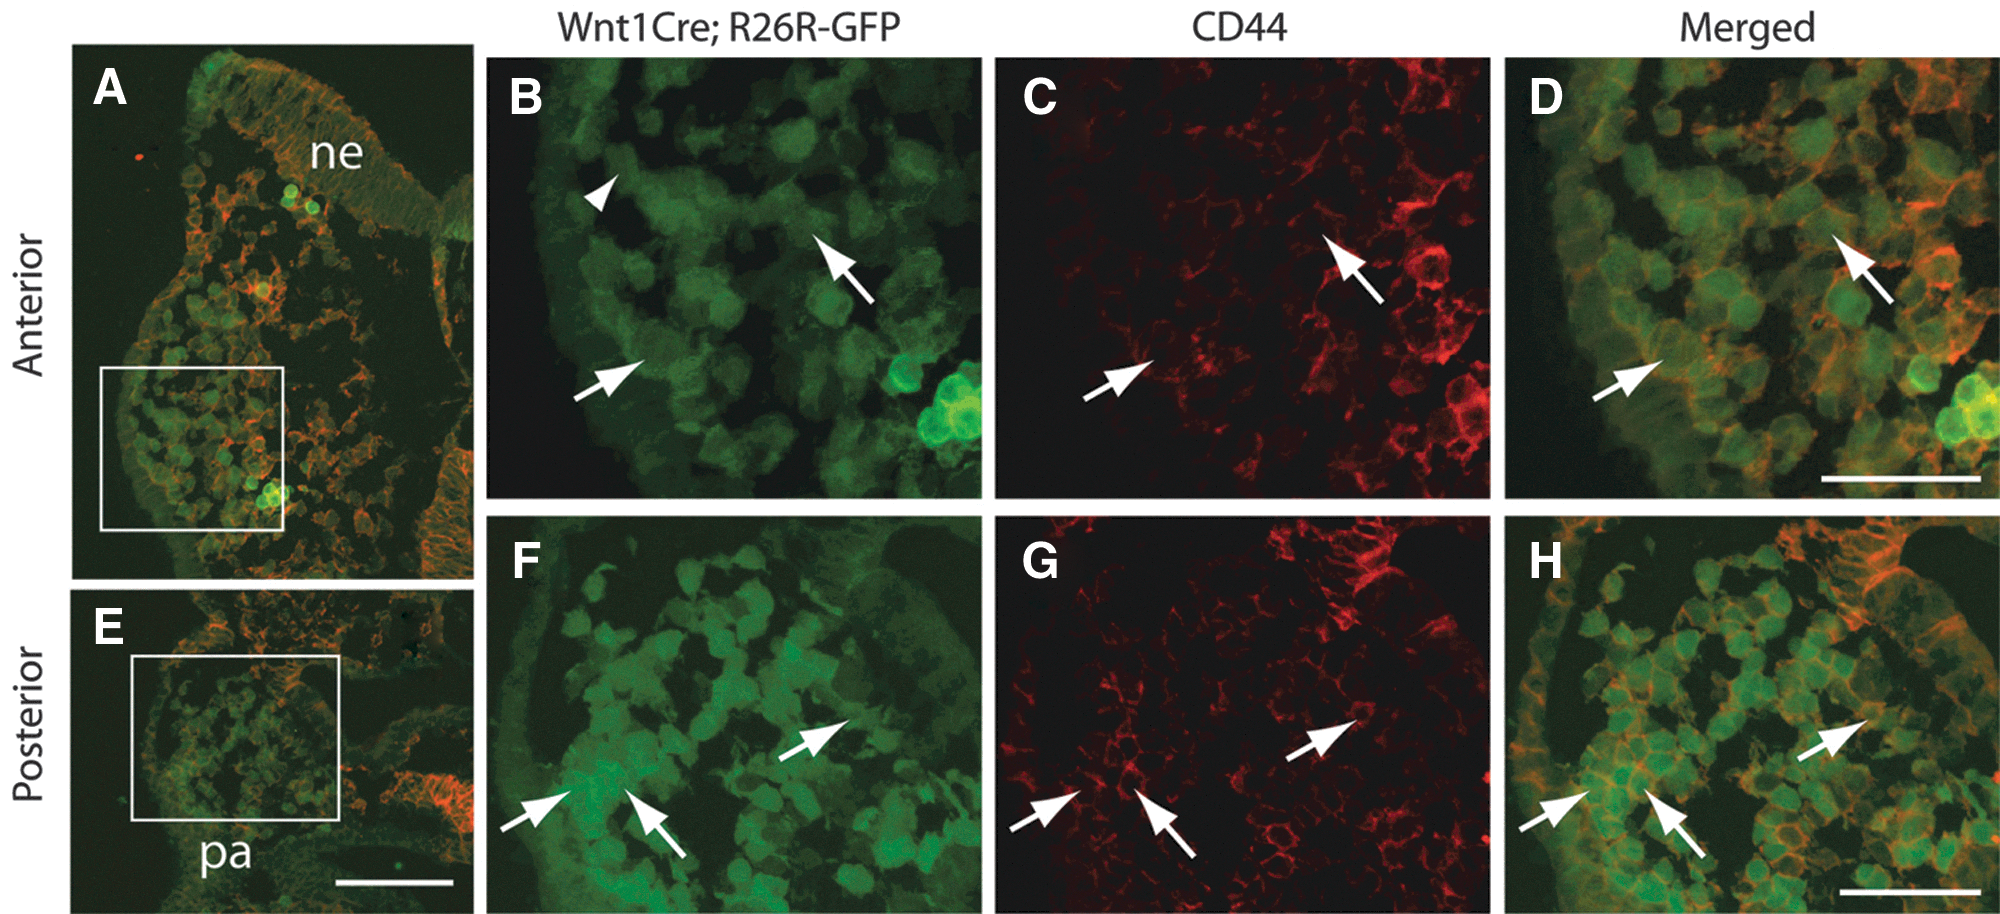
CD44 marks a subset of migratory and post-migratory cranial neural crest cells in E8.75 mouse embryos.
Discussion
Here, we describe stable cell lines that exhibit properties of an undifferentiated mesenchymal population of cranial neural crest cells. One such cell line, O9-1, is capable of differentiating into 4 cell types, including osteoblasts, chondrocytes, smooth muscle cells, and glial cells. O9-1 cells express neural crest markers, as well as stem cell markers. They also express genes involved in craniofacial development, and are able to integrate into differentiating bone and smooth muscle in E13.5 mouse embryos, as well as smooth muscle in chicken embryos. We suggest that these cells will provide a tool for investigating the molecular properties of differentiating neural crest cells.
A major limitation in the investigation of the molecular properties of cranial neural crest cells is the difficulty of obtaining sufficient quantities of cells for biochemical studies. One approach that would overcome this limitation is a system for culturing cranial neural crest in such a way as to provide a large quantity of homogeneous cells that represent the native state of cranial neural crest cells. Although cell lines derived from trunk neural crest are available (trunk hNCC [N1–N5] [18], MONC-1 [30], and JoMa1.3 [31]), there is no generally accepted sustainable cell culture model for cranial neural crest.
There is evidence that early-stage cranial neural crest cells have stem-like properties. Calloni and colleagues [9] isolated single neural crest cells from quail embryos and showed that they can differentiate into 6 cell-types, in vitro. Because these cells were not a stable cell line and thus could not be maintained in culture, it was not possible to determine whether they had the ability to self-renew. To address this issue, Trentin and colleagues established stable cranial neural crest cell lines with the ability to self-renew [32]. These cells showed a limited ability to differentiate, functioning as bipotent progenitors [32]. The question of whether a population of self-renewing neural crest stem cells exists in vivo therefore remains open. Our work, by identifying conditions that can maintain cranial neural crest cells in a multipotent state, suggests an approach to the clonal culture of cranial neural crest, and thus a direct test of hypothesis that a population of multipotent cranial neural crest cells exists in vivo. We note that although we have sought conditions that maintain a normal karyotype during cell expansion, we were unsuccessful to date. Thus, a form of transformation may be required to maintain sustainable growth of cranial neural crest in vitro.
Several neural crest markers were either not detectable in O9-1 cells or were reduced in O9-1 cells relative to DRG and ectoderm; these include Foxd3, Tcfap2b, Sox10, Ngfr (p75), Zic1, Zic2, Id2, and Robo1 (see Table 1). Some of these markers are known to be expressed in neural crest precursors in the neural plate as well as in differentiating neuronal and glial cells [33 –37]. The reduced expression of these markers may indicate that O9-1 cells have a non-neural character. Indeed, our finding of increased expression of Sox9 and no change in expression of Sox10 relative to E8.25 ectoderm and E12.5 DRG is consistent with the view that O9-1 cells resemble undifferentiated mesenchymal cranial neural crest cells.
Our data suggest that there may be a difference in the potency of O9-1 cells in vitro versus in vivo. The O9-1 cell line can differentiate in vitro into both mesenchymal (osteogenic, chondrogenic, and smooth muscle) and non-mesenchymal (glial) lineages. In contrast, we have thus far only been able to demonstrate osteogenic and smooth muscle fates, in vivo. This difference may be technical and caused, for example, by our limited ability to inject O9-1 cells into embryos at the right time and place to observe non-mesenchymal fates. Alternatively, it may indicate that, as the marker studies suggest, O9-1 cells model the mesenchymal neural crest lineages more closely than the non-mesenchymal ones.
We found that CD44 is expressed in a subset of migratory cranial neural crest cells as well as postmigratory neural crest in E8.75 mouse embryos as well as in O9-1 cells (Figs. 1 and 5). Chung and colleagues have also found that CD44 is expressed in stem-like cells derived from the postmigratory cranial neural crest in mouse mandibular tissues [38]. These findings are consistent with the results of Menendez and colleagues [39], who showed that CD44 is exclusively expressed in neural crest cells restricted to a mesenchymal fate in human.
Microarray analysis showed that O9-1 cells express the osteogenic markers, Runx2, Spp1 (osteopontin), and Col1a1 (type I collagen). On the other hand, several additional osteogenic genes, including Sp7 (Osterix), and elements of the Bmp signaling pathway were decreased relative to either DRG or ectoderm (see Table 1). Despite the expression of osteogenic markers, the O9-1 cell line does not differentiate spontaneously into osteogenic cells, but instead is highly dependent on the osteogenic medium for osteogenic differentiation (Fig. 3). It is interesting to note that Runx2 expression is linked to multipotent stem-like characteristics of cranial neural crest in the quail [9]. Similarly, osteopontin has roles in settings outside osteogenic differentiation, controlling tumor progression and metastasis [40]. Thus, expression of Runx2 and osteopontin may be an indication of the stem cell character and migratory properties of O9-1 cells.
Migratory cranial neural crest cells are distinguished by the expression Cald1 and Cfl1 [41,42]. Postmigratory neural crest cells express their own unique set of markers, including Barx1, Prrx1 (Prx1), and Rarg [43 –45]. Rac1 functions in both the migratory and postmigratory neural crest [46 –48]. Our array analysis revealed that O9-1 cells express genes typical of each category, including the migratory neural crest markers and the postmigratory markers. These results suggest that the O9-1 cell line has some properties of both phases of neural crest cell development.
Previous studies showed enhanced chondrogenic and glial differentiation of cultured mouse cranial neural crest by bFGF via activation of the Notch-signaling pathway [49,50]. In our culture conditions, bFGF functions together with LIF to promote the sustainable expansion of the culture while maintaining the cells in an undifferentiated state. bFGF controls the balance between proliferation and differentiation of mesenchymal cranial neural crest in vitro [51]. We found that, indeed, O9-1 cells have significantly reduced expression of Notch receptors (Supplementary Data S2, data not shown). Thus, bFGF may act differently depending on the context of the cell culture condition, including supplemented cofactors.
Finally, we found recently that osteogenic progenitors derived from O9-1 cells exhibit Bmp2 responsiveness similar to the frontal bone primordium of E12.5 mouse embryos (Jingjing Sun, M.Ishii, and R.Maxson, unpublished observations). These cells can be transfected efficiently, both with plasmid constructs as well as RNAi, and can be used for chromatin immunoprecipitation assays. We conclude that the O9-1 multipotent cranial neural crest cell line will serve as a useful tool for the investigation of the biochemical mechanisms of cranial neural crest development.
Footnotes
Acknowledgments
We thank Dr. Baruch Frenkel for providing Bmp2, and we thank members of the Maxson lab for helpful discussions. This work was supported by grants from the National Institutes of Health R01DE016320 and R01DE019650 to R.M. and the CIRM training grant TB1-01192 to A.A.
Author Disclosure Statement
No competing financial interests exist in this study.
References
Supplementary Material
Please find the following supplemental material available below.
For Open Access articles published under a Creative Commons License, all supplemental material carries the same license as the article it is associated with.
For non-Open Access articles published, all supplemental material carries a non-exclusive license, and permission requests for re-use of supplemental material or any part of supplemental material shall be sent directly to the copyright owner as specified in the copyright notice associated with the article.