
Abstract
TGF-β type II receptor (Tgfbr2) signaling plays an essential role in joint-element development. The Tgfbr2PRX-1KO mouse, in which the Tgfbr2 is conditionally inactivated in developing limbs, lacks interphalangeal joints and tendons. In this study, we used the Tgfbr2-β-Gal-GFP-BAC mouse as a LacZ/green fluorescent protein (GFP)-based read-out to determine: the spatial and temporally regulated expression pattern of Tgfbr2-expressing cells within joint elements; their expression profile; and their slow-cycling labeling with bromodeoxyuridine (BrdU). Tgfbr2-β-Gal activity was first detected at embryonic day (E) 13.5 within the interphalangeal joint interzone. By E16.5, and throughout adulthood, Tgfbr2-expressing cells clustered in a contiguous niche that comprises the groove of Ranvier and the synovio-entheseal complex including part of the perichondrium, the synovium, the articular cartilage superficial layer, and the tendon's entheses. Tgfbr2-expressing cells were found in the synovio-entheseal complex niche with similar temporal pattern in the knee, where they were also detected in meniscal surface, ligaments, and the synovial lining of the infrapatellar fat pad. Tgfbr2-β-Gal-positive cells were positive for phospho-Smad2, signifying that the Tgfbr2 reporter was accurate. Developmental-stage studies showed that Tgfbr2 expression was in synchrony with expression of joint-morphogenic genes such as Noggin, GDF5, Notch1, and Jagged1. Prenatal and postnatal BrdU-incorporation studies showed that within this synovio-entheseal-articular-cartilage niche most of the Tgfbr2-expressing cells labeled as slow-proliferating cells, namely, stem/progenitor cells. Tgfbr2-positive cells, isolated from embryonic limb mesenchyme, expressed joint progenitor markers in a time- and TGF-β-dependent manner. Our studies provide evidence that joint Tgfbr2-expressing cells have anatomical, ontogenic, slow-cycling trait and in-vivo and ex-vivo expression profiles of progenitor joint cells.
Introduction
TGF-β
Although molecular and genetic studies have revealed that emerging joints and interzone cells express a number of genes that are critical in joint development, such as GDF5, Wnt9a, and Noggin, there is still inadequate knowledge of interzone cell function; furthermore, it is unclear whether such joint progenitors are present in postnatal joints [6 –8]. Putative adult joint progenitors have been identified based on marker expression, such as Notch1 and chondroitin sulfate sulfation motifs [9 –11]. However, the nature and morphogenic abilities of these adult cell populations remain even less defined than cells within developing joints. Cell tracking of embryonic GDF5 joint cells showed that cells remained topographically confined in specific joint sites over time and gave rise to articular cartilage, synovial lining, and tendons [12]. In these mice the nature of the Gdf5-driven Cre is followed by irreversible activation of reporter activity; therefore, it is impossible to establish exactly what developmental relationship (prenatal vs. postnatal) exists among the reporter-positive cell populations [12].
Potential joint progenitors have also been identified based on specific localization within the joint. The groove of Ranvier, the infrapatellar fat pad, and the superficial layer of the articular cartilage are regions where joint progenitor/stem cells have been hypothetically allocated [10,13 –17]. The groove of Ranvier is a fibrocartilagenous circular structure constituted by several layers of cells surrounding the long-bone epiphyseal growth plates, extending around the developing joint and becoming part of the perichondrium/periosteum in adulthood [16,18,19]. Recently, the groove of Ranvier has been found to be a niche for postnatal slow-proliferating joint stem/progenitor cells [13]. The synovio-entheseal complexes also called “enthesis organs” are found in numerous joints, including the interphalangeal and knee joints and have recently received particular attention because of their involvement during osteoarthritis (OA) and spondylarthritis [20 –24]. When intra-articular the complex should be more correctly termed synovio-entheseal-articular cartilage complex [20].
Here, we generated the Tgfbr2-β-Gal-GFP-BAC transgenic mouse to study the role of Tgfbr2-expressing cells. The Tgfbr2-β-Gal-GFP-BAC mouse carries β-galactosidase (β-Gal) and green fluorescent protein (GFP) as reporters for histological imaging and fluorescence-activated cell sorting (FACS) for Tgfbr2 expression [3]. Using the Tgfbr2-β-Gal-GFP-BAC we characterized (1) the dynamic and spatio-temporally regulated expression pattern of Tgfbr2-expressing cells from embryonic interphalangeal and knee joint development throughout adulthood; (2) the niches for the Tgfbr2-expressing cells that were maintained from prenatal to postnatal in small as well as large joints; (3) the Tgfbr2-expressing cells as slow-cycling cells coexpressing Jagged1, Notch1, Noggin, and GDF5; (4) the developmental-dependent gene expression profile of freshly isolated Tgfbr2-expressing cells; (5) the TGF-β responsiveness of isolated Tgfbr2-expressing cells leading to the regulation of stem-cell-related genes, articular cartilage, synovium, and tendon/ligament gene expression.
Materials and Methods
Mice
The Tgfbr2-β-Gal-GFP-BAC transgenic mice were generated as previously reported using the mouse bacterial-artificial-chromosome (BAC) clone RP24-317C21 containing the Tgfbr2 obtained from the Children's Hospital Oakland Research Institute and using homologous recombination, a GFP-IRES-β-Gal-GEO cassette was inserted into the Tgfbr2-BAC at the endogenous Tgfbr2 translational start site to have β-Gal and GFP as imaging reporters for Tgfbr2 expression under the control of the promoter and endogenous (within 195.8 kb) Tgfbr2 gene regulatory sequences [3]. The Tgfbr2Prx1KO conditional knock-out mice were generated as previously reported by crossing Tgfbr2flox/flox homozygous females, with males Prx-1-Cre (provided by C. Tabin, Harvard University) [3,25]. All animal protocols and procedures were approved by the animal care committee of University of North Carolina at Chapel Hill.
Detection of β-Gal activity in whole-mount embryos, paraffin sections, and frozen sections
Tgfbr2-β-Gal-GFP-BAC embryos were obtained from timed pregnancies using the morning of the vaginal plug appearance as embryonic day (E) 0.5. Adult specimens were obtained from Tgfbr2-β-Gal-GFP-BAC mice at the indicated postnatal (P) ages. Skin was removed from mice at and beyond E15.5 before LacZ staining. For whole-mount LacZ staining, dissected embryonic limbs were prefixed in 4% phosphate buffered saline (PBS)-buffered paraformaldehyde (PFA)-tween(0.1%) for 0.5–1 h at 4°C and dissected adult limbs in 4% PBS-buffered-PFA-tween(0.1%) for 1–2 h at 4°C; specimens were washed three times with PBS tween(0.1%) for 10–30 min each time and incubated in 0.1% X-gal reaction (buffer at pH 7.5) overnight in the dark at 37°C, rinsed in PBS, and postfixed in 4% PFA solution 0.5–2 h at 4°C; specimens were paraffin-embedded, histological sections were obtained and counterstained with Fast Red as previously reported [3]. For frozen section LacZ staining, dissected limbs were fixed with 4% PFA for 1 h, then treated and embedded in PBS-sucrose and OCT-sucrose, and cut in sections (12-μm thickness) using a MICROM HM505E cryostat microtome (ThermoFisher); sections were hood-dried, refixed with 4% PBS-buffered-PFA-glutaraldehyde(0.5%) for 3–4 min, washed with PBS twice, and then stained with X-gal reaction buffer as described above.
Bromodeoxyuridine incorporation studies
We performed three distinct analyses of bromodeoxyuridine (BrdU) incorporation: the first (termed Study 1) aimed at labeling slow-proliferating cells from the embryonic through early postnatal life. The second study and the third study (termed Study 2 and Study 3) were to label cells at two postnatal lifetime points. For Study 1, mice received BrdU (Sigma-Aldrich) during the prenatal life as provided to pregnant mothers through daily supply of drinking water (0.4 mg/mL) from E15.5 to P0; pups were sacrificed at P7, P14, and P28. A total of 21 pregnant Tgfbr2-β-Gal-GFP-BAC mice were used for this study. For Study 2, P6-week (P6w) old Tgfbr2-β-Gal-GFP-BAC mice were exposed to BrdU, through daily supply of drinking water (0.4 mg/mL), for 14 days; BrdU-exposed animals were sacrificed (three mice per time point) at 7, 14, 21, and 28 days after the last BrdU administration. For Study 3, P20-day (P20d) old Tgfbr2-β-Gal-GFP-BAC mice were exposed to BrdU, through daily supply of drinking water (0.4 mg/mL), for 30 days; BrdU-exposed animals were sacrificed (three mice per time point) at 52 days after the last BrdU administration. This last study used a timetable similar (we used an even longer washout period) to the one recently employed by Kurth et al. to study slow-proliferating cells in joints [26]. Experimental animals were kept in separate cages to monitor their BrdU/water intake.
Histology, IHC, ISH, and immunofluorescence
Tissue sections were subjected to IHC as previously reported [3]. The following primary antibodies were used: anti-phosphorylated-Smad2 (p-Smad2) (3101S, Cell Signaling, 1:100 dilution), Notch1 (Sc-6014, Santa Cruz Biotechnology, 1:100 dilution), Jagged1 (Sc-6011, Santa Cruz Biotechnology, 1:150 dilution), Noggin (AF719, R&D Systems, 15 μg/mL), GDF5 (AF853, R&D Systems, 10 μg/mL), Tenascin C (MAB3358, R&D Systems, 10 μg/mL), TGF-β1 and TGF-β2 (Sc-146 and Sc-90, Santa Cruz Biotechnology, 1:100 dilution), Tgfbr2 (Sc-400, Santa Cruz Biotechnology, 1:50 dilution), and BrdU (Ab8955, Abcam, 1:250 dilution). To obtain antigen retrieval, for BrdU-IHC, sections were treated with 0.05% trypsin-ethylenediaminetetraacetic acid (EDTA) for 3–5 min; for pSmad2-IHC, sections were boiled in 10 mM sodium citrate solution for 10 min; for TgfbR2-IHC, sections were boiled in 1× PBS for 5 min; after cooling down to room temperature (if needed) sections were subjected to IHC as previously reported [3]. Immunostaining was visualized using the ABC staining system (Vector Laboratory) and a peroxidase substrate (DAB Chromagen). To visualize cartilage, sections were subjected to Safranin O staining as previously reported [3]. ISH studies were performed as previously reported using a DIG-labeled probe for Tgfbr2 provided by S.K.D. (Cincinnati Children's Hospital, Cincinnati, OH) [3].
For BrdU-GFP immunofluorescence (IF) analysis, the following primary antibodies were used: BrdU (Ab8955, Abcam, 1:250 dilution) and GFP (GFP-1020, Aves Lab, 1:500 dilution). Sections were treated with PBS containing 50 mM ammonium chloride (2×5 min) to quench autofluorescence and followed with Image-iT-Fx signal enhancer (A31629; Invitrogen) treatment to block background. Detection of GFP-Ab complex was by Alexa Fluor secondary antibody (Alexa 555 Goat anti-chicken). After nuclear counterstaining using 4′,6-diamidino-2-phenylindole (DAPI), sections were mounted and analyzed with a Zeiss 510 META laser scanning confocal microscope. Slides were then placed into 1× PBS for 20 min and cover slips were carefully removed. Sections were washed in 1× PBS for 2×5 min and then subjected to BrdU IF. To obtain antigen retrieval, sections were treated with 2 N hydrochloric acid at 37°C for 20 min and 0.5% trypsin-EDTA for 5 min; detection of BrdU-Ab Alexa Fluor secondary antibody (Alexa 488 Goat anti-mouse). Sections were mounted and analyzed with a Zeiss 510 META laser scanning confocal microscope. GFP, DAPI, and BrdU signals were overlaid using Photoshop CS2 (Adobe).
Microscope imaging and imaging processing
Histological, IHC, and LacZ staining images were taken using either BX51 or 1X70 or SZX16 microscopes (Olympus) equipped with a digital camera (DP71; Olympus); they were imported into Photoshop CS2 (Adobe) and formatted and shown in two ways: (1) without using any imaging enhancement and (2) using pseudocolor image processing as described by Basu et al. and Sedgewick [27,28]. In particular, for pseudo-colored images, IHC micrographs were processed using Adobe Photoshop CS2; distinct color ranges corresponding to LacZ, IHC, and both LacZ and IHC-positive signals were clearly separated using histogram analysis and color-replaced as indicated [27,28].
Tgfbr2-β-Gal-GFP-BAC transgene copy number estimation
The copy number of Tgfbr2-β-Gal-GFP-BAC transgene was determined in two independently generated transgenic mouse lines (termed line #23 and line #37). Liver and tail tissues were dissected from E1.5 Tgfbr2-β-Gal-GFP-BAC embryos from line #23 and line #37 (two embryos per line) and genomic DNA was extracted as reported by Shi et al. [29]. Copy number estimates were derived from ΔCt values for standard curve estimates using a modified version of the method and primer sequences previously described [30]. Genomic DNA was quantified using the Qubit fluorometer and reagents (Invitrogen). Quantitative real-time polymerase chain reaction (qRT-PCR) was performed using a CFX96 thermocycler and SsoFast polymerase mix (Bio-Rad). To generate the standard curve, twofold dilutions of plasmid DNA (pcDNA3.1) were spiked into mouse genomic DNA at known diploid copy-number equivalents as previously described [30]. Briefly, 2 μL of genomic DNA (20 ng) or copy number standards were analyzed in a 10 μL reaction volume with the neomycin (Neo) resistance (Neo gene located at β-geo insertion in the BAC vector) and Jun (internal control) primer sets. All reactions were performed in triplicate. Copy number estimates for Neo were derived using the triplicate ΔCT value relative to the internal Jun genomic control and compared to the ΔCt values of standard-curve values.
Cell isolation and flow cytometry
Embryonic mesenchyme digit cells were obtained as previously described [3]. Briefly, distal tips of the autopods of either E13.5 or E14.5 Tgfbr2-β-Gal-GFP-BAC embryos were dissected and subjected to dispase (Biosciences) digestion. Undissociated cells were removed and single cells sorted (MoFlo, Beckman) based on GFP fluorescence. For mesenchymal stem cell (MSC) and hematopoietic cell marker analyses, cells were labeled with phycoerythrin (PE) anti-mouse CD44, CD29,CD73,CD105,CD45,CD34,CD11b (eBiosciences). Cells were then subjected to PE and GFP flow cytometry analysis (MoFlo, Beckman). Data were analyzed using the Summit software (Beckman Coulter).
qRT-PCR gene expression analysis in isolated Tgfbr2-positive cells
Total RNA was obtained from freshly isolated Tgfbr2-positive mesenchymal digit cells or from Tgfbr2-positive cells cultured as micromasses as previously reported [31] that were treated with or without TGF-β1 (20 ng/mL) for 16 h. mRNA was directly reverse transcribed to cDNA (μMACS™ Oligo(dT) MicroBeads Miltenyi) and subjected to qRT-PCR as previously described [31]. PCR primers and conditions are listed in Supplementary Table S1 (Supplementary Data are available online at
Statistical analysis
Data are presented as mean±SD. Statistical differences between groups were assessed by unpaired Student's t-test (GraphPad Prism Software). Statistical significance was set at P<0.05.
Results
Tgfbr2-expressing cells localize in specific niches that are maintained throughout development and postnatal life
We used the Tgfbr2-β-Gal-GFP-BAC mouse, containing β-Gal as a reporter for histological imaging, to determine the temporal and spatial expression pattern of Tgfbr2 during joint development and postnatal life. E12.5, E13.5, E14.5, and E16.5 Tgfbr2-β-Gal-GFP-BAC embryos were subjected to LacZ staining. As shown in Fig. 1, an intense temporally and spatially dependent Tgfbr2-β-Gal expression/activity was noted within the developing limbs. Within the forelimbs, the β-Gal activity was first evident (E12.5) at the prospective elbow site, by E13.5 in the metacarpal region and developing interzone of the digits and by E16.5 was well defined in the interphalangeal joints (Fig. 1). β-Gal activity within the hindlimbs was delayed compared to the forelimbs by approximately 1 day, yet becoming similar at E14.5 (Fig. 1). Performing extensive multiplanar sectioning of the forelimbs through the three main planes (sagittal, coronal, and transverse) (Fig. 2A) at different embryonic stages (E13.5, E14.5, and E16.5), we have rendered a three-dimensional schematic reconstruction of Tgfbr2-β-Gal-expressing cell distribution within the joints (Fig. 2B). We found that at the site where the interzone begins to develop (E13.5), Tgfbr2-expressing cells were initially limited to cells in the dorsal and ventral regions (Domain 1, in Fig. 2B). This domain gradually extended laterally and from distal to proximal as part of the perichondrium surrounding the joints and the distal part of the growth plate (Fig. 2A, B). β-Gal activity was undetectable in the central region of the interzone (Fig. 2). Starting at E13.5, we also found Tgfbr2-β-Gal expression/activity along the developing tendons (Domain 2, Fig. 2A, B). This expression domain gradually decreased from E14.5 to E16.5, where it was found primarily surrounding the surface of developing tendons.

Analysis of TGF-β type II receptor (Tgfbr2)-LacZ reporter-expressing cells in whole-mount forelimbs and hindlimbs during embryonic development. Forelimbs and hindlimbs isolated from Tgfbr2-β-Gal-GFP-BAC embryonic day (E) 12.5, E13.5, E14.5, and E16.5 embryos were subjected to whole-embryo LacZ staining. At E12.5, reporter activity is visible in the elbow. At E13.5 and E14.5, reporter activity is noticeable in the incipient interphalangeal joints, metacarpal/metatarsal regions, and elbow/knee sites. By E16.5, reporter activity becomes more defined at the interphalangeal, knee, and elbow joint sites. Studies were performed in at least three embryos at each time point.

Characterization of spatial and temporal domains for Tgfbr2-expressing cells in embryonic interphalangeal joints. To obtain a three-dimensional map of the Tgfbr2-expressing cells within developing interphalangeal joints, we subjected forelimb digits from E13.5, E14.5, and E16.5 Tgfbr2-β-Gal-GFP-BAC embryos to LacZ staining; the entire specimens were then sectioned through each of the three spatial planes: coronal, transverse, or sagittal. Three-dimensional reconstruction was rendered by analyzing all the sequential sections from each sectioning plane.
To determine whether the Tgfbr2-β-Gal expression/activity pattern was consistent among different lines, we examined the expression in two distinct Tgfbr2-β-Gal-GFP-BAC lines (termed, respectively, line #23 and line #37). As shown in Supplementary Fig. S1A, we found that the expression pattern within the whole-mount hindlimb and digit sections was similar in the two lines although in line #37 the signal was fainter. To determine whether the expression intensity was related to the BAC transgene copy numbers, we quantified by qRT-PCR the BAC copy numbers in the genomic DNA of liver and tail specimens obtained from two mice of line #23 and two mice of line #37. As shown in Supplementary Fig. S1B we found that compared to line #37, line #23 had higher copies of the BAC transgene both in the liver as well as in the tail.
To determine whether Tgfbr2-β-Gal expression/activity pattern was dependent on the LacZ staining modality, we performed whole-embryo LacZ staining followed by paraffin embedding and sectioning as well as frozen sectioning followed by LacZ staining using contralateral specimens from the same mouse. As shown in Supplementary Fig. S1C, we found that an identical Tgfbr2-β-Gal expression/activity pattern was detected by the two LacZ staining modalities.
To further verify the robustness of our Tgfbr2-β-Gal reporter system, we subjected LacZ-stained sections from Tgfbr2-β-Gal-GFP-BAC to IHC, respectively, for p-Smad2 and Tgfbr2 (Supplementary Fig. S2A) and sections from Tgfbr2Prx1KO and control mice (Tgfbr2flox/flox), respectively, to IHC for Tgfbr2 and ISH for Tgfbr2 (Supplementary Fig. S2B). We found that Tgfbr2-β-Gal expression/activity sites overlapped with immunostaining for p-Smad2 (red arrows in Supplementary Fig. S2A, upper panel) and for Tgfbr2 (red arrows in Supplementary Fig. S2A, lower panel) but in addition IHC for Tgfbr2-immunostained cells within the growth plate and in the middle of the joint (black arrows in Supplementary Fig. S2A, lower panel), those regions were not identified by LacZ staining and by p-Smad2 IHC. To determine whether those regions were either related to a nonspecific staining of the Tgfbr2 antibody or failure of the LacZ staining/reporter system, we performed IHC for TgfbR2 in Tgfbr2Prx1KO and Tgfbr2flox/flox mice. As shown in Supplementary Fig. S2B (upper panels) in the Tgfbr2Prx1KO (that is supposed to be the negative control for the antibody) Tgfbr2 IHC immunostained cells within the growth plate and some even within the center of the joint. Similarly, we found that ISH for Tgfbr2 detected a positive signal within the growth plate in Tgfbr2Prx1KO (Supplementary Fig. S2B, lower panel); of note, the overall signal in Tgfbr2flox/flox was very low.
We extended our Tgfbr2-β-Gal expression/activity analysis to postnatal limbs from 7-day to 12-month-(P12m)-old mice. We found that the expression of Tgfbr2 localized in the interphalangeal joint region consistent with Domain 1 found in embryonic stages and expression was age related, becoming more confined to the joint and gradually decreasing but still present at 12 months of age (Fig. 3). Figure 4 shows Tgfbr2-β-Gal expression/activity in sections, respectively, of the proximal interphalangeal joint (Fig. 4A) and metacarpo-phalangeal joint (Fig. 4B) of postnatal 2-week-old (P2w) Tgfbr2-β-Gal-GFP-BAC mice. We found that Tgfbr2 expression clustered in a well-defined niche (square marked in Fig. 4A, B) including the groove of Ranvier (arrow 1) and contiguously the synovio-entheseal-articular cartilage complex comprising part of the articular cartilage (arrow 2); the synovium (arrow 3), and entheses (arrow 4). In addition to this niche we found expression of Tgfbr2 in the surficial cells of the tendons (arrow 5) and the synovial lining (arrow 6). We then evaluated the expression pattern of Tgfbr2 in the embryonic and postnatal knee joint. As shown in Fig. 5A, we found that the expression in the knee joint that started at E13.5 was initially limited to two minute domains within the dorsal side (indicated by red and green arrows in Fig. 5A). At E14.5 we noted the two domains coalesced, assuming a cylindrical domain (green and red arrows). The expression of Tgfbr2 extended with age up to P1 and was maintained in postnatal life (Fig. 5A). Sectioning of LacZ-stained knee joints at different prenatal and postnatal stages showed that Tgfbr2 expression was consistently found in some of the anatomical regions in which it was detected in the interphalangeal joints (Fig. 5B). Starting at E16.5 and more defined at P1 and P7, we found that Tgfbr2 expression localized within the synovio-entheseal-articular cartilage complex including part of the articular cartilage (arrow 1), the synovium (arrow 2), entheses (arrow 3), and part of the perichondrial tissue (arrow 7 in Fig. 5B). A larger magnification of the expression of Tgfbr2 within the niche comprising the synovio-entheseal-articular cartilage complex is presented in Supplementary Fig. S3A. We also found expression within the superficial cells of tendons and ligaments (arrow 4 in Fig. 5B); synovial regions outside the synovio-entheseal-articular cartilage complex (arrow 5 in Fig. 5B) including the synovial lining of the infrapatellar fat pad (arrow 6 in Supplementary Fig. S3B); and the superficial layer of the menisci (arrow 6 in Fig. 5B and arrow 5 in Supplementary Fig. S3A). We did not notice any difference of Tgfbr2's expression between females and males at any stage (data not shown).

Time-dependent expression pattern of Tgfbr2 in postnatal interphalangeal joints. Forelimbs from postnatal Tgfbr2-β-Gal-GFP-BAC mice [postnatal (P) 7, P14, P21, P35, P3 months (m), P6m, P9m, and P12m old] were processed for whole-mount LacZ staining. Red arrows show sites of reporter activity. Studies were performed in at least two mice at each time point.

Tgfbr2 expression clusters in a well-defined joint niche comprising the groove of Ranvier and the synovio-entheseal-articular cartilage complex. Sagittal sections of proximal interphalangeal joint
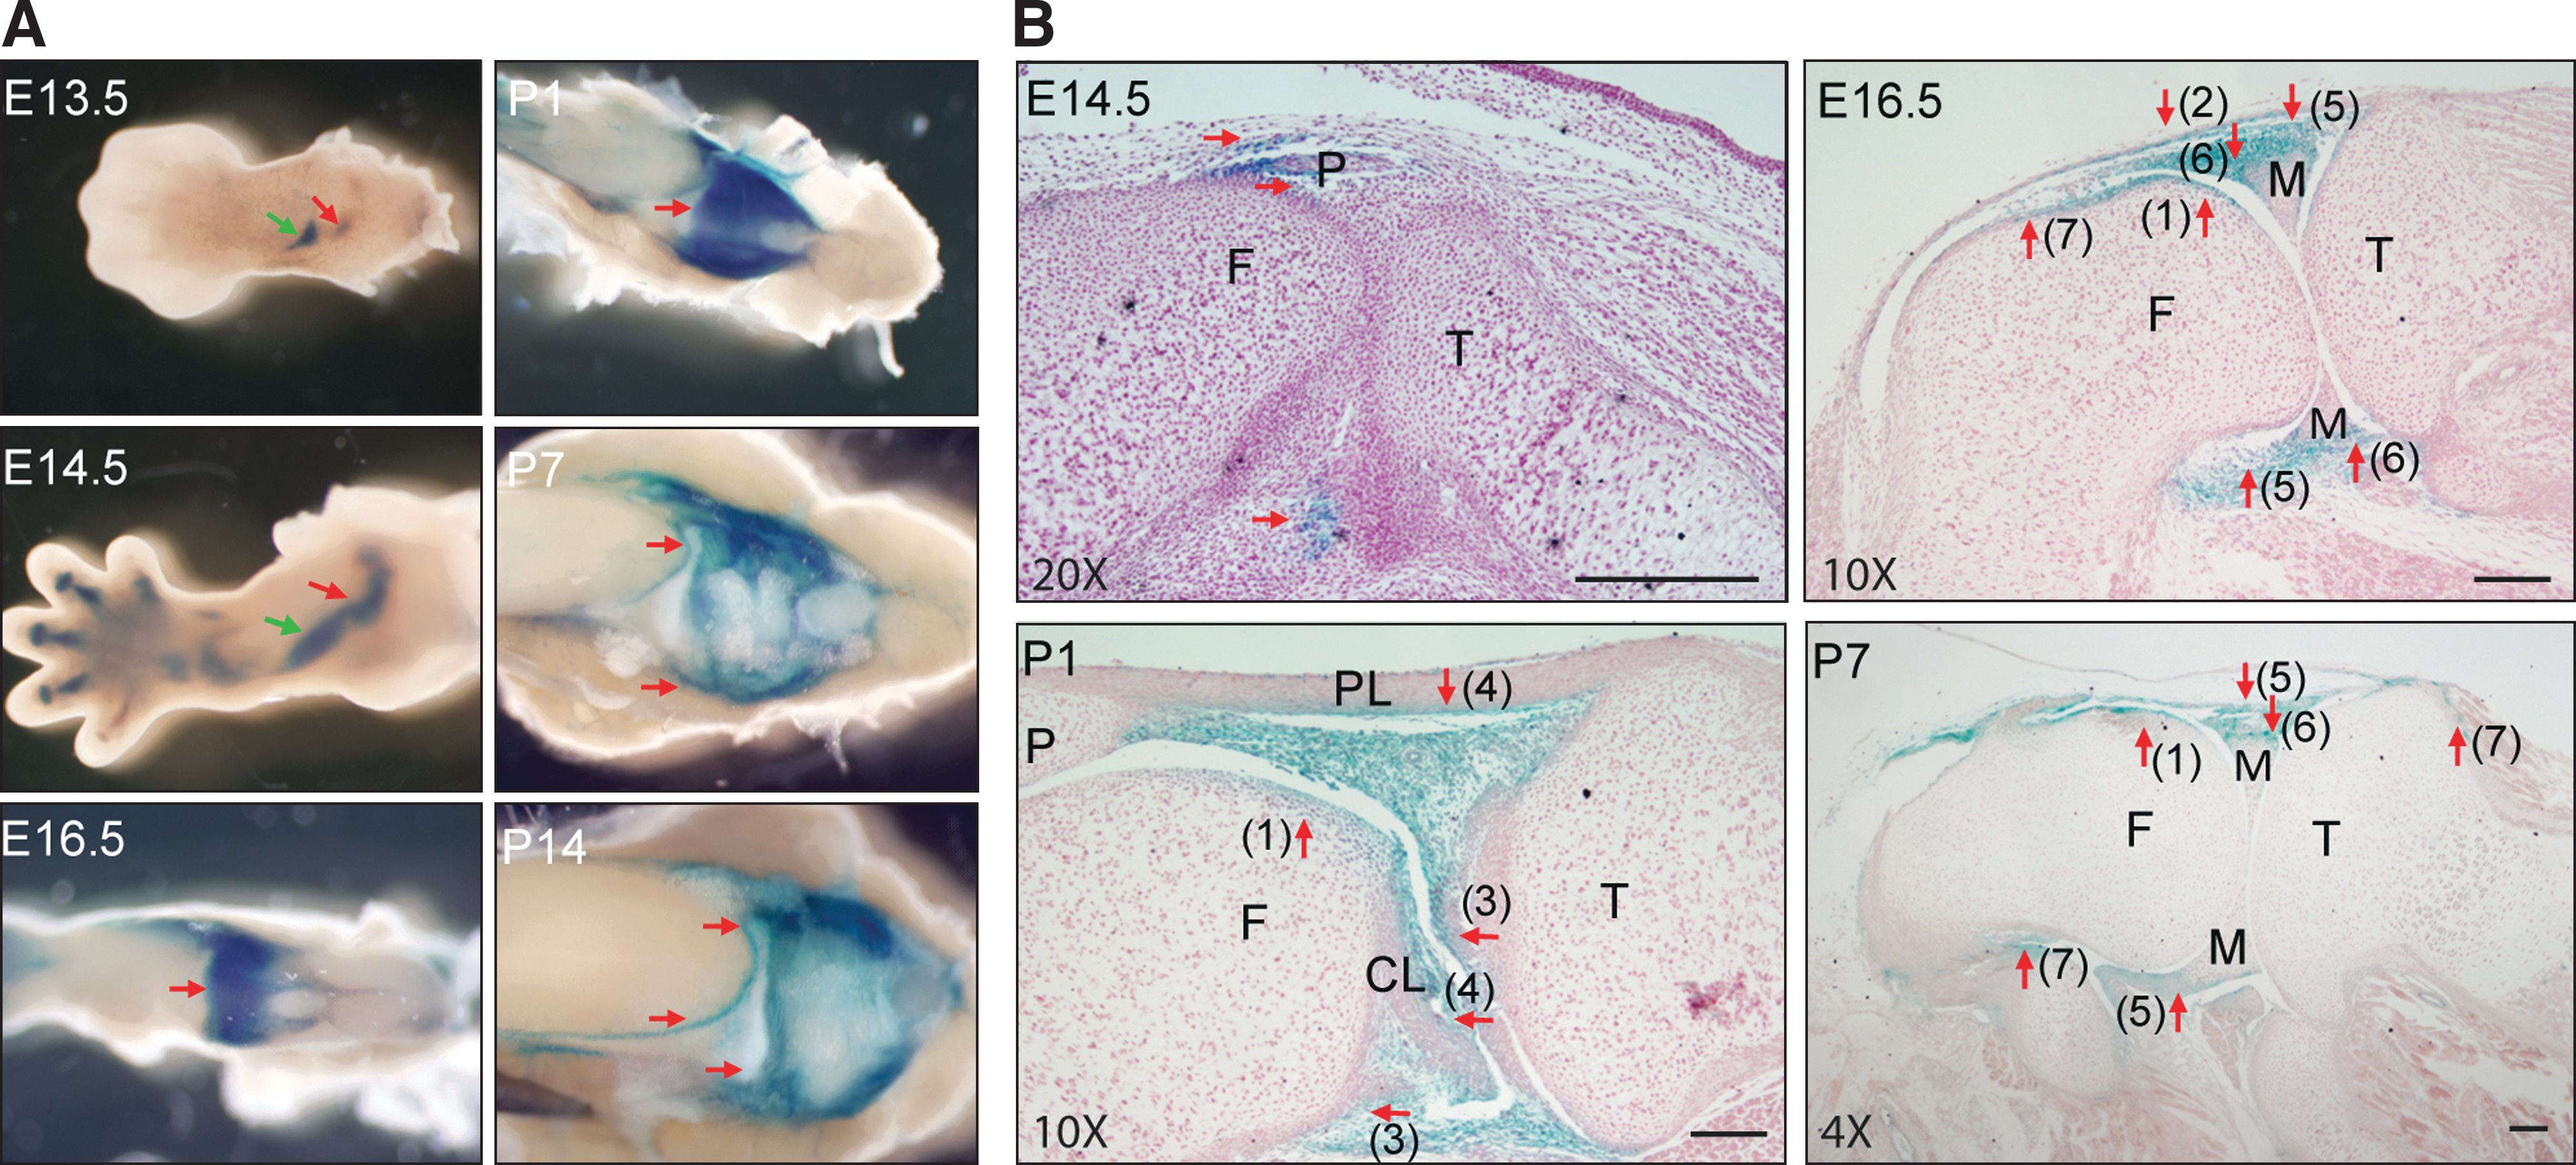
Expression pattern of Tgfbr2 in embryonic and postnatal knee joint.
Taken together, our findings show a dynamic and spatiotemporally regulated expression pattern of Tgfbr2 during joint formation and postnatal life. We found that Tgfbr2 expression clustered within specific niches that were consistent throughout early adult life in small and large joints.
Colocalization of Tgfbr2 with joint and progenitor markers in embryonic interphalangeal joints
We have previously reported that the loss of joint development in the Tgfbr2PRX-1KO mouse is associated with the lack of critical joint morphogenic and joint progenitor marker expression such as Noggin, GDF5, and Jagged1, indicating that Tgfbr2 signaling is an upstream mediator essential for such expression [3]. In this study, we investigated whether Tgfbr2-expressing cells express those markers. As shown in Fig. 6 and Supplementary Fig. S4, transversal and sagittal digital sections were obtained from either E16.5 (Fig. 6) or E14.5 (Supplementary Fig. S4) LacZ-stained Tgfbr2-β-Gal-BAC embryos and subjected to IHC for Jagged1, Notch1, Noggin, GDF5, TGF-β1, TGF-β2, p-Smad2, and Tenascin C. Data are presented either as unmodified images (left upper and lower panels related to each IHC study) or after pseudocolor image processing (right upper and lower panels related to each IHC study) to highlight the signals of either single-stained cells (in blue for single LacZ signal and red for single IHC-DAB signal) or double-stained cells (in green for LacZ+IHC signal) (Fig. 6 and Supplementary Fig. S4). For unmodified images light blue represents single LacZ-positive signal, light brown presents single IHC-DAB-positive signal, and dark brown represents double LacZ+IHC-DAB-positive signal. We found that at E14.5 (red arrows in Supplementary Fig. S4), the Tgfbr2-β-Gal expression/activity colocalized with Jagged1, Notch1, and Noggin in both the distal and ventral sides of the developing joints (consistent with the Domain 1 depicted in Fig. 1) and developing tendons (Supplementary Fig. S4, red arrows) (consistent with the Domain 2 depicted in Fig. 1). Tgfbr2 expression colocalized with GDF5 in both the distal and ventral side of the developing joint (Supplementary Fig. S4, red arrows). In the middle region of the interzone we noted expression of Jagged1, Notch1, Noggin, and GDF5, but not Tgfbr2 (Supplementary Fig. S4). At E16.5 (red arrows in Fig. 6), the colocalization of Tgfbr2 with Jagged1, Notch1, and Noggin could still be detected within the same domains; meanwhile, we found lower expression levels of Jagged1, Notch1, and Noggin in the middle of the joint (Fig. 6). It is possible that Tgfbr2 cells regulate expression of those genes through paracrine as well as autocrine mechanisms. We found limited colocalization of Tgfbr2 with Tenascin C (Fig. 6 and Supplementary Fig. S4). TGF-β1 and TGF-β2 are expressed in developing limbs and TGF-β1−/− ; TGF-β2−/− double mutants show some phenotypic similarities with the Tgfbr2PRX-1KO mice [3,5]. We found that Tgfbr2 expression colocalizes with TGF-β1 and TGF-β2 expression although ligands were expressed in more extensive regions than the receptor (Fig. 6 and Supplementary Fig. S4).
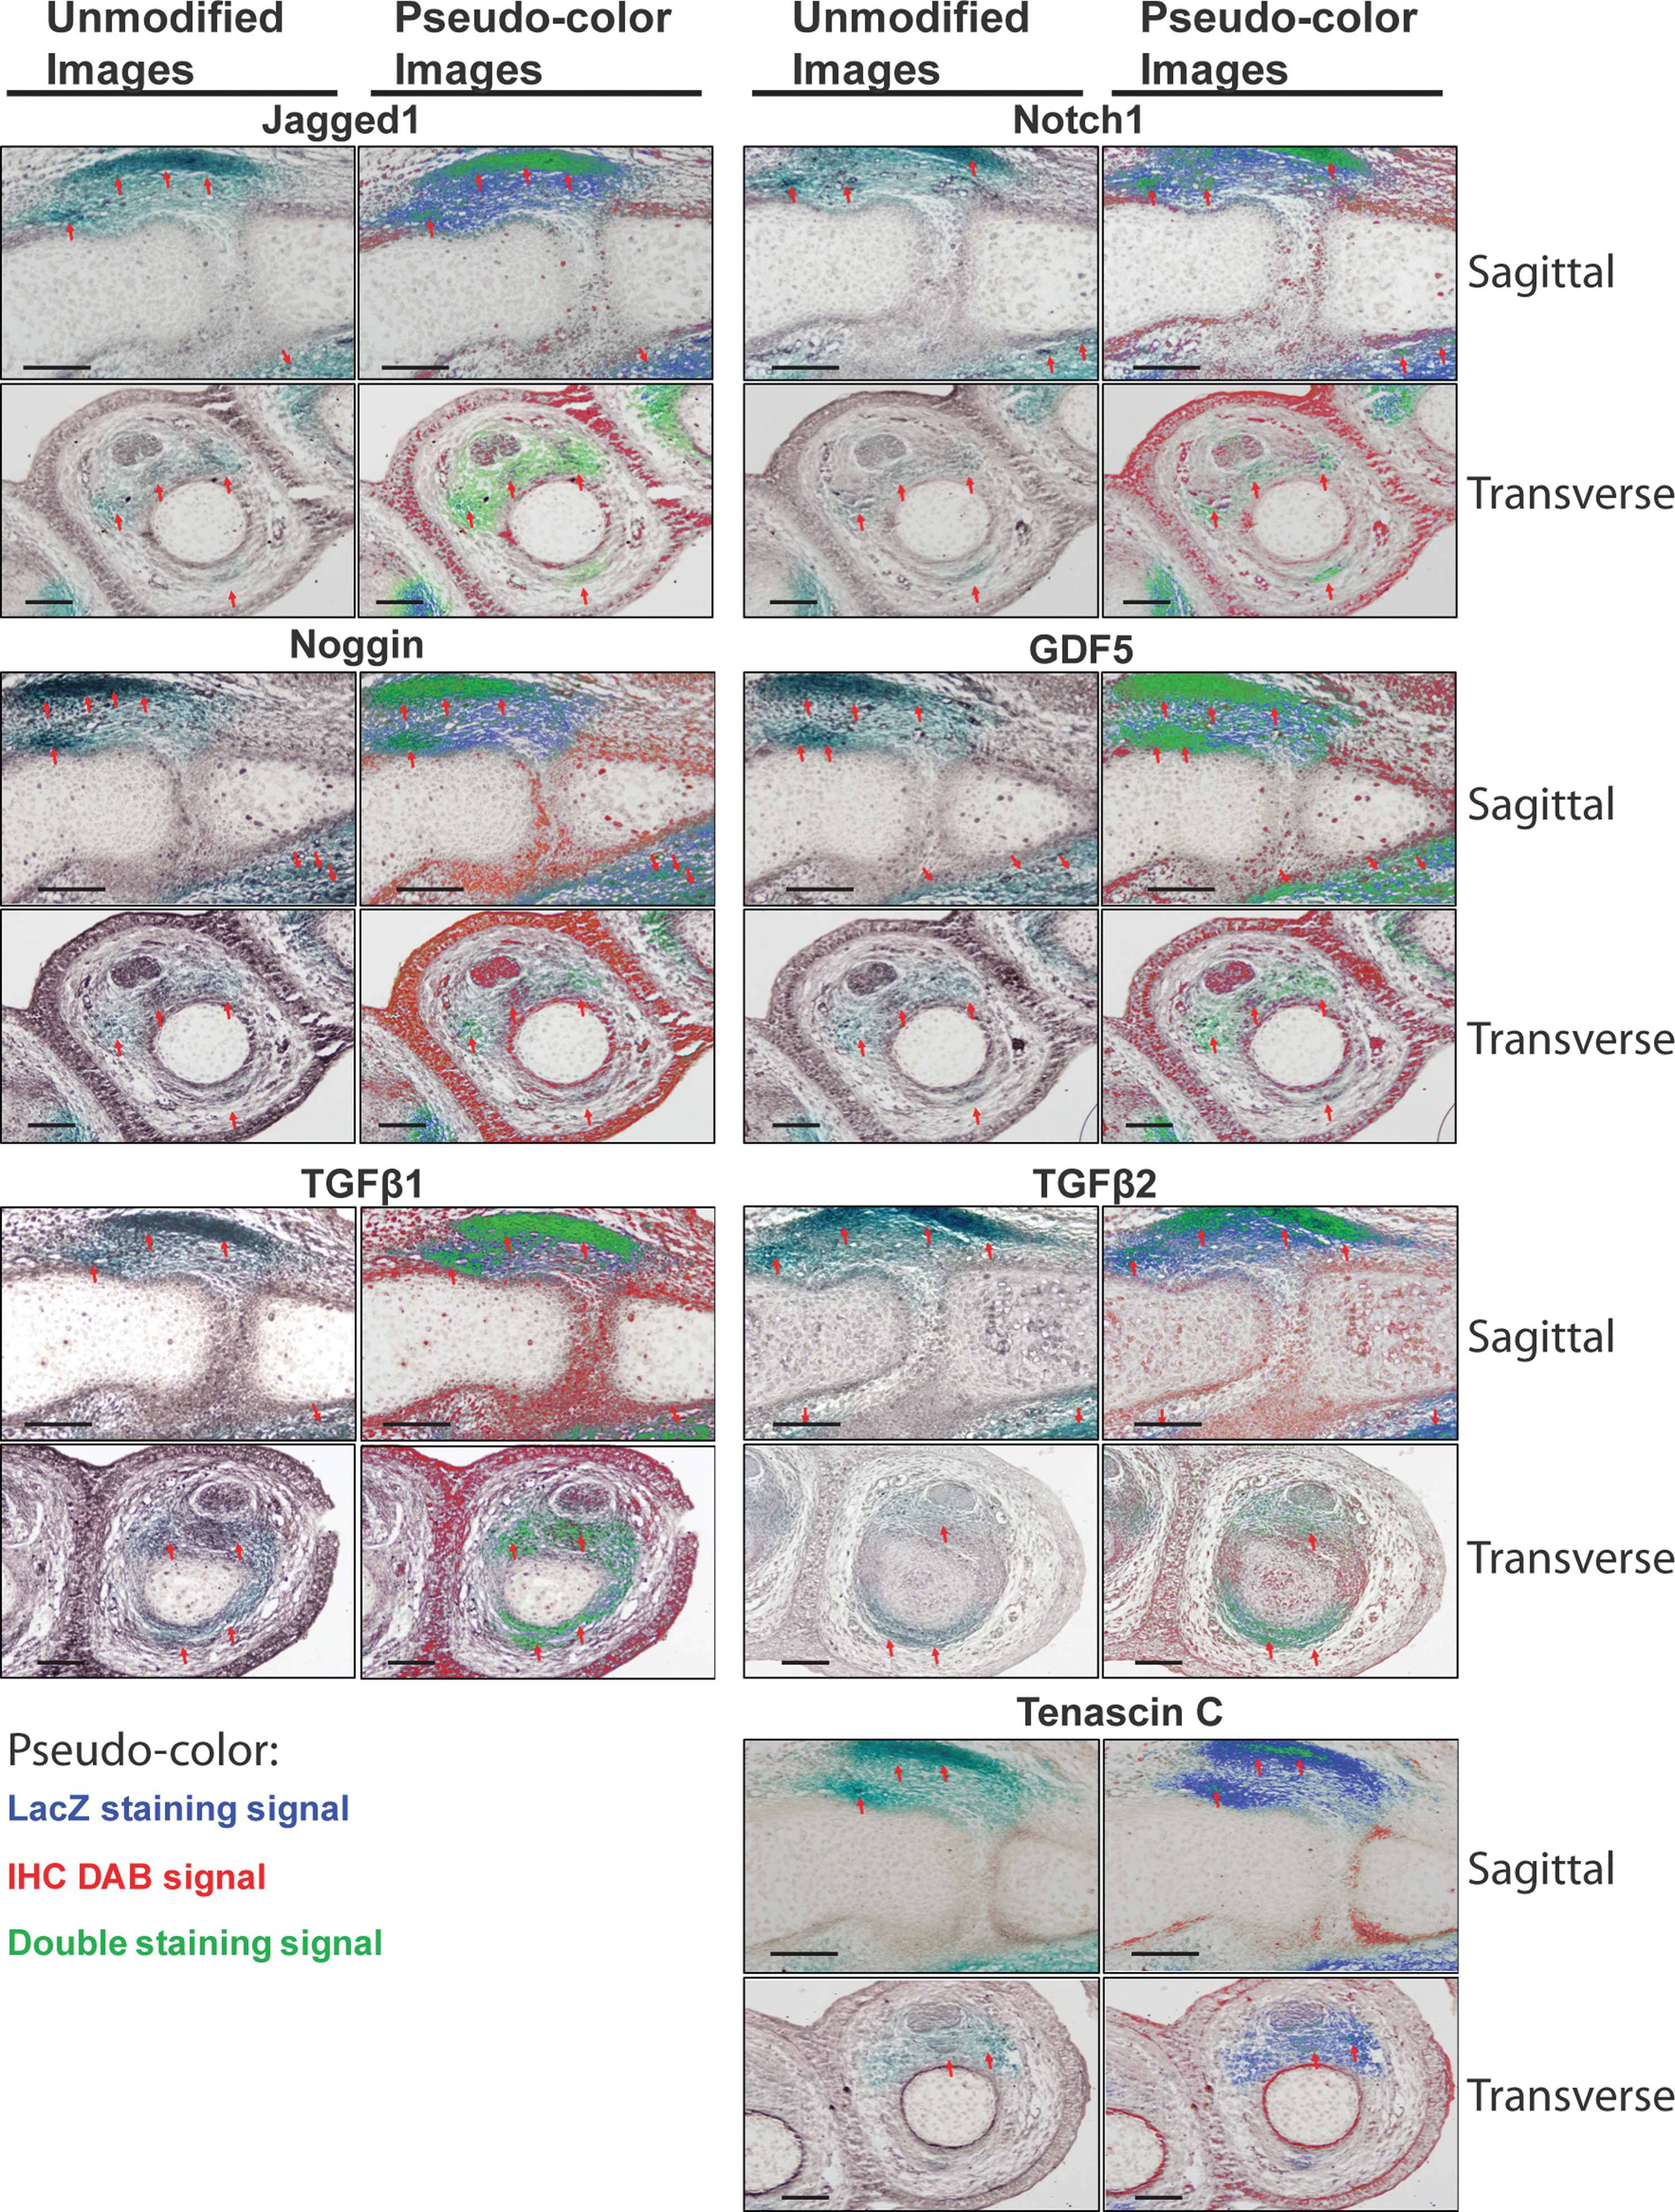
Colocalization of Tgfbr2 with joint and progenitor makers in E16.5 interphalangeal joints. Limbs from E16.5 Tgfbr2-β-Gal-GFP-BAC mice were LacZ stained. Sagittal and transverse sections were subjected to immunohistochemistry (IHC) using Jagged1, Notch1, Noggin, GDF5, TGF-β1, TGF-β2, and Tenascin C antibodies; immunostaining was visualized using a peroxidase-based DAB system (IHC-DAB). Data are presented either as unmodified images (left upper and lower panels related to each IHC study) or after pseudocolor image processing (right upper and lower panels related to each IHC study) to highlight the signals of either single-stained cells (in blue for single LacZ signal and red for single IHC-DAB signal) or double-stained cells (in green for LacZ+IHC signal). For unmodified images light blue represents single LacZ positive signal, light brown presents single IHC-DAB positive signal, and dark brown represents double LacZ+IHC-DAB positive signal. Red arrows indicate regions for double-positive LacZ+IHC-DAB signals. Studies were performed in at least three sections for each sectioning plane obtained from at least two mice at each time point. Scale bars: 100 μm.
Taken together, coexpression studies indicate that Tgfbr2-expressing cells provide a signaling niche to promote joint development in synchrony with the Noggin, GDF5, and Notch pathways, corroborating our previous findings that the Tgfbr2 is needed to regulate expression of these joint morphogenic factors.
Characterization of Tgfbr2-expressing cells as slow-proliferating progenitor cells by BrdU labeling studies
An established method to identify stem cells within different tissues is labeling of slow-cycling cells, namely, the stem cell population, with BrdU [32]. To determine whether Tgfbr2 cells are slow proliferating, we performed three distinct analyses of BrdU incorporation: the first (termed Study 1) aimed at labeling slow-proliferating cells from the embryonic through early postnatal life, the second (termed Study 2) and third study (termed Study 3) to label postnatal cells at two postnatal life time points (P6w for Study 2 and P20d for Study 3) and analyzing BrdU chasing, respectively, 14 and 21 days (Study 2) and 52 days (Study 3) after last dose of BrdU (Figs. 7 and 8). In Fig. 7, we report BrdU analyses of Tgfbr2-β-Gal-GFP-BAC mice that received BrdU in the prenatal life (given to pregnant mothers from E15.5 to P0) (Study 1) and sacrificed at P14 and P28. We found that at P14 (Fig. 7B), and even more clearly at P28 (Fig. 7B′) after BrdU, the majority of the Tgfbr2-LacZ-positive cells within the groove of Ranvier (R1) contiguously within the synovio-entheseal-articular cartilage complexes (R2 and R3) and the tendons (R4) of the interphalangeal joints were also positive for BrdU, labeling as slow-proliferating cells; R1, R2, R3, and R4 regions were marked with a red dashed line. Table 1 reports the quantification of Tgfbr2 single positive (blue cells), BrdU single positive (cells with black/dark brown nuclei), and Tgfbr2+BrdU double positive (blue cells with black/dark brown nuclei) and their percentage either over the total of Tgfbr2 single+double positive or over the BrdU single+double-positive cells within those niches. Twenty-eight days after BrdU, at least 70% of the Tgfbr2-LacZ-positive cells were double positive.

Characterization of Tgfbr2-expressing cells as slow-cycling joint progenitor cells at prenatal stage (Study 1). Bromodeoxyuridine (BrdU) Study 1 is schematically presented in
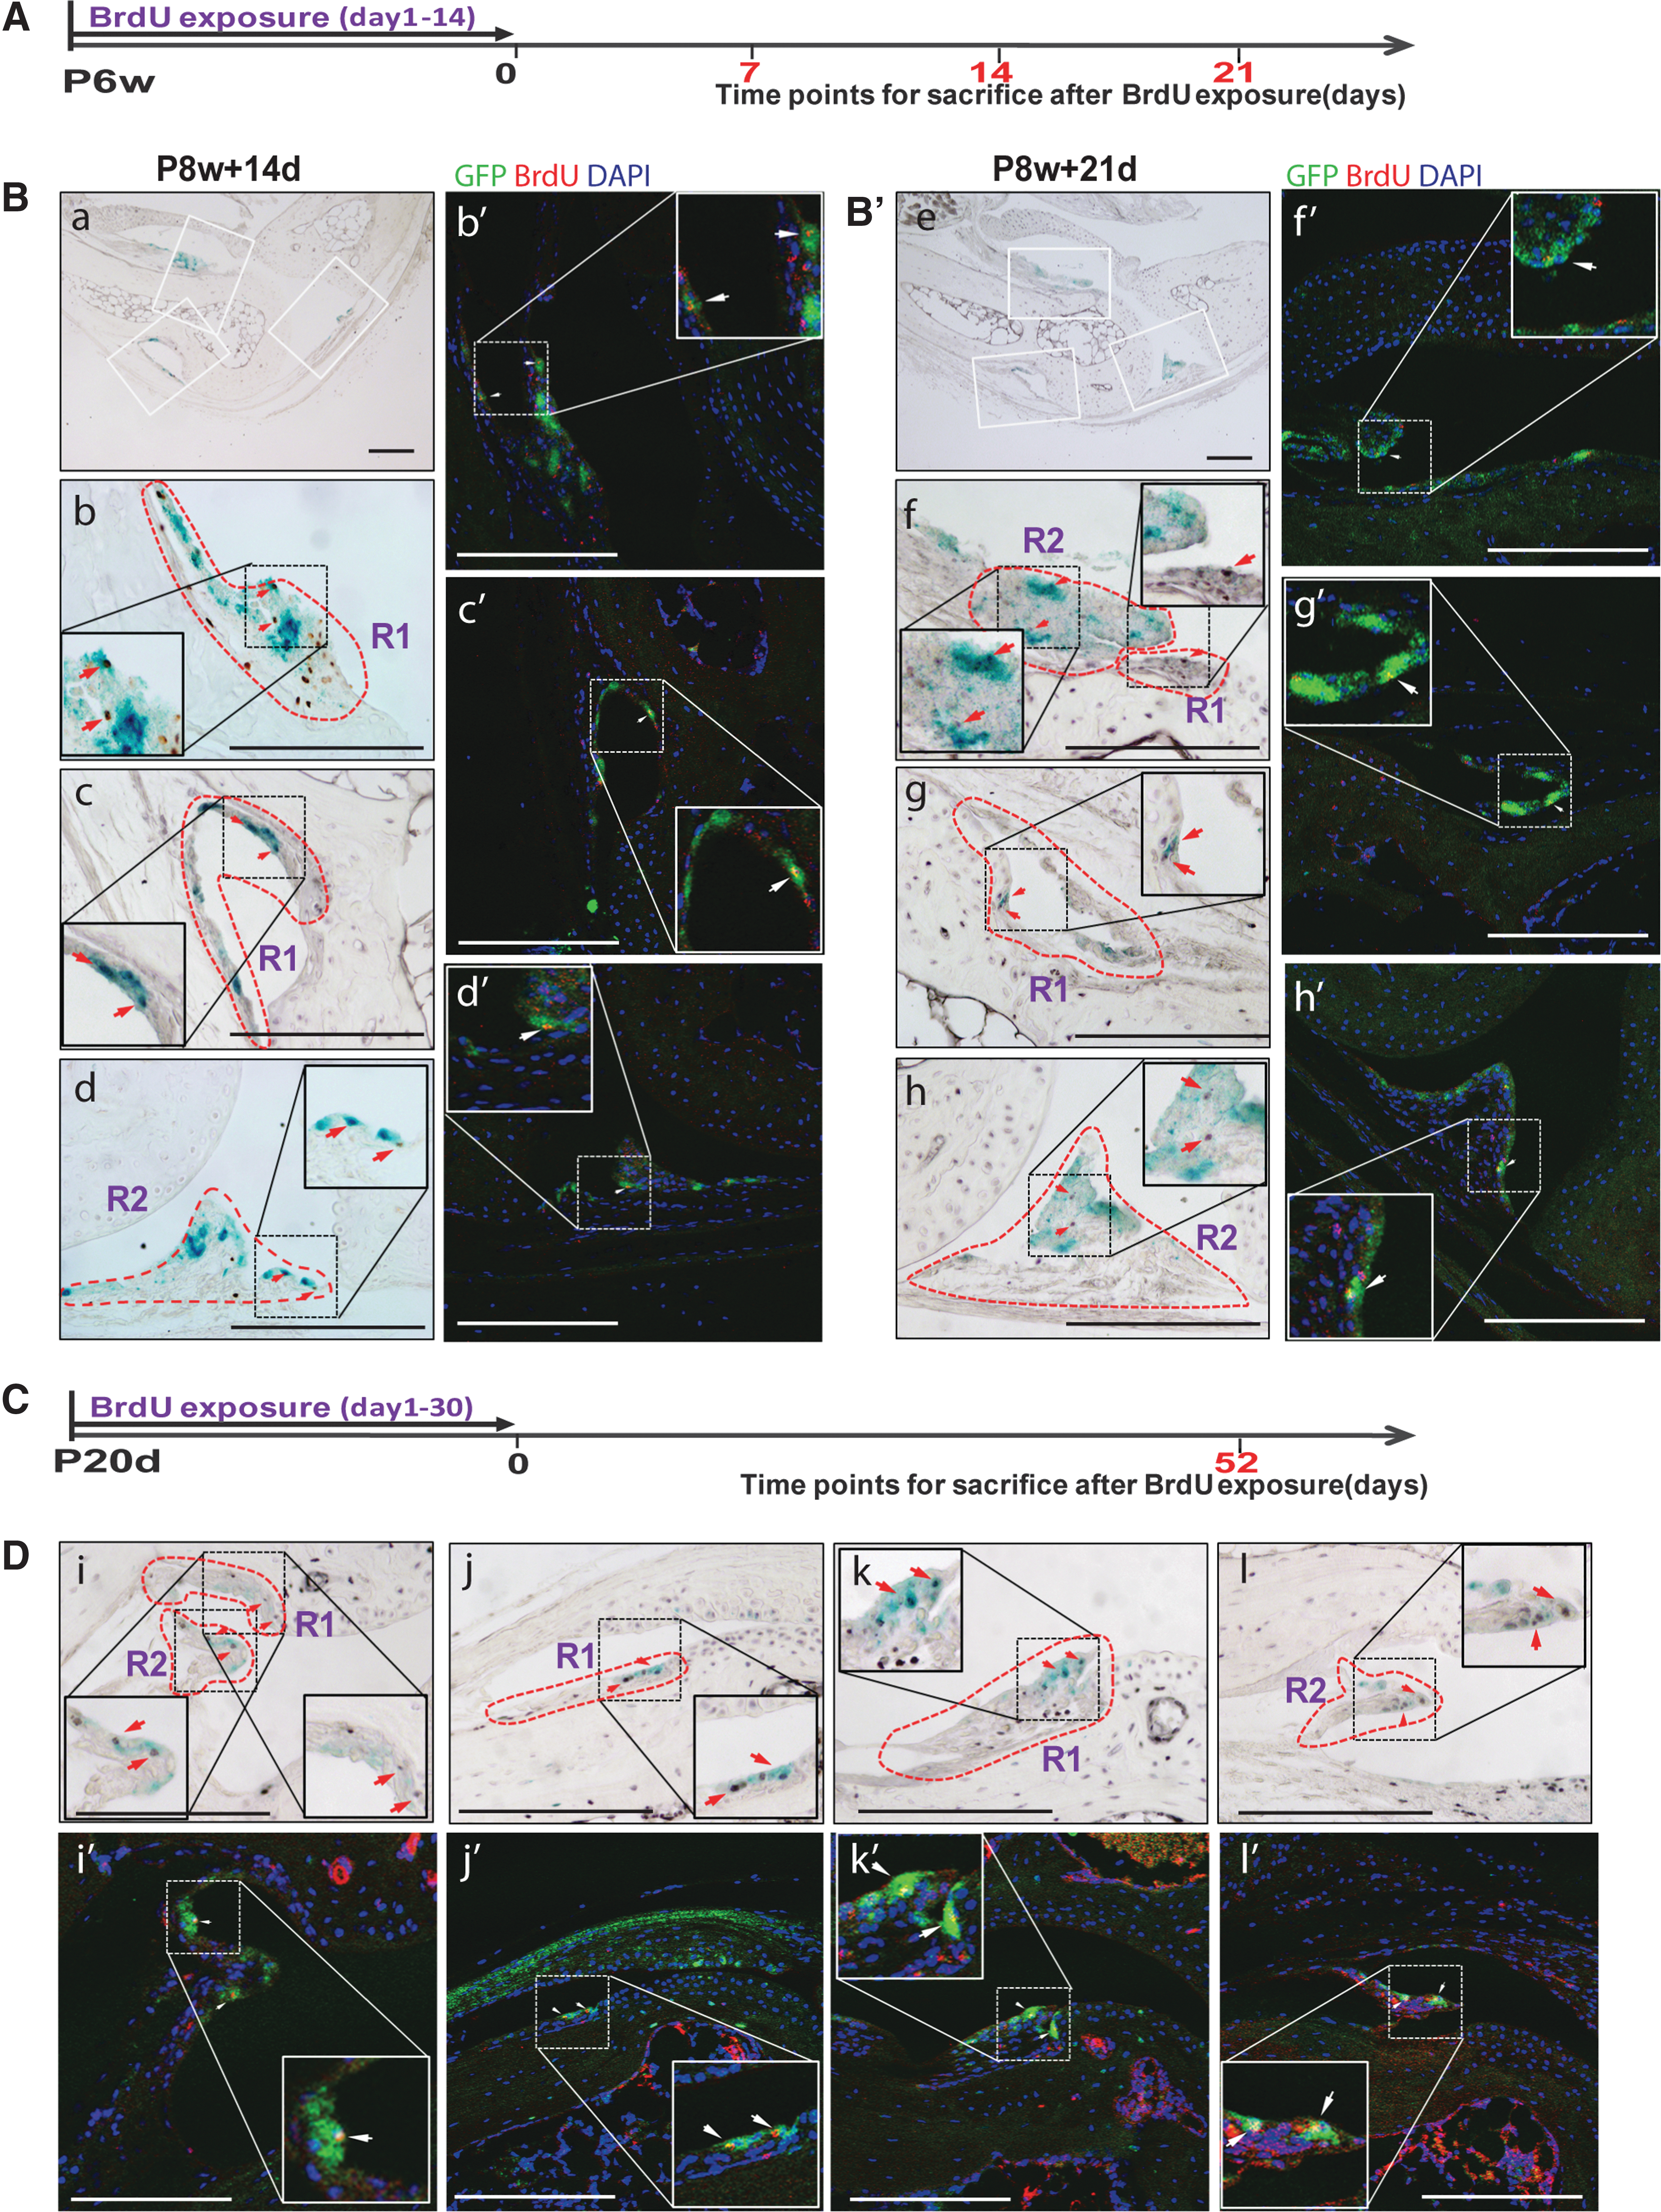
Sections from BrdU Study 1, Study 2, and Study 3 (see text) were analyzed. To quantify single- and double-positive cells, pictures were taking from slides subjected to LacZ staining and BrdU IHC and then slides were placed into 1×PBS solution for 20 min to remove the cover slips and then stained with Fast Red to obtain nuclear staining; single- (either LacZ or BrdU) or double-positive cells and total cells in the region of interest were counted in six adjacent sections from two mice at each time point. Tgfbr2-LacZ single-positive cells (blue), BrdU-IHC single-positive (black or dark brown), and LacZ-BrdU double-positive (blue cells with black or dark brown nuclear) cells were counted within specified regions of interests. Regions of interests are shown in Figs. 7 and 8 to which this table refers. Cells, within the specified region of interests, were counted in six adjacent sections from two mice at each time point.
BrdU, bromodeoxyuridine; IHC, immunohistochemistry; PBS, phosphate buffered saline.
For Study 2, we exposed 6-week-old mice to BrdU for 14 days and mice were sacrificed 14 (P8w+14d=P10w) (Fig. 8B) and 21 days (P8w+21d=P11w) (Fig. 8B′) after BrdU exposure. LacZ-stained dissected digits were sectioned (sagittal plane) and subjected to either IHC for BrdU using a peroxidase-based system [Fig. 8B(a–d)] or adjacent sections [Fig. 8B(b′–d′)] to double IF for GFP and BrdU using Alexa Fluor–based system. We performed GFP (another reporter gene in Tgfbr2-β-Gal-GFP-BAC mice) and BrdU double IF analyses to confirm the IHC results of BrdU incorporation studies. For IHC, Tgfbr2-β-Gal single LacZ-positive cells are shown in blue; black/dark brown shows positive cells for BrdU-IHC; blue cells with black/dark brown nuclear indicates BrdU+LacZ double-positive cells (red arrows). For IF studies [Fig. 8B(b′–d′), B′ (f′–h′)] Tgfbr2-GFP single-positive cells are shown in green; red shows BrdU single-positive cells; yellow indicates BrdU+GFP double-positive cells; DAPI (blue) is used for nuclear counterstaining. IF pictures depict regions [Fig. 8B(b′–d′), B′ (f′–h′)] that were adjacently compatible to the ones depicted by IHC studies [Fig. 8B(b–d), B′ (f–h)]. Tgfbr2-LacZ/BrdU localized within specific niches, in particular the groove of Ranvier and contiguous synovial-entheseal-articular cartilage complexes (R1 and R2 marked with red dashed line) of the interphalangeal joints labeling as slow-proliferating cells. IF analyses [Fig. 8B(b′–d′), B′ (f′–h′)] depicted Tgfbr-2-GFP-BrdU double-positive cells as well as single cells within the same regions with the same distribution depicted by LacZ/BrdU staining/IHC [Fig. 8B(b–d), B′ (f–h)], indicating that the reporter system is robust and double-staining studies are valid.
For Study 3, we exposed 20-day-old mice to BrdU for 30 days and mice were sacrificed 52 days (P20d+30d+52d=P102d) after BrdU exposure. As shown in Fig. 8D (i–l, respectively, for LacZ-BrdU IHC and i′–l′ for GFP-BrdU IF), Tgfbr2/BrdU double-positive cells were also found in regions that were compatible to the R1 and R2 regions found for Study 2. Again, IF analyses [Fig. 8D(i′–l′)] depicted Tgfbr-2-GFP-BrdU double-positive cells as well as single cells within the same regions with the same distribution depicted by LacZ/BrdU staining/IHC [Fig. 8D(i–l)]. Table 1 reports cell counting data on the double-positive cells. Study 2 and Study 3 showed similar percentage number of double-positive cells, with between 50% and 80% of the Tgfbr2-LacZ-positive cells in the R2 region were found to be double positive. Taken together, those findings clearly indicate that Tgfbr2-expressing cells are slow-proliferating progenitors.
Tgfbr2-expressing cells retain the ability to express joint trait and progenitor markers in postnatal joints
We next assessed whether in adult joints, Tgfbr2-expressing cells coexpress joint trait markers (GDF5 and Noggin), tendon markers (Tenascin C), and components of the Notch system expressed by joint progenitors (Notch1 and Jagged1). IHC analyses were performed in sections adjacent to the ones in which IHC for BrdU was performed. Figure 9 (pseudocolor images) and Supplementary Fig. S5 (unmodified images) show IHC analyses of P14 and P28 postnatal interphalangeal joints, indicating that more than 70% of the Tgfbr2-LacZ-positive cells coexpress traits and progenitor joint markers, such as GDF5, Noggin, Notch1, and Jagged1. They also coexpress markers of differentiated tendon cells when located within the specific joint element (ie, Tenascin C in tendons). Tgfbr2-expressing cells also coexpressed TGF-β1 (Fig. 9 and Supplementary Fig. S5). These findings in adult joints were consistent with the findings observed in embryonic studies (Fig. 6). Similar results were observed when analyses were performed in 10-week-old mice (data not shown). To further validate the Tgfbr2-β-Gal reporter system, we performed IHC for p-Smad2 at P14, P28 and found that all the LacZ-positive cells were also positive for p-Smad2 (Fig. 9 and Supplementary Fig. S5). Taken together, these results demonstrate that joint Tgfbr2-expressing cells localize within specific niches where they label as slow-proliferating cells and express joint markers.
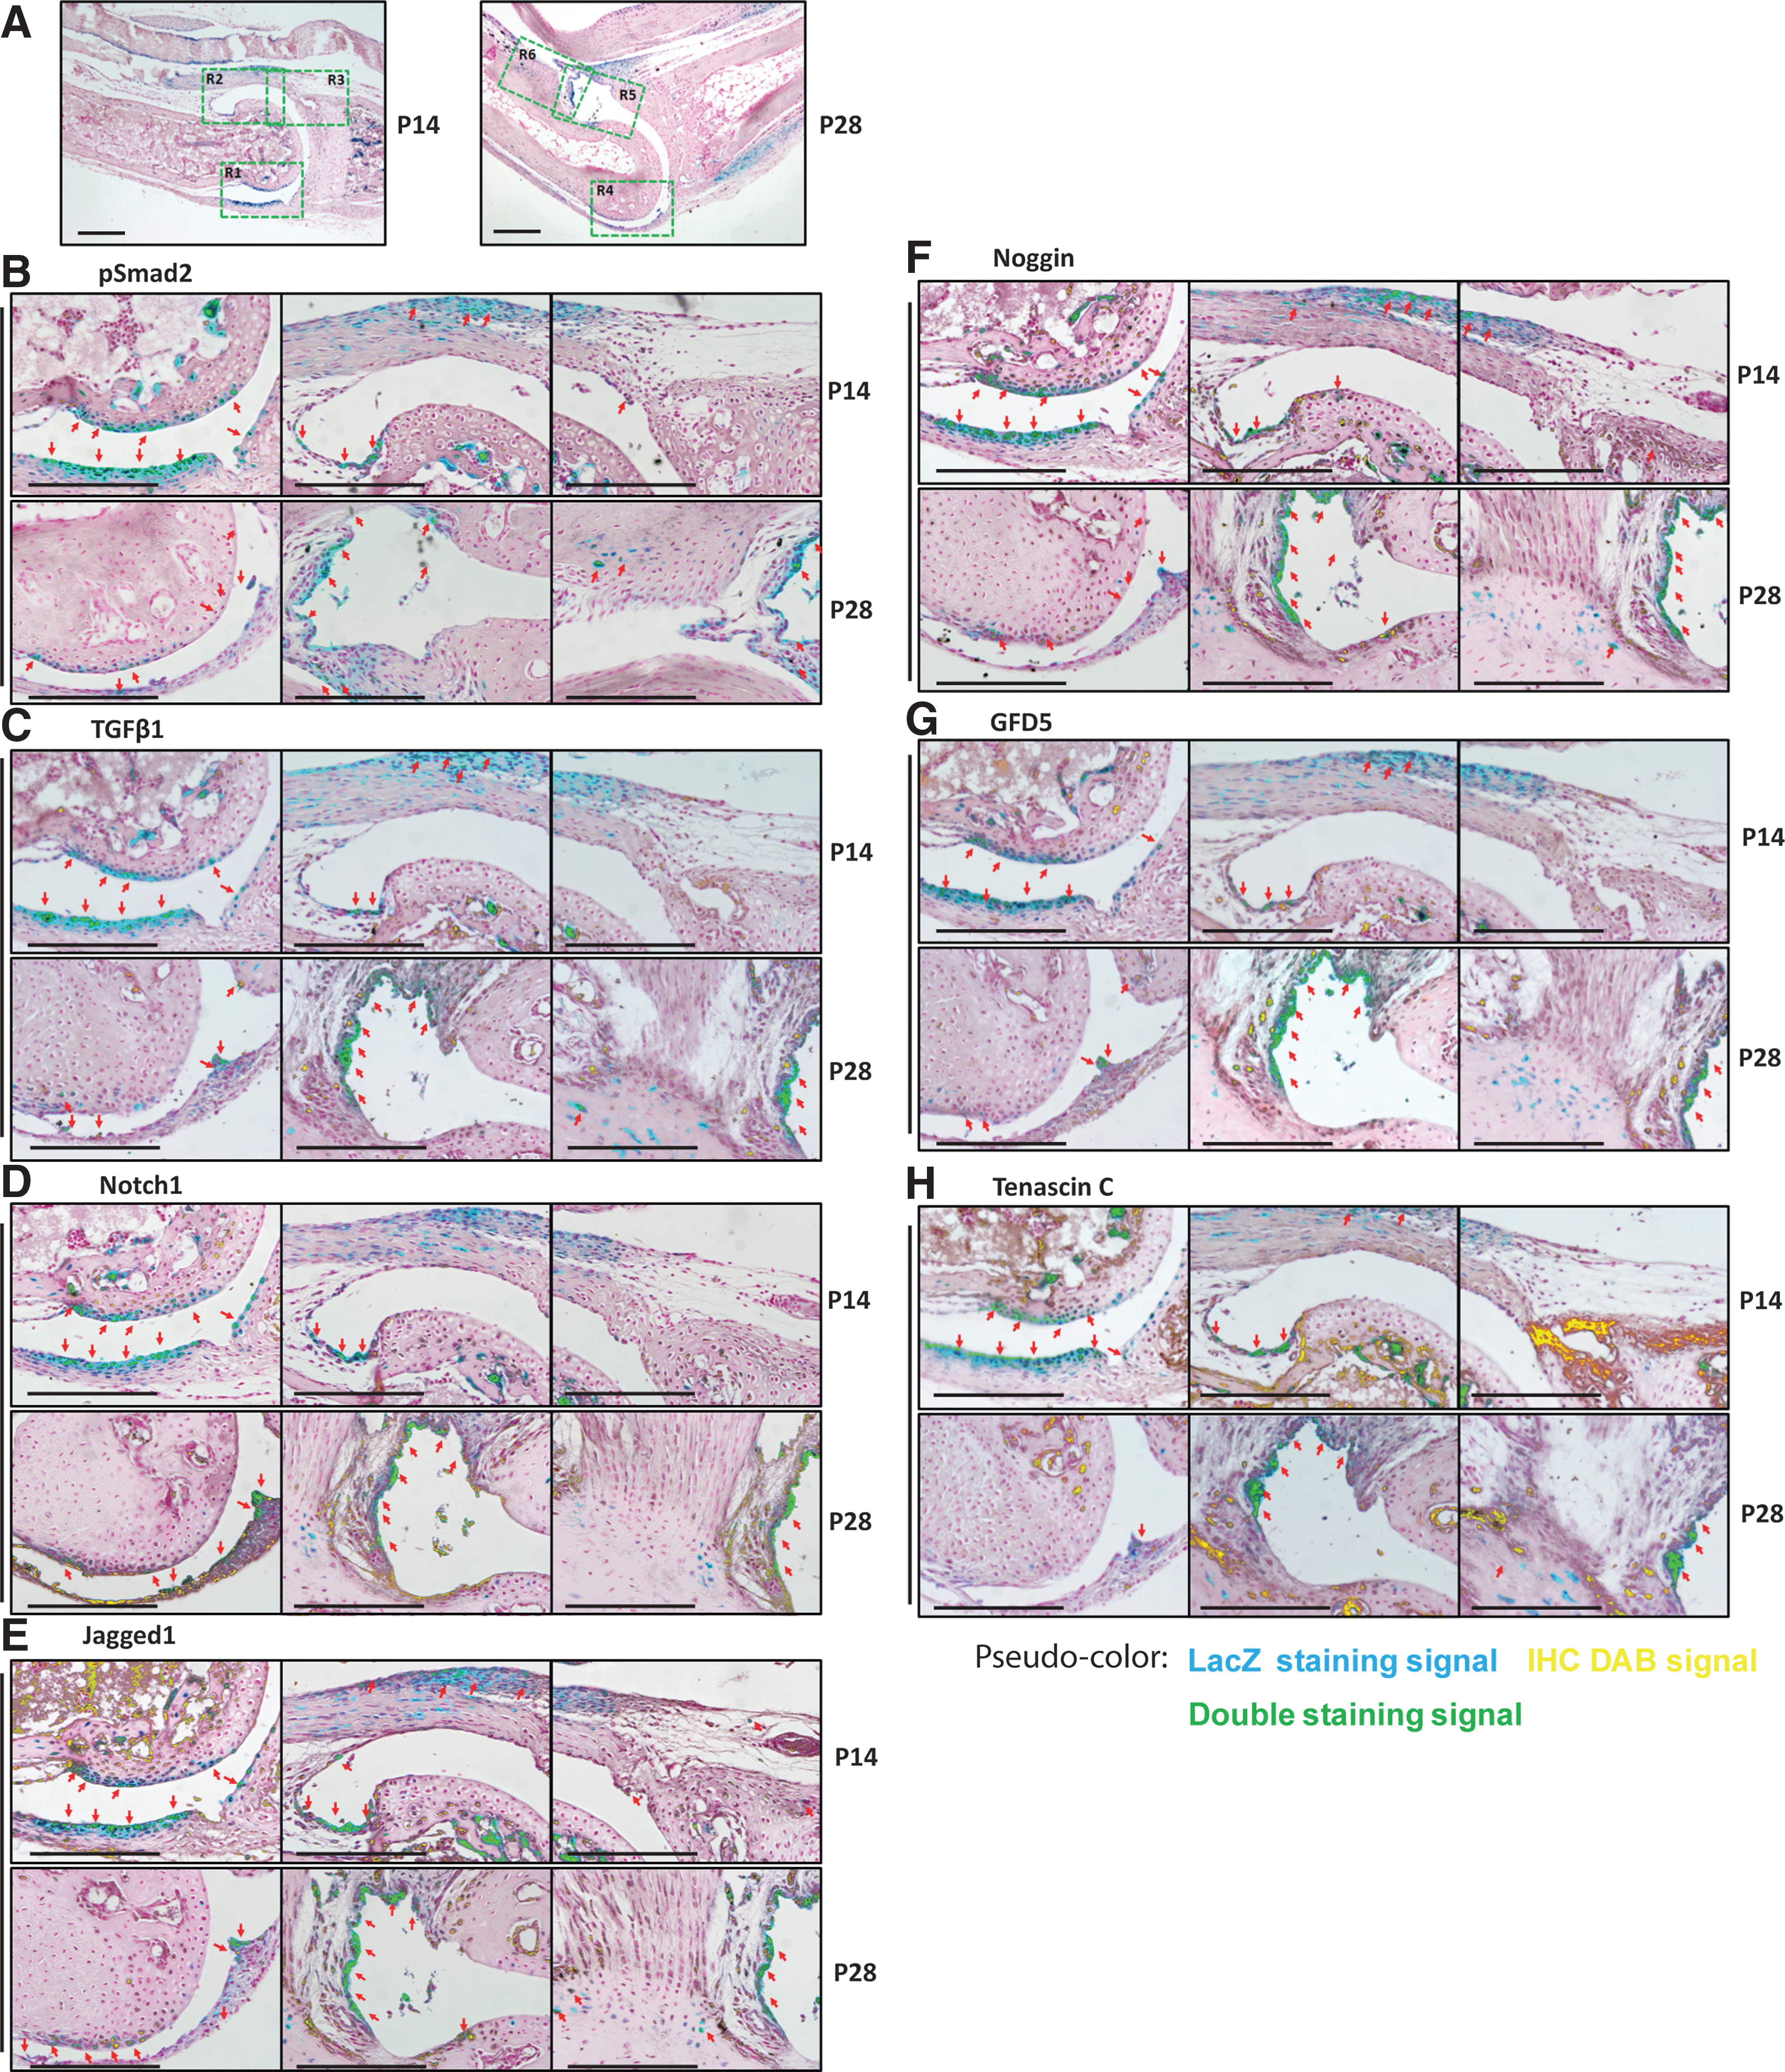
Tgfbr2-expressing cells retain the ability to express Jagged1, Notch1, Noggin, GDF5, TGF-β1, TGF-β2, and Tenascin C in postnatal interphalangeal joints. Forelimbs from P14- and P28-old Tgfbr2-β-Gal-GFP-BAC mice were LacZ stained, sagittal sections obtained, and adjacent sections subjected to IHC using antibodies against p-Smad2
Isolation and characterization of joint Tgfbr2-expressing cells
Our data have so far indicated that Tgfbr2-expressing cells are highly restricted to specific areas that are maintained throughout adult life; within those niches, cells express joint and progenitor/stem cell markers and are slow proliferating. This remarkable consistency led us to determine: (1) whether isolated Tgfbr2-positive cells express the same repertoire of genes we found by histological analyses; (2) whether such expression are regulated through critical stages of joint development; and (3) the effects of TGF-β on isolated cells. For this purpose mesenchyme cells obtained from the digits of E13.5 and E14.5 Tgfbr2-β-Gal-GFP-BAC embryos were subjected to GFP-based FACS sorting to obtain Tgfbr2-positive cells. We have generally obtained ∼200,000 positive cells from five to seven embryos and positive fraction has been 0.97%±0.17% (n=3) from E13.5 embryos and 1.62%±0.25% (n=3) from E14.5 (Supplementary Fig. S6). The interval between E13.5 and E14.5 is critical in joint development; at E13.5 the interzone develops and by E14.5 the forming joint segments from the adjacent growth plates. These rapid anatomic changes are associated with a rapid change in joint morphogenic marker gene expression [33]. As shown in Figs. 1 and 2, Tgfbr2 expression within the joint is minimal at E13.5 with a rapid expansion at E14.5 where it occupies the domains where it will be maintained throughout adulthood. This observation led us to perform comparative gene expression profiling of Tgfbr2-positive cells obtained at E13.5 versus cells obtained at E14.5. As shown in Fig. 10, we found that when compared to Tgfbr2-positive cells obtained at E13.5, cells obtained at E14.5 expressed higher levels of trait joint genes (Notch1, GDF5, Noggin, Collagen 1, Gli3, Sulf1, and Wnt9a), differentiated joint element cell marker genes, including articular cartilage (Collagen 2) and tendon marker genes (Scleraxis and Tenascin C) and synoviocyte marker genes (Lubricin). A population of joint interzone cells has been recently identified based on the negative expression of Matrilin 1 [34]. We found that in Tgfbr2-positive cells either from E13.5 or E14.5 embryos, Matrilin 1 was undetectable. To determine the responsiveness of Tgfbr2-positive cells to TGF-β1, cells isolated from E14.5 digits were cultured with TGF-β1 for 16 h. We found that cells responded to treatment by increasing joint trait and progenitor markers such as Notch1, GDF5, Noggin, and Sulf1, articular cartilage markers such as Aggrecan, tendon markers such as Scleraxis and Tenomodulin, and synoviocyte markers such as Lubricin (Fig. 10). We found that TGF-β1 treatment led to a decrease of Tgfbr2, Collagen I, Wnt9a, and Collagen II (Fig. 10).
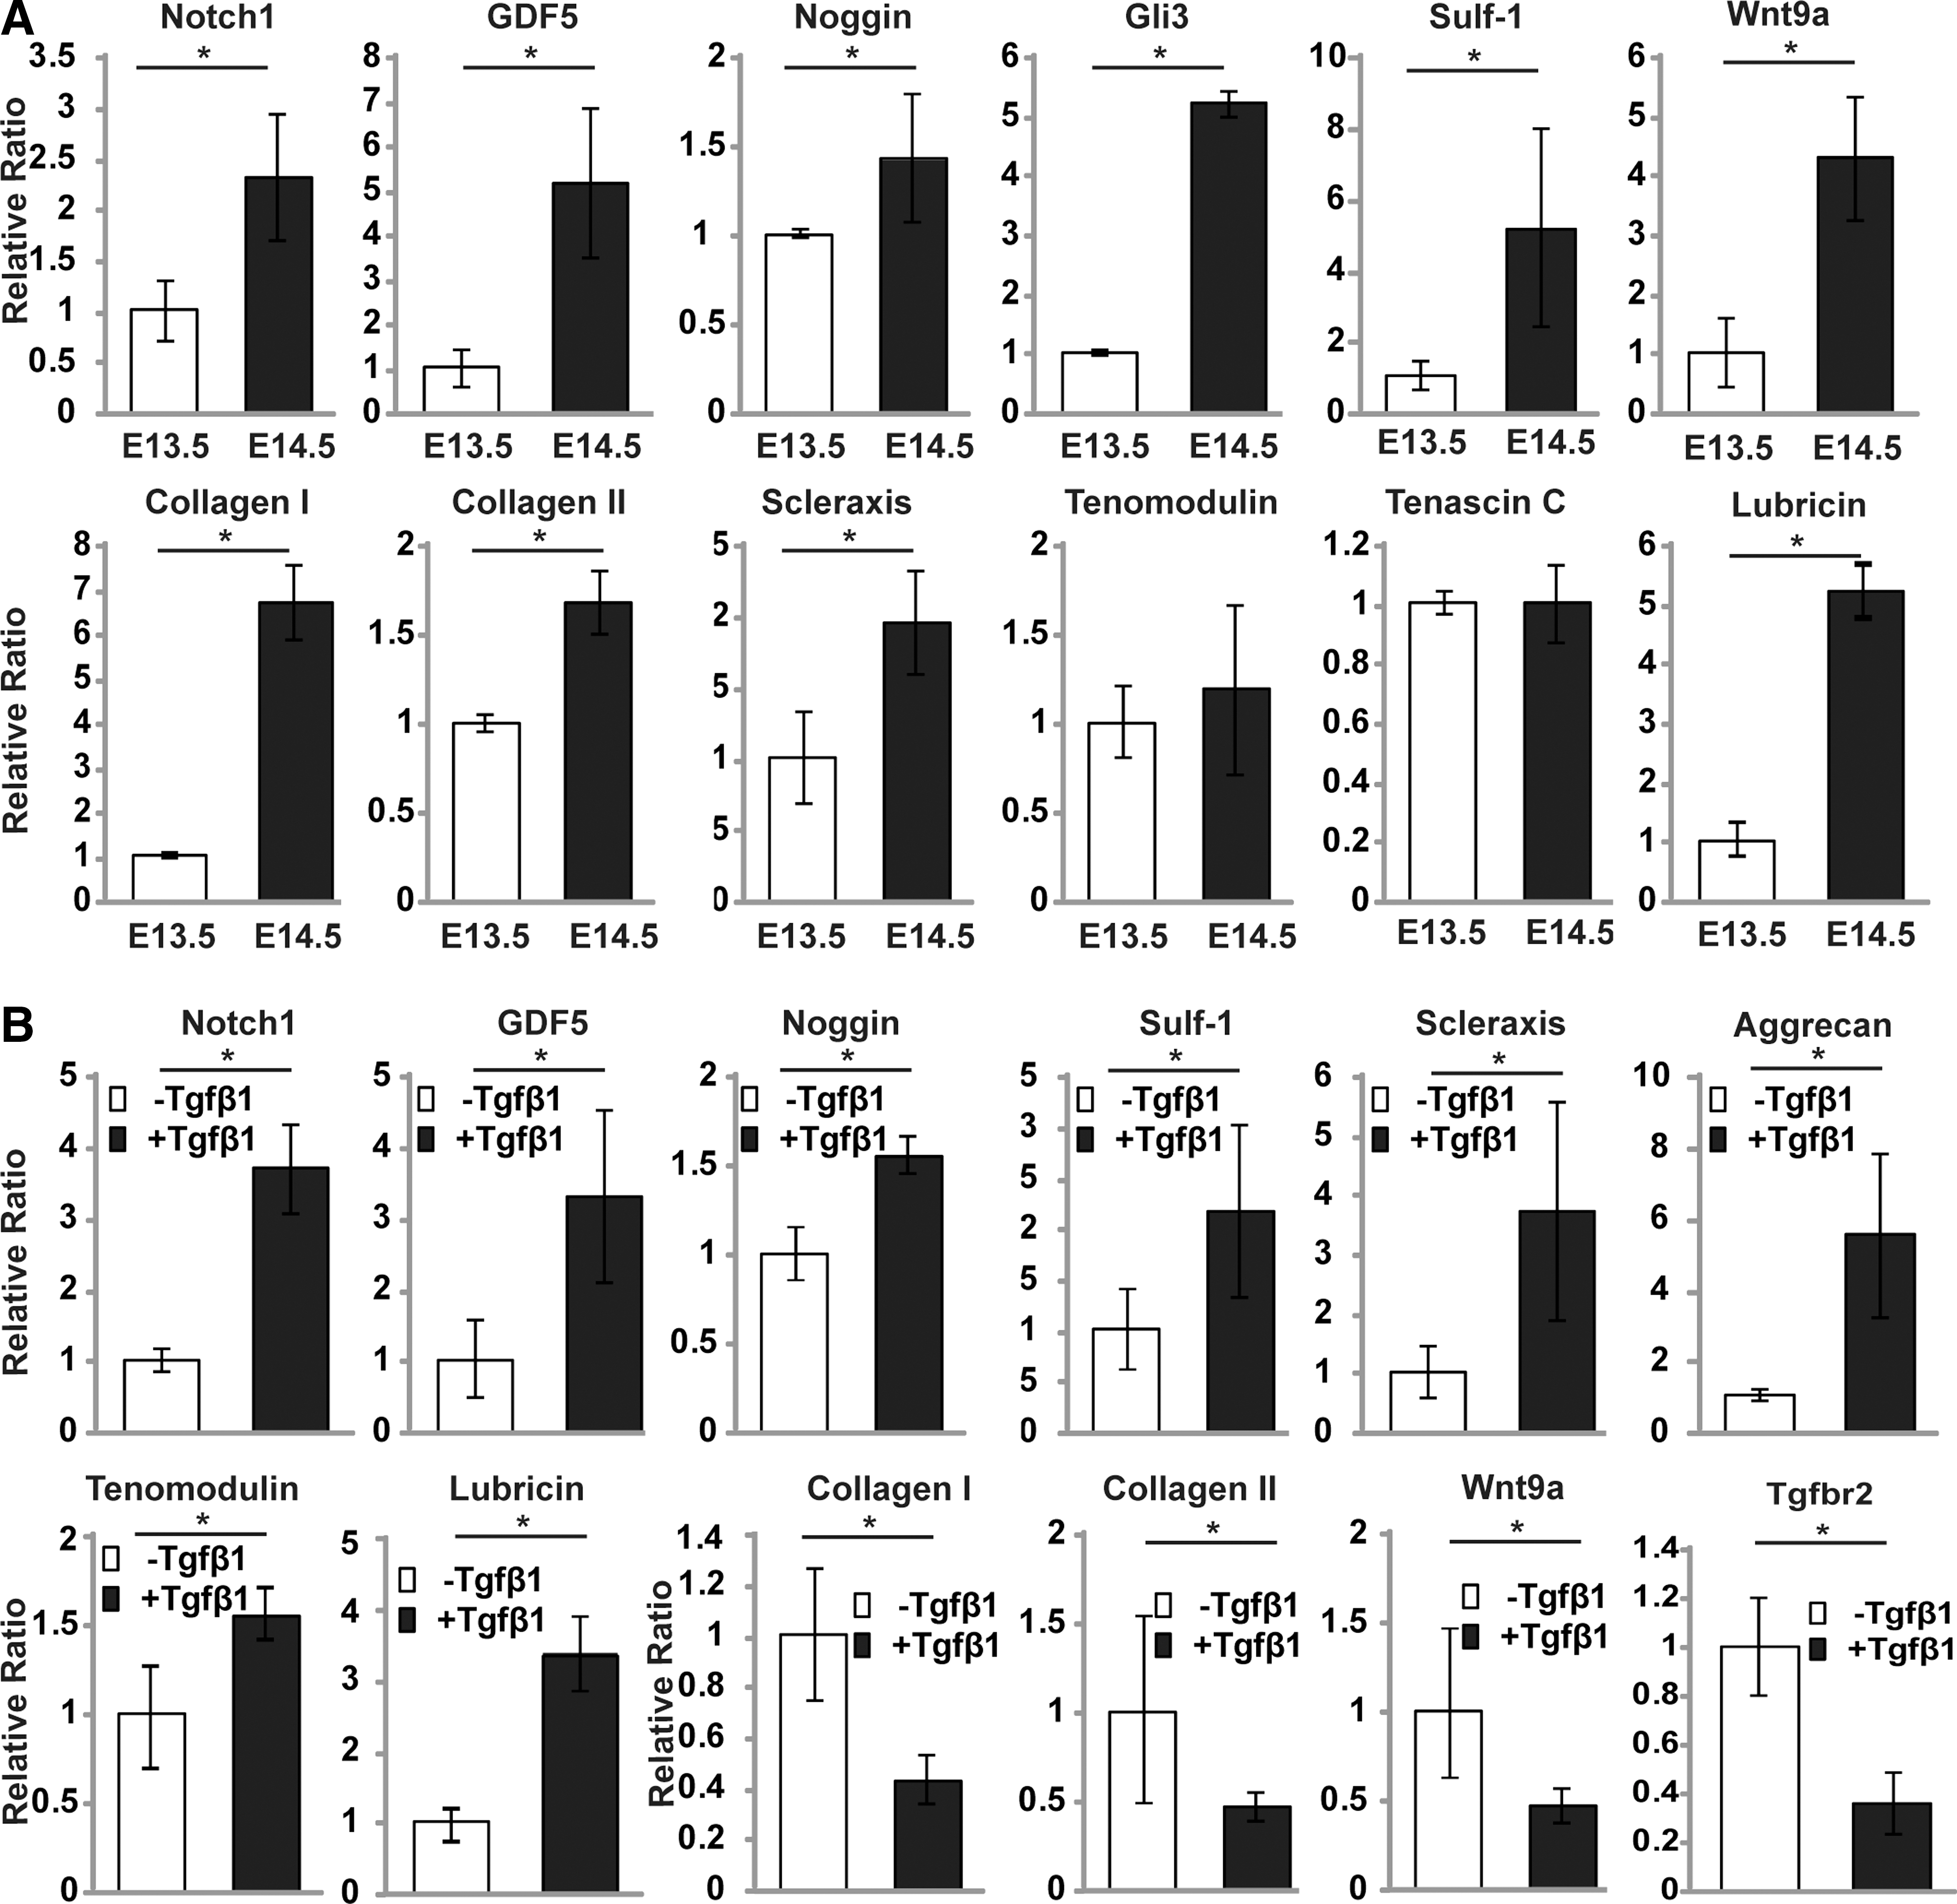
Isolated Tgfbr2 joint progenitor cells express markers of differentiated joint elements while maintaining expression of joint progenitor markers. Expression is regulated by development and the activation of the TGF-β signaling. Distal tips of autopods from either E13.5 or E14.5 Tgfbr2-β-Gal-GFP-BAC embryos were dissected and subjected to enzymatic digestion to obtain single-cell mesenchyme populations. Cells were subjected to GFP-based fluorescence-activated cell sorting (FACS) sorting.
The isolation from synovium of potential joint progenitors/stem cells has been reported and those cells express some of the MSC markers [26,35,36]. Therefore, we evaluated in Tgfbr2-positive cells the expression patterns of gene markers for MSCs. We found that Tgfbr2-positive cells express several MSC markers; remarkably, we found that 100% of cells express CD29 (Supplementary Fig. S7). As expected, Tgfbr2 cells were negative for CD34, CD11b, and CD45, markers of adult hematopoietic cells (Supplementary Fig. S7). Taken together, our data indicate that we have identified and isolated Tgfbr2 joint progenitor cells that can express markers of differentiated joint elements while maintaining joint progenitor marker expression and such expression is regulated by the activation of TGF-β signaling.
Discussion
In the present study we have identified and characterized a population of joint cells with the unique signature of Tgfbr2 expression, a gateway receptor in joint development. We found that within the interphalangeal joints, Tgfbr2-expressing cells localize into specific niches comprising the groove of Ranvier and the contiguous synovio-entheseal-articular cartilage complex. These niches are consistently maintained from the time of interzone development to early adulthood. Tgfbr2-expressing cells were found in the synovio-entheseal complex niche with similar temporal pattern in the knee, where they were also detected in meniscal surface, ligaments, and the synovial lining of the infrapatellar fat pad. Within these niches, the Tgfbr2-expressing cells coexpress joint morphogenic and progenitor/stem cell markers and have a slow-proliferative trait. Tgfbr2-expressing cells isolated from embryonic digits express joint progenitor as well as terminally differentiated joint markers and expression are development dependent as well as TGF-β dependent.
Identification and, most importantly, functional characterization of joint progenitors have been a challenge. During development, we have limited knowledge of specific markers for interzone cells and in postnatal joints, we lack information on whether these cells maintain expression of embryonic markers and their contribution to joint homeostasis. Most of the studies that track joint progenitors have been based on knock-in lineage tracing strategies that led to the identification of Matrilin-1 (negative) and GDF5 (positive) interzone expressing cells [12,34]. Although powerful, this strategy carries the disadvantage of the irreversible activation of the reporter activity that tags the cell and its progenies indefinitely and thus impedes the possibility of determining the cell–cell temporal expression pattern. By generating the Tgfbr2-β-Gal-GFP-BAC mice, we were able to determine the real-time expression pattern of Tgfbr2-expressing cells, their ontogeny from the time of interzone development to adulthood and their temporally and spatially consistent localization within specific niches. Further, our studies uniquely look into the expression of Tgfbr2, a gene that is essential for joint development as indicated by the loss of interzone development and joint morphogenic marker expression in the Tgfbr2PRX-1KO mouse [3]. In contrast, Matrilin-1 is not essential for joint development and Matrilin-1 knock-out mice do not show any overt skeletal phenotype [37]. The brachypodism mouse carrying null-sense mutations for GDF5 has limited joint abnormalities [6]. Further, ectopic GDF5-Cre expression has been raised as a concern in the Gdf5-Cre mice used to perform lineage-tracing for GDF5-expressing joint progenitors [12,38].
The interzone is an essential signaling center for joint determination although the contribution of the interzone cells to the development of joint elements remains to be determined. Further the cellular organization varies among species, making comparative analyses difficult. In fact in the chick, the interzone consists of three distinct layers, while in humans and rodents, only a thin flattened layer is identified [39,40]. Another important question is the primary source of articular cartilage cells. One school of thought favors the idea that they are derived from the flattened interzone cells while another from the epiphyseal growth zone [12,34]. Studies have not led to clear conclusions because they either relied on the lack of a phenotypic trait (Matrilin-1) and/or cells could not be monitored for emergence over time [12,34]. Our data provide novel means to understand the organization and the fate of the interzone cells. We found that within the interzone, Tgfbr2-expressing cells localize in the dorsal region of the developing interzone (Domain 1 in Fig. 2) and this domain extends and is retained through early adulthood. Tgfbr2-expressing cells show in vivo and in vitro developmental plasticity as they express markers of differentiated joint elements along with joint progenitor markers and TGF-β modulates such plasticity. Our data support a novel hypothesis for interzone development, in which the Tgfbr2-expressing cells play an essential role as progenitors that orchestrate joint development within specified niches. It also supports the concept, proposed by others but not fully sustained by conclusive data, for a common progenitor for the distinct joint elements as supported by the cell expression profile of the Tgfbr2 cells, their in vitro differentiative plasticity and the lack of several joint elements in the Tgfbr2PRX-1KO mouse.
Our studies have been primarily focused on determining the in vivo progenitor/stem cell nature of Tgfbr2-expressing cells by BrdU analysis, expression profiling, and histological/anatomical localization within niches. Our in vitro studies in freshly isolated cells have extended and/or confirmed the gene expression profiling of the cells and evaluated responsiveness to TGF-β in short-term (16 h) primary cultures. We recognize that freshly isolated or primary cultured cells can represent a mixed population of Tgfbr2-expressing cells and future in vitro studies on clonally expanded cells and lineage differentiation assays would be exciting and provide additional information on the stemness of the cells. We also recognize that such in vitro studies have limitations such that culturing condition and passaging would not necessarily prove and may actually alter the stemness that occurs within the natural niche that has been addressed by our in vivo studies.
We have used different means to validate the Tgfbr2 expression pattern detected by LacZ staining in Tgfbr2-β-Gal-GFP-BAC mice. Our results indicate that the system seems to be consistent and robust; we recognize that new antibodies and probes can be generated for further validation and to determine the endogenous expression of Tgfbr2. We have previously reported IF and ISH studies that detected Tgfbr2 expression at the joints and those data have been confirmed in the current study that also shows that those regions are detected by LacZ staining in Tgfbr2-β-Gal-GFP-BAC mice as well as by IHC for p-Smad2 [3]. However, we have noted additional signals detected by immunostaining and ISH for Tgfbr2. Those signals are most likely not specific as indicated by their persistence in the Tgfbr2Prx1KO and the lack of overlapping with p-Smad2 immunodetection, indicating that immunostaining and ISH detection using these Tgfbr2 antibody and probe seem to be sensitive but not specific. Over the past several years our laboratory has tried several antibodies for IHC and IF and probes for ISH to detect the Tgfbr2 expression, although the ones showed are the finest in term of sensitivity we are still not satisfied with the results. This poor specificity (noted by other investigators) was one of reasons that led us to generate the Tgfbr2-β-Gal-GFP-BAC mouse.
Our data provide novel evidence for a cohort of joint cells that continue to express Tgfbr2 within specific niches throughout sexual maturity and in a time-dependent manner. It is possible that the Tgfbr2-expressing cells are a different cell population that emerges over the lifespan of the organism. However, the consistent topographical expression profile when evaluated at close time points makes this possibility unlikely. In recent years, the identification of progenitor cells within adult joint elements has fundamentally challenged the dogma of joints and in particular articular cartilage as a postmitotic tissue. Progenitors have been identified within the articular cartilage as slow-cycling cells [9,41,42]. Isolation of presumptive articular cartilage progenitors has been based on fibronectin adhesion and positive expression for Notch1 and chondroitin sulfate sulfation motifs [9 –11,35]. Joint progenitors have also been isolated from infra-patellar fat pad and the synovium, the latter having been shown to express MSC markers [10,14,26,35,36]. Despite these encouraging in vitro studies, the ability of adult joint progenitors to express differentiated joint element markers while maintaining slow-cycling trait has never been proven in vivo. In our studies, we identified native niches for Tgfbr2-expressing cells and in two distinct BrdU studies we have characterized that within those niches, the Tgfbr2-expressing cells are slow proliferating and express markers of progenitors as well as differentiated joint elements. Stem cells/progenitors are generally found to reside in niches that provide the cellular and extracellular environment to orchestrate the timing and levels of signals that stem cells receive, thus directing their fate over contrasting cell-fate decisions such as self-renewal or differentiation. Joint formation is a fast and dynamic process where development and rearrangement occur in a well-defined time and space frame; on the other hand, adult joints have limited regenerative abilities. Our studies identified Tgfbr2-expressing cells that were maintained within specific niches from embryonic life throughout early adulthood although characterized by a progressive age-dependent reduction in number. This is an important finding that confirms the existence of joint progenitor cells in adulthood, highlights the persistence from prenatal to postnatal life, and outlines the decline with aging. The identification of Tgfbr2 adult joint progenitors opens the prospects for potential ways to reactivate the joint-forming abilities of those cells, to implement their survival during aging, and to evaluate their role in arthritic degeneration.
The identification of the Tgfbr2-expressing cells within the groove of Ranvier and the contiguous synovio-entheseal-articular cartilage complexes is intriguing. Recent studies based on BrdU incorporation in mature rabbits have identified the groove of Ranvier as a niche for joint progenitors [13]. We have determined that the slowly proliferating cells within the groove of Ranvier and the contiguous synovio-entheseal-articular cartilage complexes specifically express Tgfbr2 and coexpress GDF5, Noggin, Notch1, and Jagged1. Within these niches, Tgfbr2-expressing cells localize in the superficial layers of the articular cartilage, tendons, and synovial, sites where progenitors of these joint elements have been identified [9,26,43]. Whether the slow-proliferating-Tgfbr2-expressing cells represent a reservoir of stem cells for the articular cartilage, synovium, and tendon progenitors needs to be determined. The proximity to those niches makes the migration process plausible and the in vitro studies may indicate such plasticity.
Shapiro et al. have morphologically identified three layers for the groove of Ranvier, a deeper layer of densely packed cells adjacent to the growth plate, an intermediate layer of more widely dispersed cells, and a superficial fibrous layer of fibroblast-like cells and collagen fibers [16]. As stated by the same authors, this layer-based terminology is in accordance with the terminology used by Ranvier that first described the groove [19]. Through postnatal development the layers become part of the periosteum [18]. The biological functions of the morphologically identified cells within the layers still remain elusive. Interestingly, we noted that within the groove, the Tgfbr2-expressing cells can be found in different layers of the groove, either in the deeper and outer (Fig. 4), or in all the layers (Fig. 6). Localization within the layers does not appear to be specific for a particular joint and we cannot exclude that can be related to the angle of sectioning even within the same plane. In future studies it will be interesting to determine whether the localization of the Tgfbr2-expressing cells within the layers of the groove is related to a specific function.
The concept of synovio-entheseal-articular cartilage complex comes from the clinical observation that in patients with OA and spondylarthritis the sites where enthesis, synovium, and articular cartilage converge are all subjected to inflammation, therefore leading to the concept of arthritis as “an organ” disease [20]. This relatively old concept has reemerged and has been strengthen by recent magnetic resonance imaging studies that have shown that synovitis and enthesitis can occur early in the OA process at a stage when the articular cartilage appears relatively normal [21]. The concept of arthritis as an “organ disease” has led to the hypothesis of a common mechanism that links the pathological process and affects different tissues at sites of crossroads [20]. The finding of a defined niche for a Tgfbr2 stem population within the synovio-entheseal-articular cartilage complex raises the fascinating possibility of a stem cell disease as a pathogenic mechanism in the arthritic process. Future studies are needed to further explore this hypothesis.
Functions of specific cell populations can be inferred from (1) in vivo studies either based on conditional knock-out of genes specifically expressed by the targeted cell population or aimed at determining a cell function, that is, slow-proliferating trait; (2) histological/imaging studies in which the cells expressing specific markers are identified within specific tissues; and (3) direct isolation and in vitro studies of the cells themselves. We have used all three approaches to characterize the roles and functions of Tgfbr2 in joints. In our previous studies we found that the conditional knock-out of Tgfbr2 in developing limb mesenchyme leads to lack of interphalangeal joint formation as well as lack of knee tendons and menisci [3,4]. The present studies provide direct evidence of Tgfbr2-expressing cells as joint progenitors describing their niches, slow-proliferative profile, and plasticity. The latter was assessed using primary cultures of isolated Tgfbr2-positive cells from digital mesenchyme. Our data show that Tgfbr2-positive cells have the dual capacity to express progenitor markers, such as Notch1, and initial joint trait markers, such as GDF5, Gli3, and Wnt9a, while they can be steered by TGF-β treatment and developmental growth to express chondrocyte (aggrecan), synoviocyte (lubricin), and tenocyte (scleraxis) markers. This plasticity represents a major asset of the Tgfbr2-positive cells, as pointed out above the cells can function as the initiators of distinct joint elements and potentially give rise to chondrogenic, ligaments/tendons, and synovial lining cellular elements. It is interesting to note that TGFβ-treatment led to a decrease of Tgfbr2 expression while also decreasing some of the chondrogenic markers such as Collagen 2. We hypothesize that TGF-β is a critical factor to steer the cells into distinct developmental programs while controlling Tgfbr2 expression. Joint progenitors have been reported to express adult MSC markers [26,36]. Interestingly, we also found that Tgfbr2-positive cells express several MSC markers reinforcing the concept of Tgfbr2 cells as mesenchymal progenitor.
In conclusion, we have provided evidence that Tgfbr2-expressing cells have anatomical, ontogenic, slow-cycling proliferative trait and in vivo and in vitro expression profile of progenitor joint cells. The identification of this novel population of joint progenitors provides insights not only to the understanding of joint development but also opens novel prospective to the study and treatment of the arthritic process.
Footnotes
Acknowledgments
This work was supported by NIH-NIAMS grant no. 5R01AR057042-02 and by an Arthritis Foundation Investigator Award to A.S. The authors acknowledge the support of Dr. Doug Mortlock (Vanderbilt University) in providing advice with the generation of the Tgfbr2-β-Gal-GFP-BAC mice.
Author Disclosure Statement
No competing financial interests exist.
References
Supplementary Material
Please find the following supplemental material available below.
For Open Access articles published under a Creative Commons License, all supplemental material carries the same license as the article it is associated with.
For non-Open Access articles published, all supplemental material carries a non-exclusive license, and permission requests for re-use of supplemental material or any part of supplemental material shall be sent directly to the copyright owner as specified in the copyright notice associated with the article.