
Abstract
The central role of calcium influx and electrical activity in embryonic development raises important questions about the role and regulation of voltage-dependent calcium influx. Using cultured neural progenitor cell (NPC) preparations, we recorded barium currents through voltage-activated channels using the whole-cell configuration of the patch-clamp technique and monitored intracellular free calcium concentrations with Fura-2 digital imaging. We found that NPCs as well as expressing high-voltage-activated (HVA) calcium channels express functional low-threshold voltage-dependent calcium channels in the very early stages of differentiation (5 h to 1 day). The size of the currents recorded at −50 versus −20 mV after 1 day in differentiation was dependent on the nature of the charge carrier. Peak currents measured at −20 mV in the presence 10 mM Ca2+ instead of 10 mM Ba2+ had a tendency to be smaller, whereas the nature of the divalent species did not influence the amplitude measured at −50 mV. The T-type channel blockers mibefradil and NNC 55-0396 significantly reduced the calcium responses elicited by depolarizing with extracellular potassium, while the overall effect of the HVA calcium channel blockers was small at differentiation day 1. At differentiation day 20, the calcium responses were effectively blocked by nifedipine. Time-lapse imaging of differentiating neurospheres cultured in the presence of low-voltage-activated (LVA) blockers showed a significant decrease in the number of active migrating neuron-like cells and neurite extensions. Together, these data provide evidence that LVA calcium channels are involved in the physiology of differentiating and migrating NPCs.
Introduction
Studies on VGCC in central nervous system development have usually been performed on postnatal neurons such as young Purkinje cells. These studies have been paramount in furthering our understanding of the changes in cellular functions during neuronal maturation. However, despite the clear role of VGCC in neural development [2,11,12], the expression and function of these channels during embryonic neurogenesis are less well investigated.
There have been few reported studies investigating functional VGCC in neural progenitor/stem cells. Voltage-gated calcium channels have previously been reported to be functionally expressed in differentiated postnatal neural progenitor cells (NPCs), with mainly L-type VGCC appearing after differentiation for 3 days [10]. Studies that have focused on characterizing VGCC have usually directed their measurements of NPCs after several days to several weeks of in vitro culturing. Further, the cells have usually been plated as monolayers, often overlooking the possible correlation between migration and VGCC channel function, in which the neurosphere-plating method provides, since cell migration with reference to the neurosphere can be used as a measuring parameter. As specific classes of cells come to reside in specific layers of the neocortex, migration reflects a program of neuronal fate [13]. Our previous studies on neurotransmitter responses showed a correlation between distance to the mother neurosphere and evoked responses [14,15]. Cells expressing neuronal markers such as NeuN and ligand-gated ion channels tend to accumulate at the outermost layers of migration [16,17].
Here we present evidence that NPCs as well as expressing HVA calcium channels express functional low-threshold voltage-dependent calcium channels that play an important role in the very early stages of differentiation (5 h to 1 day), while the L-type VGCC role becomes more evident as the neural cell matures. Neurospheres cultured in the presence of LVA blockers showed a significant decrease in the number of migrating neuron-like cells and in neurite extensions, supporting the notion that LVA channels are involved in the regulation of neural migration and neurite extension.
Materials and Methods
Cell cultures
NPCs were propagated from the wall of lateral ventricles of embryonic day-14 mice and grown as free-floating cell aggregates termed neurospheres as previously described [18]. All animal experiments were performed according to the guidelines of the Animal Ethics Committee of the National Laboratory Animal Center, Finland. Dissociated cells were plated in the culture medium containing of 2 mM
Materials
4-(2-hydroxyethyl)-1-piperazineethanesulfonic acid (HEPES), ethylene glycol-bis[β-aminoethyl ether]N,N,N′,N′-tetraacetic acid (EGTA), N-methyl-
Calcium imaging
Neurospheres [20–30 middle-sized (∼225 μM) spheres] were placed on poly-
Immunocytochemistry
NPCs on cover glasses were fixed for 10 min at room temperature (RT) with 4% paraformaldehyde in phosphate-buffered saline (PBS; pH 7.4) and then rinsed twice with PBS. The cells were then permeabilized with ice-cold methanol for 20 min and rinsed twice for 5 min with PBS. To prevent the nonspecific binding of the antibodies, the cells were treated for 20 min in RT with 20% normal goat serum (NGS; Chemicon International) in PBS. Next, the cells were incubated with either mouse monoclonal Tuji1 (1:500) or rabbit polycolonal MAP-2 (1:500), and then rabbit polyclonal primary anti-T-Type calcium channel (α1G subunit, 1:50; Sigma-Aldrich), or GLAST, and anti-NeuN (both from Millipore) antibody overnight in +4°C. The cells were then washed 3 times for 5 min with PBS and stained with goat anti-rabbit Alexa 488 secondary and/or anti-mouse Alexa 546 antibody (Molecular Probes, Invitrogen; 1:500) in 37°C for 1 h, and again the cells were repeatedly washed with PBS. The nuclei of the cells were counterstained with 4′6-diamino-2-phenylindole (DAPI; Boehringer Mannheim Biochemica; 1:10,000). The cover glasses were rinsed again with PBS and mounted with a Gel Mount™ Aqueous Mounting Medium to glass slides. Laser-scanning confocal microscopy was performed with an LSM 5 Pascal system (Zeiss). Brightness and contrast of the obtained images were adjusted with Corel Draw Graphics Suite ×3 (Corel). To control the specificity of the antibodies, primary or secondary antibodies were left out from some of the samples. For negative controls, primary antibodies were omitted, resulting in the disappearance of all staining.
Whole-cell patch-clamp recordings
Macroscopic currents were recorded by the whole-cell patch-clamp technique at RT [19]. Patch electrodes (model PG-150T; Harvard Apparatus) were prepared with a PC-10 puller and flamed polished with microforge MF-900 (Narishige) to a resistance of 3–4 MΩ. Patch pipettes were filled with an internal solution containing (in mM) 140
RNA isolation, cDNA synthesis, and real-time PCR
Total RNA was isolated from NPCs differentiated for 1 and 5 days using the RNeasy Mini Kit (Qiagen) according to the manufacturer's instructions. RNA was quantified using a NanoDrop ND8000 spectrophotometer (Thermo Scientific), and Transcriptor High-Fidelity cDNA Synthesis Kit (Roche Applied Science) and random hexamer primers were used for cDNA synthesis. cDNA was amplified with a LightCycler® 480 SYBR Green I Master Kit and a LightCycler 480 system (both from Roche Applied Science). The primers used for the amplification of VGCC (Cav1.1–Cav1.3 and Cav3.1–Cav3.3) have been published before [20]. The PCRs were optimized to suit our conditions. Melting peak analysis and analysis of PCR fragments on agarose gel were performed to verify product specificity. The PCR data were normalized to β-actin and 18S rRNA using geNorm software. The normalization primers used were as previously described [16]. Primers were used at a final concentration of 1 μM.
Cell-IQ
The Cell-IQ® system (Chip-Man Technologies Ltd.) is a self-contained cell-culturing instrument combining phase-contrast microscopy, environmental control, and automation. The imaging system enables continuous monitoring of NPCs in two 6-well plates in an integrated plate holder. The instrument contains an automated optics module, an integrated incubator (±0.2°C), 2 incubation gas flow controllers, and precision movement stages (x, y axes:±1 μm; z axis:±0.4 μm) fully controlled through machine vision-based firmware and analysis software.
Data processing
Fura-2 imaging data were analyzed with Microcal Origin 6.0 and given as absolute [Ca2+] levels, [Ca2+]i, or as changes in [Ca2+] levels, Δ[Ca2+]i. Statistical significance between groups was determined with the unpaired Student's t-test. In the figures, the mean±S.D. is given. Significance is depicted as *P<0.05, or **P<0.01, ns, not significant, P>0.05.
Results
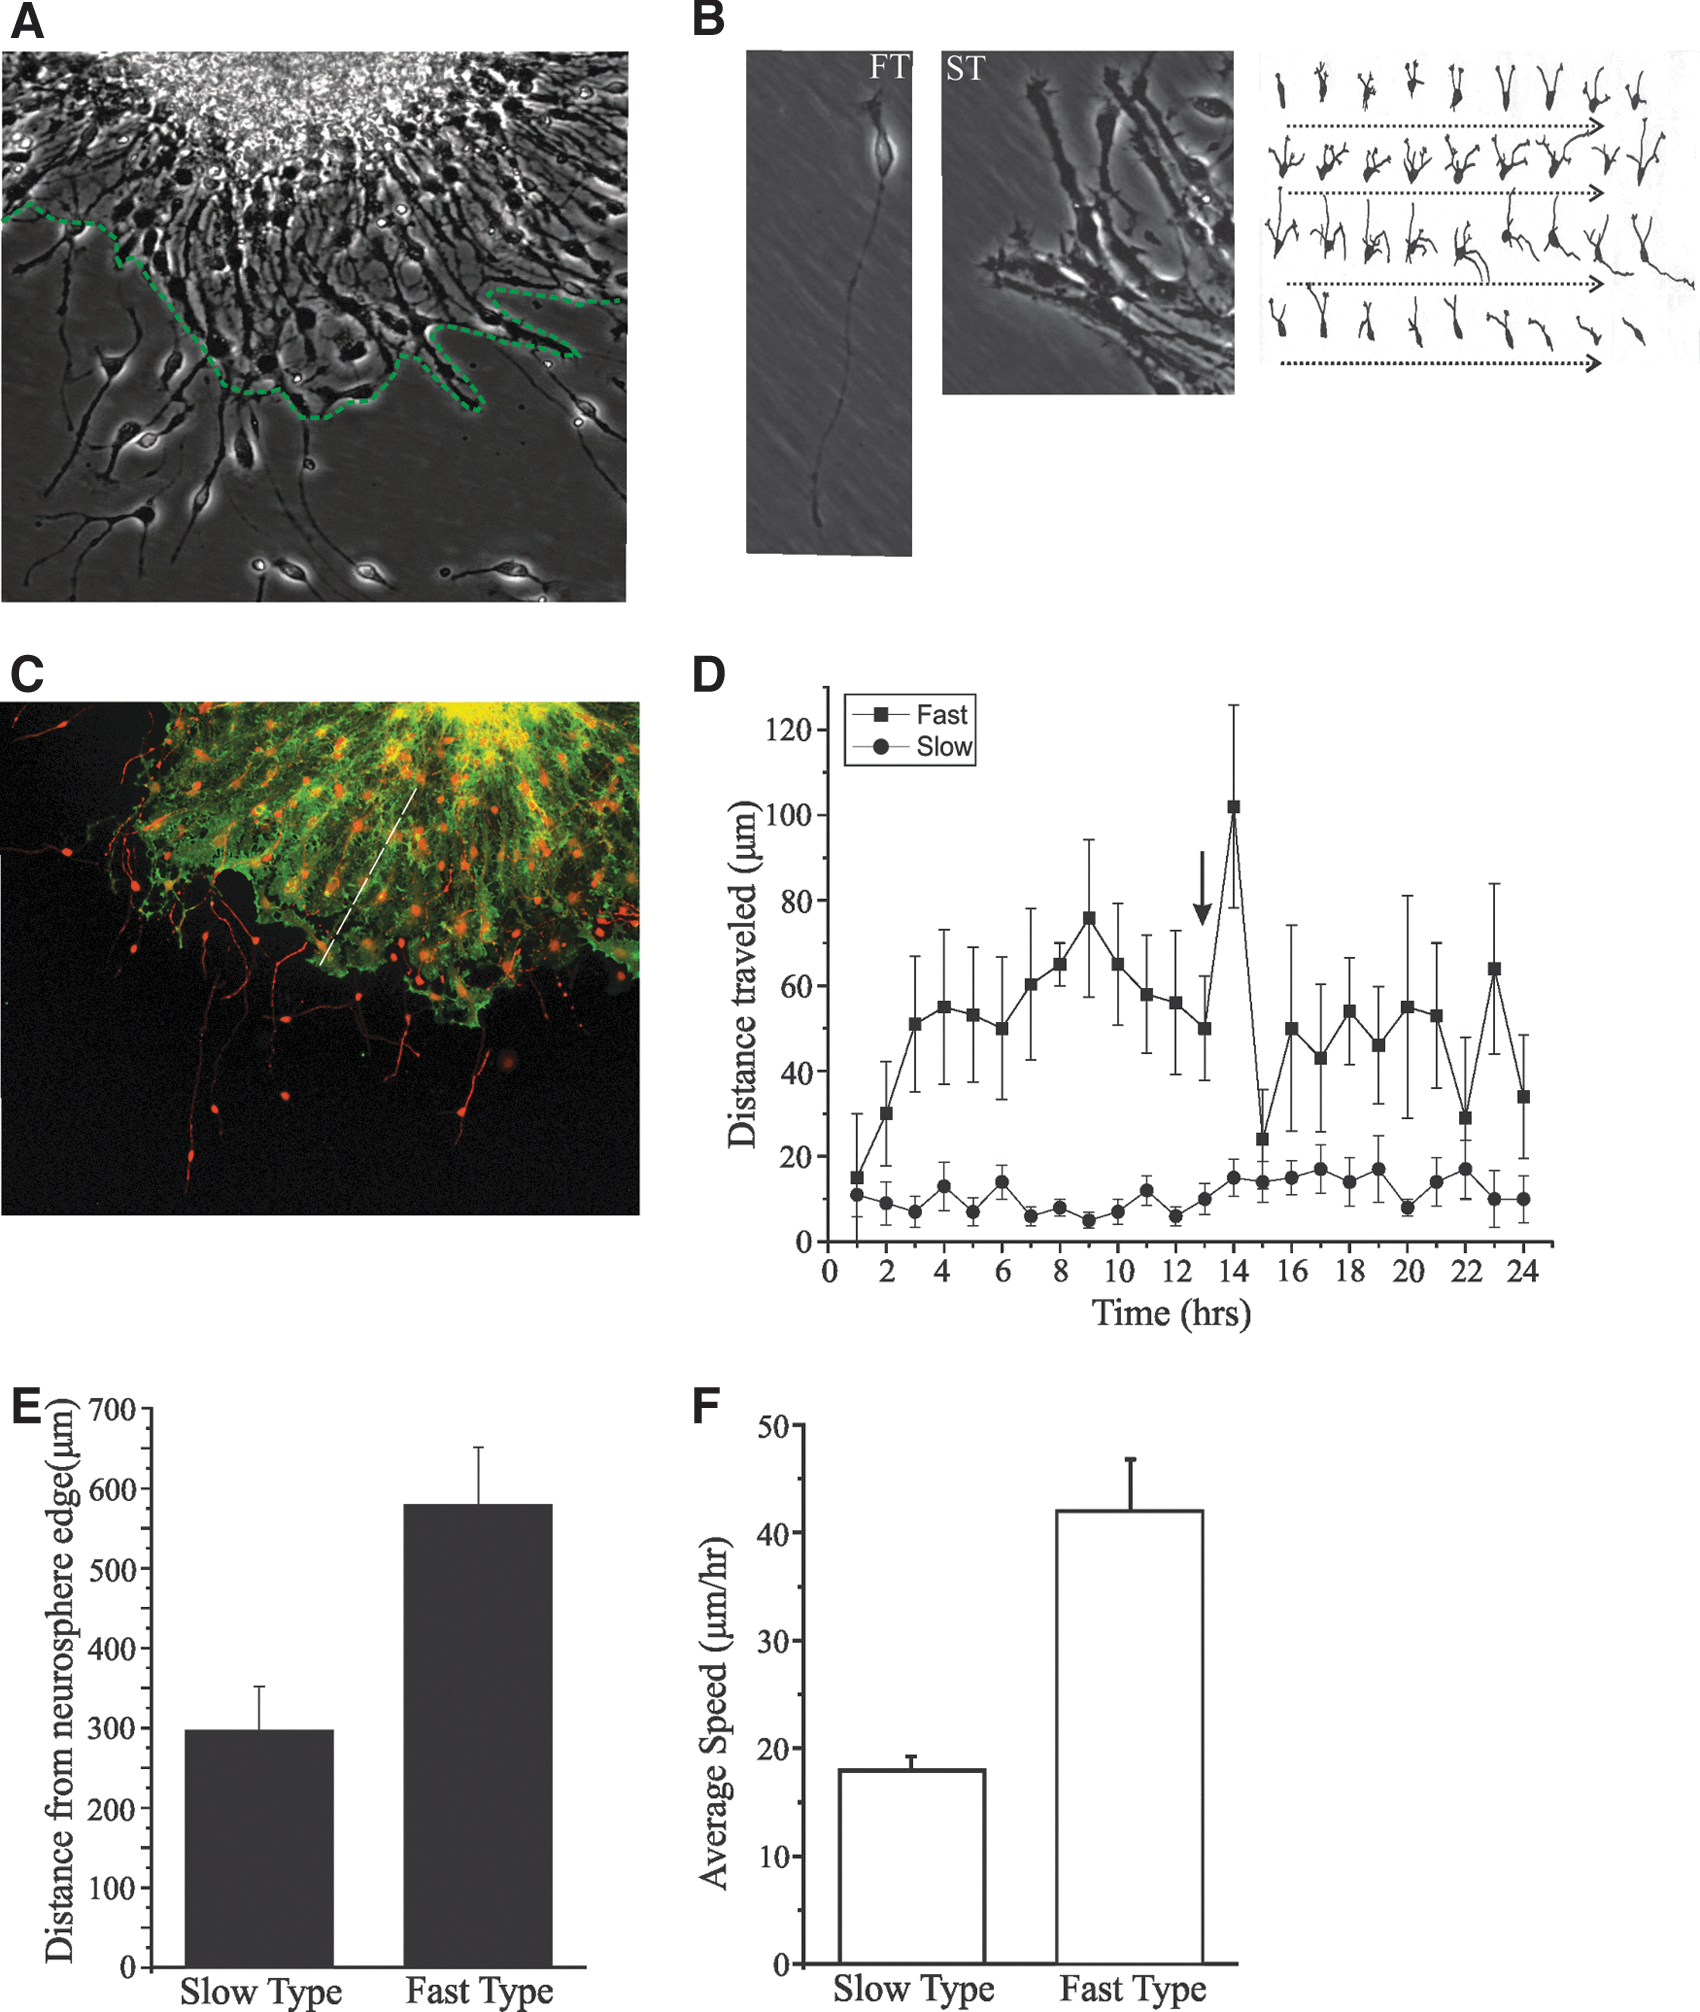
NPCs were propagated from the brains of E14 mice and multiplied as neurospheres in the presence of the mitogens FGF-2 and EGF. Mitogen removal initiates the differentiation of NPCs seen clearly as a migration of differentiating cells out from the neurosphere (Fig. 1A). Characterizing neurosphere cultures in differentiative conditions, we analyzed time-lapse image sequences obtained with the Cell-IQ system. We characterized at least 2 different morphological types of cells emanating from the neurosphere (Fig. 1B). The morphology of the fast-type cells was small in diameter with either bi- or multipolar extensions (Fig. 1B left panel), whereas the second type was larger in diameter lacking clear small-diameter extensions (Fig. 1B middle panel). In Fig. 1B (right panel) is a hand-drawn trace of the morphological changes occurring in a multipolar cell with an image trace shown of the same cell every 15 min. Immunostaining of migrating cells with the GLAST glial marker and the MAP-2 neuronal marker, after being cultured in differentiative medium for 5 days (D5), is shown in Fig. 1C. A clear distribution of immunostained cells can be seen in Fig. 1C with MAP-2 neuronal staining occupying most of the area furthest away from the mother sphere and radial glial cells stained with GLAST residing closer to the mother sphere [16,17]. Using time-lapse image analysis, we were able to observe morphological as well as migratory characteristics. The multipolar/bipolar population of cells moved faster and more sporadically than the second type of cells. In Fig. 1D is a time-lapse analysis of the distance migrated by the fast- and slow-type cells taken from one representative experiment. During the first 24 hrs of differentiation, the fast-type cells moved on average 42±5 μm/h (n=74, N=5) versus the slow-type cells, which moved 18±0.5 μm/h (n=38, N=5) (Fig. 1E). The distance migrated by the fast-type cells was significantly further than the slow-type cells (Fig. 1F). Changes in intracellular calcium concentrations are known to play a role in cell migration, growth cone morphology, and axonal guidance. There is evidence that calcium influx through VGCC, in particular L- and N-type calcium channels, results in signaling that affects the expression of genes involved in cell proliferation, programmed cell death, and neuronal differentiation [1,3 –6].
In
Whole-cell recordings of Ca2+ currents in early stages of embryonic neural stem cell differentiation
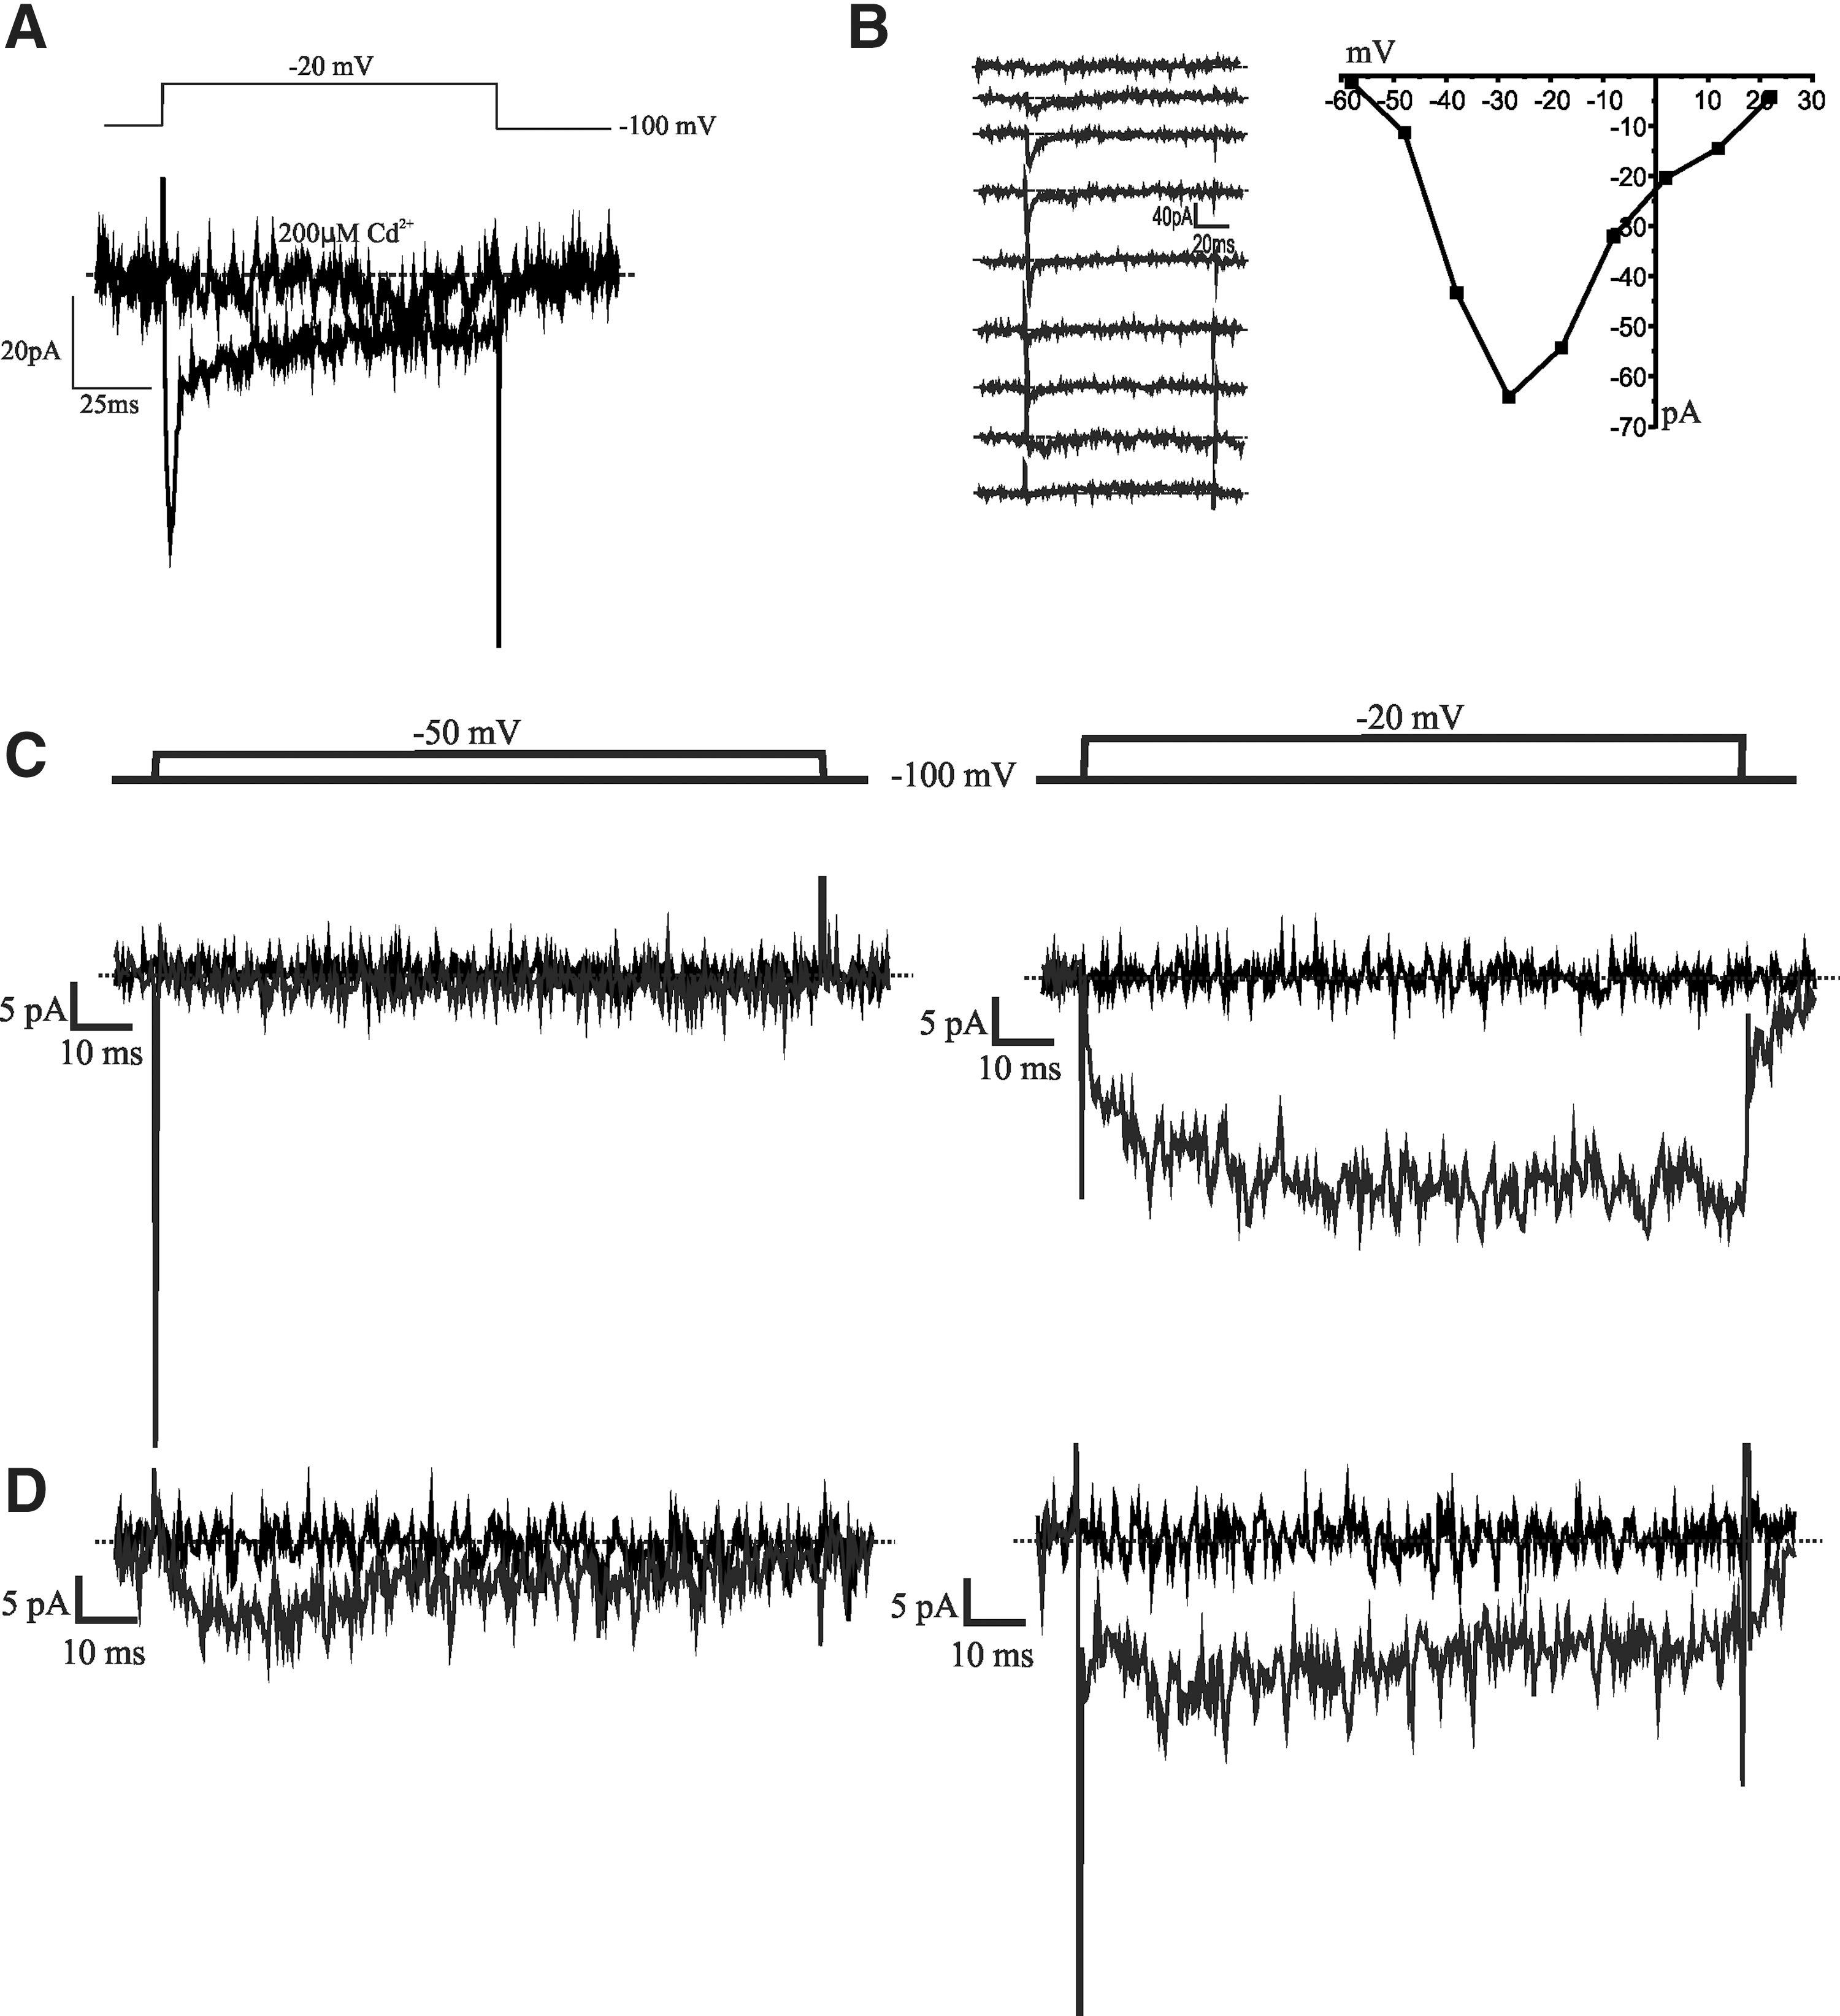
Whole-cell patch-clamp recordings were obtained from NPCs migrating from neurospheres cultured in a differentiative medium for one day (D1). The average cell capacitance was 7.9±0.3 pF (n=34). The resting membrane potential was recorded using the current clamp method. Cells had an average resting membrane potential of −82.1±0.6 mV (n=5). To investigate whether voltage-dependent calcium currents are present during the early stages of in vitro differentiation, whole-cell currents with barium as the charge carrier were recorded under conditions optimized to isolate ionic currents flowing through calcium channels (see the Methods section). In the presence of TTX (100 nM), depolarizing steps (150 ms duration) from a holding potential of −100 mV elicited inward currents. The currents were generally relatively small, ranging 0.5–17 pA/pF, suggestive of low channel expression during this stage of differentiation. Patch-clamp measurements of the inward currents elicited by the depolarizing current were abolished by 200 μM Cd2+, showing that indeed a barium-permeable channel that is voltage dependent and sensitive to cadmium is present in D1-differentiated cells (Fig. 2A).
Currents recorded in D1 differentiated cells.
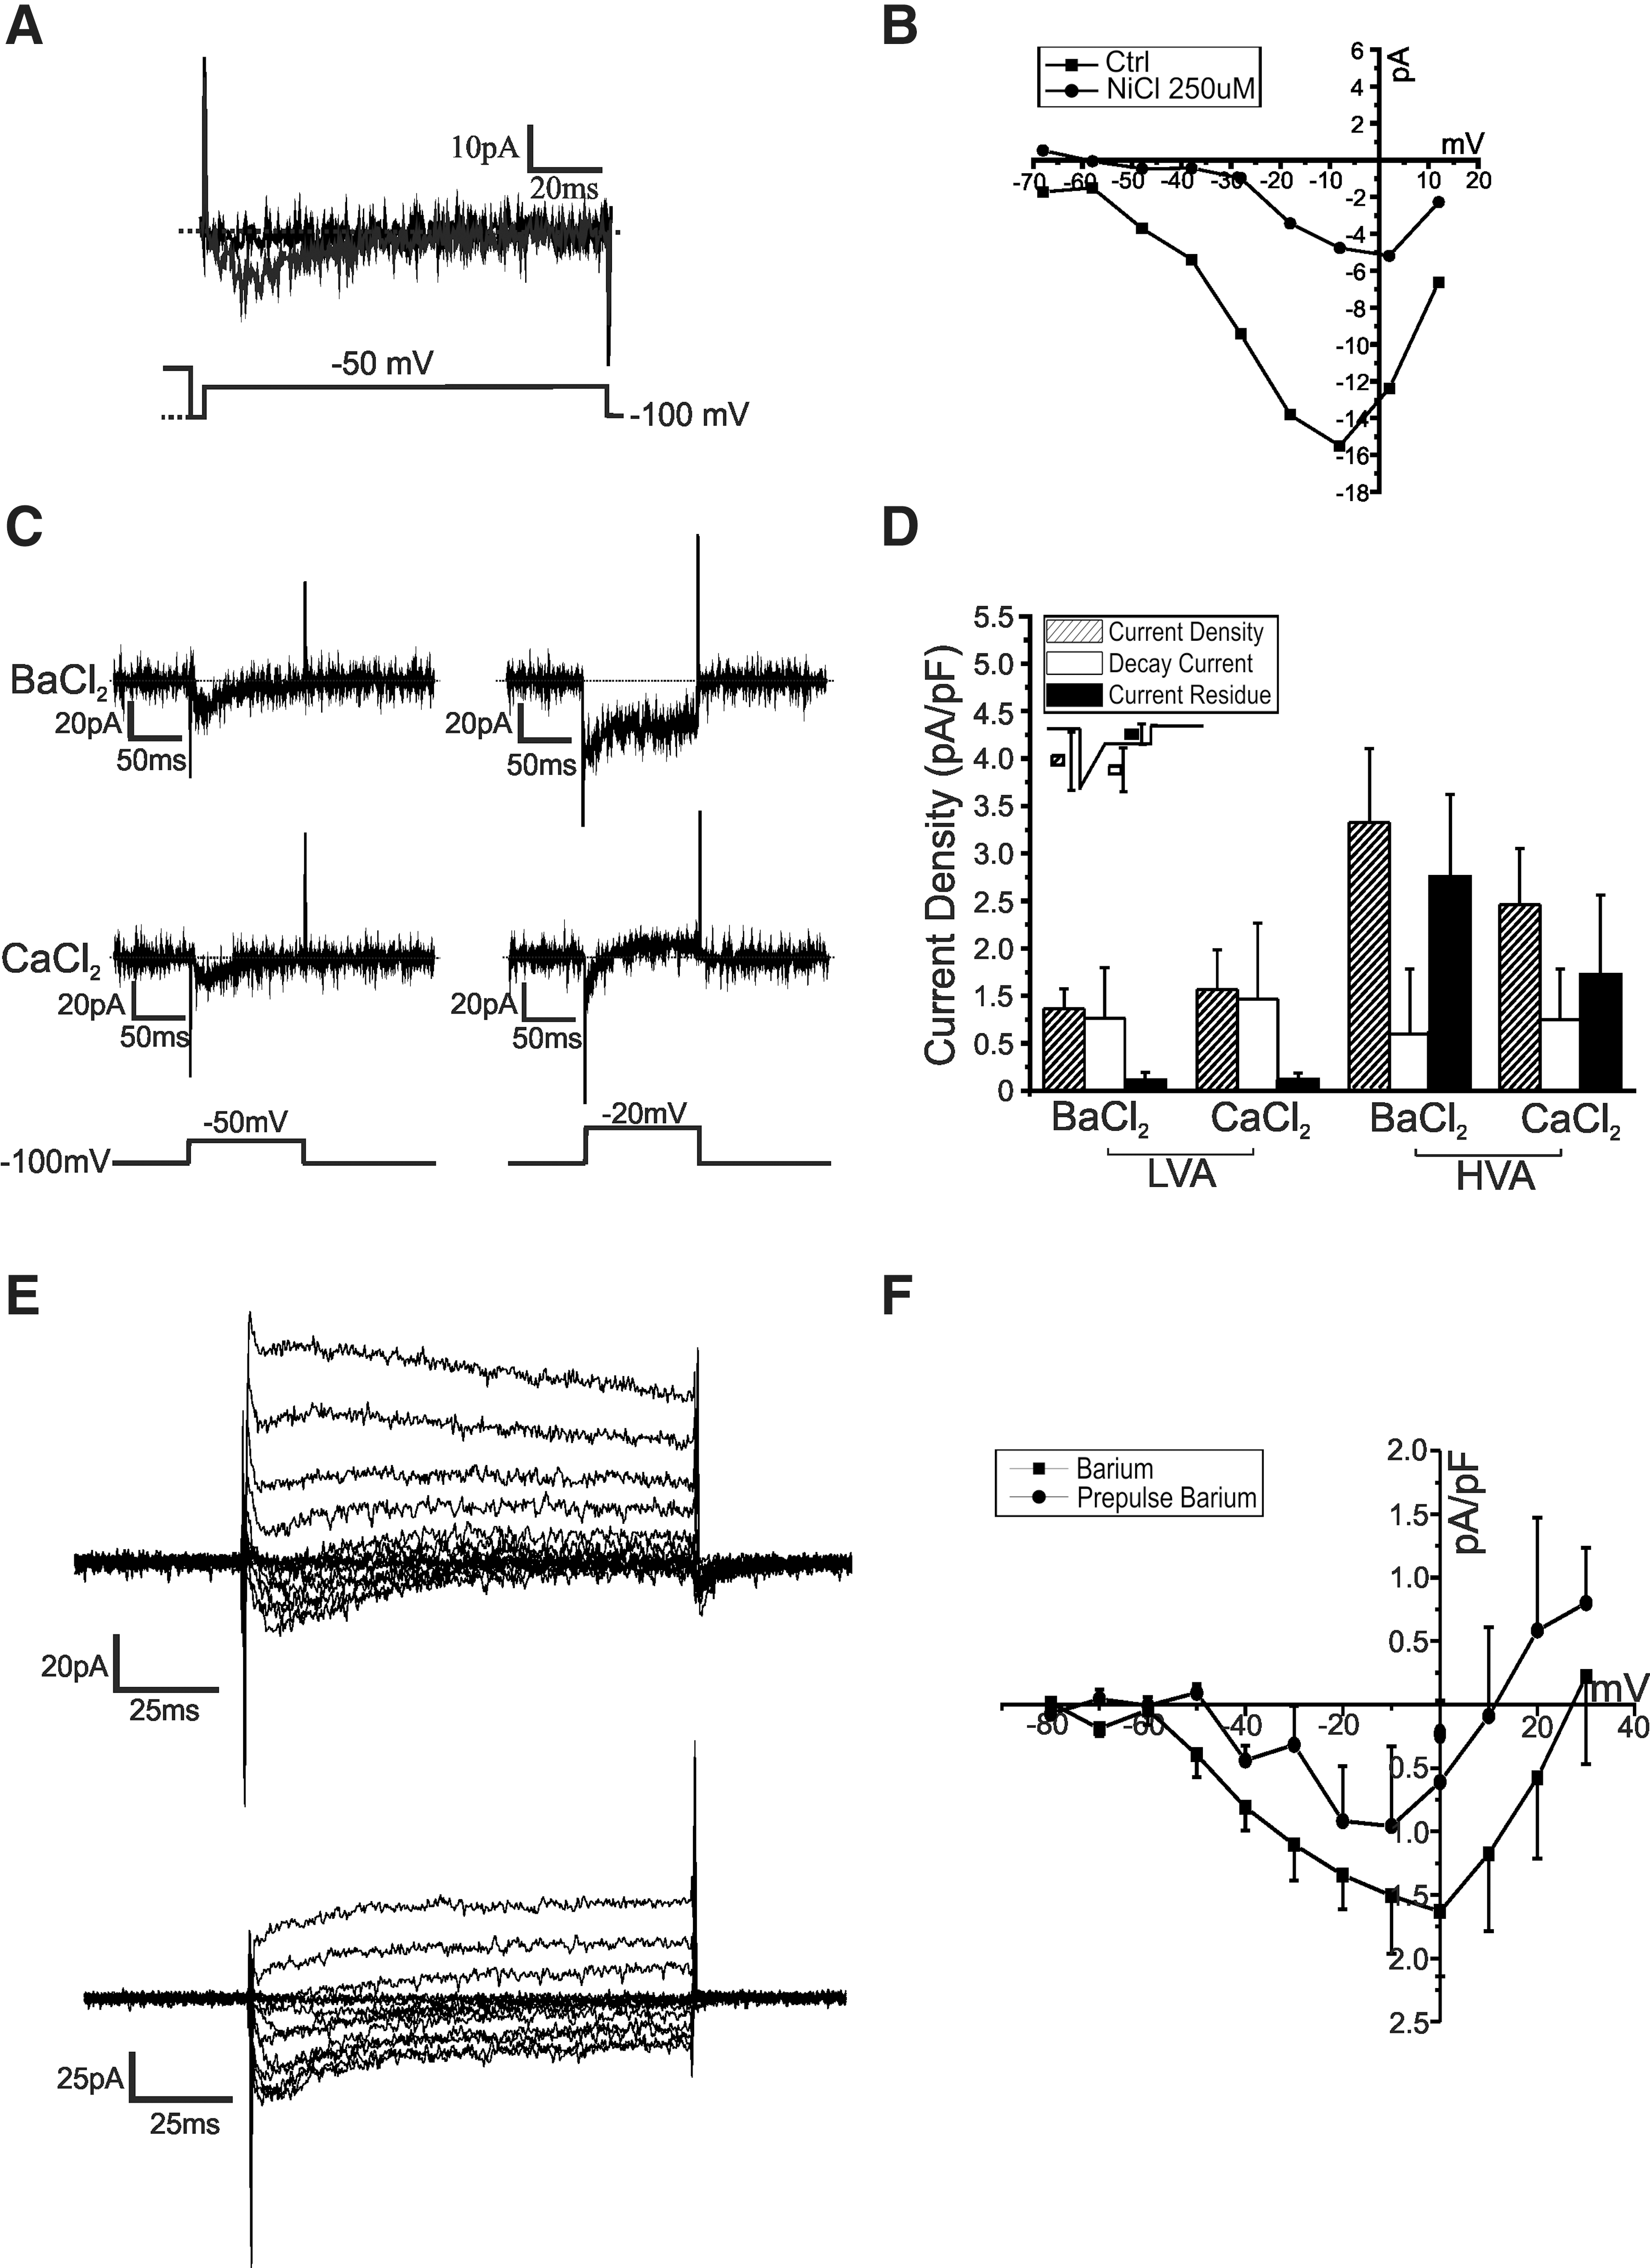
Surprisingly, current–voltage relationships displayed cells showing current profiles with low voltage activation, suggestive of T-type-like calcium channels (Fig. 2B). Using a 2-voltage-step protocol (−100 mV holding potential to −50 mV, and then holding potential to −20 mV), the majority of the cells (∼71%, n=10/14) displayed both LVA- and HVA-like components with a minority displaying only long-lasting calcium currents (∼29%, n=4/14) (Fig. 2C, D). With our focus on LVA channels, we continued to discriminate between the different types of Ca2+ currents using standard biophysical and pharmacological tools. Figure 3A shows an example of an NPC with a distinct low-voltage-dependent channel, activated by a depolarizing pulse to −50 mV. The current was inactivated completely when a prepulse step to +40 mV was applied before the depolarizing step to −50 mV from a holding potential of −100 mV. Low concentrations of Ni2+ block LVA Ca2+ currents more effectively than HVA Ca2+ currents [21,22]. As shown in Fig. 3B, 250 μM NiCl2 significantly reduced the LVA portion of the Ba2+ current while leaving an HVA-type current apparently intact.
In
LVA channels have been shown to have similar permeability to barium and calcium [21]. The size of the currents recorded at −50 versus −20 mV was dependent on the nature of the charge carrier. Peak currents measured at −20 mV in the presence 10 mM Ca2+, instead of 10 mM Ba2+, had a tendency to be smaller (Ca2+: 3.24±1.01 pA/pF vs. Ba2+: 4.31±0.85 pA/pF, n=11). The nature of the divalent species did not influence the amplitude measured at −50 mV (Fig. 3C), consistent with the similar permeability of T-type calcium channels to Ca2+ and Ba2+[21]. The mean amplitude was 1.37±0.33 pA/pF in 10 mM Ba2+ compared to 1.28±0.37 pA/pF in 10 mM Ca2+ (n=11). In Fig. 3D, statistics are shown for LVA and HVA current profiles in D1, with LVA currents having a more transient nature as seen with the current residues while the HVA components consisting of longer lasting currents. For D5, the peak current density at −20 mV had a significant difference between the charge carriers (Ca2+: 4.86±0.85 pA/pF vs. Ba2+: 9.68±1.3 pA/pF, P<0.05, n=6), while at −50 mV, the barium current had a slight tendency to be larger (Ca2+: 2.4±0.95 pA/pF Ba2+:3.28±0.26 pA/pF). The current–voltage relationship of calcium and barium as charge carriers is shown in Fig. 3E. Using barium as the charge carrier, I-V relationships with and without a +40 mV prepulse are plotted in Fig. 3F. A significant difference in current size is seen in the −60 to −30 mV range.
Calcium signals blocked by LVA channel blockers
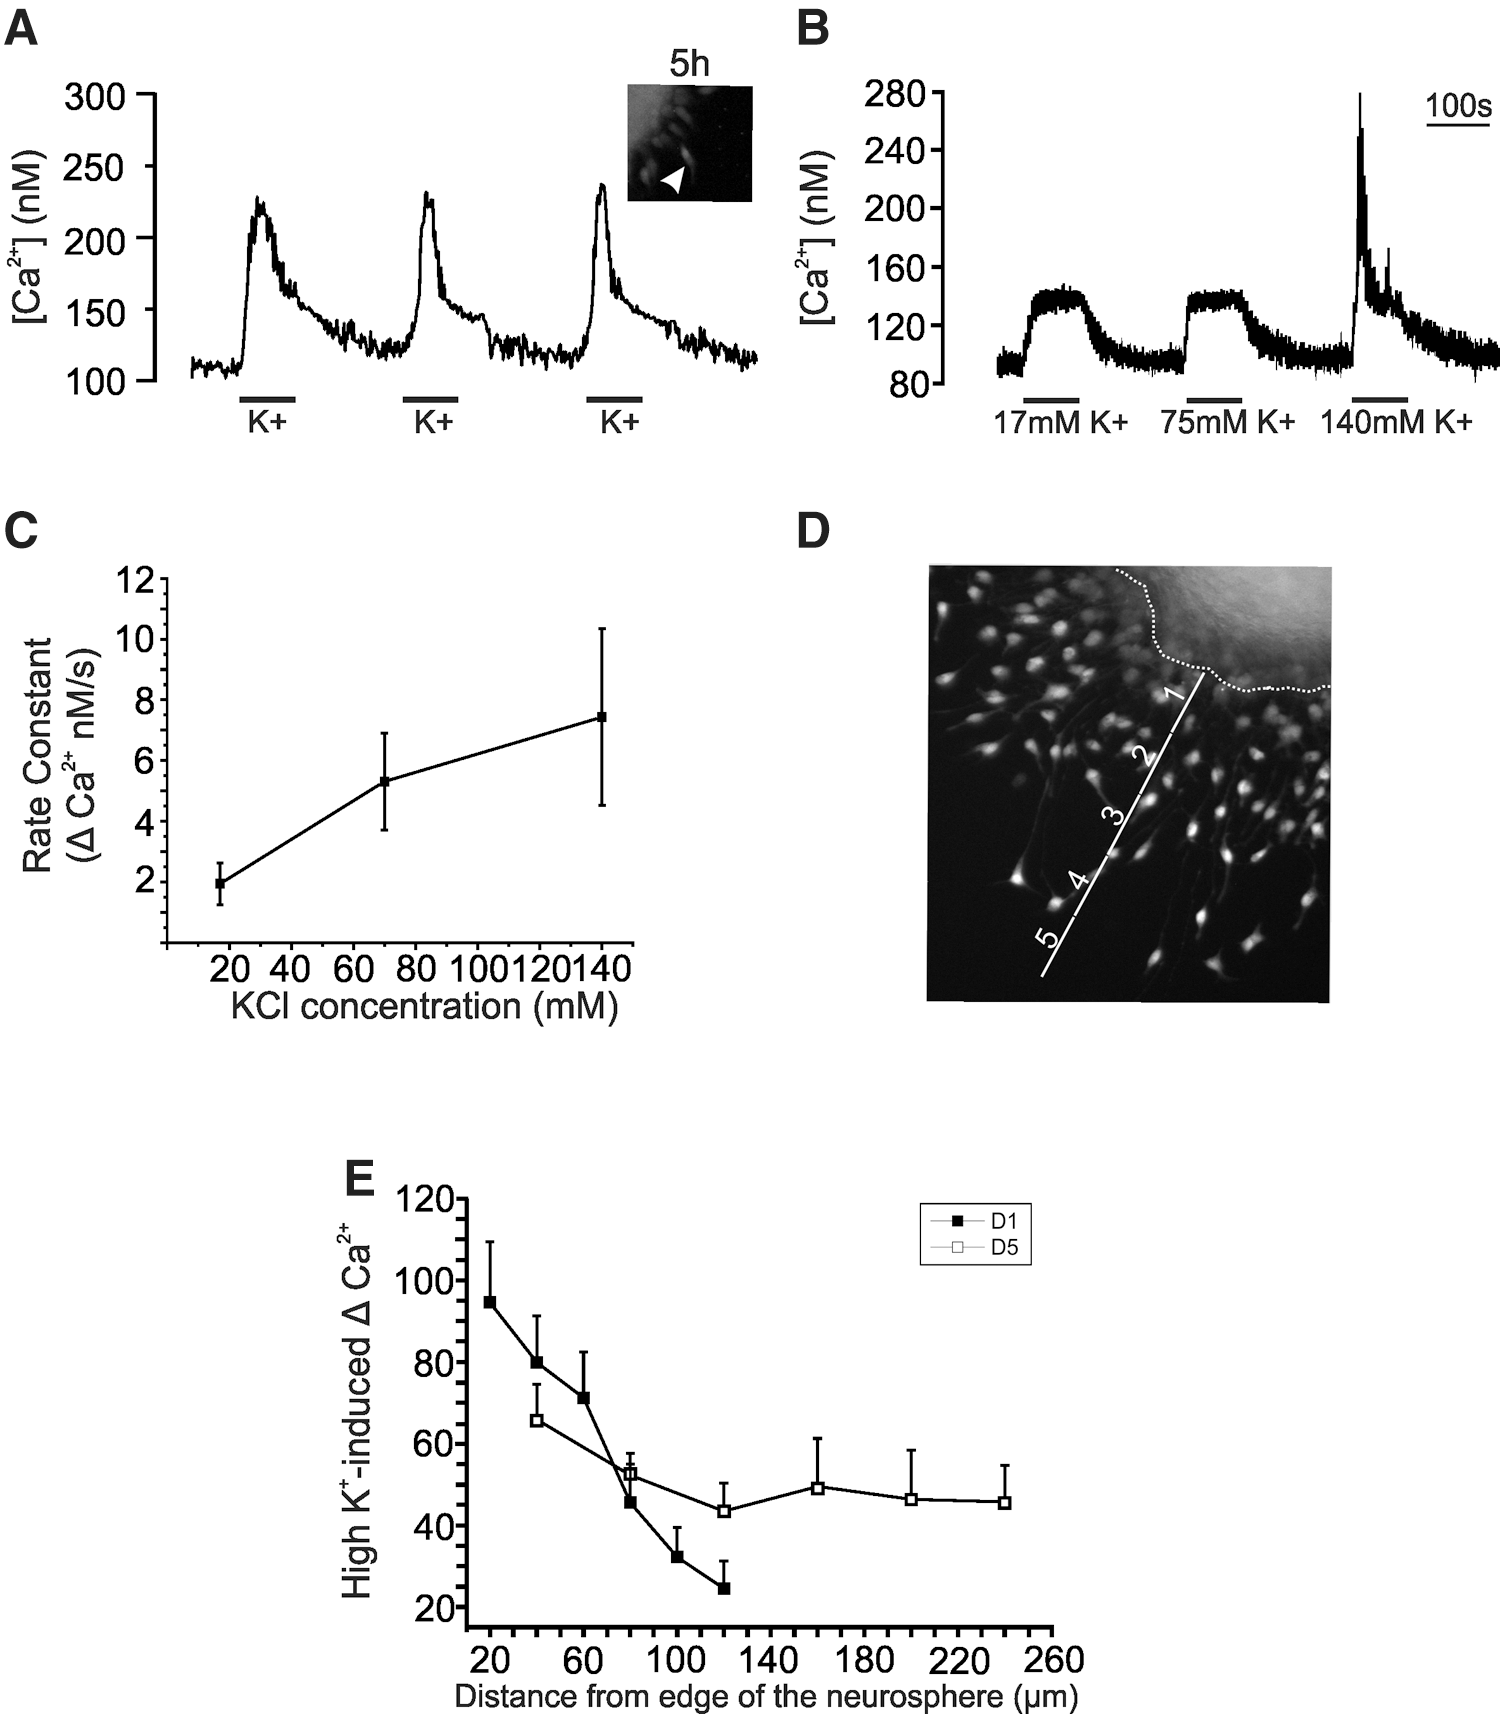
A large proportion of the cells were difficult to patch, and as a result, cell selection was biased toward certain cell types. To circumvent this and to obtain spatial information on the cellular responsiveness to depolarization, we investigated VGCC calcium influxes using high extracellular potassium with calcium-imaging techniques. To observe the presence of voltage-gated channels, we performed calcium imaging on cells 5 and 24 h after plating. As seen in Fig. 4A, cells displayed potassium-induced changes in intracellular calcium already after few hours of differentiation. After 1 day of differentiation, depolarizing concentrations of extracellular K+ (75mM [K+]e) were applied. Depolarization caused a rise in [Ca2+]I in a large majority of the cells (74%±11.4% N=4) (Fig. 4B). Stimulating the cells with 17 mM [K+]e resulted in a rise in intracellular calcium similar to that observed with 75 mM [K+]e. Closer inspection of the calcium kinetics showed that under 17 mM [K+]e, the time constant was slower (1.94±0.69 nM/s) when compared to 75 mM [K+]e (5.31±1.6 nM/s), whereas depolarizing with 140 mM[K+]e, the calcium rise time constant was faster (7.43±2.91 nM/s) (Fig. 4C). To analyze the possible correlation between the distance migrated and functional expression of VGCCs, the cells were categorized as residing in layers defined as I to IV, with each layer representing 20-μm (for D1 cells) or 40-μm [for day 5 (D5) cells; Fig. 4D] increments starting from the edge of the neurosphere and the last layer representing the furthest migration. The average calcium amplitude of the cells in each layer and its corresponding location in reference to the neurosphere are plotted in Fig. 4E. Surprisingly, at D1 of differentiation, cells showing the largest responses to depolarization resided close to the neurosphere with a reduction in the Ca2+ response toward the outer migration layers. At D5, a relative increase in Ca2+ response was seen in the outer migration layers as we have previously shown in postnatal NPCs [14].
Changes in intracellular Ca2+ concentrations in differentiating NPCs after exposure to depolarizing concentrations of K+. In
To elucidate the role of L-type calcium channels, K+ pulses were applied in the absence and presence of 10 μM nifedipine. Nifedipine hardly had an effect on the calcium transients on D1 differentiated cells (Fig. 5A), with at best a slight reduction in the calcium amplitude in a small percentage of cells. Additionally, the effects of other pharmacological blockers against HVA calcium channels were also ineffective in abolishing the calcium responses. We therefore tested the effect of LVA calcium channel blockers. Both mibefradil and NNC 55-0396 significantly reduced the calcium responses elicited by depolarizing with extracellular potassium (Fig. 5B). The total block obtained was only slowly reversed upon perfusion of cells in the absence of a blocker. The overall effect of the HVA calcium channel blockers was small, but there was a tendency of a better inhibitory effect at longer times of differentiation (1 day compared to 5 days) (Fig. 5C) with D20 cells effectively blocked by the HVA blocker nifedipine in a reversible manner (73.9%±11.7%, N=3) (Fig. 5D). Furthermore, at D5, 58.5%±21.7% of the cells at the outer layers were sensitive to nifedipine, whereas in the inner layers closer to the neurosphere, only 15.7%±13.3% were sensitive (N=6) (Fig. 5E). We used the L-type agonist Bay K8644 to test HVA spatial distribution in D1 and D5 cells using calcium imaging. In Fig. 5F, a calcium trace is shown displaying potentiation of the calcium response induced by depolarizing the cell with extracellular potassium in the presence of Bay K8644. The total amount of cells showing Bay K8644 potentiation was significantly higher in D5 cells compared to D1 (Layer 1: 18.3%±0.95% vs. 38.3%±5.2%; Layer 5: 16.2%±8.5% vs. 43.3%±3.3%; P<0.05, N=3) (Fig. 5G). The amplitude of the Bay K8644 response, taken as the percent increase to the first K+ pulse, is significantly higher in the outer layers of D5 cells, compared to the small increase seen in D1 cells (Fig. 5H).
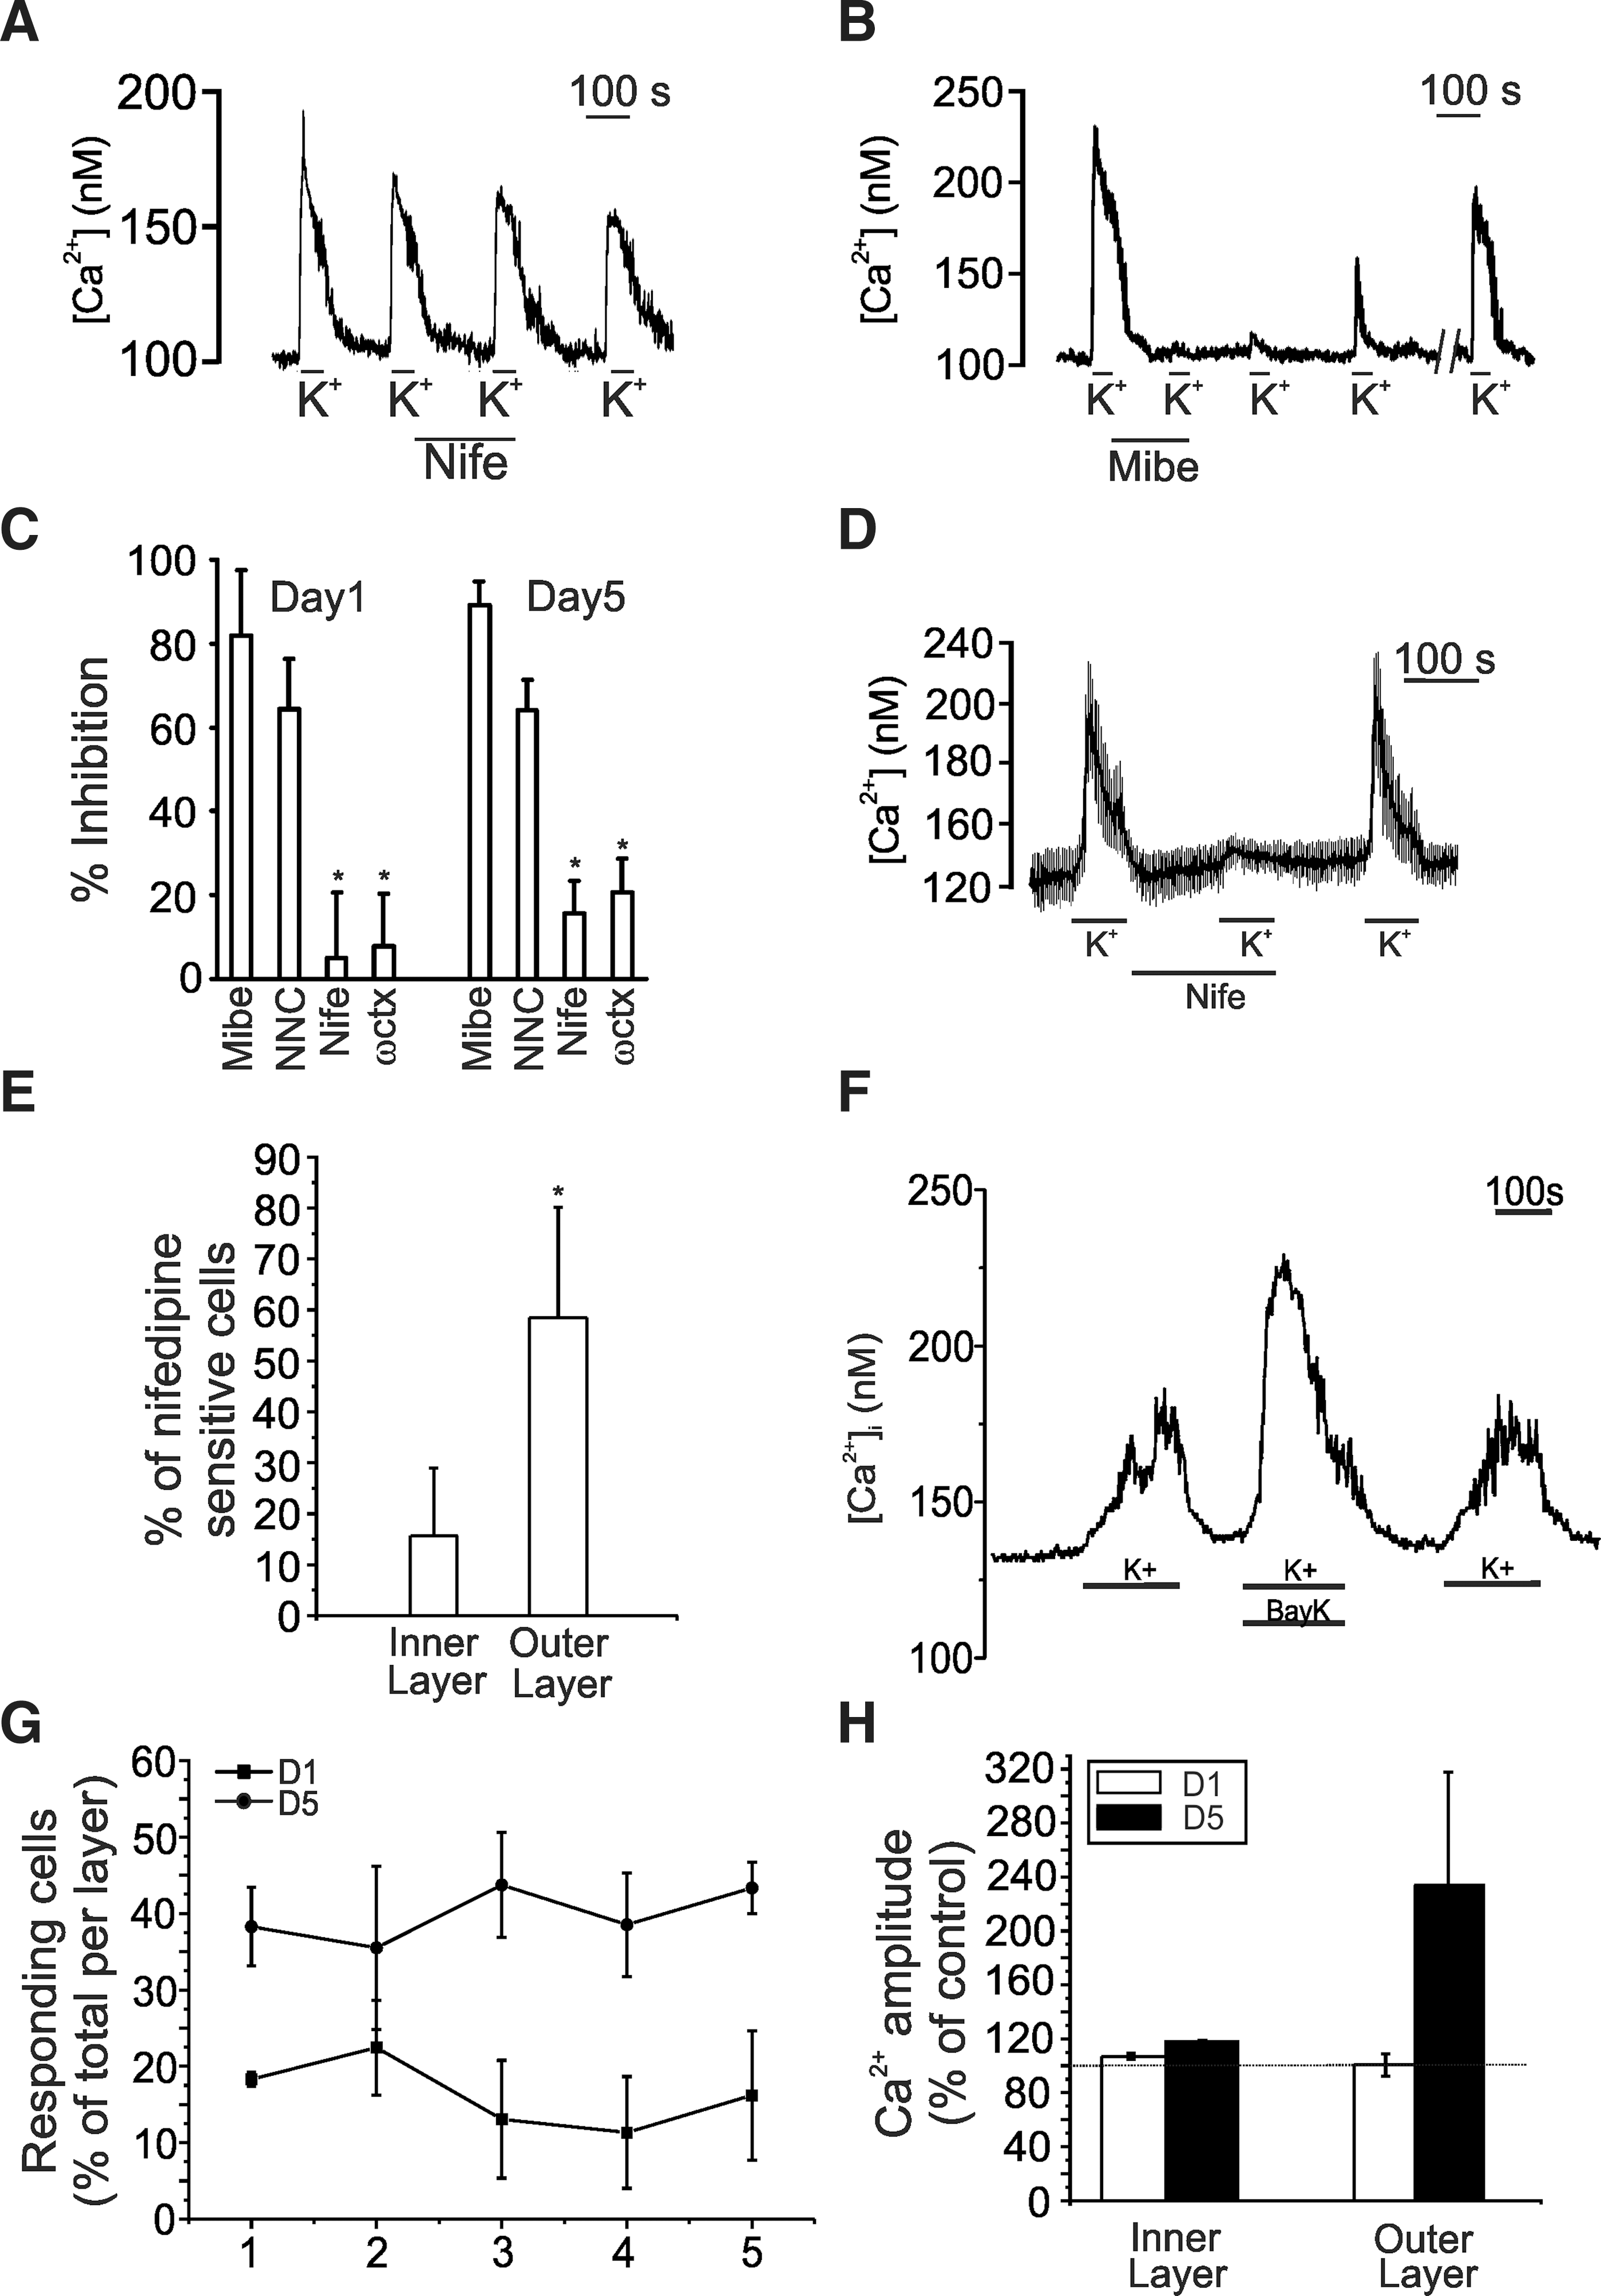
Effect of voltage-gated calcium channel (VGCC) blockers on the intracellular calcium responses. In
Since the activation of HVA requires a substantial rise in the membrane potential from their resting values, we tested whether activating voltage-dependent sodium channels with veratridine would result in changes in intracellular calcium. The functional expression of voltage-gated sodium channels appeared later on in the maturation process (>5 days) as seen with calcium responses to veratridine (Fig. 6A) and voltage-clamp recordings showing TTX-sensitive voltage-gated sodium channel currents appearing at >D5 (Fig. 6B).

In
VGCCα1 expression and distribution
Localization and distribution of VGCCs on the cell (i.e., soma, neurites, and synapses) may help elucidate their respective contributions to various physiological processes. As seen in Fig. 7A, at D1 T-type calcium channel antibody staining (α1G subunit) is present in a large majority of the DAPI-stained cells (88%, n=218, N=2). In Fig. 7B, absence of the primary antibodies for T-type and Tuj1 produced no cell staining. In HEK-293 cells, no detectable fluorescence against the T-type channel antibody was present (data not shown). T-type calcium channel distribution was confided mainly to the soma. We measured the fluorescent intensity of the T-type calcium antibody staining with relation to the distance from the mother sphere. As seen in Fig. 7C, the fluorescent intensity decreases as distance from the sphere increases with a significant difference between the outermost layer compared to the innermost layer, whereas no significant difference was observed with DAPI. mRNA expression levels for the L-type (Cav1.1–Cav1.3) and T-type (Cav3.1–Cav3.3) were quantified from total RNA taken from D1 and D5 cultures. mRNA expression was detected for both Cav1.2 and Cav1.3 in D1 as well as all 3 subunits of the T-type VGCC. The relative concentration for the detected mRNAs increased with days in differentiation with the highest fold change occurring for Cav3.3 (Fig. 7D).
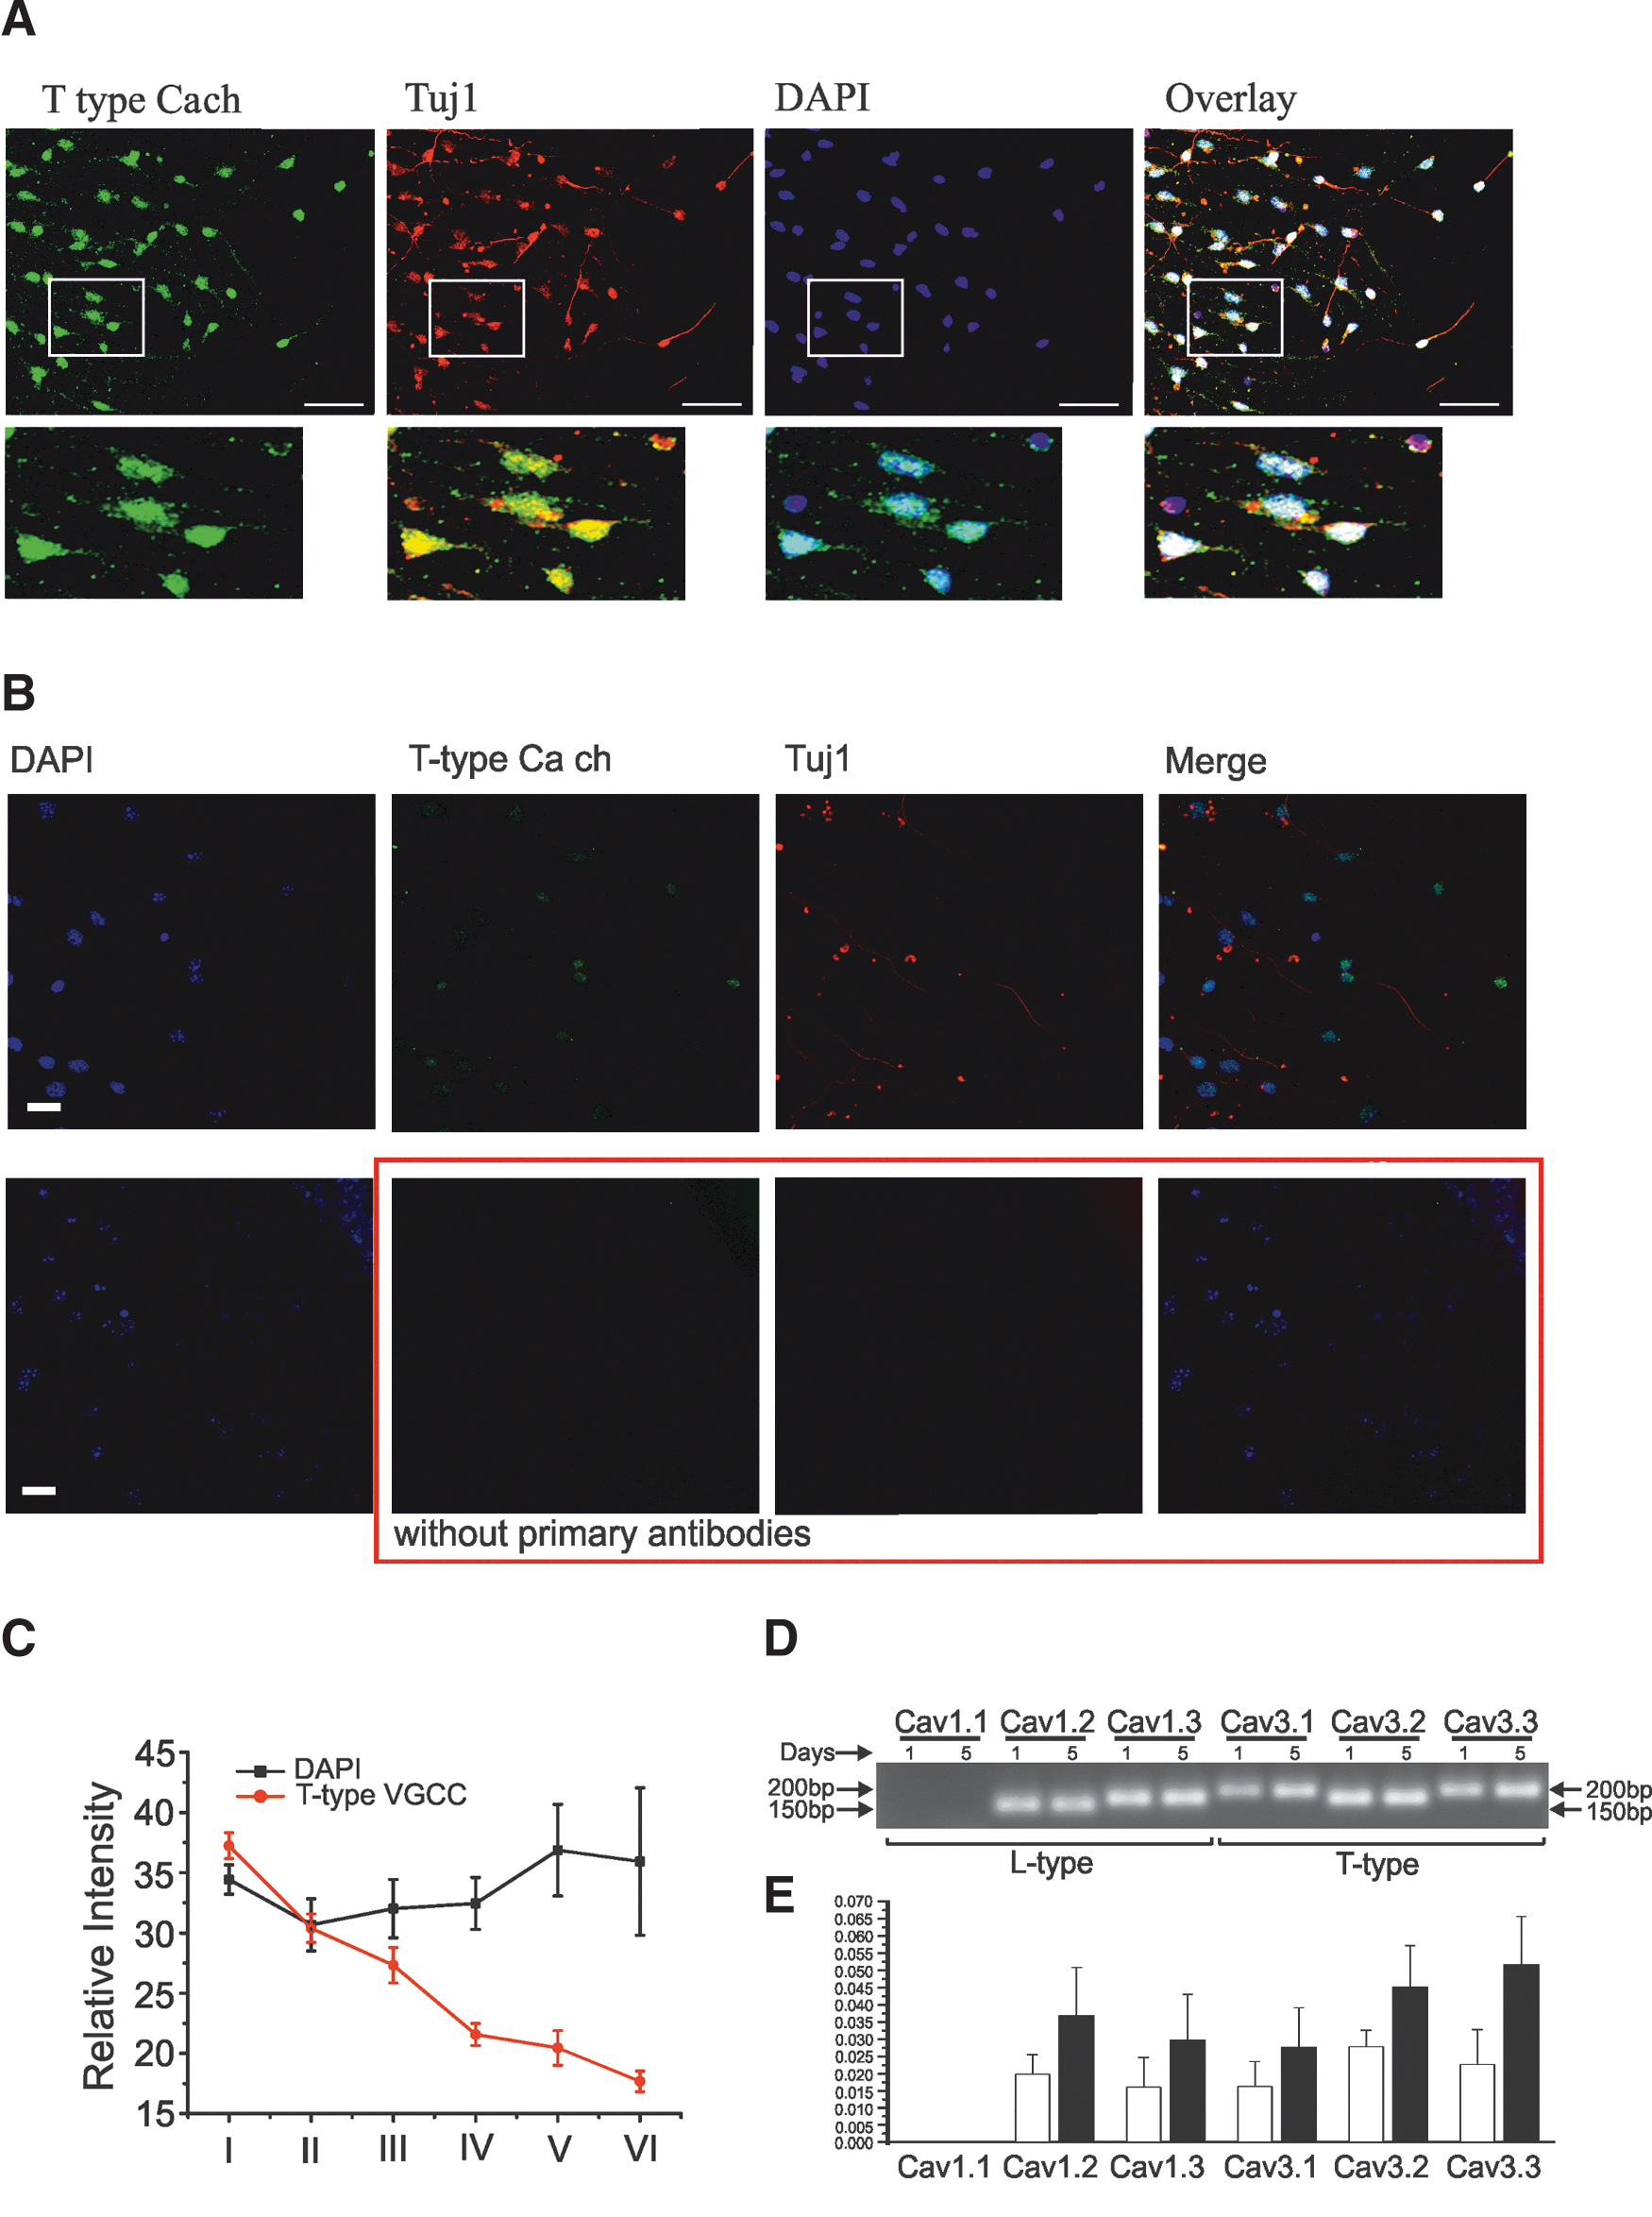
Immunofluorescence showing distribution of T-type calcium channel proteins. In
Effect of channel blockers of T-type channel on the differentiation of neural stem cells
To elucidate the functional role of T-type calcium channels, NPCs were cultivated in the presence of pharmacological inhibitors directed against T-type channels. Commercially available blockers included mibefradil, its nonmetabolizable analog NNC 55-0396, ethosuximide, pimozide, and low concentrations of nickel chloride. To rule-out nonspecific toxic effects when grown in culture for long periods of time, nonexcitable HEK-293 cells were grown in the presence of mibefradil (10 μM), NNC 55-0396 (10 μM), ethosuximide (10 mM), or pimozide (1 μM). There was no marked perturbation of HEK-293 cells in either cell attachment or in proliferation when grown under culture conditions containing mibefradil or ethosuximide when compared to controls after 24 h in culture (Supplementary Fig. S2). When cultivated with NNC 55-0396, HEK-293 cells failed to attach and proliferate. Disturbances in proliferation were observed when grown under pimozide (Supplementary Fig. S2). In the original literature, NNC 55-0936 was mentioned to accumulate in the cells when exposed for longer time periods [23]. Thus, the effect of NNC 55-0396 is cytotoxic when applied for longer periods to cells. Pimozide has been documented to affect potassium channels, which may account for the nonspecific effect on HEK-293 cells.
We thus proceeded to cultivate NPCs in the presence of mibefradil and ethosuximide. Mibefradil potently prevented the differentiation/migration of the cells from the neurospheres. This effect remained evident even after 7 days of differentiation (Supplementary Fig. 2A). Removing the blocker by exchanging the growth medium resulted in the partial rescue of the effect. Neurospheres grown in the presence of 10 μM mibefradil did not resume normal differentiation patterns (N=4), whereas in spheres grown in the presence of 1 μM mibefradil, a partial rescue was evident in ∼20% of the spheres (15–20 spheres per coverslip, N=3; Supplementary Fig. S3B).
Since the metabolites of mibefradil have been documented to affect HVA channels [24,25], we proceeded to test the effects of pharmacological agents directed against HVA VGCCs. As seen in Fig. 8A (left and middle panel), a marked difference is already observed after 6 h between cells plated in the presence of nifedipine (L-type) or ω-conotoxin (N-type) when compared to cells grown in the presence of mibefradil. Interestingly, perturbation of neurite extensions is evident when NPCs are blocked with mibefradil, with a high percentage of the cells displaying either retracted or no neurite extension (Fig. 8A inlet). A significant and clear effect is observed after 18 h. The result of L-type and N-type inhibition became evident at D5 with a significant reduction in neuronal-like cells when L-type channels were blocked, and an apparent increase in neuron-like cells when N-type channels were blocked (one-way ANOVA F=40.1, P=3.3×10⁻⁴) (Fig. 8B). Exposing neurospheres to 10 mM ethosuximide resulted in the same effects as mibefradil. In the presence of 5 mM ethosuximide, spheres attached and differentiated; however, the amount of cells produced was significantly reduced (Fig. 9A).
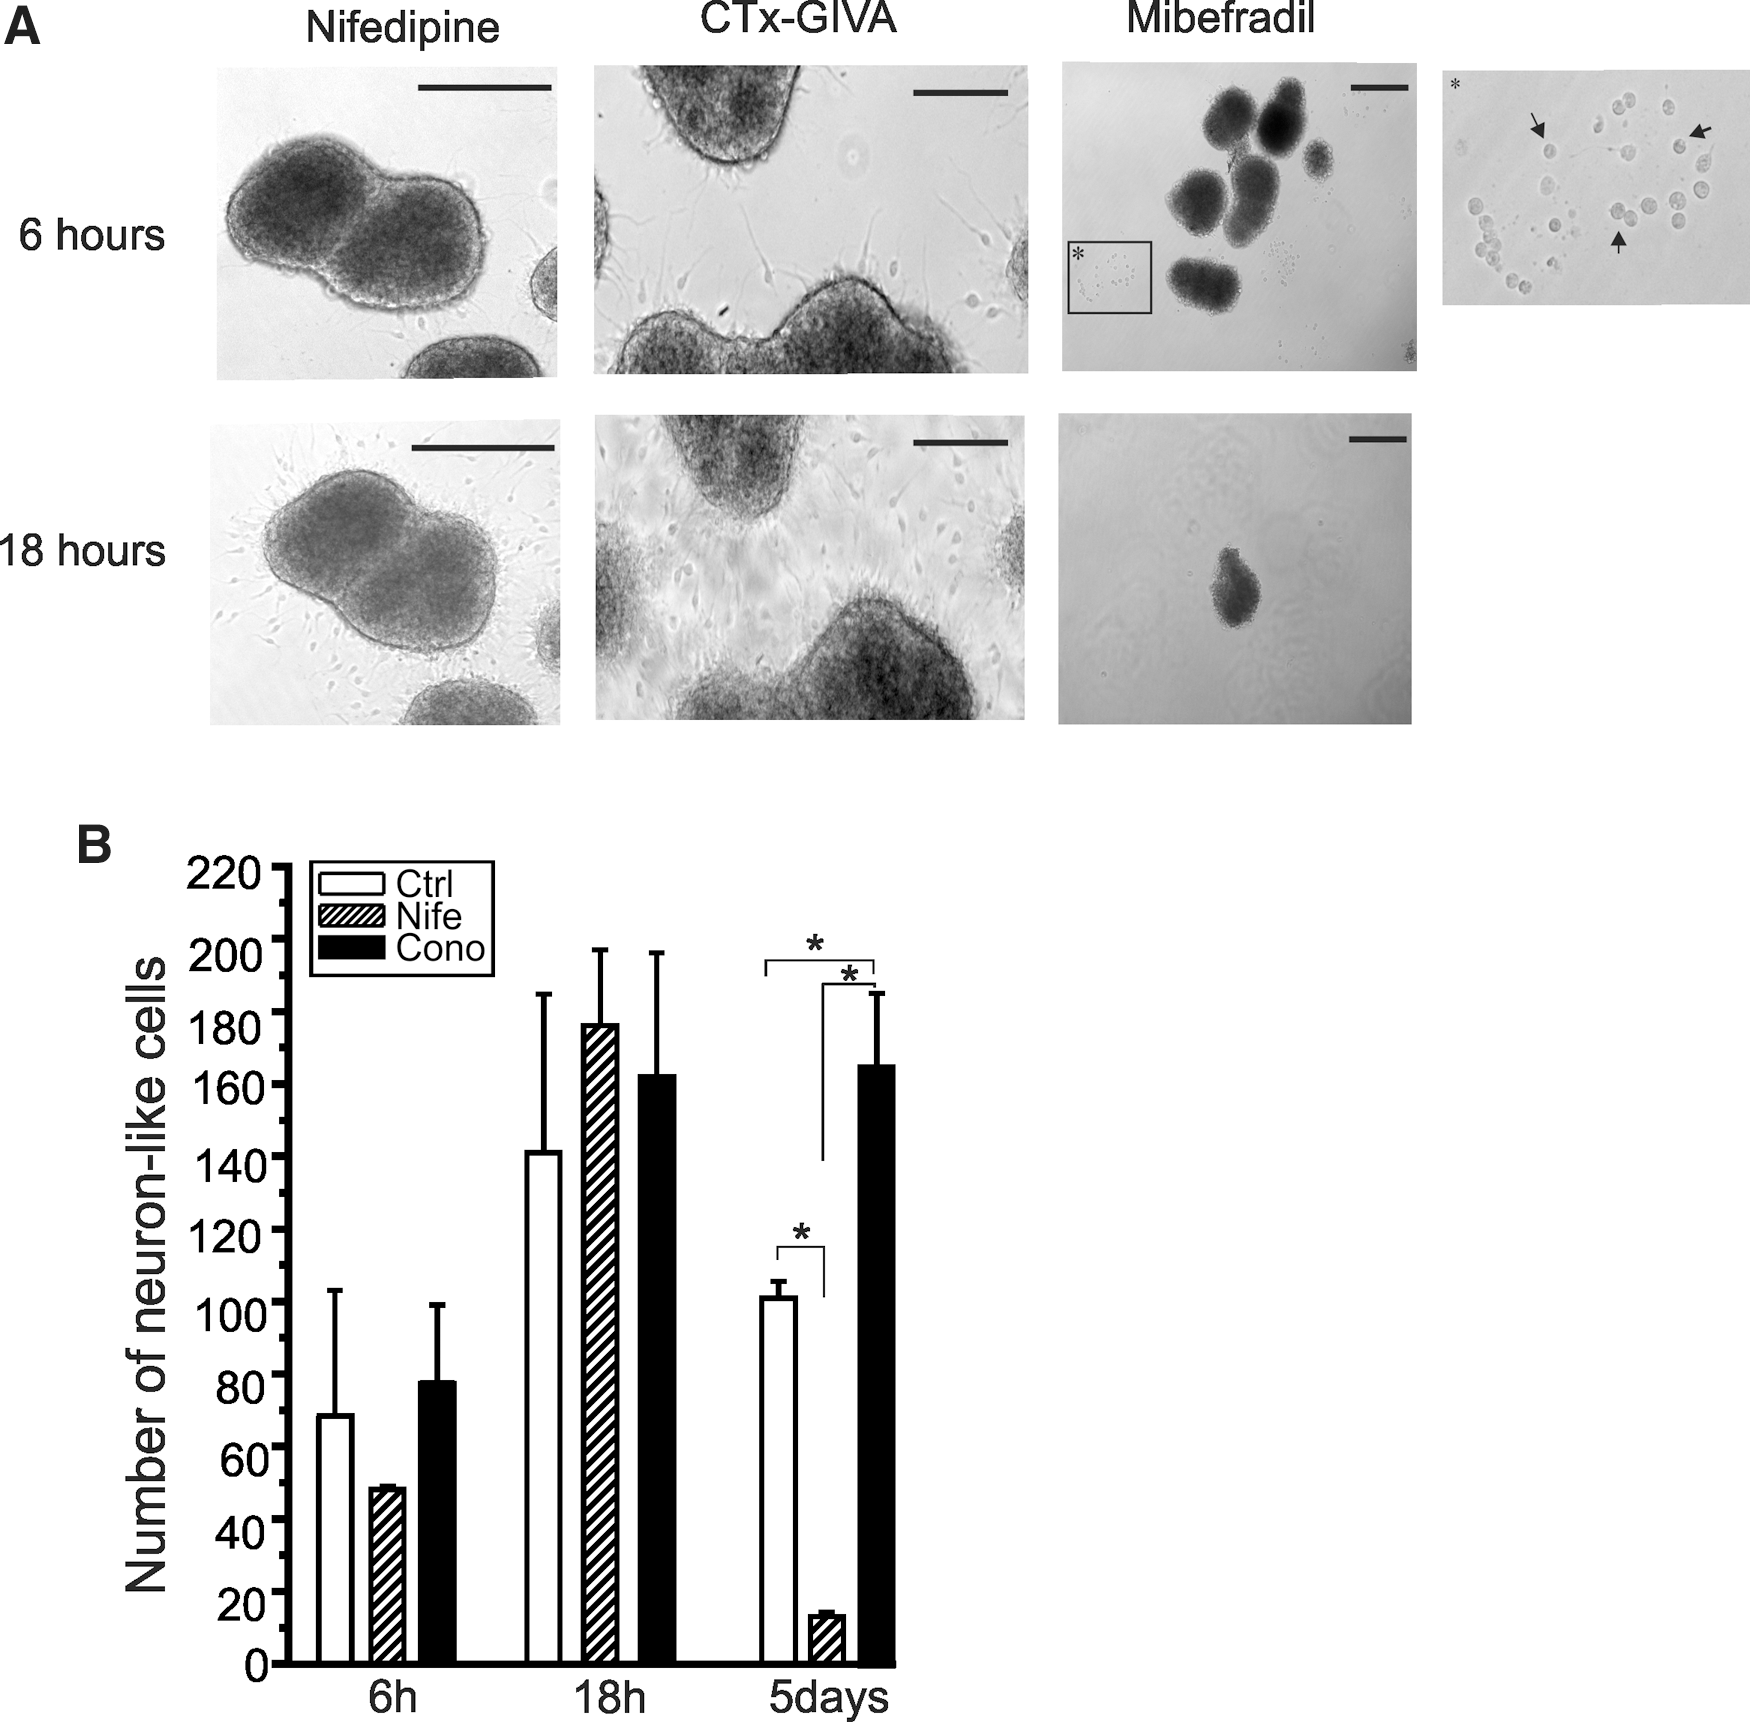
In
In
Effect of T-type calcium channel blockers on neurite outgrowth
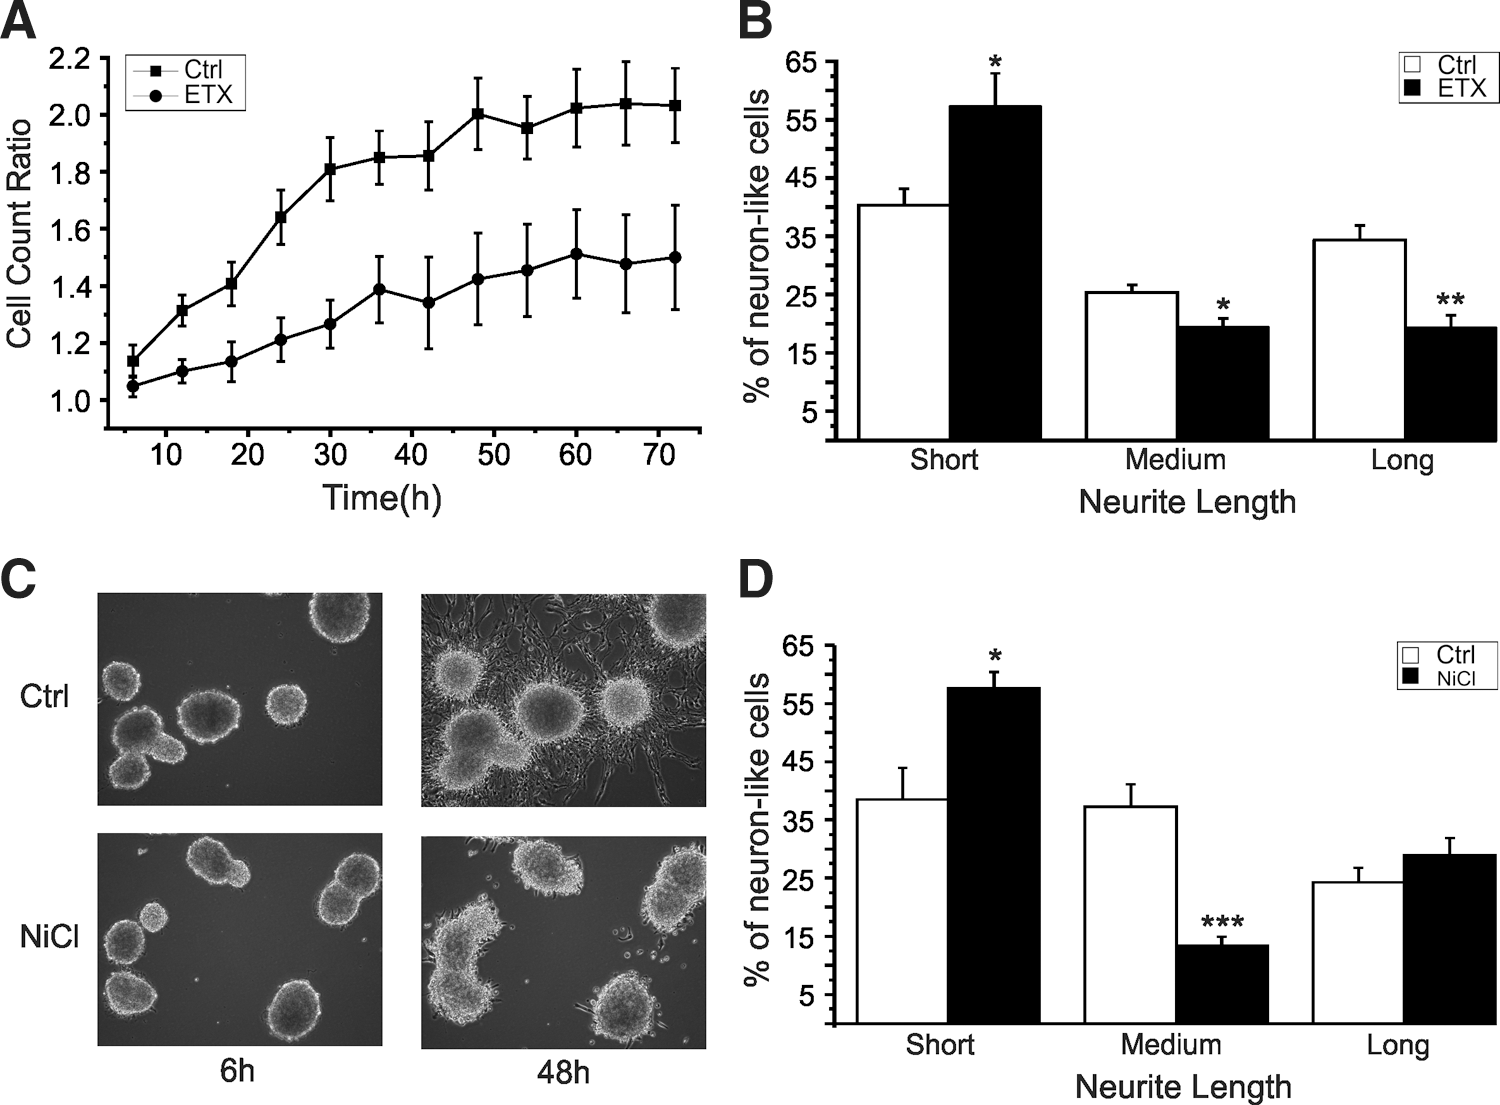
It has been previously shown that T-currents promote neurite extension in differentiating neuroblasts [26]. We thus measured the length of the neurites of migrating neurosphere-derived cells in the presence of 5 mM ethosuximide and low concentrations of NiCl2. Neurite extension was evaluated by counting the cells with short neurites (process length ≤1 cell body diameter), medium-sized neurites (process length >1 cell body diameter and <2 cell body diameter), and long neurites (process length >2 cell body diameter). The average number of cells displaying >1 diameter neurite length was significantly less when treated with ethosuximide than controls (Ctrl: 59.7%±2.8% vs. Etx: 38.7%±2.3%, P<0.05, N=9) (Fig. 9B). When grown in the presence of low concentrations of NiCl2, clear perturbation of cell migration and differentiation is evident (Fig. 9C). We thus tested the effect of NiCl2 12 h after plating. As with ethosuximide, the amount of cells with >1 diameter was less than controls (Ctrls 30.7%±2.7% vs. NiCl2 21.2%±2.3%, P<0.05) (Fig. 9D).
Discussion
Using different approaches, including biophysical, pharmacological, and imaging techniques, we have explored the role of VGCCs in proliferating NPCs in vitro. Our results suggest for the first time that T-type-like channels are functionally expressed in the majority of embryonically derived neural stem cells. The voltage dependence, Ba2+ permeability, sensitivity to low concentrations of Ni2+, mibefradil, NNC 55-0396, and ethosuximde, as well as immunostaining and mRNA expression results reveal that LVA calcium channels are involved in the physiology of migrating and differentiating NPCs.
The LVA T-type calcium channels show an early expression in many developing neurons. This trend of LVA channel in development has been described in Xenopus spinal neurons [22], sensory neurons [27], hippocampal pyramidal cells [28], and embryonic vestibular neurons [29,30]. Freshly plated embryonic Xenopus spinal cord neurons cultured in vitro show, already within 6 h of plating, action potentials that are principally calcium dependent that trigger fluctuations of intracellular calcium. Inhibiting these initial calcium influxes disturbed the differentiation [22,31]. Our calcium imaging results at 5 h support the observation of early voltage-dependent calcium fluxes. Furthermore, it has been observed that the number of cells displaying T-type currents was reduced with time of culture [22]. Chemin et al. [26] reported the role of LVA channels in neuronal differentiation using the NG108-15 cell line that recapitulates early steps of neuronal differentiation. Using pharmacological blockers of LVA, they demonstrate that blockage of T-type calcium channels prevents neuritogenesis without effecting neurite outgrowth per se. This is in line with our observations made with the NPCs that propagated from the embryonic mouse brain. The very fast T-type inactivation kinetics we noticed in our recordings may suggest that the regulation of T-type channel properties by endogenous modulators [32] and/or the expression of a variety of splice variants [33] may account for some of the possible reasons that may explain the biophysical parameters seen in embryonic neural stem cells.
We separated T- from L- type channels by 2 classical methods, pharmacological block of the L-type and physiological separation by holding voltage. The inhibitory effects of mibefradil and NNC 55-0396 were rapid, but only slowly reversible as shown previously with T-type channels [9,23]. Several factors speak for an early role of LVA channels in the early phases of differentiation. The spatial distribution of cells responding to depolarization with largest responses close to the neurosphere already before D1 and the similar distribution of cells immunostained for T-type channels clearly suggest that T-type channels are of importance during the early phases of migration/differentiation. This is further substantiated by the very remarkable depression of cell migration from the neurosphere in the presence of T-type channel blockers. None of the blockers available are specific, but the structurally different blockers all had a similar effect that could not be seen with blockers of HVA channels. HVA channel activation requires a substantial membrane voltage change from resting levels. In mature neurons, this is brought about by voltage-gated sodium channels. The results with veratridine demonstrate that voltage-gated sodium channels appear after DIV 5. The block at DIV 20 with nifedipine supports the HVA dominance occurring later and in concert with neuronal maturity. The lack of nifedipine sensitivity early in the differentiation process and the increased sensitivity to nifedipine at the outer migration layers at D5 suggest that L-type HVA channels correlate with the appearance of neuronal characteristics. This suggestion is further supported by the finding that cells responding to the L-type channel agonist BayK8644 increase at D5, and calcium responses tend to dominate at the outer migration layer. Furthermore, nifedipine caused a selective disappearance of cells in the outermost migration layer, usually consisting of a pure population of neuronal cells [17]. The presence of mRNA for both T-type and L-type channel subunits already at D1 hints that their expression is coordinated during development to maintain calcium homeostasis and ensure normal neural cell proliferation and differentiation.
Studies on the role of LVA channels are hampered by the lack of specific channel blockers. NPCs cultivated in the presence of mibefradil for long periods detached from the cover glasses, whereas HEK-293 cells were not affected. Furthermore, NPCs grown in the presence of other VGCC blockers did not exhibit the same effects. This would argue against the effect of LVA pharmacology acting against L-, or N-type channels. Thus, the data with mibefradil would suggest that the blocker is affecting channels common to electrically excitable cells with its action most likely directed against T-type channels. The coupling between integrins and the cytoskeleton is dependent on changes in intracellular calcium [34] in a mibefradil-sensitive manner [35]. The drastic effects of T-channel blockers on neural progenitor adhesion and neurite extension may thus be due to a disturbance of a T-channel-mediated coupling between adhesion molecules and the cytoskeleton.
Our data suggest that HVA calcium channels are of more importance at later stages of differentiation. There are a number of studies indicating that L-type calcium channels are needed for neuron-type cell fate determination, with a decrease in neuron phenotypes when grown in the presence of L-type channel blockers. Furthermore, studies on cell cultures show that LVA channels are needed for HVA expression [26]. When NPCs were grown in the presence of the L-type calcium blocker nifedipine, the percentage of neuronal-like cells decreased, as was observed previously [10]. Additionally, when grown in the presence of N-type calcium channel blockers, the percentage of neuronal cells significantly increased. This finding may suggest that N-type calcium channel blockage via influences on a number of cellular mechanisms may provide directly or indirectly neuroprotection. The current finding merits further investigation.
With the development of techniques to propagate neural stem cells in vitro, an attractive and simplified system for studying how cell multiplicity, migration, and cell specification is achieved during mammalian neural development. Neural stem cells acquire when plated in vitro typical neurogenic characteristics, including morphological and electrophysiological hallmarks. Here we present evidence that NPCs, as well as expressing HVA calcium channels, mainly express functional low-threshold voltage-dependent calcium channels in the very early stages of differentiation. Neurospheres cultured in the presence of LVA blockers showed a significant decrease in their migratory capacity compared to controls, as well as smaller neurite extensions, supporting the notion that LVA channels are involved in regulating differentiation.
Footnotes
Acknowledgments
This study was supported the Academy of Finland, the Magnus Ehrnrooth Foundation, and the Sigrid Jusélius Foundation.
Author Disclosure Statement
The authors have no financial disclosure to declare.
References
Supplementary Material
Please find the following supplemental material available below.
For Open Access articles published under a Creative Commons License, all supplemental material carries the same license as the article it is associated with.
For non-Open Access articles published, all supplemental material carries a non-exclusive license, and permission requests for re-use of supplemental material or any part of supplemental material shall be sent directly to the copyright owner as specified in the copyright notice associated with the article.