
Abstract
Mesenchymal stromal cells (MSC) have been intensively studied for innovative therapeutic applications. MSC in vitro are characterized by plastic-adherent proliferation, their specific immunophenotype and multipotency, whereas MSC progenitors in vivo are described as perivascular cells. Whether MSC progenitors acquire in vitro MSC characteristics upon in vitro culture is still unclear. This question can be experimentally accessed by analyzing changes in cellular properties that occur during the early in vitro culture phase, the MSC derivation phase. Here, we examined dynamics in morphology, proliferation, and expression of surface markers used for MSC characterization (such as CD34, CD105, CD146, and CD271) in tight kinetics during the MSC derivation phase of adipose tissue-derived MSC (AT-MSC). Using multiparametric flow cytometry, we identified 3 major ex vivo stromal vascular cell subsets: CD34+CD146−CD271+/− adventitial stromal cell-like cells (AdSC), CD34−CD146+CD271+/− pericyte-like cells (PC), and CD34+CD31+CD146+ endothelial cells. Of these subsets, only AdSC, but not PC gave rise to MSC under MSC culture conditions. At day 4 of culture, AdSC became fibroblastoid and upregulated CD105, CD146, and CD271. Following this phenotypic transition, AdSC commenced proliferation and downregulated CD34. In our study, we demonstrate that AdSC are more clonogenic AT-MSC progenitors than PC. Moreover, we, for the first time have dissected the phenotypic transitions from MSC progenitors to in vitro MSC during the MSC derivation phase using multiparametric flow cytometry. Hence, we propose a model describing how de novo acquisition of the typical MSC morphology by AdSC is accompanied by concerted regulation of surface marker expression upon in vitro culture.
Introduction
Whether the properties of in vitro MSC are intrinsic to MSC progenitors in vivo, or are acquired upon in vitro culture remains to be elucidated [9,10]. An interesting phase in this regard is the early culture phase, here defined as “MSC derivation phase.” Previous reports have indicated that changes in surface marker expression occur during MSC derivation. For instance, CD34 is downregulated in progenitors of AT-MSC and bone marrow-derived MSC (BM-MSC) within the first 2 passages [11 –13]. In addition, a recent report describes upregulation of CD146 by BM-MSC during the early culture phase [14].
To extend the aforementioned preliminary insights, our study aimed at a detailed analysis of timely changes in morphology, proliferation, and surface marker expression during the MSC derivation phase. To this end, we performed comprehensive kinetic analyses of MSC progenitors in the early culture phase. The required high initial numbers of MSC progenitors were obtained from the stromal vascular fraction (SVF) of densely vascularized white adipose tissue. Surface markers of in vitro MSC, such as CD73, CD90, and CD105 as well as CD146 and CD271, markers for ex vivo MSC enrichment were monitored in tight kinetics. CD34 was also included since CD146+ or CD271+ MSC progenitors were reported to be either CD34− or CD34+, respectively, but MSC in vitro are CD34− [7,13]. Furthermore, we utilized CD45 and CD31 to delineate hematopoietic cells and endothelial cells (EC).
We identified 3 major ex vivo stromal vascular cell subsets in adipose tissue, namely, adventitial stromal cell-like cells (AdSC), pericyte-like cells (PC), and EC, and we characterized AdSC as the more clonogenic progenitors of AT-MSC compared to PC. Furthermore, by monitoring cellular behavior over time, we observed a concerted sequence of changes in morphology, proliferation, and surface marker expression during the MSC derivation phase that was associated with the acquisition of the MSC-typical phenotype.
Materials and Methods
Cell isolation and culture
Adipose tissue samples of gynecomastic breast, abdomen, hip, or thigh were obtained by elective liposuctions (Supplementary Table S1; Supplementary Data are available online at
SVF cells were prepared according to standard protocols [4]. Briefly, 200–400 mL lipoaspirate were depleted from peripheral lymphocytes by washing with phosphate-buffered saline (PBS), and then digested with 0.3 U/mL Collagenase NB4G (Serva, Heidelberg, Germany) at 37°C for 45–60 min. Reaction was stopped by the Dulbecco's modified Eagle's medium (DMEM) with 20% fetal bovine serum (FBS; Invitrogen, Darmstadt, Germany), and mononuclear cells were separated from adipocytes by centrifugation. The cell pellet was resuspended and filtered through a 70-μm cell strainer (BD, Heidelberg, Germany). Remaining erythrocytes were then removed by erythrocyte lysis using the buffer EL (Qiagen, Hilden, Germany), and cell suspension was again filtered through a 40-μm cell strainer (BD). Cells were counted using a CASY cell counter (Roche, Penzberg, Germany), and then plated at a cell density of 1×10⁵ cells/cm2. Cells were cultivated under MSC culture conditions, that is, on uncoated tissue culture polystyrene (TCPS; BD) plates with the NH expansion medium (Miltenyi, Bergisch-Gladbach, Germany) and for later passages in the growth medium (GM) containing the DMEM with 10% FBS and Penicillin/Streptomycin (PAA, Pasching, Germany). After 24 h, the medium was replaced to remove nonattached cells. AT-MSC were passaged when 80% confluence was reached after 9 to 11 days. For culture expansion, cells were detached using Accutase (PAA), and reseeded at a density of 4×10³ cells/cm2.
Differentiation
AT-MSC in passage 2 were stimulated toward adipogenic, osteogenic, and chondrogenic differentiation according to established protocols [15]. In brief, 5×10³ cells/cm2 AT-MSC were seeded in 6-well plates and stimulated with the osteogenic differentiation medium (GM supplemented with 250 μM ascorbic acid, 10 mM β-glycerophosphate, and 100 nM dexamethasone; reagents from Sigma, St. Louis, MO). For adipogenesis, AT-MSC were induced upon confluence with the adipogenic differentiation medium (GM supplemented with 100 μM indomethacine, 10 μg/mL insulin, 500 μM 3-isobutylmethylxanthine, and 1 μM dexamethasone; Sigma). Chondrogenic differentiation was induced in micromass culture of 4×10⁵ cells in the chondrogenic medium (GM with 4.5 g/L D-glucose, 350 μM L-proline, 100 nM dexamethasone, and 10 ng/mL transforming growth factor [TGF]-β3; Sigma). After 21 days of differentiation, mineral deposits, lipid vesicles, and proteoglycans were detected using Alizarin Red, Oil Red, and Alcian Blue staining, respectively [15].
Kinetic analysis
For kinetic analysis, ex vivo SVF cells were seeded in uncoated 6-well tissue culture plates at a cell density of 1×10⁵ cells/cm2. The medium was replaced twice a week. At indicated time points, cells were photographed, detached, counted, and prepared for flow cytometrical analysis. Cellular diameters were recorded using a Casy cell counter as described above.
Antibody staining and flow cytometry
Ex vivo or cultivated, detached SVF cells (1×10⁶ cells) were transferred to fluorescence-activated cell sorting (FACS) tubes (BD) and antibody incubation was performed in 100 μL PBS with 2 g/L bovine serum albumin (BSA) (PBS/BSA). Nonspecific antibody binding was prevented by incubation with Beriglobin, a mixture of human IgG (Sanofi-Aventis, Frankfurt/Main, Germany) before mouse anti-human monoclonal antibodies were utilized in several combinations, allophycocyanin (APC)-H7 anti-CD14 (Clone MΦP9; BD), PE-Cy7 anti-CD31 (Clone WM59; Biolegend, San Diego, CA), PerCP anti-CD34 (Clone 8G12; BD), FITC anti-CD34 (Clone AC136; Miltenyi), Horizon V500 anti-CD45 (Clone HL30; BD), PE anti-CD73 (Clone AD2; BD), APC anti-CD90 (Clone 5E10; Biolegend), AlexaFluor488 anti-CD105 (Clone 43A3; Biolegend), PE anti-CD146 (Clone 541-10B2; Miltenyi), and APC anti-CD271 (Clone Me20.4; Miltenyi). After incubation for 20 min, cells were washed with PBS/BSA. Dead cells were excluded by DAPI staining (4′-6′-diamidino-2-phenylindole; Invitrogen).
Before intracellular staining with alpha-Smooth Muscle Actin (aSMA; clone: 1A4, R&D Systems, Minneapolis, MN), SVF cells were fixed and permeabilized using the BD FACS Lysing Solution (BD) and the BD Permeabilizing Solution 2 (BD), respectively, according to the manufacturer's instructions. Before fixation, dead cells were stained using the Live/Dead Fixable Aqua Dead Cell Stain kit (Invitrogen).
For proliferation assay, cells were labeled with a Cell Tracker Violet (CTV) BMQC dye according to the manufacturer's protocol (Invitrogen). In brief, ex vivo cells were incubated with DMSO-reconstituted CTV (dissolved in DMEM at a concentration of 5 μM) at 37°C for 30 min. Cells were then transferred into a fresh medium and incubated at 37°C for another 30 min. Afterward, CTV-labeled cells were washed with PBS, and cultivated as described under MSC culture conditions. At indicated time points, cells were harvested and antibody-stained.
Labeled cells were measured with a Canto II flow cytometer (BD) and data were analyzed using FlowJo software (Tree Star, Inc., Ashland, OR).
Cell sorting
For FACS, typically 2×10⁸ SVF cells were labeled with antibodies against CD31, CD34, CD45, CD146, and CD271 as described earlier. According to the gating strategies presented in Supplementary Fig. S5, subsets were sorted into GM-containing FACS tubes using an Aria II cell sorter (BD). Sorted cells were plated in the NH expansion medium. Alternatively, sorted subsets were also cultivated under endothelial culture conditions employing gelatin-coated (0.2% gelatin; Sigma) tissue culture plastic and Endothelial Growth Medium-2 (EGM2; Lonza, Basel, Switzerland). Cell numbers in the kinetic analysis were normalized to 1×10³ seeded cells/cm2 because seeding densities varied from 1×10³ to 4×10³ cells/cm2.
Inhibition experiments
Ex vivo SVF cells were labeled with CTV as described above and cultured under MSC culture conditions for 8 days. To inhibit proliferation, cells were treated every day with 600 nM L-Mimosine (Sigma) or 2 μg/mL Nocodazole (Sigma). Percentage of CTV− cells and immunophenotypes were measured by flow cytometry at d2, d5, and d8. Lymphocytes, EC, and pericytes were excluded from the analysis.
Quantitative polymerase chain reaction
Total RNA was isolated from sorted ex vivo EC, PC, and AdSC, or AdSC after 14 days of culture using a NucleoSpin II kit (Macherey&Nagel, Düren, Germany) and transcribed into cDNA by reverse transcription–polymerase chain reaction (RT-PCR, TaqMan® Reverse Transcription Reagents, Applied Biosystems, Life Technologies, Carlsbad, CA). Transcript copy numbers relative to the housekeeping gene β-Actin (beta-Actin) were quantified by real-time PCR using the RealMasterMix SYBR ROX kit (5Prime, Hamburg, Germany) measured on Mastercycler ep realplex (Eppendorf, Hamburg, Germany). The following primer pairs were used: β-Actin forward, 5′-GACAGGATGCAGAAGGAGATCACT-3′; β-Actin reverse, 5′-TGATCCACATCTGCTGGAAGGT-3′; CD34 forward, 5′-TGAAGCCTAGCCTGTCACCT-3′; CD34 reverse, 5′-CGCACAGCTGGAGGTCTTAT-3′; CD105 forward, 5′-CAGCAGTGTCTTCCTGCATC-3′; CD105 reverse, 5′-AGTTCCACCTTCACCGTCAC-3′; CD146 forward, 5′-CAACAGCACCTCCACAGAGA-3′; CD146 reverse, 5′-GTGATCTCCTGCTTCCCTGA-3′; CD271 forward, 5′-GTATTCCGACGAGGCCAAC-3′; CD271 reverse, 5′-CGTGCTGGCTATGAGGTCTT-3′. Relative quantification was calculated as 2−ΔCt to correlate expression of the gene of interest to the housekeeping gene.
Statistical analysis and integrated mean fluorescence intensity
All statistical analyses were performed using Prism5 (GraphPad Software, La Jolla, CA). Either box-whisker (min-max) plots or mean values±standard deviation are displayed.
For comparison of surface marker expression between several experiments, we utilized the integrated mean fluorescence intensity (iMFI) to correlate the increase in MFI with the actual percentage of positive cells according to Darrah et al. [16]. Briefly, positive cells were gated according to the respective marker and percentage and MFI were derived from FlowJo software. iMFI was calculated by multiplication of percentage and MFI. An increase in cell number together with an actual upregulation (increase in MFI) would result in a high iMFI value, whereas a few positive MFIhigh cells would give a low iMFI.
Results
Morphological changes during the MSC derivation phase
We first assessed changes in cellular morphology and proliferation during the MSC derivation phase. Bulk ex vivo SVF cells were isolated from the adipose tissue and cultured under MSC culture conditions, that is, on uncoated TCPS culture dishes in the NH expansion medium containing 10% FBS.
At day 2 (d2), cells showed round-shaped morphologies that were tightly as well as loosely attached, as judged by their light refraction (Fig. 1A). By d4, some cells changed from round shaped to spindle shaped. These fibroblastoid cells dominated the culture by d6, and successively proliferated to confluence by the end of primary culture (d11).
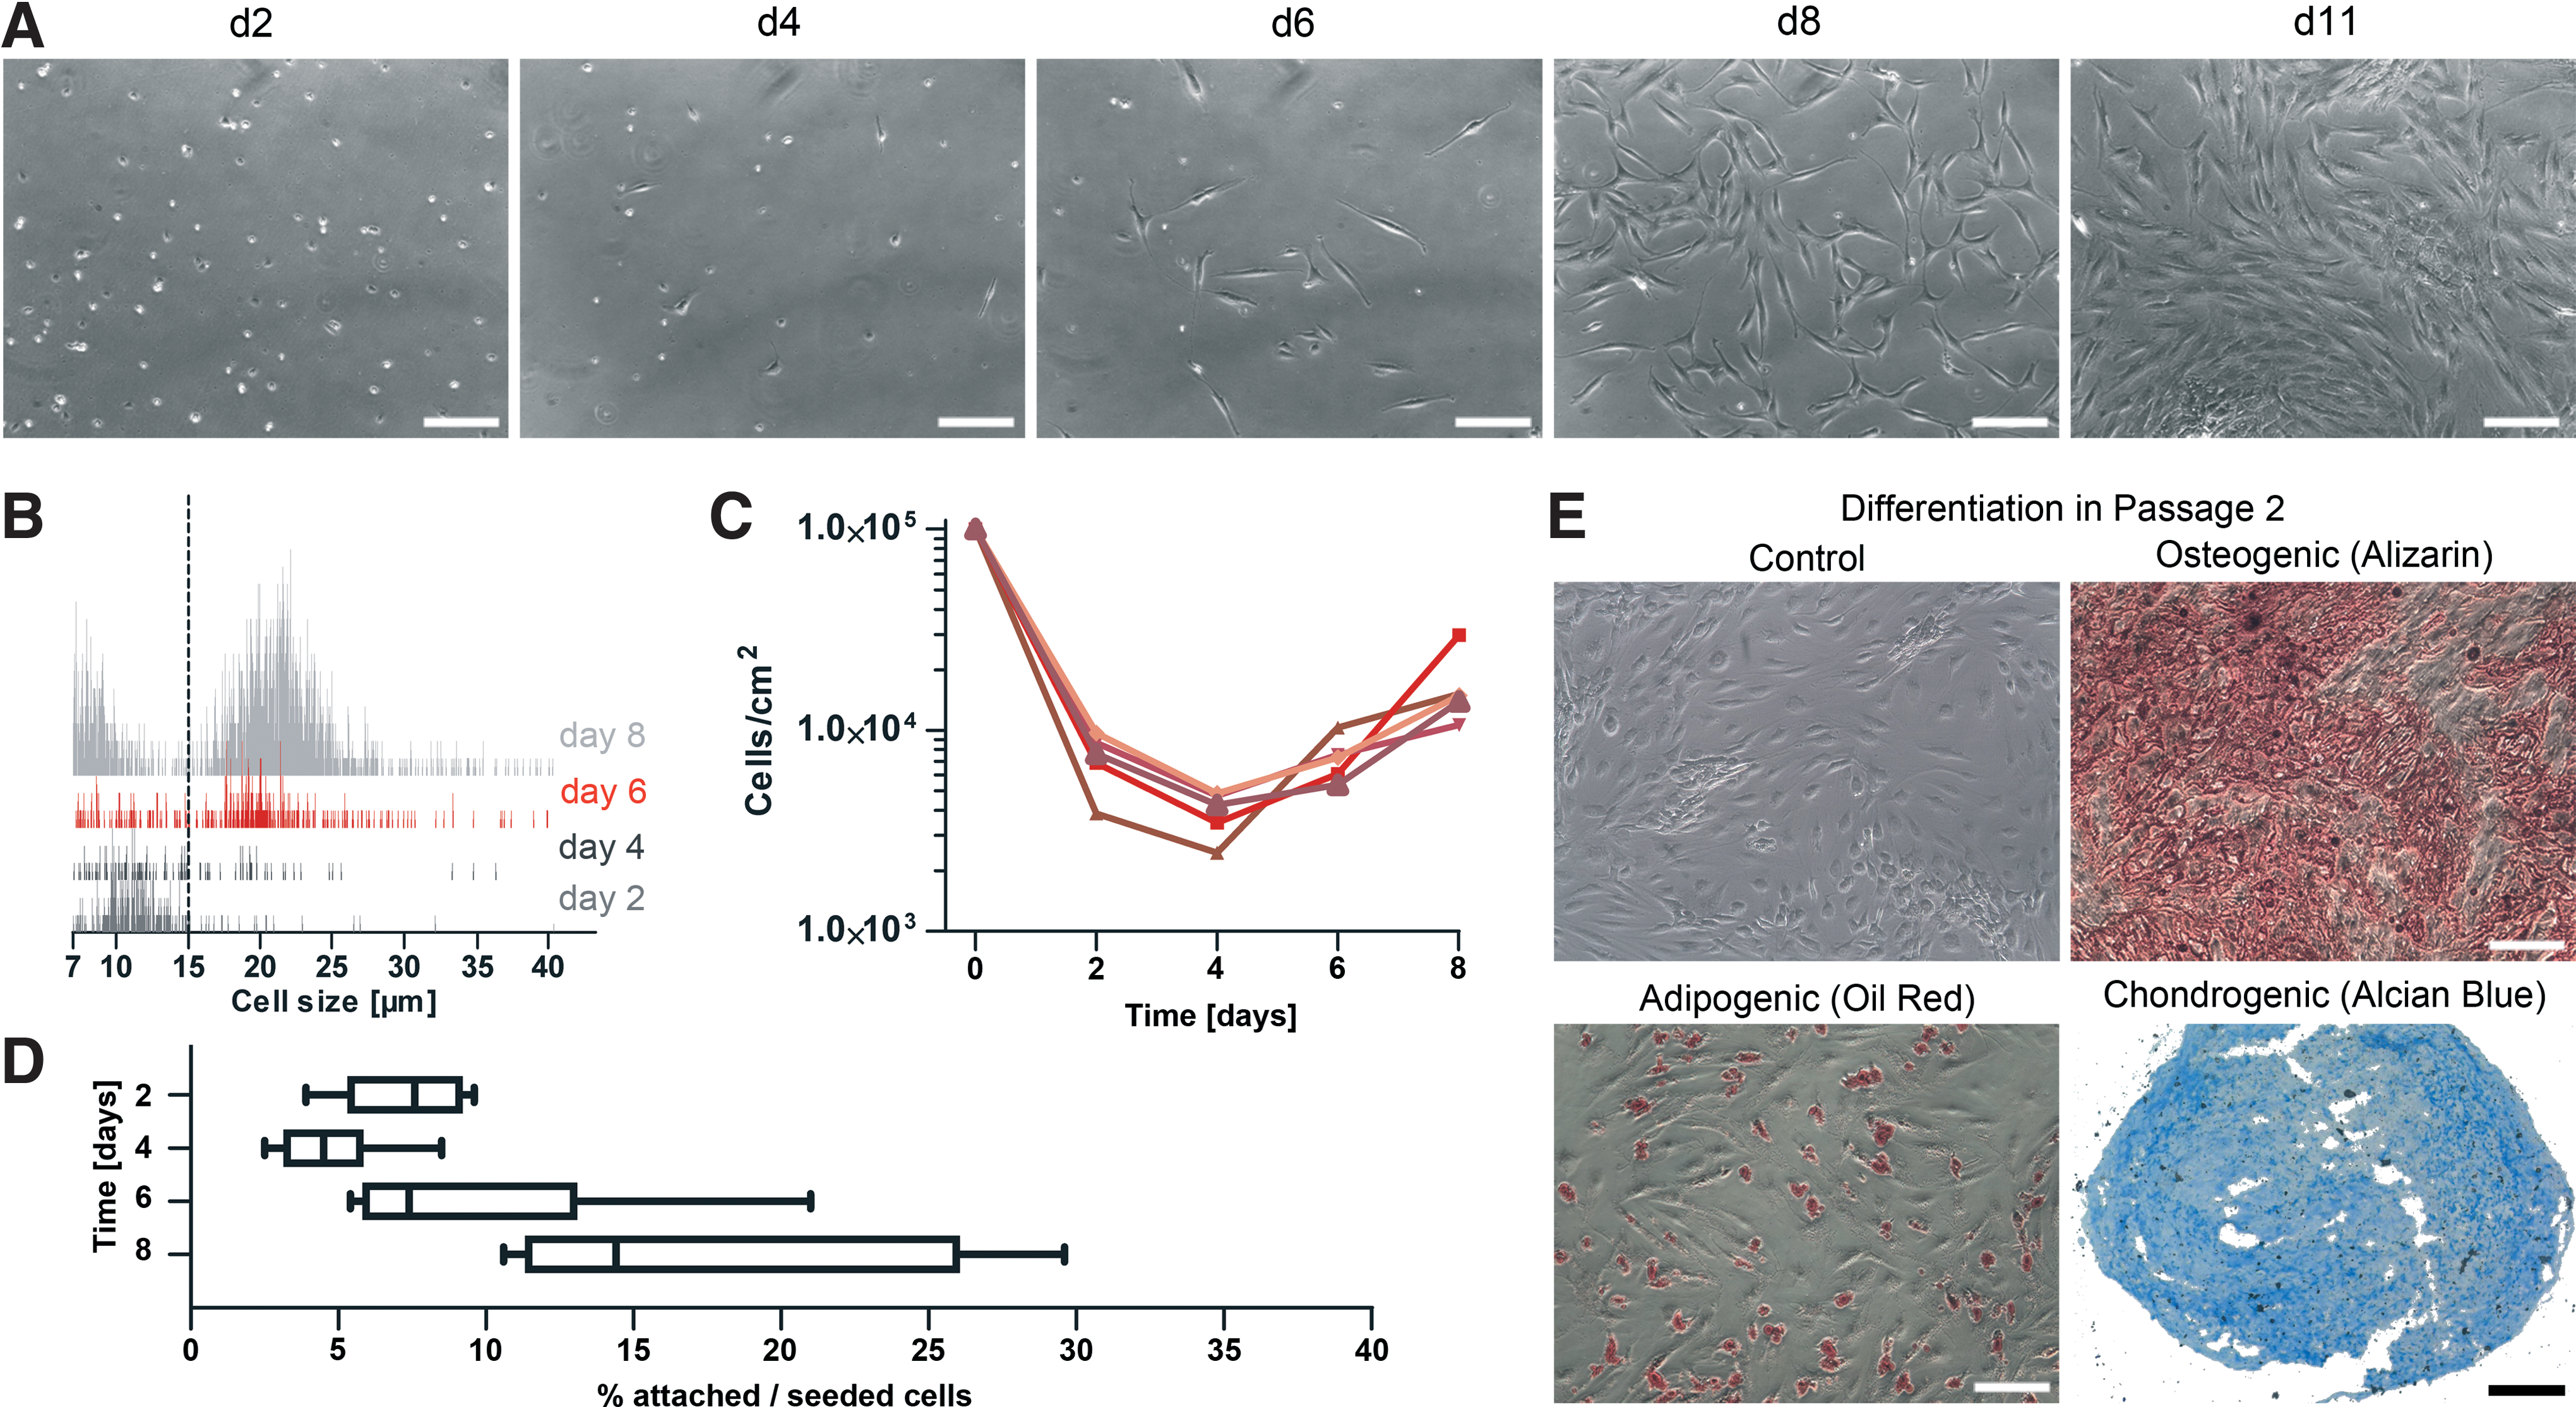
Changes in morphology, size, and proliferation of stromal vascular fraction (SVF) cells during early culture phase. At d2, 4, 6, 8, and 11, primary cultures of SVF cells cultured under mesenchymal stromal cells (MSC) culture conditions were photographed to monitor morphology, and cellular diameters as well as cell counts of detached cells were determined by a Casy cell counter.
We next monitored cell size changes during the derivation phase. At d2 and d4, a mean cellular diameter of 10.1 μm was observed (Fig. 1B). At d6, the majority of cells reached a mean diameter of 21.8 μm, and only a few small-sized cells remained. At d8, viable cells homogeneously exhibited increased cell diameters of 21.9 μm.
To follow cell number changes, cells were counted every second day (Fig. 1C). In addition, the percentage of adherent cells relative to the initial number of seeded SVF cells was calculated (Fig. 1D). Compared to the initiation of cell culture (d0), only around 7.3% adherent cells (7.3±2.2×10³ cells/cm2) were retrieved at d2, and a further reduction to around 4.7% (4.7±2×10³ cells/cm2) occurred by d4. Subsequently, cells proliferated and the cell numbers increased to 9.6±5.8×10³ cells/cm2 and 1.7±0.8×10⁴ cells/cm2 at day 6 and 8, respectively.
To functionally characterize these cells as AT-MSC, the differentiation capacity and immunophenotype of expanded cells in passage 2 were determined. Successful osteogenic, adipogenic, and chondrogenic differentiations were confirmed by positive staining for calcium deposits (Alizarin Red), lipid vesicles (Oil Red), and proteoglycans (Alcian Blue), respectively (Fig. 1E). In addition, cells exhibited the typical MSC immunophenotype, being positive for CD73, CD90, and CD105 and negative for CD14, CD34, and CD45 (Supplementary Fig. S1).
Taken together, these results indicate that during the MSC derivation phase small, round-shaped SVF cells transform into proliferating, fibroblastoid and multipotent AT-MSC.
Identification of SVF cell subsets ex vivo
We next characterized ex vivo SVF cell subsets based on surface markers CD31, CD34, CD105, CD146, and CD271 (Fig. 2). Within viable SVF cells, we separated the CD45− stromal vascular cells (83.5%±5.6%) from CD45+ lymphocytes (16%±5.5%, Fig. 2A, D). The vascular cells consisted of CD34+CD31− (47.6%±9.2%), CD34−CD31− (13.2%±3.1%), and CD34+CD31+ (22.3%±4.3%) cell subsets (Fig. 2B, D).
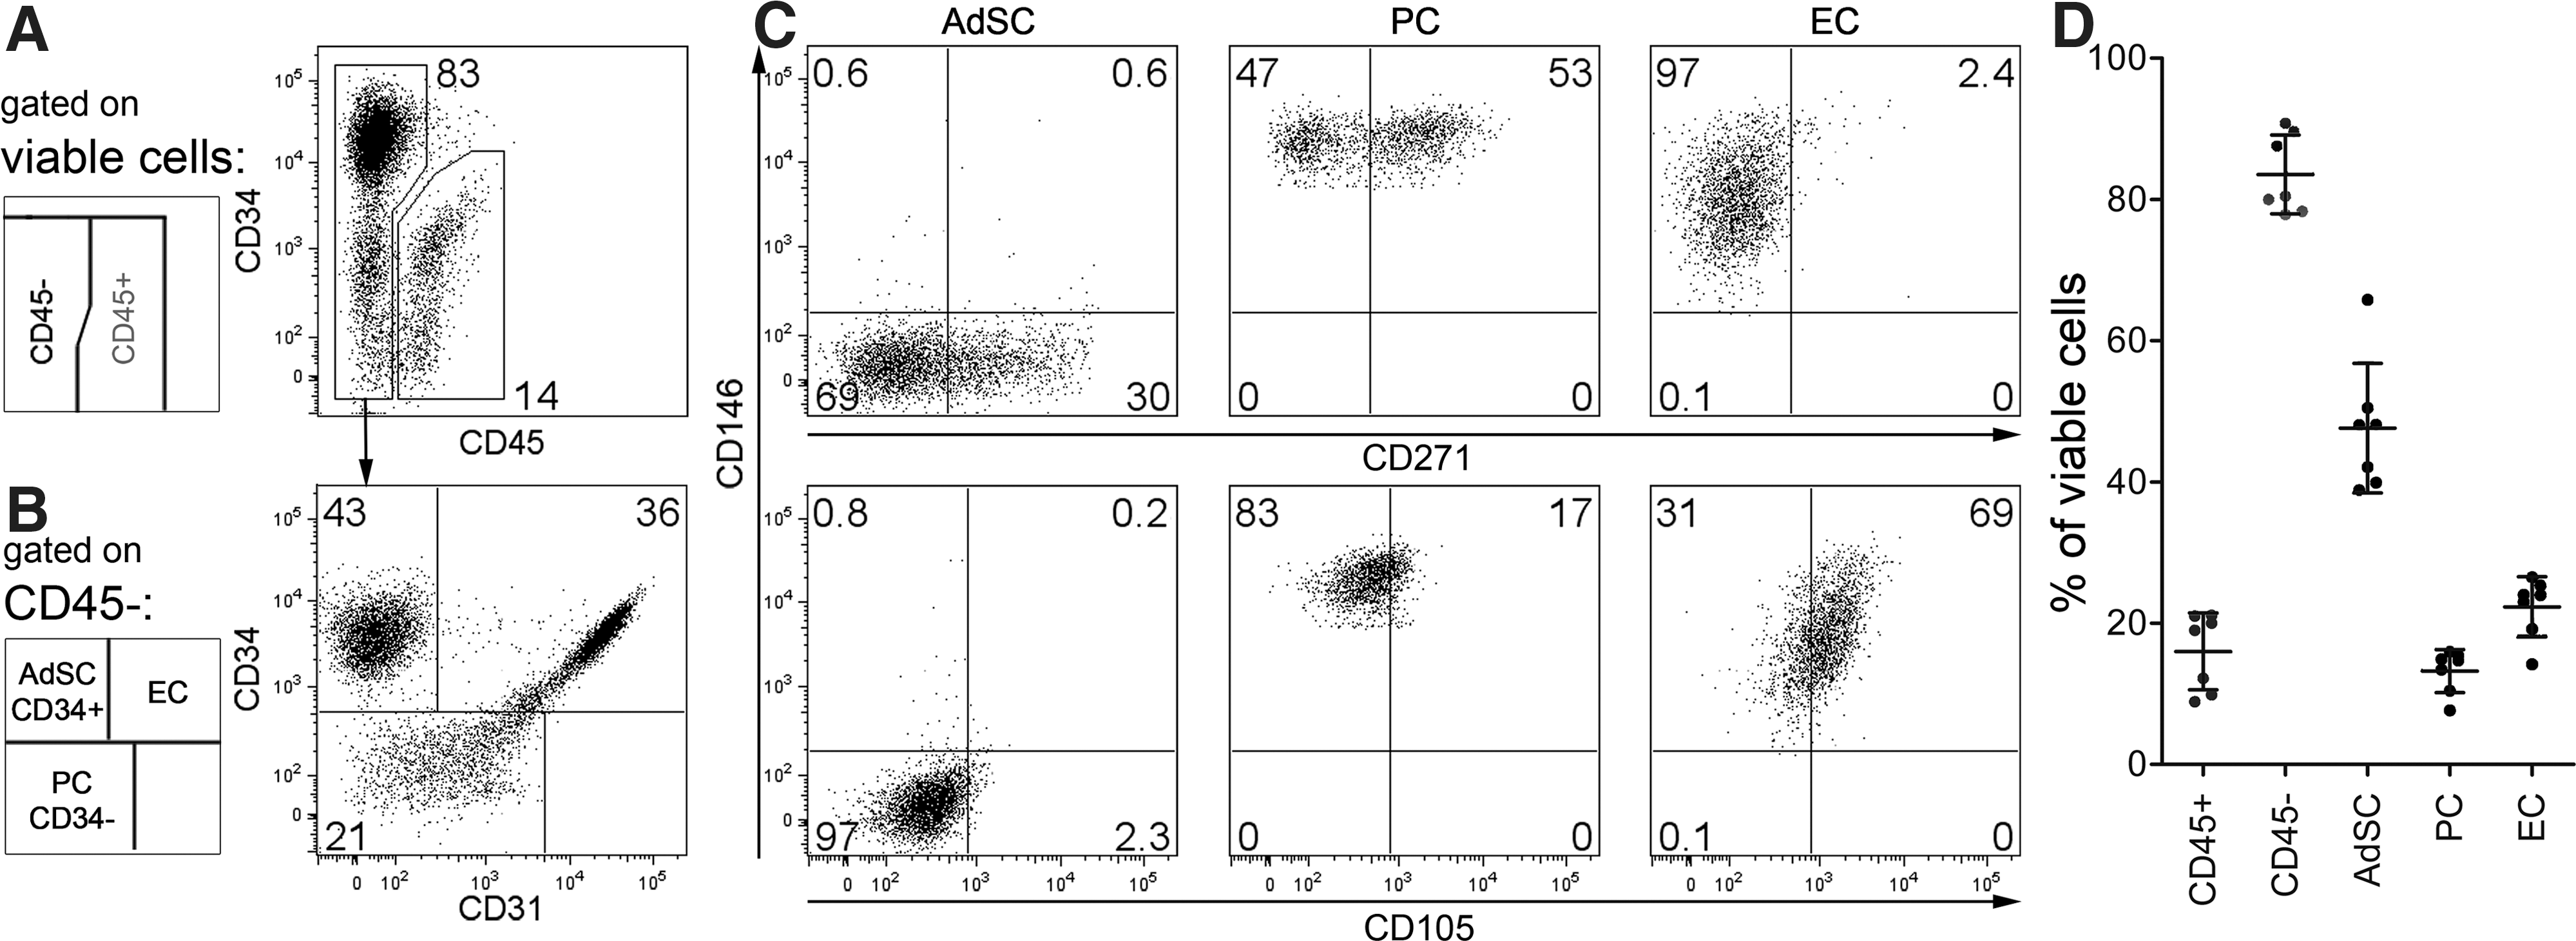
Identification of SVF subsets. Ex vivo SVF cells were analyzed by flow cytometry to characterize cell populations for CD45, CD31, CD34, CD105, CD146, and CD271 expression. Gating strategy (see schemes):
Similar subsets have already been histologically characterized and localized to the perivascular niche [7,17 –20]. We adopted the nomenclature from a recent report by Zimmerlin et al. [21] and termed these subsets as CD34+CD31− AdSC, CD34−CD31− PC, and CD34+CD31+ EC.
AdSC were negative for CD105 and CD146, but a subfraction (44.7%±10.9%) was CD271+. PC homogenously expressed CD146, were mainly negative for CD105, and the majority (56.5%±4.7%) expressed CD271. EC were CD146+ and expressed CD105 at low levels (Fig. 2C). In addition, in agreement with a recent study that identified PC to be aSMA+ [22], aSMA-expressing cells were enriched in PC, but were almost not detectable in AdSC (Supplementary Fig. S2).
Frequencies of AdSC, PC, and EC did not seem to vary drastically between donors (Fig. 2D, Supplementary Table S1). However, the sample size and age variability of analyzed adipose tissues does not allow for a definite conclusion and thus, in future studies, broader patient cohorts will be analyzed.
Taken together, we identified 3 major cell subsets in the SVF; namely, CD34+CD31−CD146−CD271+/− AdSC, CD34−CD31−CD146+CD271+/− PC, and CD34+CD31+ CD146+CD105low EC.
Dynamics of surface molecule expression during MSC derivation
To elucidate which SVF cell type gives rise to AT-MSC, we traced the defined subpopulations during the early in vitro culture phase using the described multiparametric analysis. We focused first on CD45+ and CD45− subsets, then on percentage of AdSC, PC, and EC, and later compared expression of CD146, CD271, and CD105 within these subsets. Due to dynamic changes in phenotypes, AdSC, PC, and EC are here referred to as CD34+CD31−, CD34−CD31−, and CD34+CD31+ cells.
Between d0 and d2 of culture, the percentage of CD45− stromal vascular cells increased, whereas that of CD45+ cells dropped, indicating that the majority of lymphocytes were not able to adhere (Fig. 3A). Among CD45− cells, frequencies of CD34+CD31− and CD34−CD31− cells increased until d2. The frequency of CD34+CD31+ cells decreased and eventually diminished (Fig. 3B); however, a noticeable increase in iMFI of CD105 on CD34+CD31+ EC appeared between d0 and d4 (Supplementary Fig. S3). This observation is supported by a recent report showing that CD105 upregulation is a sign of EC activation upon in vitro culture [23].
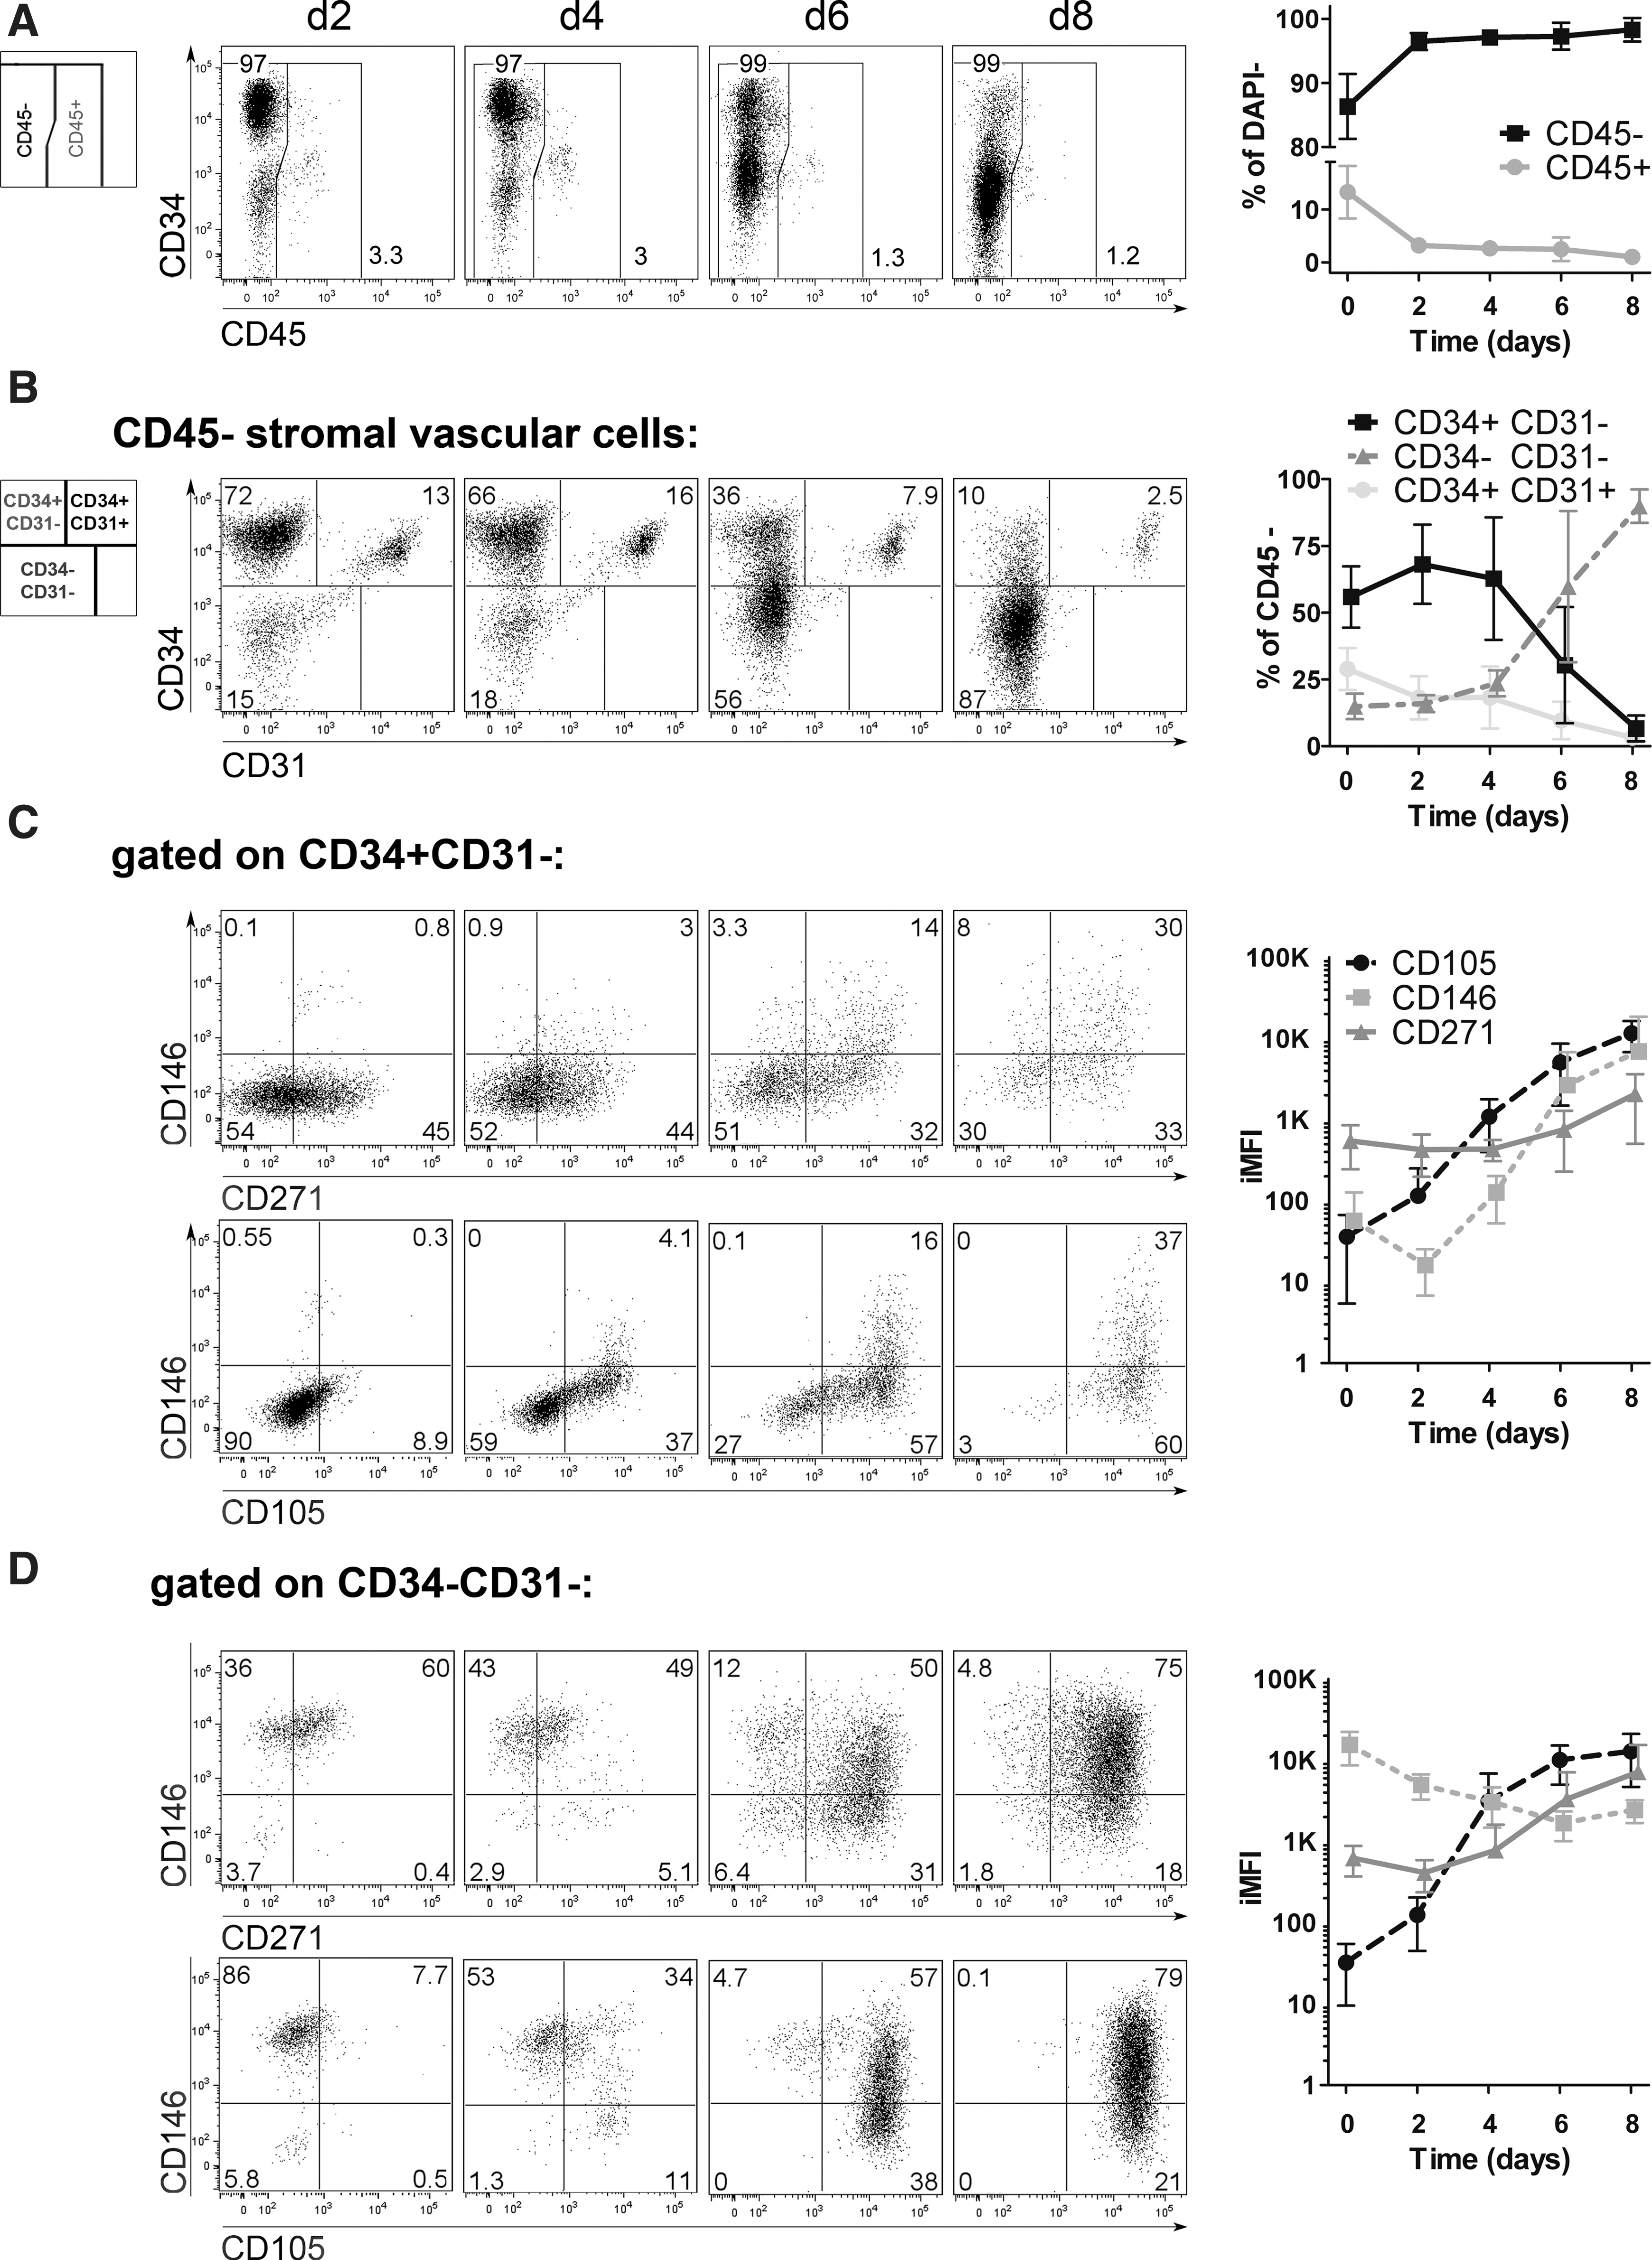
Kinetic of surface marker expression during MSC derivation phase. SVF cells were cultured under MSC culture conditions and were harvested at indicated time points of the early ex vivo culture phase (d2 to d8) and analyzed by flow cytometry for surface marker expression. One representative analysis and diagrams of kinetic experiments (d0–d8) are depicted (n=4; mean±SD).
Later in the course of culture, an increase in the frequency of CD34−CD31− cells was observed between d4 and d6 that was accompanied by a reduction of CD34+C31− (Fig. 3B). This could be caused by either excessive proliferation of PC or downregulation of CD34 by AdSC, which rendered the CD34− fraction the dominant cell type [11 –13].
To find further evidence supporting either hypothesis, CD105, CD146, and CD271 expression by CD34+CD31− and CD34−CD31− cells over time was analyzed. In CD34+ CD31− cells, the frequencies and iMFI of CD146+, CD105+, as well as CD271+ cells increased throughout primary culture (Fig. 3C). At d8, the few remained CD34+ cells were homogeneously CD105+, CD146+, and CD271+ suggesting upregulation of these markers by CD34+CD31− cells. A similar subpopulation of CD105+, CD271+, and CD146low to CD146+ cells appeared within the CD34−CD31− cells at d4 (Fig. 3D) and became prominent at d6 concurrent with the decrease of CD34+CD31− cells. This supports the hypothesis that the prominently observed CD34− population at d8 was not derived from CD34−CD31− PC, but from CD34+CD31− AdSC that downregulated CD34.
We also examined CD73 and CD90 expression during MSC derivation (Supplementary Fig. S4). At d2, AdSC were homogenously CD73low CD90high and gradually upregulated CD73 after d4. At the same time, CD73+ CD90high AdSC appeared in the PC fraction after downregulation of CD34.
Taken together, our results favor the hypothesis that CD34+CD31− AdSC first upregulate CD73, CD105, CD146, and CD271 before the downregulation of CD34, coincident with the appearance of a CD105+CD146+ CD271+ population in the CD34−CD31− PC gate. Accordingly, AdSC may develop into CD34−CD73+CD90+ CD105+CD146+ CD271+/− cells, that is, AdSC adopted the MSC-typical in vitro immunophenotype.
AdSC are the more clonogenic AT-MSC progenitors
To further support the finding that AdSC give rise to AT-MSC, we FACS-sorted SVF cell subsets for separate cultivation and analysis of temporal phenotype changes (Supplementary Fig. S5). Proliferation of these subsets during early culture was traced by monitoring cell counts. We first compared the frequency of adhering cells in AdSC, PC, and EC based on cell densities at d2 of culture (Fig. 4A). Compared to CD271+ AdSC (43.5%±15.4%) and EC (17.7%±15.5%), the highest percentage of adherent cells (57.4%±32.5%) was observed in PC. However, under MSC culture conditions, PC and EC did not proliferate and cell densities remained relatively constant at an average of 327.2±255.2 and 135.9±158.2 cells/cm2, respectively (d14). In contrast, cell counts of AdSC increased after d8 to 1332.9±448.3 cells/cm2 at d14, suggesting an average proliferation rate between d6 and d14 of ∼0.3 population doubling per day (Fig. 4A). Under endothelial culture conditions (gelatin-coated TCPS and EGM2 medium), PC and EC proliferated slowly with ∼0.45 and 0.5 population doubling per day up to 664.5±96.9 and 311±229.1 cells/cm2 at d14 (Fig. 4B). AdSC proliferated even more than under MSC culture conditions, with ∼0.9 population doubling per day up to 4255±1831 cells/cm2 at d11. After passaging, both subsets were cultured under MSC culture conditions and proliferation rates of AdSC and PC were similar (data not shown). Differentiation of these subsets in passage 2 revealed similar adipogenic and osteogenic differentiation potentials of AdSC and PC (Supplementary Fig. S6). Thereby, we confirmed that both PC and AdSC give rise to MSC-like cells [7,19]. However, we clearly demonstrated that PC can only proliferate under endothelial culture conditions.
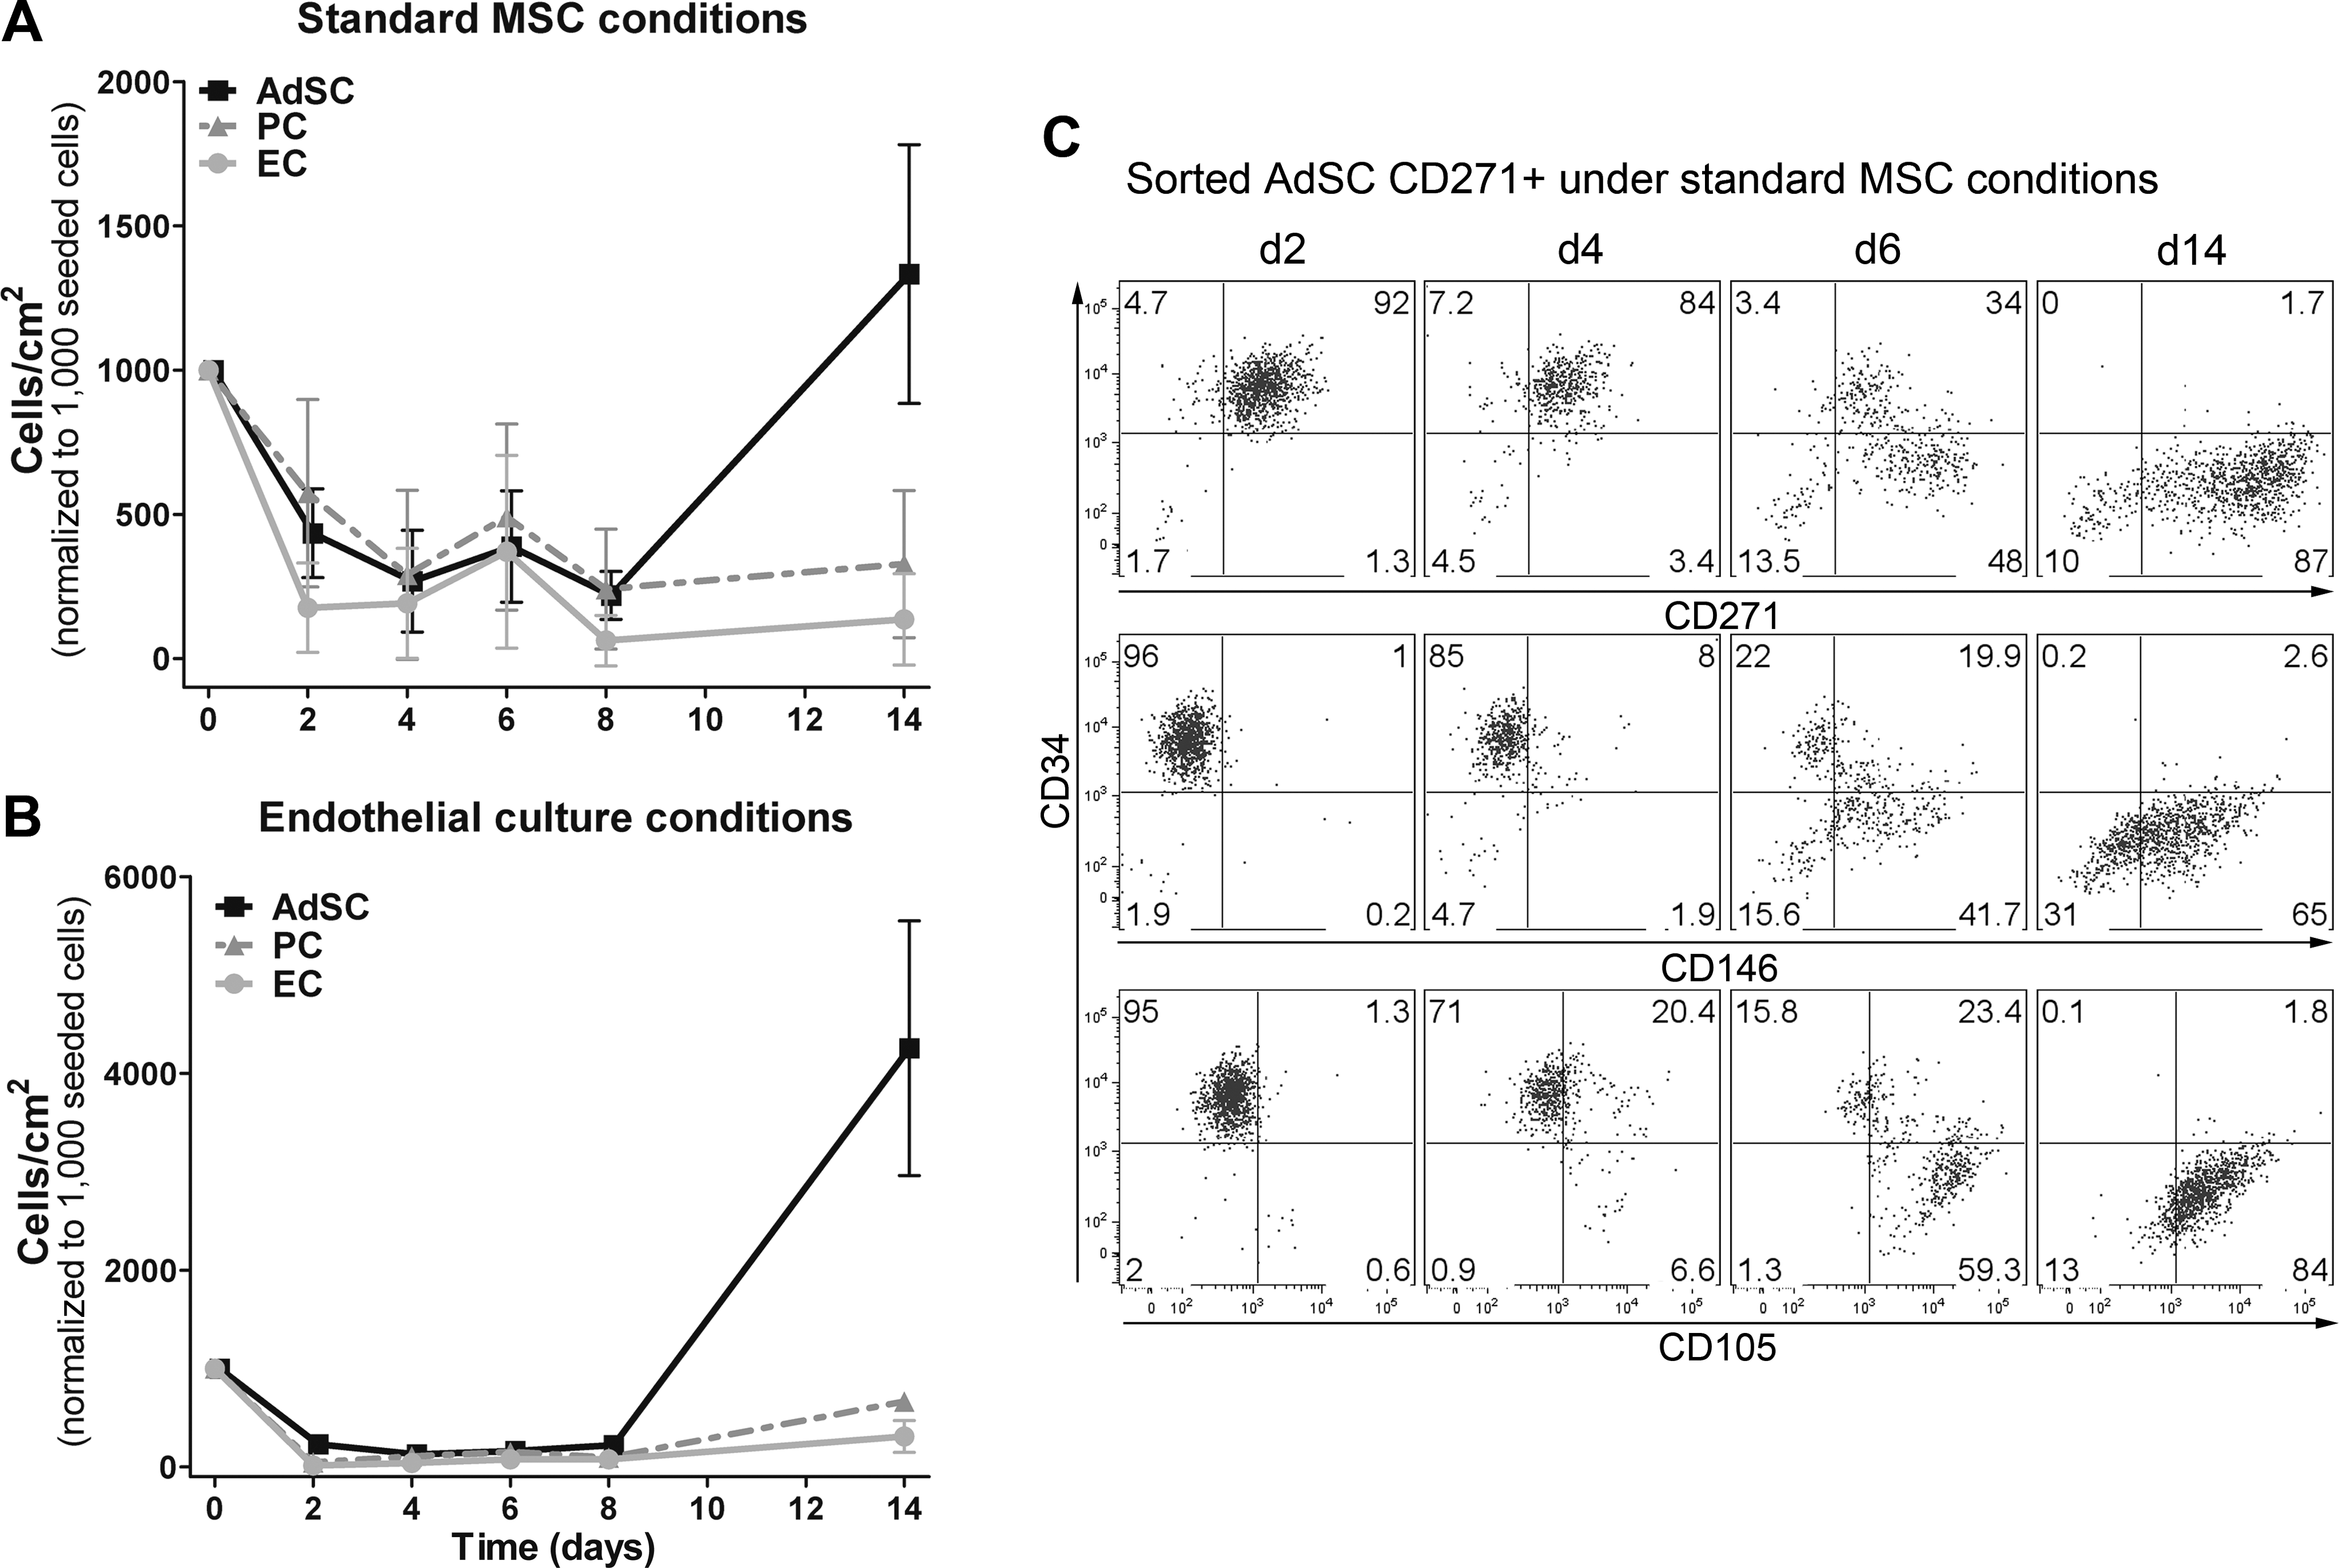
MSC derivation phase of sorted SVF subsets. SVF cell subsets were sorted into CD271+ AdSC, PC, and EC as described in Supplementary Fig. 5 (n=4). Cell counting and flow cytometric analyses were performed at d2, d4, d6, and d14.
We next monitored changes in the immunophenotype of CD271+ AdSC (Fig. 4C). Similar to bulk cultures (Fig. 3), distinct levels of CD105 (27%) and CD146 (10%) upregulation were accompanied by downregulation of CD34 (8% CD34−) at d4. These changes became more obvious at d6, with 83% CD105+, 62% CD146+, and 62% CD34− cells in the culture. Finally, at the end of primary culture (d14), quite a homogeneous cell population was observed with 86% CD105+, 68% CD146+, 89% CD271+, and 97% CD34−. In addition, CD73low CD90high AdSC ex vivo became CD73+ at around d6 (Supplementary Fig. S7). Intriguingly, we also observed CD271 induction in ex vivo sorted CD271− AdSC (Supplementary Fig. S8), indicating that CD271 is not an essential marker to characterize AT-MSC progenitors, but may have a function in MSC derivation. Altogether, cell proliferation as well as cell surface marker regulation of sorted CD271+ and CD271− AdSC resembled those in bulk cultures, but were delayed by 2 days. We assume that sorting-associated cell stress led to these deviations and consequently to a prolonged derivation phase.
These results strongly confirm that AdSC are the more clonogenic AT-MSC progenitors compared to PC and that AdSC upregulate CD105, CD146, and CD271 and downregulate CD34 during early in vitro culture.
Changes of the AdSC immunophenotype coincide with cell proliferation
The concerted regulation of CD105, CD146, CD271, and CD34 seems to be linked with the onset of proliferation. To test this correlation, we monitored changes in these marker expressions in relation to cell proliferation using a fluorescent CTV probe. This dye is retained intracellularly and equally distributed during cytokinesis, resulting in daughter cells with reduced fluorescence intensity. As shown in Fig. 5, cell proliferation as measured by reduction of CTV fluorescence at d3 became increasingly prominent in successive days. In this process, proliferating cells downregulated CD34, but upregulated CD146 and CD105 from d4 on (Fig. 5A–C, respectively). Of note, not all proliferating cells expressed CD271 at d4 and d5 corroborating the observation that both, CD271+ and CD271− AdSC are AT-MSC progenitors (Fig. 5D). Furthermore, small populations with low CD105 and CD146 expression appeared within nonproliferating CTV+ cells, which may represent a subfraction of AdSC that have upregulated CD105 and CD146 before cell division.
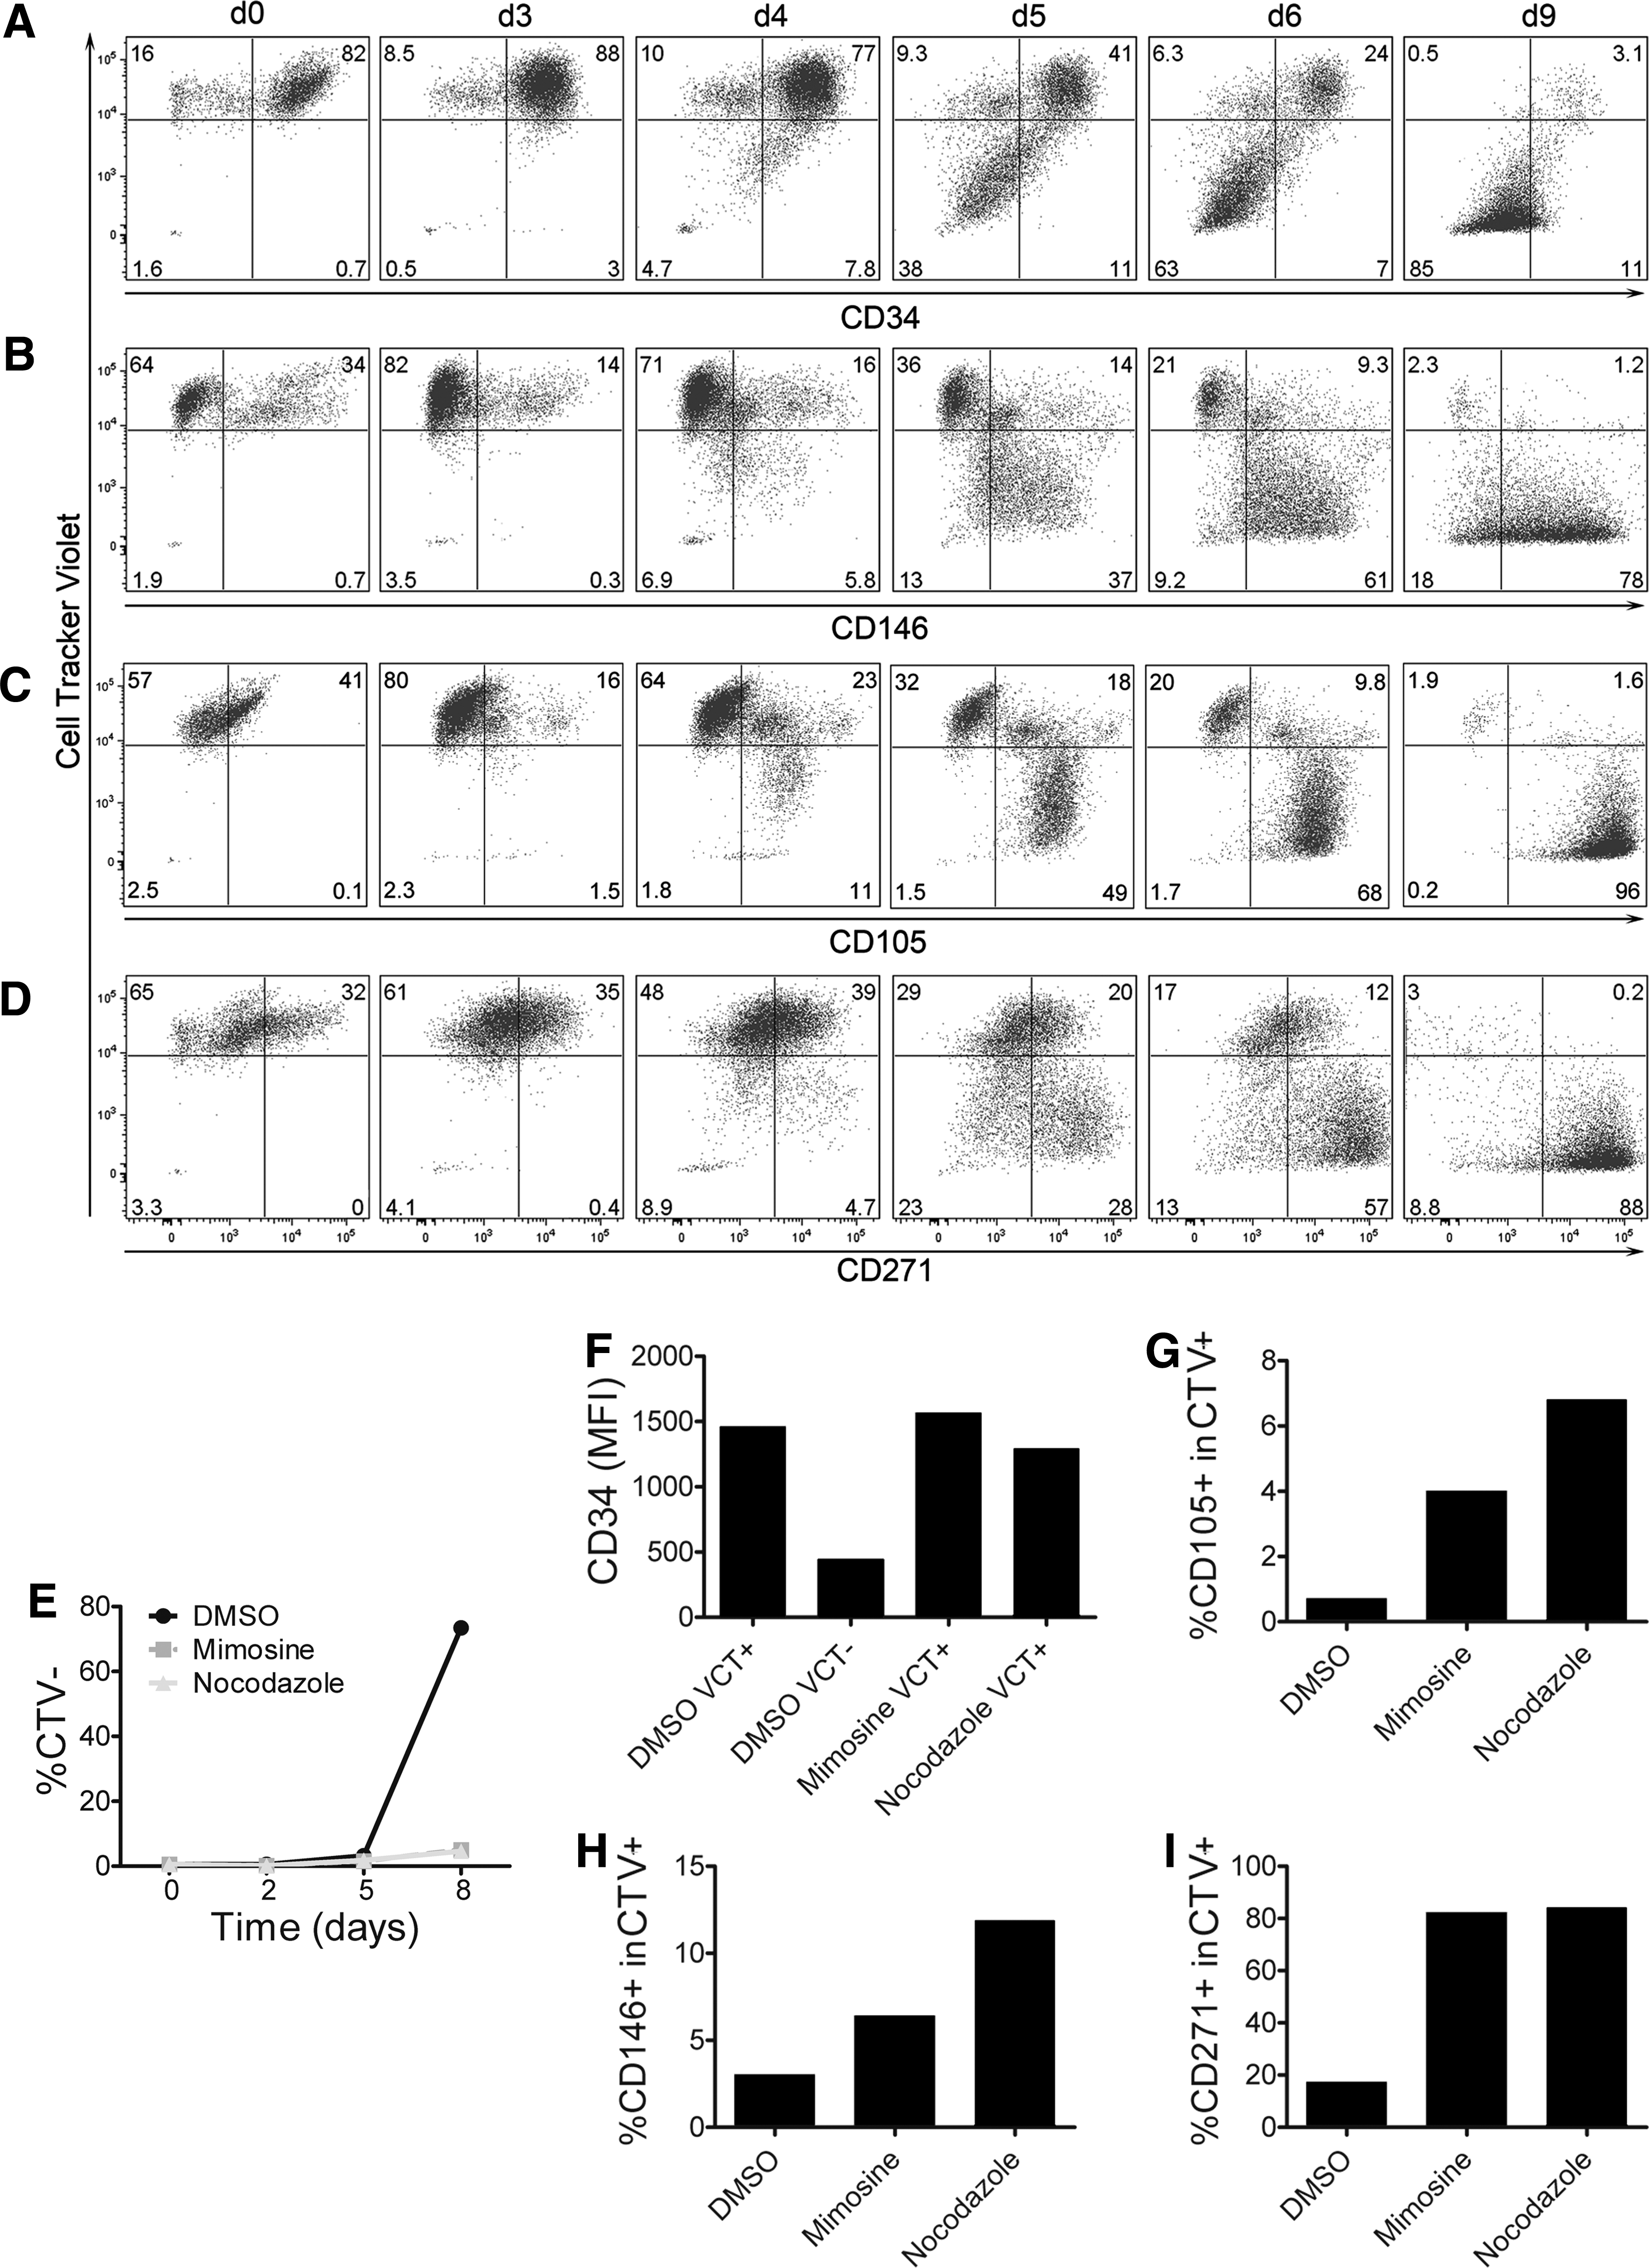
Regulation of surface markers coincides with proliferation. Ex vivo SVF cells labeled with Cell Tracker Violet (CTV) were cultivated and analyzed between d0 and d9 of primary culture. CTV fluorescence was compared to
To corroborate this assumption, we investigated the effect of cell cycle inhibition on marker regulation. As shown in Fig. 5E, Mimosine and Nocodazole inhibited proliferation almost completely compared to the DMSO control. Furthermore, expression of CD34 at d8 was unchanged in nonproliferating (CTV+) control as well as treated cells compared to proliferating (CTV−) control cells, confirming that CD34 is downregulated after proliferation (Fig. 5F). Blocking of proliferation further resulted in increased frequencies of CD105+, CD146+, as well as CD271+ cells at d8 (Fig. 5G–I). Thus, cell cycle inhibition prevented downregulation of CD34, but CD105, CD146, and CD271 were still upregulated by AdSC.
Taken together, these results clarified that AdSC upregulate CD105, CD146, and CD271 before cell division, whereas CD34 is downregulated postmitotically.
Verification of surface marker regulation at transcriptional level
Finally, we verified the observed gene expression changes at the transcriptional level using quantitative PCR on sorted ex vivo CD271+ AdSC, PC, and EC and on CD271+ AdSC cultivated for 14 days.
The different transcription rates of CD34, CD105, CD146, and CD271 in EC d0 and PC d0 closely reflected our observations obtained by flow cytometric analyses (Fig. 6). Furthermore, in AdSC d0, CD34 was transcribed at high levels, but was strongly reduced at d14. Conversely, the levels of CD105 transcription were low in AdSC d0, but increased by d14. These results reveal that CD34 downregulation and CD105 upregulation in AdSC during MSC derivation is regulated at the transcriptional level. CD271 transcripts were found at equal levels in AdSC between d0 and d14. Similarly, the transcription levels of CD146 remained unchanged between ex vivo and cultivated AdSC, although we observed upregulation by flow cytometry (Figs. 3 –5), suggesting post-transcriptional regulation of this marker.
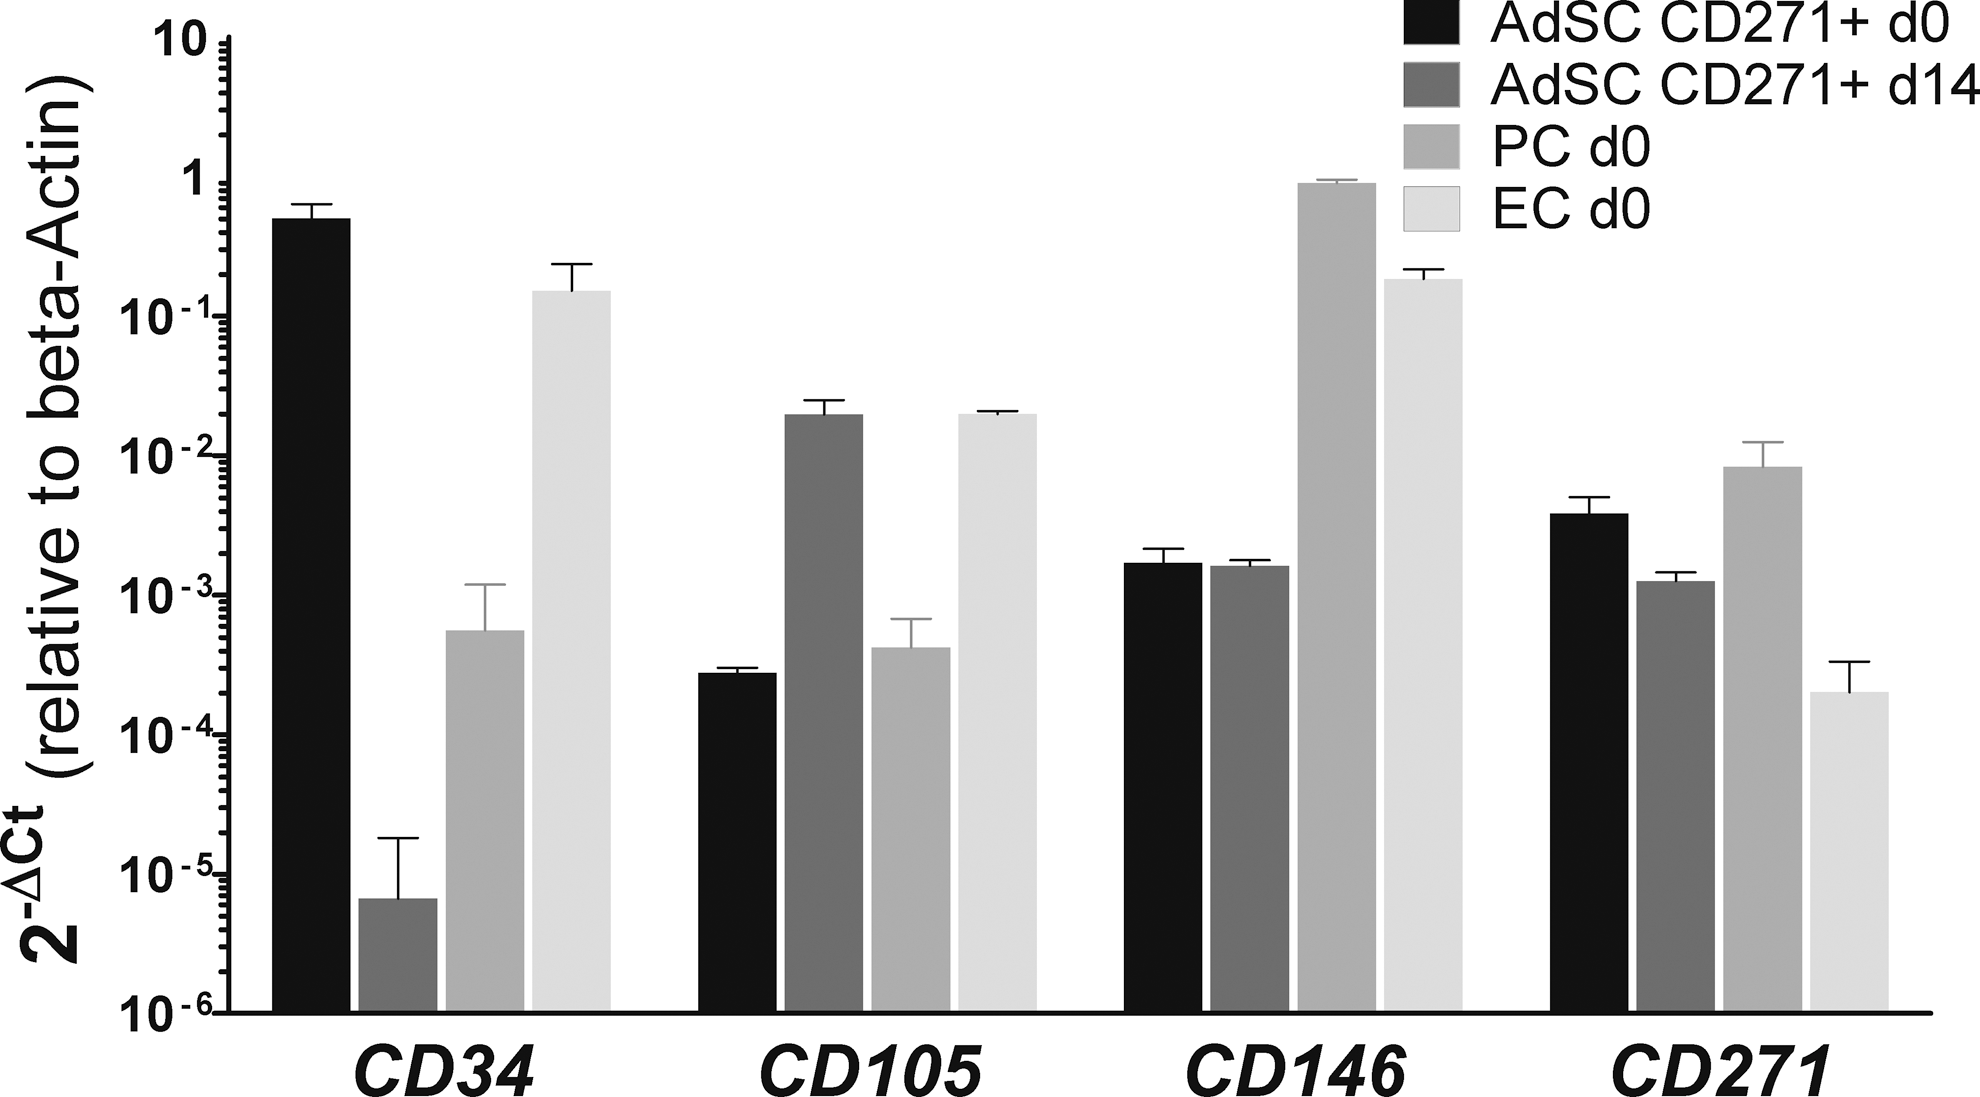
Transcriptional regulation during MSC derivation. Gene expression was analyzed by quantitative reverse transcription–polymerase chain reaction in sorted ex vivo (d0) EC, PC, AdSC, and AdSC after primary culture (d14). Transcripts of CD34, CD105, CD146, and CD271 were quantified relative to β-Actin (n=3,±SD).
Together, these results verified that during MSC derivation, CD271+ AdSC maintain their expression of CD271, upregulate CD105, but downregulate CD34, in agreement with our observations from flow cytometric analyses.
Discussion
To elucidate how MSC progenitors change upon in vitro culture, we comprehensively analyzed cellular phenotypes during the MSC derivation phase. In our study, we demonstrate that AT-MSC can be derived from AdSC and PC. Although AdSC- and PC-derived AT-MSC in later passages exhibited similar proliferative capacity and differentiation potential, major differences were observed in the MSC derivation phase. Under MSC culture conditions, we did not observe proliferation of PC, and even under endothelial culture conditions, AdSC were still more proliferative than PC. From these results, we propose that AdSC are the more clonogenic MSC progenitors in the adipose tissue. Supporting our finding, recent studies have also described adventitial cells as the more proliferative AT-MSC progenitors, however, only under endothelial conditions and not MSC conditions [19,21,24]. Furthermore, we conclude that MSC derivation is culture-dependent, that is, distinct MSC progenitors need different in vitro culture conditions.
By tracing the phenotypes of SVF subsets during the MSC derivation phase, we further elucidated that the AdSC phenotype changes with CD105, CD146, and CD271 being upregulated, but CD34 being downregulated. Since we have not performed single-cell cultures, we cannot completely rule out the possibility of overgrowth of small fractions of contaminating cells being responsible for these phenotypic changes during MSC derivation. However, we observed these phenotypic conversions not only in bulk cultures, but also in cultures of FACS-sorted AdSC.
Furthermore, expression analysis at the transcriptional level confirmed CD105 upregulation and also CD34 downregulation. However, comparison of surface and intracellular CD34 staining revealed that internalization of membrane CD34 is responsible for the quick reduction of CD34 on AdSC daughter cells directly after cell division (Supplementary Fig. S9). Furthermore, CD271 and CD146 transcription rates remained constant, although increased staining intensities were observed during early culture. In addition, AT-MSC in passage 2 were again CD146− (Supplementary Fig. S1). Hence, the upregulation of CD146 seems to be a transient effect, possibly regulated by post-transcriptional or post-translational modifications; this may also apply for CD271.
CD105, CD146, and CD271 are molecules involved in cell attachment, motility, and morphology. In particular, CD105 (Endoglin) promotes cellular attachment and morphological spreading of rat myoblasts [25]. CD146 (Melanocyte-cell adhesion molecule, MCAM, Muc18) is associated with tumor progression and metastasis, that is, contributes to increasing cellular motility [26]. CD271 (low-affinity nerve growth factor receptor, NGFR, p75NTR) is involved in the development of peripheral neurons by supporting axon outgrowth [27,28]. Therefore, the upregulation of CD105, CD146, and CD271 during early culture of MSC may be required to improve attachment, increase motility, and help in formation of the MSC-typical morphology.
In addition, it was recently shown that CD146 is upregulated on BM-MSC as a response to higher oxygen tensions in culture [14], in accordance to our observation of CD146 upregulation. Furthermore, CD105 is a coreceptor of the TGF-β receptor type 2 and is induced upon TGF-β exposure [29]. Interestingly, CD105 signaling was reported to counteract the TGF-β-mediated suppression of proliferation in EC [30]. Thus, CD105 might be upregulated upon exposure to (autocrine) secreted TGF-β, which leads to the activation and proliferation of AdSC. In our experiments, inhibition of proliferation resulted in the accumulation of nonproliferating CD105+CD146+CD271+ AdSC that were still CD34+. These cells may represent activated AdSC, that is, cells that entered the cell cycle, but did not yet undergo cell division. Consequently, CD105, CD146, and CD271 can be regarded as activation markers for AdSC.
CD34 internalization and downregulation in ex vivo AdSC between d4 to d6 correlated with the onset of proliferation. In support of this observation, Maumus et al. have recently demonstrated that CD34 downregulation was delayed under serum starvation conditions (2% FBS) corroborating a correlation with proliferation [20].
CD34, a Sialomucin surface glycoprotein, is reported to be expressed on hematopoietic stem cells, cancer stem cells, EC, and tumor stroma among others [31 –35]. CD34 expression on a specific lymph node EC has been shown to mediate L-selectin-dependent binding of lymphocytes [36]. Interestingly, CD34 is downregulated by activated EC upon proliferation and simultaneous upregulation of other adhesion molecules. In contrast, murine HSC upregulate CD34 upon activation [37] and human hematopoietic progenitor cells express CD34 almost until terminal differentiation regardless of their activation state [38]. This discrepancy of CD34 regulation implies that CD34 plays different roles for HSC and tissue-specific stromal cells. Accordingly, quiescent AdSC may require CD34 in vivo, but no longer upon activation in vitro when the expression of CD34 may even have inhibitory effects on MSC derivation, for example, by suppressing proliferation. Similar to myoblasts that express CD34 in the quiescent state [39], CD34 might also be a quiescence marker for progenitor cells in the adipose tissue.
Our kinetic analysis of the early culture phase allowed us to propose a model for the MSC derivation process with 3 essential stages: (i) attachment; (ii) activation; (iii) proliferation (Fig. 7). In this process, first, a minor fraction of bulk-cultured SVF cells attach as round-shaped cells with small diameters until d2 and the number of attached cells is diminishing further until d4. More AdSC and PC, but fewer EC and CD45+ lymphocytes compared to ex vivo frequencies can be detected. This initial cell loss and frequency variation represents the functional selection of cells capable to attach to tissue culture plastic. Second, also at d4, some of the remaining cells acquire a spindle-shaped morphology with increased cell diameters, and also commence to upregulate CD105, CD146, and CD271 as shown by back-gating analysis (Supplementary Fig. S10). We interpret this coincidence of morphological changes and upregulation of especially CD105 as a sign for cellular activation. Third, from d6 on, cell numbers increase substantially, since AdSC proliferate. Daughter cells downregulate CD34 and, thus, eventually exhibit the typical MSC immunophenotype.
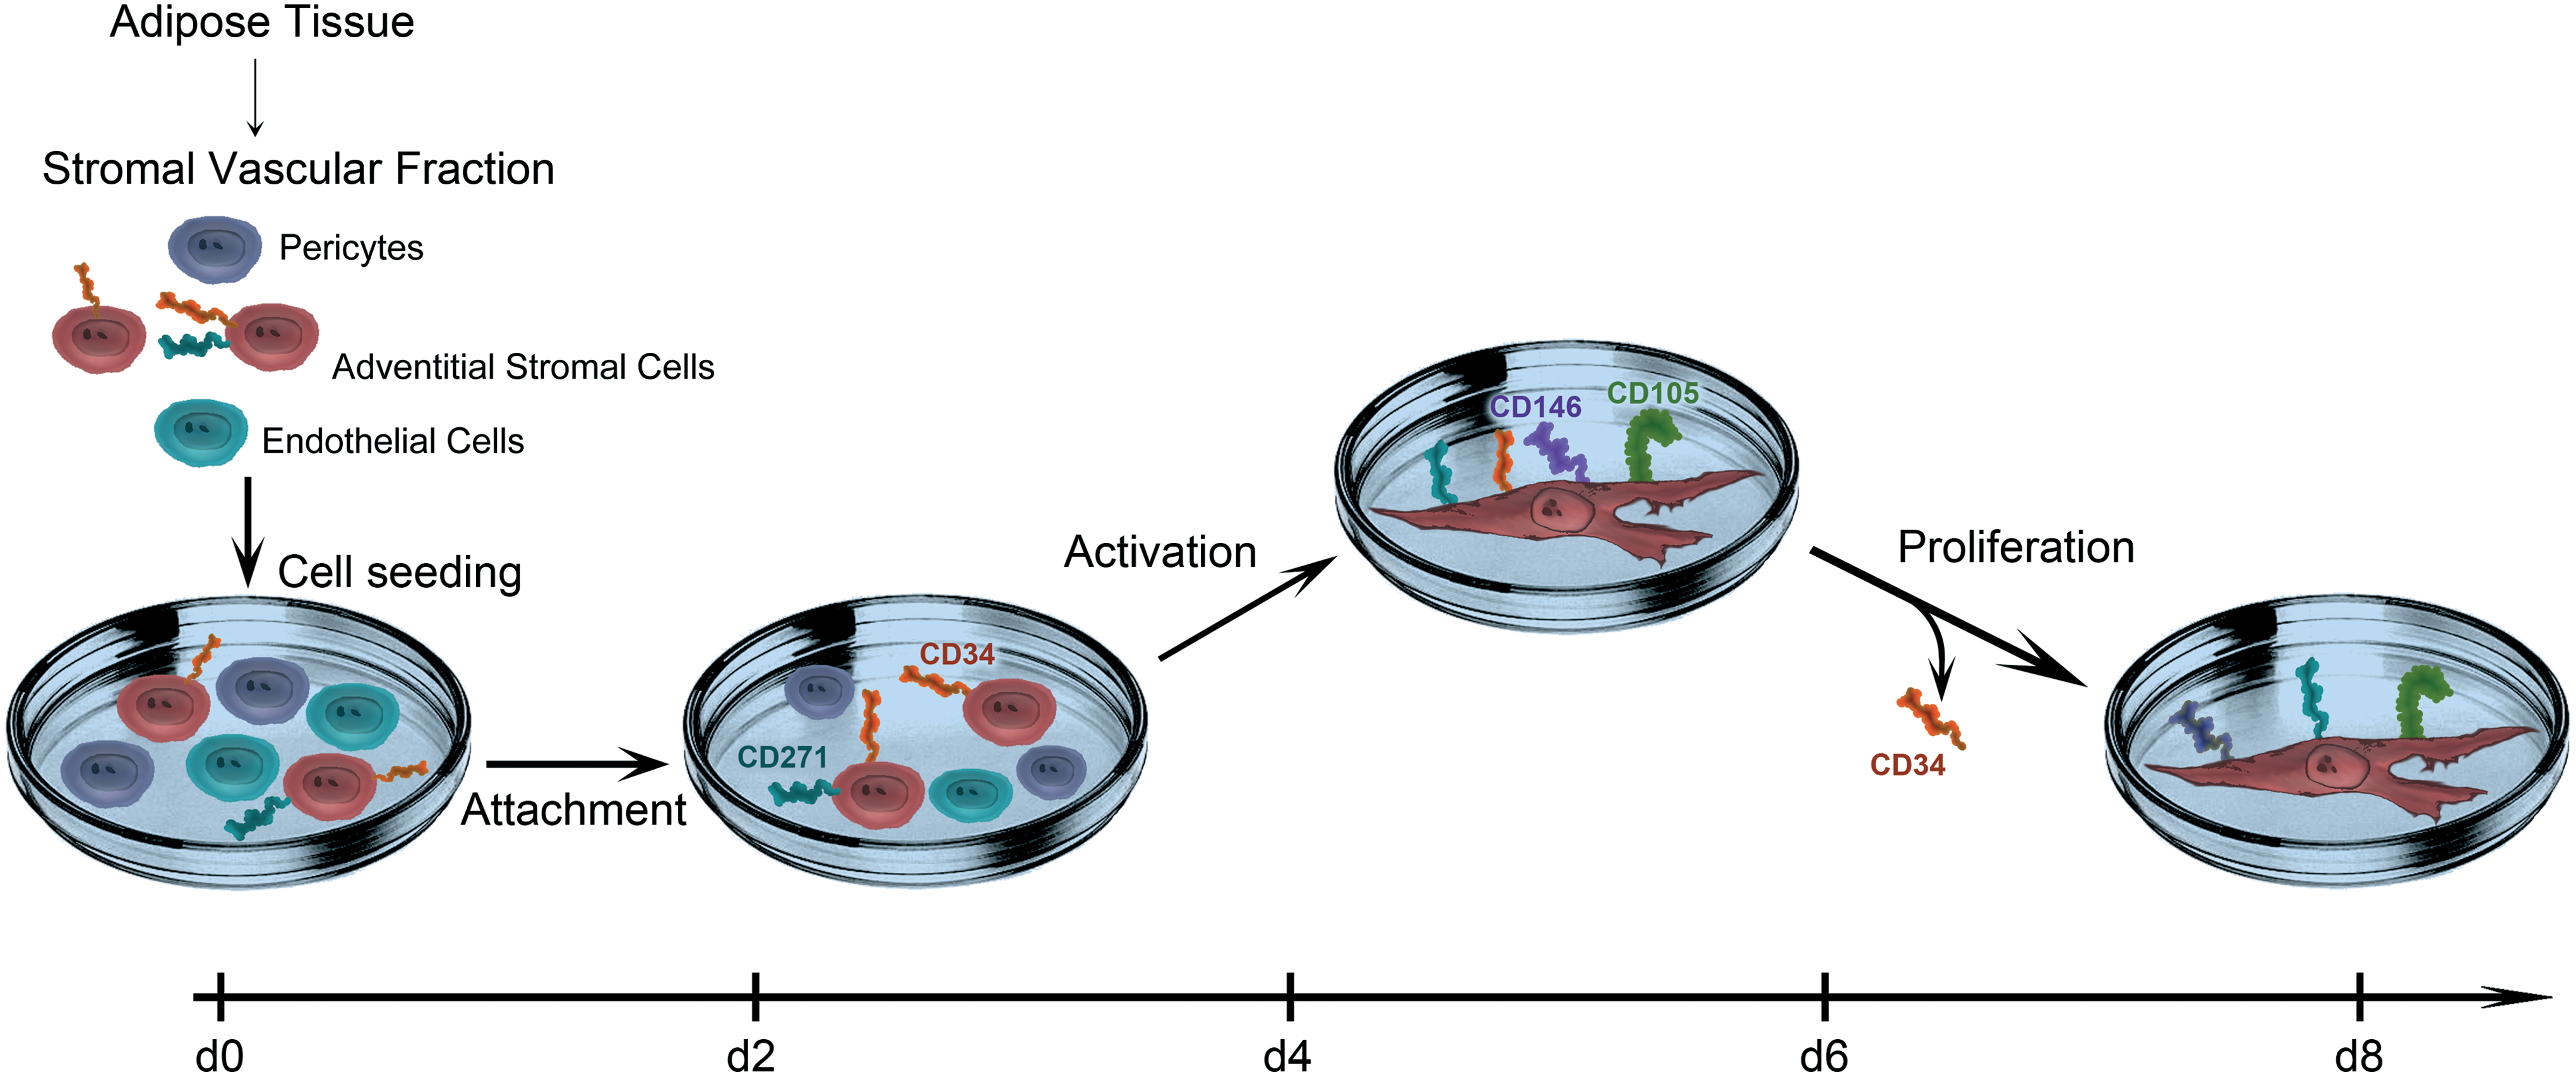
Proposed model for the MSC derivation process. The scheme displays the central events in MSC derivation process between d0 and d8 under MSC conditions. SVF cells are isolated and seeded at d0. Early attached AdSC express CD34 and, in part, CD271 (d2). Upon activation, AdSC upregulate CD105, CD146, and CD271, and adopt a fibroblastoid morphology (d4 to d6). Eventually, activated AdSC proliferate and the daughter cells lose CD34 expression (d6 to d8). Color images available online at
We identified phenotypic conversions of MSC progenitors during early culture, which are associated with activation and proliferation. In recent publications, Caplan et al. have suggested that activation is necessary for perivascular cells to become MSC and that this activation is triggered by platelet-derived growth factor (PDGF) signaling [40,41]. One could further speculate that events in the MSC derivation phase may even be necessary to acquire multipotency. This could be regarded as de-differentiation of stromal vascular cells into their mesenchymal progenitors [10]. Yet, an experimental proof of this hypothesis by assessment of MSC progenitors' multipotency using standard differentiation assays is impeded by the quick transition from quiescent MSC progenitors to activated MSC. Future work aims at developing strategies to analyze the differentiation potential of ex vivo MSC progenitors. However, CD34+ adventitial cells in the adipose tissue and vena saphena have already been reported to have progenitor cell characteristics [18,19,42] and it has also been hypothesized that these progenitors might have tissue-specific differentiation potentials [43]. Previous works have described that SVF cells show higher adipogenic differentiation efficiencies when cultured ex vivo directly under the adipogenic differentiation medium without FCS compared to passaged SVF cells cultured in the FCS-containing medium [44,45]. Together, these studies suggest that growth factors contained in FBS, such as PDGF or TGF-β, might induce activation of perivascular cells, or specifically AdSC, that subsequently might lead to de-differentiation.
Here, we provide the first detailed analyses of early culture-mediated changes in the properties of MSC progenitors, an aspect of MSC biology that was hitherto neglected. By tracing discrete subsets, we found not only that derivation of MSC from different progenitor subsets is culture-dependent, but also that AdSC are the more clonogenic MSC progenitors. Furthermore, we identified a highly reproducible sequence of phenotypic changes during the MSC derivation process that are associated with (i) attachment, (ii) activation, and (iii) proliferation. Moreover, we show that the activation- and proliferation-associated events during the MSC derivation phase are necessary for AdSC to acquire the typical MSC phenotype until d4 to d6 of culture.
Biomarkers are very useful to define specific cell types. However, previous studies observed significant differences between the expression patterns of in vitro cultured cells and their in vivo and/or ex vivo counterparts, suggesting that cells tend to be selected in vitro toward a specific phenotype that is best adapted to the respective culture condition [11,14,46]. In this regard, our results clearly demonstrate that such changes in MSC marker expression occur during the derivation phase. Thus, our findings have major implications for researchers attempting to qualify in vitro expanded MSC for therapeutical applications.
Footnotes
Acknowledgments
The project was, in part, supported by the Berlin-Brandenburg Center for Regenerative Therapies (BCRT grant to J.D. and A.T., BMBF funding) and the Berlin-Brandenburg School for Regenerative Therapies (GSC 203, DFG). The authors would like to acknowledge the assistance of the Flow Cytometry Lab at the BCRT. Special thanks to Sarah Meier, Anne Schönbrunn, Meaghan Stolk, and Annett Ullm for critical proof reading of this manuscript.
Parts of the submitted material were presented at the Keystone Symposium: “Life of a Stem Cell: From Birth to Death,” March 2012.
Author Disclosure Statement
The authors declare no competing financial interests.
References
Supplementary Material
Please find the following supplemental material available below.
For Open Access articles published under a Creative Commons License, all supplemental material carries the same license as the article it is associated with.
For non-Open Access articles published, all supplemental material carries a non-exclusive license, and permission requests for re-use of supplemental material or any part of supplemental material shall be sent directly to the copyright owner as specified in the copyright notice associated with the article.