
Abstract
Here, we describe a focused microarray for screening rat embryonic stem cells (ESCs) and provide validation data that this array can distinguish undifferentiated rat ESCs from rat trophoblast stem (TS) cells, rat extraembryonic endoderm cells, mouse embryonic fibroblast feeder cells, and differentiated rat ESCs. Using this tool, genuine rat ESC lines, which have been expanded in a conventional rat ESC medium containing two inhibitors (2i), for example, glycogen synthase kinase 3 (GSK3) and mitogen-activated protein kinase (MEK) inhibitors, and leukemia inhibitory factor, and genuine rat ESCs, which have been expanded in rat ESC medium containing four inhibitors (4i), for example, GSK3, MEK, Alk5, and Rho-associated kinase inhibitors were compared; as were genuine rat ESCs from 4 different strains of rats. Expression of Cdx2, a gene associated with trophoblast determination, was observed in genuine, undifferentiated rat ESCs from 4 strains and from both 2i and 4i ESC derivation medium. This finding is in contrast to undifferentiated mouse ESCs that do not express Cdx2. The rat ESC focused microarray described in this report has utility for rapid screening of rat ESCs. This tool will enable optimization of culture conditions in the future.
Introduction
T
Here, our goal was to develop and validate a rat-specific microarray focused on detection of pluripotency, stem cell and differentiation-associated gene expression for rapidly screening rat ESC lines, and enable the optimization of rat ESC culture. To derive this array, we culled the literature to generate a short list of genes that would discriminate undifferentiated and differentiated ESCs [11,12], and ESCs from extraembryonic endoderm cells (XEN, [13 –15]), epiblast stem cells (Epi, [16 –18]), and from trophoblast stem (TS) cells [19,20]. The gene list was provided to Qiagen and they manufactured the gene array. Next, we used this array to compare the gene expression of genuine rat ESCs produced in our laboratory [6] and from the laboratory of QY [4] using 2i medium and genuine ESCs produced using media containing four inhibitors (4i, the Rho-associated kinase inhibitor Y-27632; the MEK inhibitor PD0325901; the type 1 TGFβ receptor inhibitor A-83-01; and the GSK inhibitor CHIR99021, called 4i below [10]. The 4i genuine rat ESCs were provided by the laboratory of MK and TO. The data show that the array has sensitive quality assurance and quality control elements, good inter-investigator reliability, and good reproducibility between different genuine rat ESC lines. These data confirm that genuine rat ESCs express Cdx2 since genuine rat ESCs from 3 different labs express the gene with rat ESCs expanded in YPAC medium expressing Cdx2 at the highest levels. In conclusion, this array discriminates undifferentiated rat ESCs from differentiated rat ESCs and discriminate ESCs from extraembryonic endoderm stem cells (XEN) and TS cells, as well as, other stem cells derived from the developing rat embryo. Therefore, this array is a sensitive, validated tool for rapidly screening rat ESCs lines and for optimizing rat ESC culture conditions.
Materials and Methods
Cell lines
Information about samples and sample processing is listed in Table 1. Rat ESC lines used here were derived from Dark Agouti (DA) and transgenic Fischer 344 (F344) rats. ESC derivation, ESC differentiation to embryoid bodies (EBs), and characterization of our DA and F344 ESCs was described previously [6]. In addition, 2i plus LIF genuine rat ESC pellets derived from DA rats were provided by Dr. Q. Ying (University of Southern California, Los Angeles, CA) [4]. Genuine rat ESC pellets derived from Long Evans Agouti and Wistar rats using the 4i medium were provided by Drs. M. Kawamata and T. Ochiya (National Cancer Center Research Institute, Tokyo, Japan) [10]. Rat TS and extraembryonic endoderm stem cells (XEN) were prepared as previously described and were provided by Drs. M. Rumi and M. Soares [19,21]. Mitotically inactivated CF-1 MEFs (passage 3) were obtained and used following the manufacturer's protocol (Globalstem).
Reverse transcriptase–polymerase chain reaction focused array
The gene list and efficiency data and sample processing is listed in Table 1. The 96-well custom array containing 92 unique elements for evaluation of rat ESCs was manufactured by Qiagen (CAPR10083). We did not independently validate the manufacturer's PCR efficiency assays for each gene. Total RNA was prepared using the RNeasy RNA isolation kit (Qiagen) or TRIZOL (Life Technologies) using the manufacturer's protocol. Complementary DNA was synthesized using Qiagen's RT2 first strand kit following the manufacturer's protocol. The focused array was run using Qiagen's RT2 qPCR MasterMix for the BioRad iQ5 thermal cycler. Thermal cycling and quantitation were performed using a BioRad iQ5 iCycler controlled by Biorad iCycler IQ software version 3.1.7050. Following PCR, the products were subjected to melting point analysis. All biological samples were run in duplicate (technical replicates) independently prepared by different investigators (JH or HH). The array data were uploaded to the gene expression omnibus (GEO) website (
Reverse transcriptase–polymerase chain reaction to test for rat genomic DNA contamination
Total RNA samples used in the array were tested for rat genomic DNA contamination (RGDC). Complementary DNA was synthesized using Superscript III First-Strand Synthesis Supermix kit (Life Technologies) primed with oligo-dT12–18 per the manufacturer's protocol. A primer set for rat PBGD was designed that spanned an intron and was validated to discriminate genomic DNA (primer sequence available upon request). PCR was performed using a BioRad iCycler or iQ5: the initial denaturation at 95°C for 3 min, 30 cycles of (94°C for 30 s, 53°C–55°C for 30 s, and 72°C for 1 min), and the final extension at 72°C for 10 min. Following PCR, the products were resolved on a 1% agarose gel with 100 bp DNA ladder (Promega) and imaged.
Data analysis and assembly of figures
No calls or missing data were assigned Ct value of 40.0. Data were loaded into Microsoft Excel 2010 for analysis (raw and transformed data are in Supplementary Table S1; Supplementary Data are available online at
Results
QA and QC
SABioscience/Qiagen RT2 profiler array has 7 wells dedicated to QA and QC.
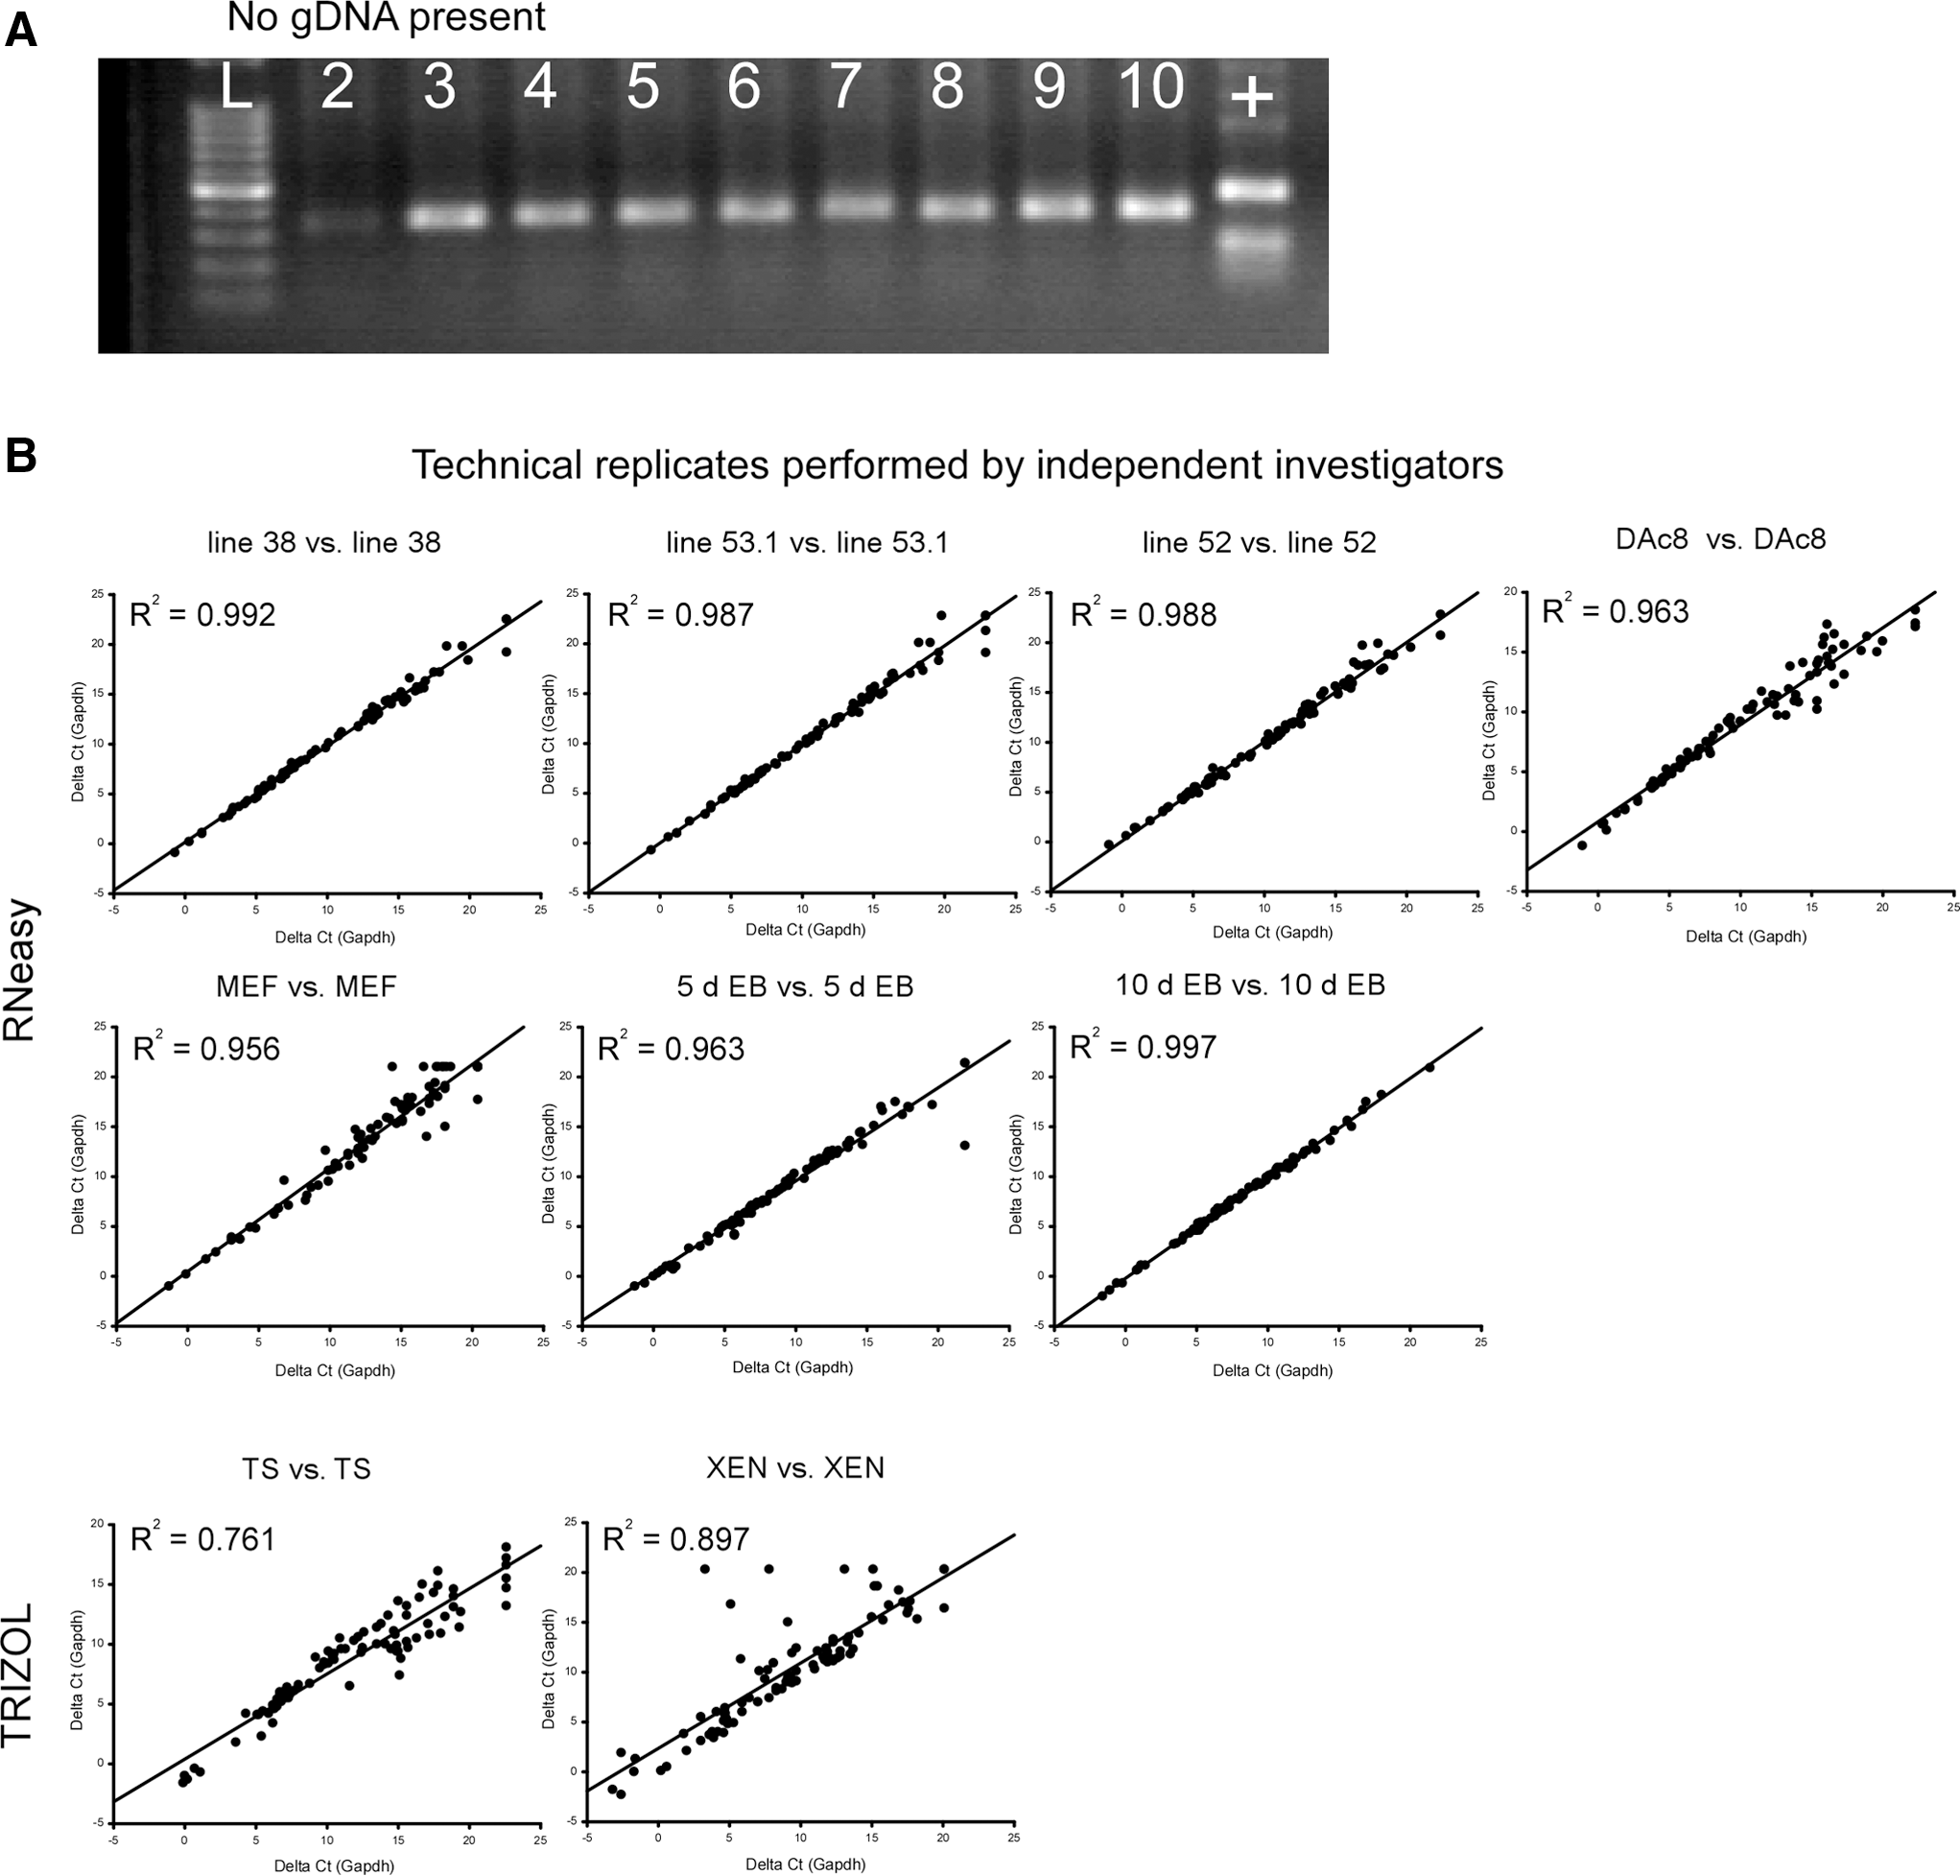
(1) RGDC QA/QC step. RGDC is a concern since it can affect the interpretation of array findings. To obviate this potential problem, we used DNaseH treatment during isolation of total RNA in some samples. For every sample, SuperArray's RT2 First Strand Kit (Qiagen) was used with its genomic DNA elimination step. RGDC was evaluated by calculating Ct of the RGDC–Ct HKG. RGDC was considered questionable if the difference was <14. Using this criterion, 2 samples [one replicate of Ying ESCs (DAc8) and one replicate of TS cells] had questionable results as to RGDC. To investigate those cases, RGDC was evaluated using reverse transcriptase–polymerase chain reaction (RT-PCR) using a primer set that spans an intron and the amplicon run on a 1% agarose gel along with a rat genomic DNA positive control. As shown in Fig. 1A, RGDC was not confirmed by RT-PCR. The fact that the technical replicate did not flag RGDC and that the RT-PCR did not confirm RGDC in these 2 cases suggest that the RGDC test reported a false positive 2 times in 26 arrays (about 8% error rate).
(2) Reverse transcriptase efficiency (RTE) QC step. RTE can be impacted by poor RNA quality or contaminants in the sample. RTE was evaluated by calculating average Ct of the reverse transcriptase control (RTC)–average Ct of the positive PCR control (PPC) from the triplicate wells on the array. The manufacturer's specification was that the difference should be <5. All samples passed (average 3.9±0.42, range=3.3–4.5).
(3) PCR amplification efficiency QC step. PCR efficiency should be consistent across arrays to reduce the need of making many technical replicates to achieve consistent, reproducible data. PCR efficiency was evaluated by calculating the average Ct of the triplicate PPC wells in the array. The manufacturer's specifications state that the PPC Ct values should be an average of 20±2 cycles across in an experiment. We observed an average of 19.5±0.2, meeting the PCR efficiency specification. In addition, the manufacturer has designed the PCR primers and tested their efficiency. The average efficiency of the primers in this array was 108.4%±10.1% (range 90.5%–146.8%). Primer efficiency information provided by Qiagen is found in Table 1.
(4) Production of a single PCR product QA/QC step. Following amplification, the products were subjected to a melting point analysis to confirm that a single product was produced. Based upon the melting point analysis, PCR produced a single product in every case (data not shown).
Selection of the HKG and evaluation of technical replicates
To select the HKG, the standard deviation of Ct values for each gene in the array was sorted from lowest to highest (see Supplementary Table S1). Of the experimental genes, Actb, Ctnnbl1, Ldha, Hdac2, and Gapdh had the lowest standard deviations (0.72, 0.73, 0.78, 0.82, and 1.06, respectively). Next, we compared the effect of normalization on the regression R2 values between 9 biologically independent pairs of technical replicates and compared the R2 of raw Ct values and the R2 after normalization with Ldha and Gapdh. There was no significant difference between the R2 values of technical replicates not normalized and those normalized using Ldha or Gapdh (no normalization R2=0.940±0.083, range=0.735–0.997; Gapdh normalized R2=0.945±0.074, range 0.761–0.994; and Ldha normalized R2=0.945±0.074, range 0.761–0.994). Using the tools found at the Cotton EST database (see Methods section), Gapdh and Ldha were selected as the HKG. The geometric mean of Gapdh and Ldha was used as HKG for normalization (see Supplementary Table S1).
As shown in Fig. 1B, based upon the R2 values cited above, the technical replicates performed by different investigators showed good reproducibility across 9 biological samples evaluated. We observed that total RNA sample preparation using the RNeasy column method tended to produce tighter reproducibility than the TRIZOL method (TS and XEN samples were prepared using the TRIZOL method).
The array can discriminate undifferentiated rat ESCs from differentiated ESCs, XEN, TS, and MEFs
As shown on the top of Fig. 2, when overall gene expression of 3 genuine undifferentiated rat ESC samples expanded in 2i plus LIF from the Weiss lab (lines 52 and 53.1 from DA rats and line 38 derived from transgenic F344 rats) were compared with undifferentiated genuine rat ESCs expanded in 2i plus LIF from QY's lab (derived from DA rats, line DAc8), there was good coherence in terms of gene expression as indicated by R2 values >0.91. There was a tendency for higher correlations between undifferentiated DA (DAc8) versus DA ESC lines 53.1 and 52 (Fig. 2, top panel middle and right) when compared with DA versus F344 line 38 (Fig. 2, top panel left).

Comparison of biological samples using scattergram and regression line with the R2 value. Top panel: Rat ESC lines derived in-house (DA ESC lines 53.1 and 52 and transgenic Fischer 344 ESC line 38) compared with QY's genuine rat ESCs (DAc8). Statistically, there are no significant differences between overall gene expression patterns of the ESC lines. There was a trend for genuine DAc8 versus DA lines 53.1 and 52 to have higher coherence (R2 values>0.949) than genuine DAc8 versus F344 line 38 (R2 value=0.914). Center panel: (left and middle graphs) Comparison of the undifferentiated parental DA ESC cell line (line 54.1) with the 5 day and 10 day differentiated EBs derived from line 54.1. (Right graph) Comparison of 5 day and 10 day differentiated EBs. Note that statistical testing revealed that the undifferentiated DA line 1 (line 54.1) was significantly different from the same ESC line after 10 day EB formation (middle graph) and that gene expression by 5 day EBs was significantly different from 10 day EBs (right graph). Bottom panel: Comparison of DAc8 genuine rat ESCs to cells from the XEN, left graph; TS cells, middle graph; and inactivated MEFs, right graph]. By inspection, one can observe differences in gene expression between ESCs and non-ESC cell lines based upon y-intercept (expected to be zero in similar lines), scatter about the regression line and R2 values<0.5.
To statistically evaluate the samples, a Kruskal–Wallis One-Way Analysis on Ranks was used, which indicated overall significant differences between the 8 biological samples. Next, Student-Newman–Keuls method was used for planned multiple comparisons, and no significant differences were found between the 4 independently derived 2i plus LIF genuine rat ESC samples. In contrast, multiple comparisons revealed a significant difference between the undifferentiated ESC line and the same cells after 10 days of differentiation to EBs, which is supported by the observation of poor correlation between undifferentiated and differentiated samples (Fig. 2, middle panel). As shown in Fig. 2 bottom panel, the overall gene expression patterns shown in the scattergrams for undifferentiated ESCs poorly correlated with rat XEN, rat TS, and inactivated MEFs, too. These suggest differences in gene expression between undifferentiated ESCs and the other cell types.
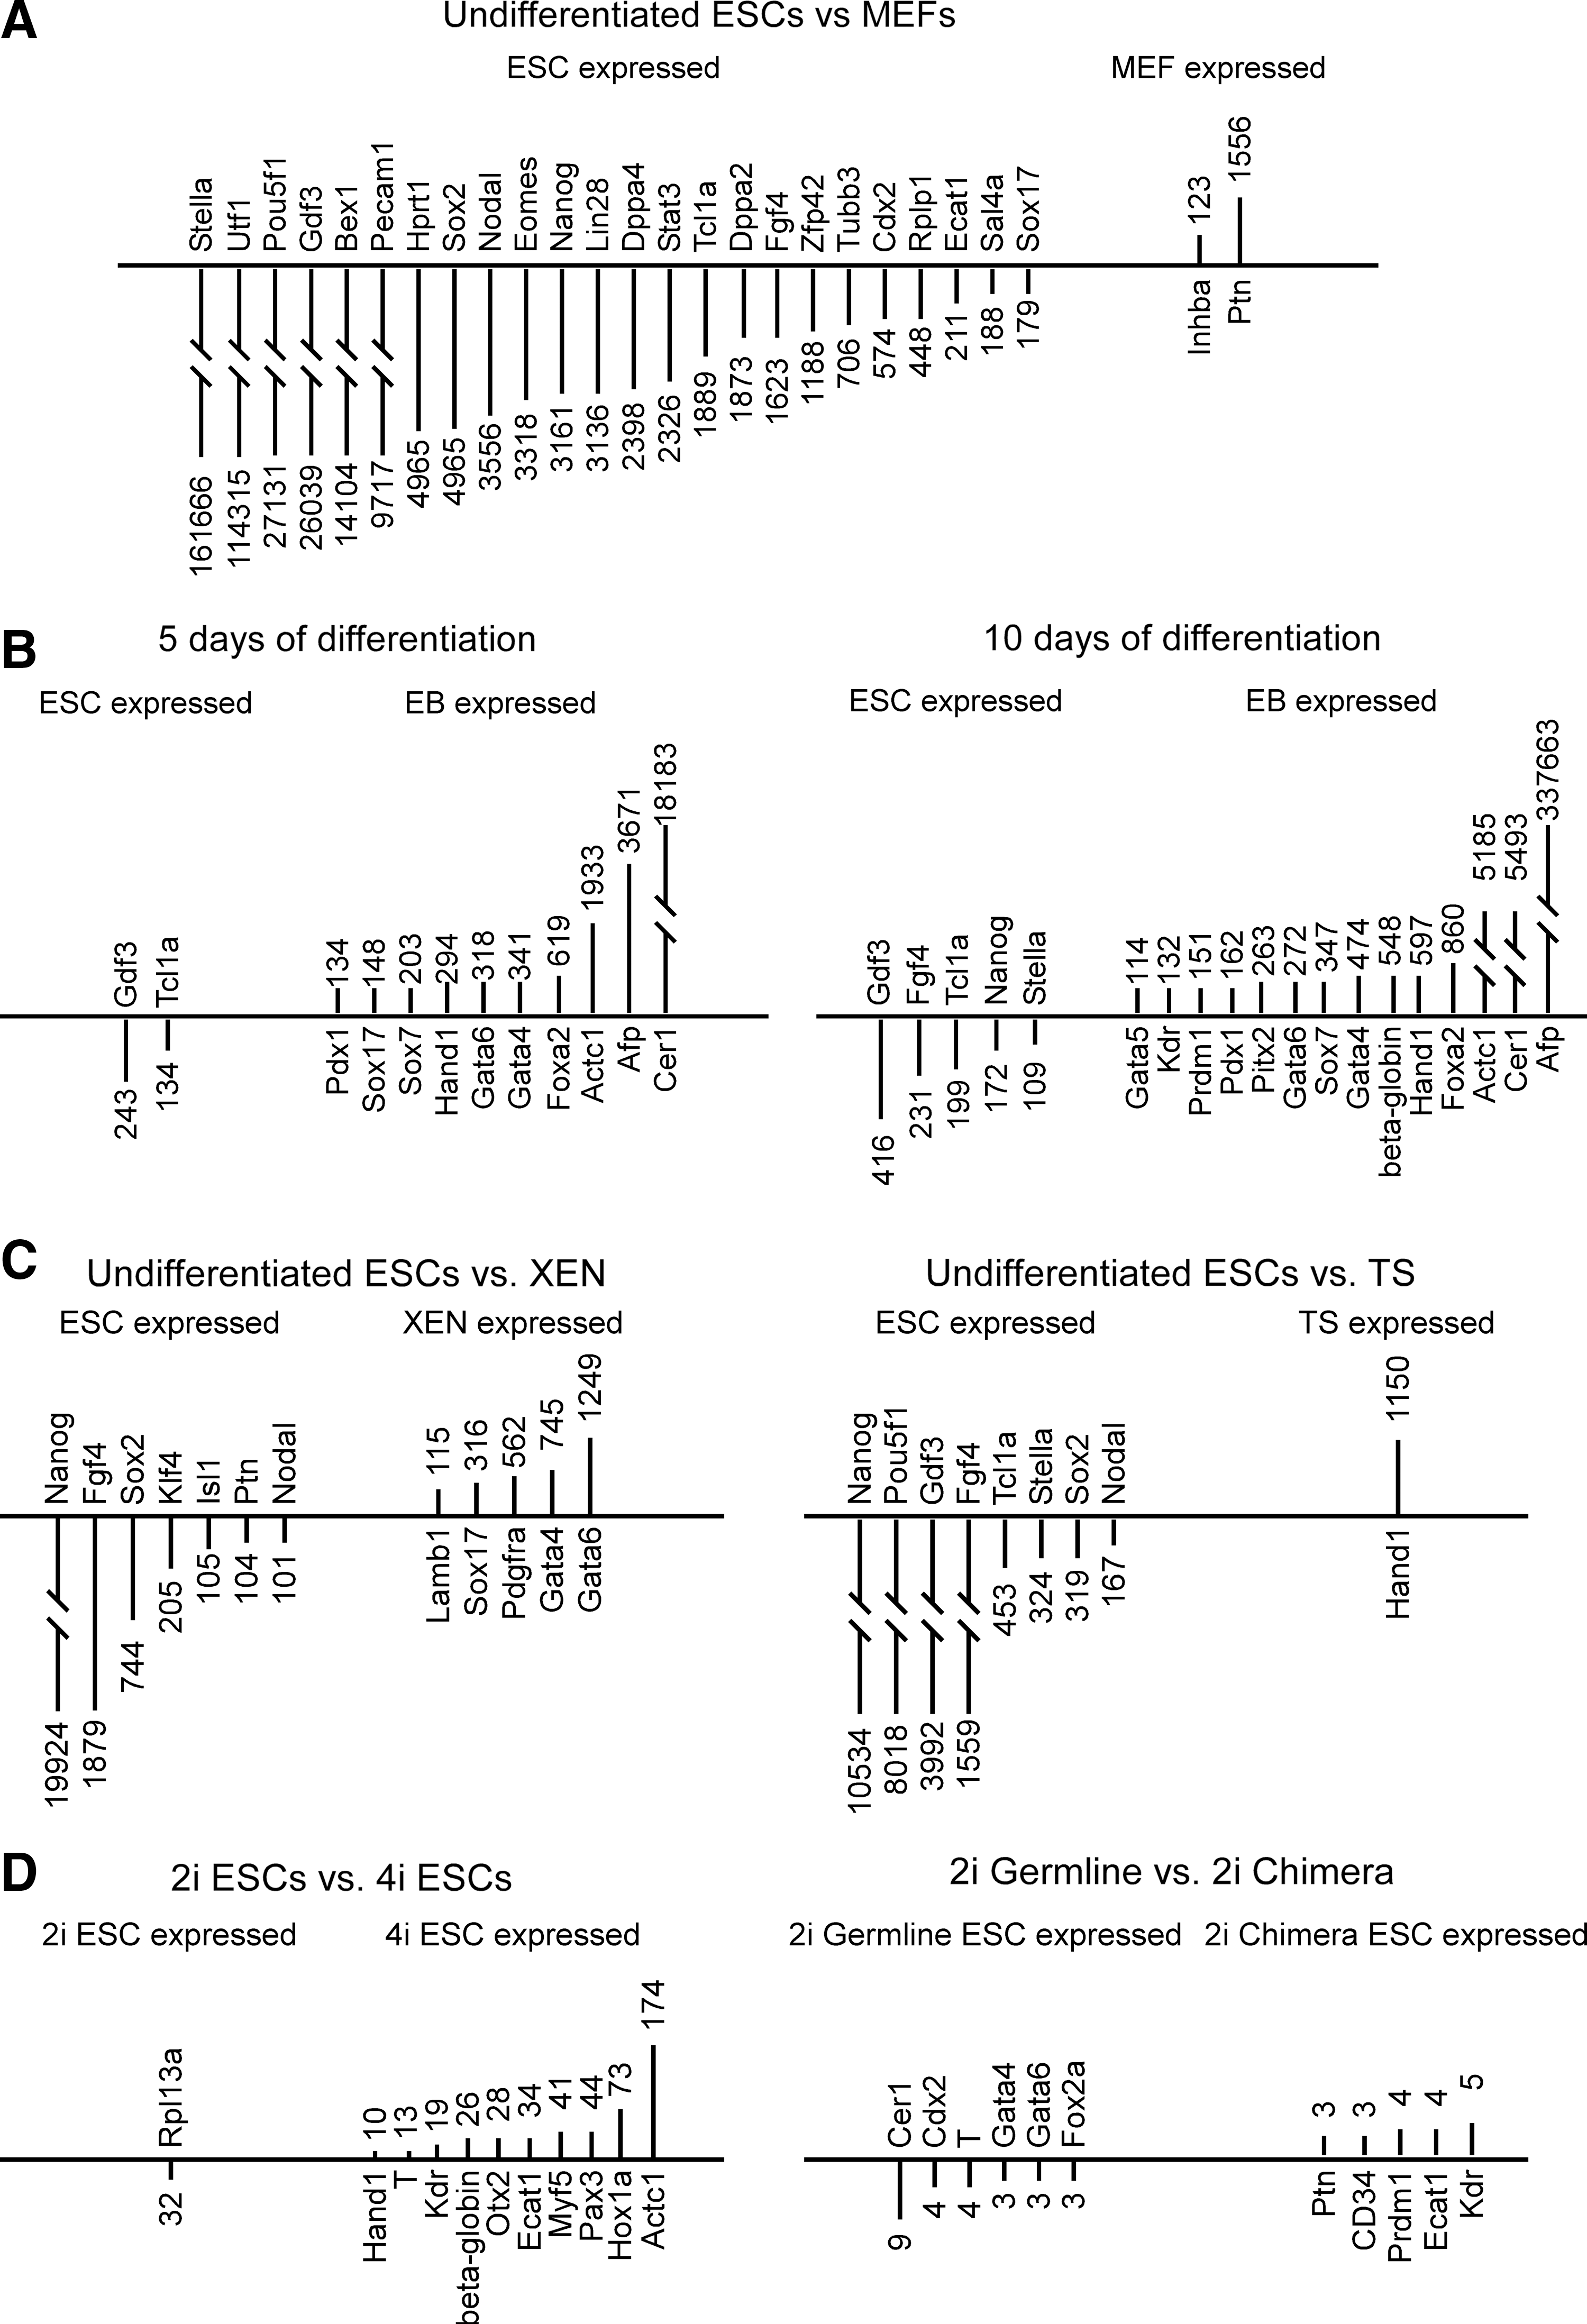
To evaluate differences in gene expression between cell types, 10-fold and 100-fold differences in expression were selected as arbitrary thresholds. When inactivated MEFs were compared with undifferentiated ESCs (both those derived in 2i plus LIF and those derived in 4i), 47 genes were expressed at>10-fold higher levels in undifferentiated ESCs and 8 genes were found to be expressed at>10-fold higher levels in MEFs (see Supplementary Table S2). Further, 24 genes were expressed at>100-fold higher levels in undifferentiated ESCs and 2 genes were expressed at>100-fold higher levels in MEFs (see Fig. 3A). Notably, genes Stella, Utf1, Pou5f1 (Oct4), Gdf3,Bex1, and Pecam1 were expressed at very high levels in ESCs, about 161666–9717-fold higher levels and the genes Ptn and Inhba were expressed 1556-123-fold higher levels in MEFs (see Fig. 3A).
Differences in gene expression detected by the array.
Comparison of undifferentiated ESCs with differentiated ESCs
When gene expression of undifferentiated ESCs was compared with gene expression after 5 days differentiation to EBs, 33 genes had greater than 10-fold expression differences between the 2 groups, and 10 genes were expressed higher in undifferentiated ESCs and 23 genes were expressed>10-fold higher levels in EBs after 5 days of differentiation (see Supplementary Table S3). Twelve genes showed>100-fold differences in gene expression between undifferentiated ESCs and EBs after 5 days of differentiation. As shown in Fig. 3B (left), genes Gdf3 and Tcl1a were expressed at>100-fold higher levels in undifferentiated ESCs (range 243- to 134-fold higher) and the genes Cer1, Afp, Actc1, Foxa2, Gata4, Gata6, Hand1, Sox7, Sox17, and Pdx1 were expressed>100-fold higher levels in the 5 day differentiated ESCs (range of 18183- to134-fold higher). When gene expression of undifferentiated ESCs was compared with gene expression after 10 day differentiation to EBs, 45 genes had>10-fold expression differences between groups (see Supplementary Table S3). Ten genes were expressed at>10-fold higher levels in undifferentiated ESCs and 35 genes were expressed at>10-fold higher levels in EB differentiated for 10 days. Figure 3B (right) shows the 19 genes that had>100-fold expression difference between these groups. Note that the genes Gdf3, Fgf4, Tcl1a, Nanog, and Stella were expressed>100-fold in undifferentiated ESCs (range of 416–109-fold higher) and the genes Afp, Cer1, Actc1, Foxa2, Hand1, beta-globin, Gata4, Sox7, Gata6, Pitx2, Pdx1, Prdm1, Kdr, and Gata5 were expressed at>100-fold higher levels in EBs after 10 days of differentiation (range 337663- to 114-fold higher). Thus, as ESCs undergo differentiation over time, more lineage specification and lineage specific genes are expressed in EBs, as one would expect.
Comparison of undifferentiated ESCs with XEN cells
As one might expect from inspection of Fig. 2 (bottom), 34 genes showed>10-fold expression differences between undifferentiated rat ESCs and XEN cells, and 18 genes were expressed>10-fold higher in undifferentiated ESCs and 24 genes were expressed at>10-fold higher levels in XEN cells (see Supplementary Table S4). As shown in Fig. 3C (left), genes Nanog, Fgf4, Sox2, Klf4,Isl1, Ptn, and Nodal showed>100-fold higher expression in undifferentiated ESCs (range of 19924- to 101-fold higher). In contrast, the genes Gata6, Gata4, Pdgfra, Sox17, and Lamb1 were expressed at 100-fold higher levels in XEN cells (range 1249- to 115 times higher expression).
Comparison of undifferentiated ESCs with TS cells
Twenty-four genes showed>10-fold expression difference between undifferentiated rat ESCs and TS cells. Of these 24 genes, 16 genes were expressed>10-fold higher in undifferentiated ESCs and 8 genes showed>10-fold higher expression in XEN (see Supplementary Table S5). As shown in Fig. 3C (right), Nanog, Pou5f1 (Oct4), Gdf3, Fgf4, Tcl1a, Stella, Sox2, and Nodal were expressed at>100-fold higher levels in undifferentiated rat ESCs (ranging from 10534 to 167 times higher expression); Hand1 was expressed at>100-fold higher levels in TS cells (1150 times higher expression).
Comparison of 2i plus LIF with 4i derivation methods
When germline ESCs derived in 2i plus LIF were compared with germline ESCs derived in 4i, 12 genes were found to exceed the>10-fold difference in expression threshold, and only one gene was found to have>100-fold difference in expression (see Supplementary Table S6). As shown in Fig. 3D (left), the gene Rpl13a was expressed 32-fold higher levels in 2i plus LIF germline ESCs and the genes Actc1, Hox1a, Pax3, Myf5, Ecat1, Otx2, beta-globin, Kdr, T, and Hand1 were expressed at higher levels in 4i ESCs (range of 174- to 10-fold higher, respectively).
Comparison of germline to chimera ESCs
When germline ESC derived in 2i plus LIF were compared with ESCs derived in 2i plus LIF that only formed chimera, no genes were found to meet the criteria levels of>10-fold difference in gene expression (see Supplementary Table S7). As shown in Fig. 3D (right), in germline 2i plus LIF ESCs, the gene Cer1 was found to be expressed at 9-fold higher level. In chimera ESCs, Kdr was found to be expressed at 5-fold higher levels.
Gene expression of selected genes
As shown in Fig. 4, when the fold expression was calculated and normalized using Ldha and Gapdh as HKG and MEFs as the control cell using the 2−ΔΔCt method, undifferentiated rats ESCs expressed the transcription factors Gdf3, Nanog, Pou5f1 (Oct4), and Sox2 at relatively high levels and these clearly distinguish undifferentiated ESCs from the other groups. As we reported [6], Cdx2 is expressed by undifferentiated rat ESCs (see Fig. 4, bottom left). Here, we noted that genuine rat ESCs expanded in 2i plus LIF express Cdx2 at a lower level than TS cells. In contrast, genuine rat ESCs expanded in 4i medium (YPAC) express Cdx2 at >3-fold higher level than rat ESCs expanded in 2i plus LIF and at a higher level than rat TS cells. Thus, a tremendous variability in Cdx2 expression was observed in genuine rat ESCs. It is also noted that differentiation of rat ESCs that were grown in 2i plus LIF conditions to EBs resulted in an increase of Cdx2 expression. This might suggest that rat ESCs may easily differentiate along the extraembryonic lineage. This notion is supported by the induction of Hand1, Eomes and, Fgfr2 by EB formation (Eomes and Ffg42 shown in Fig. 4).
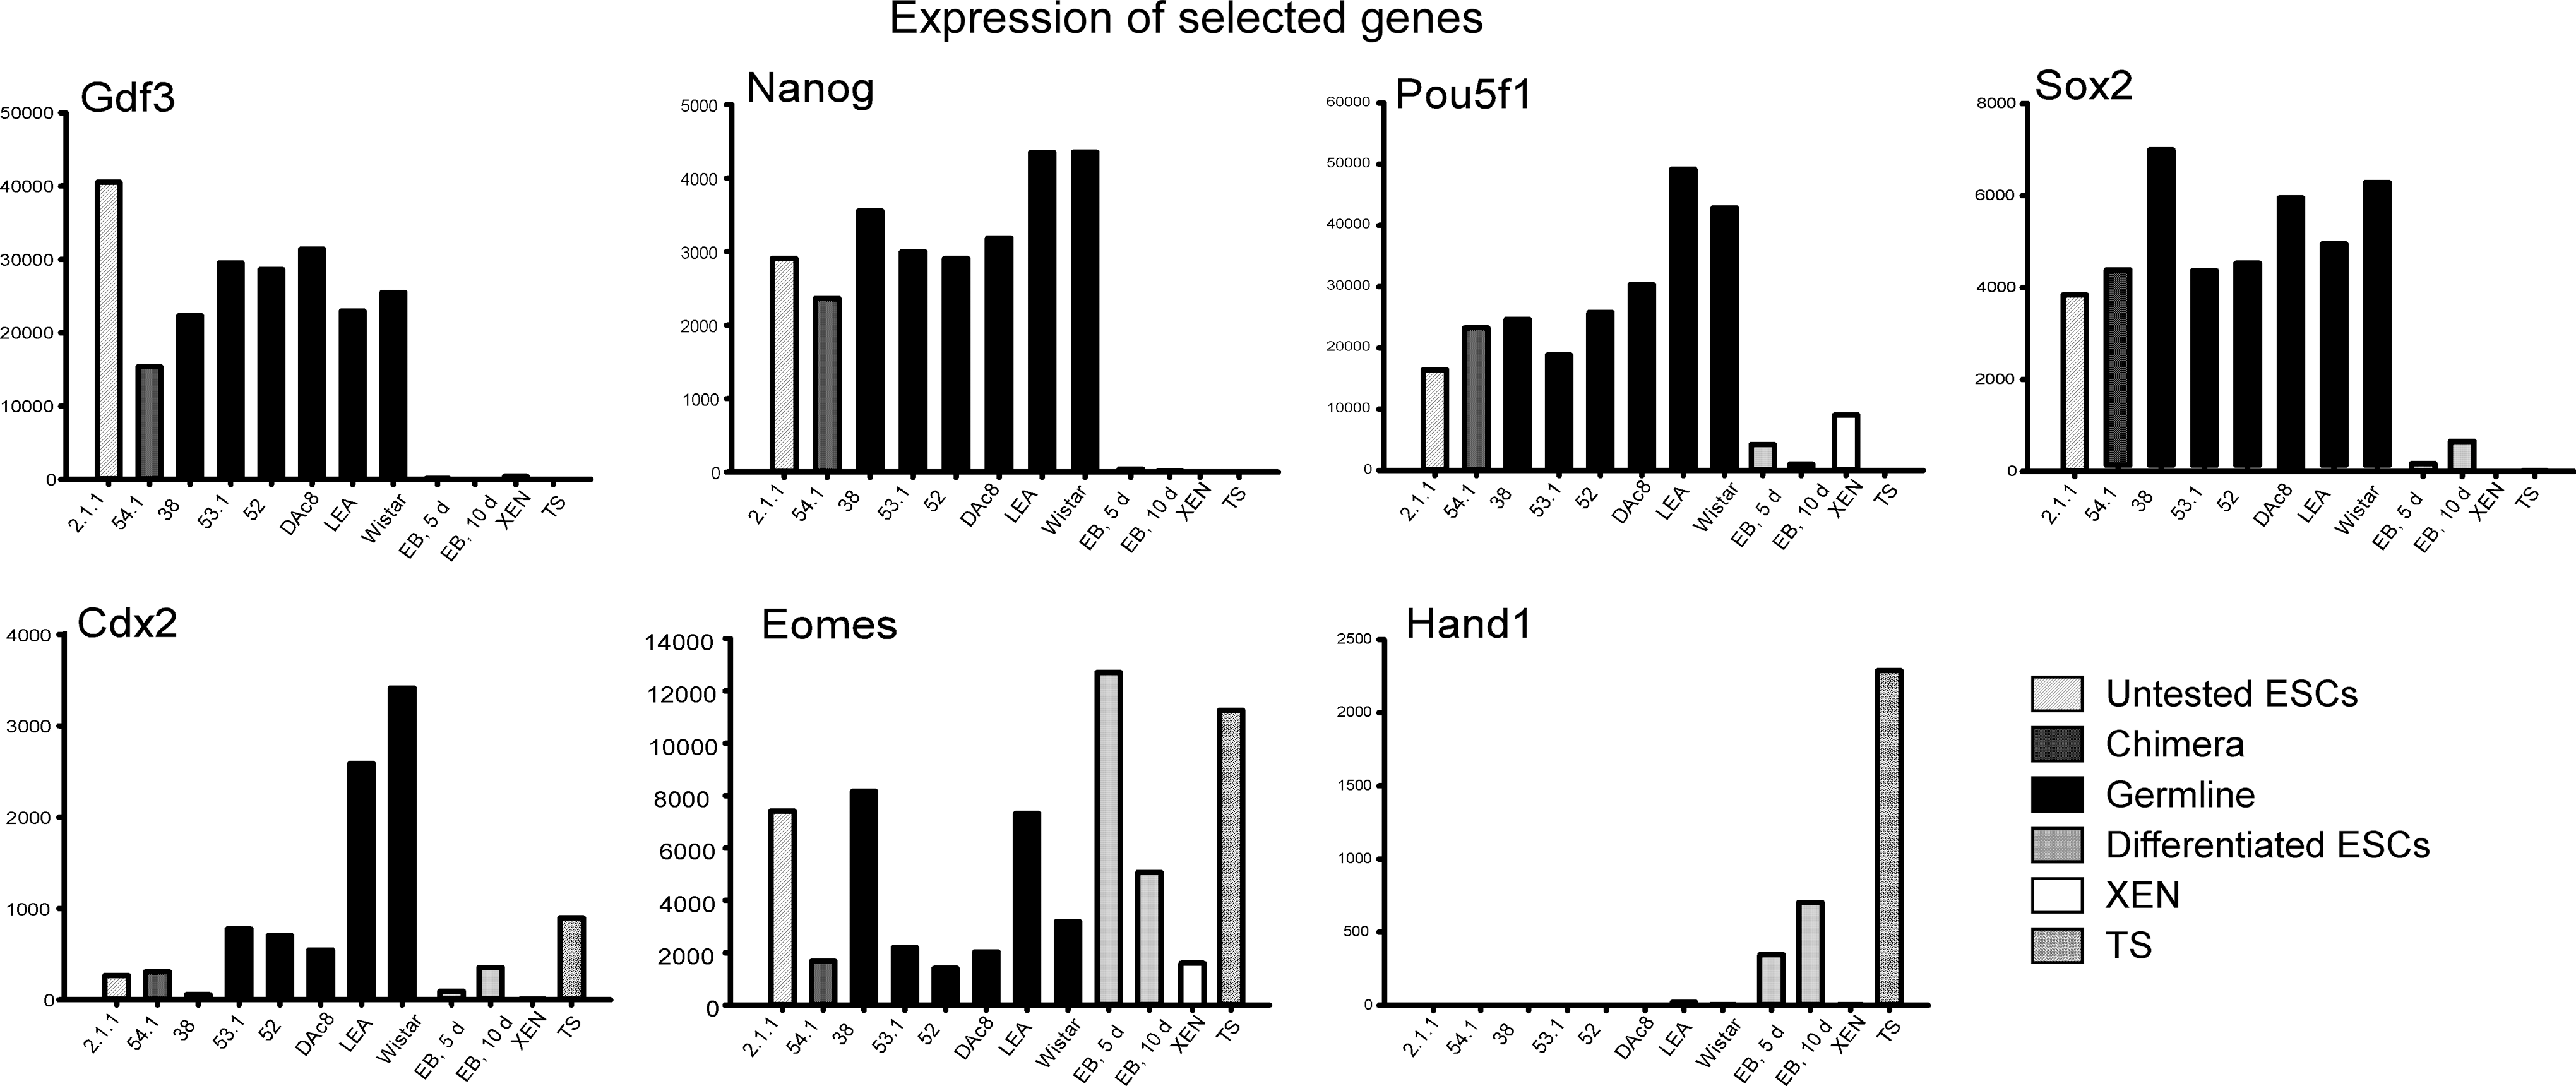
Normalized expression of 7 genes by biological samples. Genes were selected based upon their ability to differentiate between the cell types, for example, undifferentiated rat ESCs, differentiated ESCs and XEN, and TS cells. Note that undifferentiated ESCs expressed the transcription factors Gdf3, Nanog, Oct4 (Pou5f1), and Sox2 at 1000-fold higher levels than differentiated ESCs or the XEN or TS cells. Note that the expression of these genes was decreased by differentiation of rat ESCs to EBs. Note that rat ESCs expressed markers of the trophoblast lineage, Cdx2 and Eomes, suggesting that rat ESCs may have a capacity to differentiate along this lineage. In support of this notion, differentiation of rat ESCs induces the expression of Hand1. Note that ESC derived from DA rats (lines 54.1, 53.1, 52, and DAc8), lines derived from F344 rats (line 2.1.1 and 38), and lines derived from Long Evans Agouti and Wistar (LEA and WIS), express the transcription factors Gdf3, Nanog, Oct4 (Pou5f1), and Sox2 at similar levels, and they express Cdx2, too. Note that all genuine ESCs: those ESCs derived and maintained in 2i plus LIF and ESCs derived and maintained in 4i conditions, express Cdx2; and that ESCs derived in 4i conditions express Cdx2 at 3–4-fold higher levels than that ESCs derived in 2i plus LIF conditions.
The rat ESC array list
Prior to normalization of the gene array data, PPC and RTC had the lowest variation followed by experimental genes Gapdh, Ldha, Hdac2, Ctnnbl1, and Actb (see Table 2). As presented above, these genes were evaluated as potential HKG using the Cotton EST database Ref-Finder tools and Gapdh and Ldha were selected. As shown in the bottom of Table 2, following normalization using HKG and averaging of the technical replicates, the variation of Gapdh and Ldha was<PPC and RTC, as expected. It is interesting to note that after normalization, the variation of Hdac2, Ctnnbl1,and Actb was<PPC and RTC, too (see Supplementary Table S1). This suggests that these 5 genes cluster.
Qiagen catalog number: CAPR10083, Plate format: 96×1, Real-time instrument: iQ5.
The genes Ctnnbl1, Pias1, Hdac2, Myod1, Neurod1, and Sox18 were found to be good candidates for replacement since they did not discriminate cell types. In contrast, the genes Nanog, Afp, Gdf3, Stella, Oct4, Utf1, Fgf4, and Cer1 were able to differentiate cell lines and conditions (see Supplementary Table S1 and Fig. 4).
Discussion
The ability to rapidly analyze gene expression in rat ESC lines using a focused gene array will facilitate the optimization of medium conditions, the characterization of new ESC lines, and confirm that the ESC lines maintain their undifferentiated state. Here, we describe such an array and evaluated its utility to discriminate undifferentiated rat ESC lines from differentiated ESCs (e.g., ESCs differentiated to EB for 5 or 10 days), from other cells derived from rat embryos such as TS cells and XEN cells, and from MEFs. This array had good inter-operator reproducibility (shown in Fig. 1) and has good QC/QA tools. This focused array produced rapid and reproducible results in a convenient, inexpensive format. Thus, this array will have broad application for laboratories wishing to characterize or optimize rat ESC culture.
When overall gene expression was analyzed, the gene array could discriminate undifferentiated genuine rat ESCs grown from TS, XEN, or MEFs. When overall gene expression was analyzed, the array discriminated undifferentiated rat ESCs grown in 2i plus LIF from rat ESCs that were differentiated for 10 days to EBs. When the expression of individual genes that are highly expressed by undifferentiated ESCs or genes highly expressed during the first 5 to 10 days of differentiation are explored, the array resolved undifferentiated ESCs from EBs differentiated for 5 or 10 days.
The biology of rat ESCs
Currently, the biological differences between mouse, human, and rat ESCs are not well understood. For example, as shown in Fig. 4, undifferentiated, genuine rat ESCs derived in 2i plus LIF and those derived in 4i medium express Cdx2 and other genes of the trophoblast lineage such as Hand1 and Eomes [7,8,19]. Previously, Cdx2 protein expression in rat ESCs was demonstrated by immunocytochemistry, so it is unlikely this is a false positive [6]. We also noted that Cdx2 expression appears to be>3-fold higher in genuine rat ESCs maintained in 4i (YPAC) conditions compared with 2i plus LIF conditions (see Fig. 4). In fact, genuine rat ESCs derived and maintained in 4i medium had higher expression of Cdx2 than TS cells. In contrast to Cdx2 where the expression levels did not discriminate ESCs and TS cells well, TS cells express Hand1, Fgf4, and Eomes at higher levels than genuine rat ESCs. Despite Cdx2 expression by genuine rat ESCs, the array differentiated XEN and TS cells from ESCs based on the expression of Nanog, Pou5f1, Fgf4, Sox2, and others (see Fig. 3C). For example, the expression of Nanog was >10,000-fold higher in ESCs than either XEN or TS cells. In summary, the expression of Nanog, Oct4, and Fgf4 by ESCs and not by XEN and TS cells together with expression of Gata4 and Gata6 by XEN and Hand1 by TS, distinguish XEN and TS cells from ESCs [7,16,18,26].
Since rat ESCs grown in 2i+LIF or 4i are not as efficient at germline transmission as seen in certain mouse strains, we hypothesize that culture conditions that activate or maintain Cdx2 expression might cause rat ESCs to contribute to extraembryonic tissues. This suggests that rat ESCs may contribute to extraembryonic tissues in addition to the inner cell mass following blastocyst injection. Therefore, culture conditions that decrease Cdx2 gene expression might increase ESC contribution to the inner cell mass and subsequently increase germline transmission efficiency. Further work is needed to confirm this hypothesis.
Technical considerations
The array has elements for QA and QC including 3 elements each for PPC and RTE controls, and an RGDC element. Using the manufacturer's criteria, in 2 arrays, RGDC was questionable. In each case, the technical replicate did not detect RGDC. To further resolve this finding, RT-PCR was performed using a set of primers for Pbgd (also known as Hmbs) that span an intron. The results were unable to verify RGDC. We speculate that the manufacturer's criteria for evaluation of RGDC may generate false positives at a frequency of ∼8%. Regarding QA/QC, we noted a tendency for the RNeasy method of total RNA isolation to produce more uniform results compared to the TRIZOL method (see Fig. 1B). A similar observation was noted in the Troubleshooting section of the user's manual provided by the manufacturer. Therefore, it is recommended that a qPCR Grade RNA Isolation Kit be employed with DNase treatment to maximize reproducibility of array findings.
Limitations of this array
Here, we used an array with 86 unique elements. Therefore, there are limitations in terms of the breadth of gene expression information obtained compared with a more global gene expression such as that previously obtained using the Affymetrix rat expression system whose probe set contains >30,000 elements [26]. In their analysis, Li et al. derived and maintained rat ESC-like cells in a medium containing LIF and GSK inhibitor (note their ESC-like cells were shown to form teratoma and to be alkaline phosphatase-positive; they did not test whether their ESC-like cells were competent to contribute to chimera or germline transmission). It is worth pointing out that some of the known pluripotency genes, such as Tbx3 and Stella (Dppa3) were shown to be expressed at high levels in their analysis [26], as was shown to be expressed here (see Table 2). Also, we noted that the primitive endoderm cells that were derived from their rat ESC-like cells expressed high levels of Gata6, Gata4, Sox17, and Foxa2 [26], similar to what we demonstrated here for the XEN cells (see Fig. 3C, Supplementary Table S4).
In an overall analysis using all genes on the array, the array did not discriminate undifferentiated rat ESCs from EBs differentiated for 5 days. However, genes that are strongly induced by differentiation, such as Cer1, Afp, Actc1, Foxa2, Gata4, Gata6, Hand1, Sox7, Sox17, and Pdx1, or particular genes that are strongly downregulated by differentiation, such as Gdf3 andTcl1a, distinguish rat ESCs that were differentiated for 5 days to EBs from undifferentiated rat ESCs (see Fig. 3B).
Previous work has indicated that expression of certain genes such as Nanog, Oct4, or Stella [17,27 –30], epigenetic or microRNA differences [11,31 –35] might enrich germline ESCs from other ESCs. Here, the array did not discriminate undifferentiated rat ESC lines that form chimera from genuine rat ESC lines. In fact, no genes were found to be expressed >10-fold difference between chimera 2i ESCs and germline 2i ESCs (see Fig. 3D). Therefore, the role of Dlk1-Dio3 region [34] or the role of miRNAs such as miR-290 miRNA cluster [36 –39] might be targets to investigate in rat ESCs in future work.
Footnotes
Acknowledgments
The authors thank Kristin Whiteside, Joseph Smith, and Drs. Brian Petroff, Jay Vivian, and David Albertini for their encouragement and assistance with this work. Dr. Dan Marcus and COBRE grant NIH/NCRR P20-RR017686 are thanked for use of the Nanodrop. This work was supported by grants from the Johnson Center for Cancer Research, the National Institutes of Health [NS34160 (M.L.W.) and HD020676 (M.J.S.)], the Kansas Biosciences Authority, the University of Kansas Cancer Center pilot project program 2010, the KSU College of Veterinary Medicine Dean's office, and by the State of Kansas Legislature to the Midwest Institute for Comparative Stem Cell Biology. A portion of this work was supported by the Deffenbaugh Foundation to the Spinal Cord Injury Program at the University of Kansas Medical School. MLW thanks BGW for her lifelong support. Mr. and Mrs. Howard Walker are thanked for their hospitality during the fall of 2010.
Author Disclosure Statement
The authors indicate no potential conflicts of interest.
References
Supplementary Material
Please find the following supplemental material available below.
For Open Access articles published under a Creative Commons License, all supplemental material carries the same license as the article it is associated with.
For non-Open Access articles published, all supplemental material carries a non-exclusive license, and permission requests for re-use of supplemental material or any part of supplemental material shall be sent directly to the copyright owner as specified in the copyright notice associated with the article.