




Abstract
Mesenchymal stem cells (MSCs) have opposite effects on tumor growth, being able either to favor angiogenesis and tumor initiation or to inhibit progression of established tumors. Factors produced by MSCs within the tumor microenvironment may be relevant for their biological effects. Recent studies demonstrated that microvesicles (MVs) are an integral component of inter-cellular communication within the tumor microenvironment. In the present study, we evaluated whether MVs derived from human bone marrow MSCs may stimulate or inhibit in vitro and in vivo growth of HepG2 hepatoma, Kaposi's sarcoma, and Skov-3 ovarian tumor cell lines. We found that MVs inhibited cell cycle progression in all cell lines and induced apoptosis in HepG2 and Kaposi's cells and necrosis in Skov-3. The observed activation of negative regulators of cell cycle may explain these biological effects. In vivo intra-tumor administration of MVs in established tumors generated by subcutaneous injection of these cell lines in SCID mice significantly inhibited tumor growth. In conclusion, MVs from human MSCs inhibited in vitro cell growth and survival of different tumor cell lines and in vivo progression of established tumors.
Introduction
In the present study, we evaluated whether MVs derived from human MSCs may stimulate or inhibit tumor growth. For this purpose, we have evaluated: (1) the in vitro effects of MSC-derived MVs on viability and proliferation of HepG2 hepatoma, Kaposi's sarcoma, and Skov-3 ovarian tumor cells; (2) the in vivo effect of intra-tumor administration of MVs in established tumors generated by subcutaneous injection of these cell lines in SCID mice. Our results suggest that MVs released from human MSCs exert an antitumor activity both in vitro and in vivo.
Materials and Methods
Isolation and characterization of bone marrow MSCs
MSCs were obtained from Lonza, cultured and characterized as previously described [20]. The MSCs were cultured in the presence of Mesenchymal Stem Cells Basal Medium (MSCBM; Lonza). At each passage, cells were counted and analyzed for immunophenotype by cytofluorimetric analysis. All the cell preparations at different passages of culture expressed the typical MSC markers: CD105, CD73, CD44, CD90, CD166, and CD146 (not shown). The adipogenic, osteogenic, and chondrogenic differentiation ability of MSCs was determined as previously described [20].
Human fibroblasts from dermas, used as control, were obtained from Lonza and maintained in DMEM (Lonza) with 10% fetal calf serum (FCS; Sigma) [21].
Cancer cell line culture
The human hepatocellular carcinoma cell line (HepG2), the human ovarian cancer cell line (Skov-3) [all from American Type Culture Collection (ATCC)], and Kaposi's sarcoma cell lines [22], were cultured in the DMEM low-glucose (Lonza) medium containing 10% of FCS, 100 U/mL penicillin, 100 mg/mL streptomycin, and 1% glutamine (all from Sigma) and maintained in an incubator with a humidified atmosphere of 5% CO2 at 37°C.
Indirect immunofluorescence was performed on cancer cells lines cultured on chamber slides (Nalgen Nunc International). After 24 h of incubation with MV-SytoRNA+, cells were fixed in 4% paraformaldehyde containing 2% sucrose. The monoclonal antibody anti-E-Cadherin (Dakocytomation) was used. Omission of the primary antibody or substitution with nonimmune mouse IgG were used as controls, where appropriated. Texas Red goat anti-mouse IgG (Molecular Probes) was used as a secondary antibody. Confocal microscopy analysis was performed using a Zeiss LSM 5 Pascal Model Confocal Microscope (Carl Zeiss International). Hoechst 33258 dye (Sigma) was added for nuclear staining.
Coculture of MSCs and cancer cells
Coculture system was established by using transwells (1 μm pore, Falcon, Becton Dickinson) of 6-well plates. HepG2 (80,000 cells/well), Kaposi, and Skov-3 cells (50,000 cells/well) were seeded into the lower compartment of the culture wells. Different amounts of MSCs were loaded in the upper inserts to obtain ratios of cancer cells/MSCs of 1:1, 1:3, and 1:6. The experiments were conducted in triplicates. The number of cancer cells, cultured with different concentration of MSCs, was counted after 48 h of incubation and cell cycle status was evaluated, as described below.
Preparation of conditioned medium from MSCs
Supernatants were obtained culturing MSCs in RPMI deprived of FCS and supplemented with 0.5% of bovine serum albumin (BSA; Sigma-Aldrich). The viability of cells was detected by trypan blue exclusion. After centrifugation at 3,000 g for 10 min, to remove cell debris, cell-free supernatants were concentrated 25-fold by centrifugation at 2,700 g for 75 min, using Ultra-PL 3 ultrafiltration units (Amicon-Ultra; Millipore) with a 3-kDa molecular weight cutoff. A total of 250 μL of the conditioned medium (CM) was obtained. The CM was concentrated to maintain the same MSC/cancer cell ratio established in the coculture experiments. To evaluate the contribution of MVs in the biological effect of CM, CM was deprived of MVs by ultracentrifugation (150,000 g for 8 h; depletion was verified by NanoSight as described below).
Isolation and characterization of MVs
MSCs and fibroblasts were cultured in the presence of FCS depleted of MVs (centrifugation at 150,000 g for 8 h; depletion was verified by NanoSight as described below). To collect MVs, MSCs or fibroblasts were cultured overnight in RPMI deprived of FCS and supplemented with 0.5% BSA (cell viability >99% as detected by trypan blue exclusion) [20,21]. MVs were purified from a cell-free supernatant as detailed by Théry et al. [23]. Briefly, the supernatants were centrifuged at 2,000 g for 20 min followed by a second centrifugation at 12,000 g for 15 min to remove debris and apoptotic bodies. Supernatants were then ultracentrifuged at 100,000 g (Beckman Coulter Optima L-90K ultracentrifuge) for 1 h at 4°C, washed in the medium 199 containing N-2-hydroxyethylpiperazine-N′-2-ethanesulfonic acid (HEPES) 25 mM (Sigma) and submitted to a second ultracentrifugation in the same conditions previously described [19 –21]. The protein content of MVs was quantified by the Bradford method (BioRad). Endotoxin contamination of MVs was excluded by the Limulus test (Charles River Laboratories, Inc.). By the NanoSight LM10 instrument (NanoSight Ltd.), equipped with the nanoparticle tracking analyses(NTA) 2.0 analytic software, the size of MVs resulted 145±57 nm, as previously reported (Fig. 1) [21].
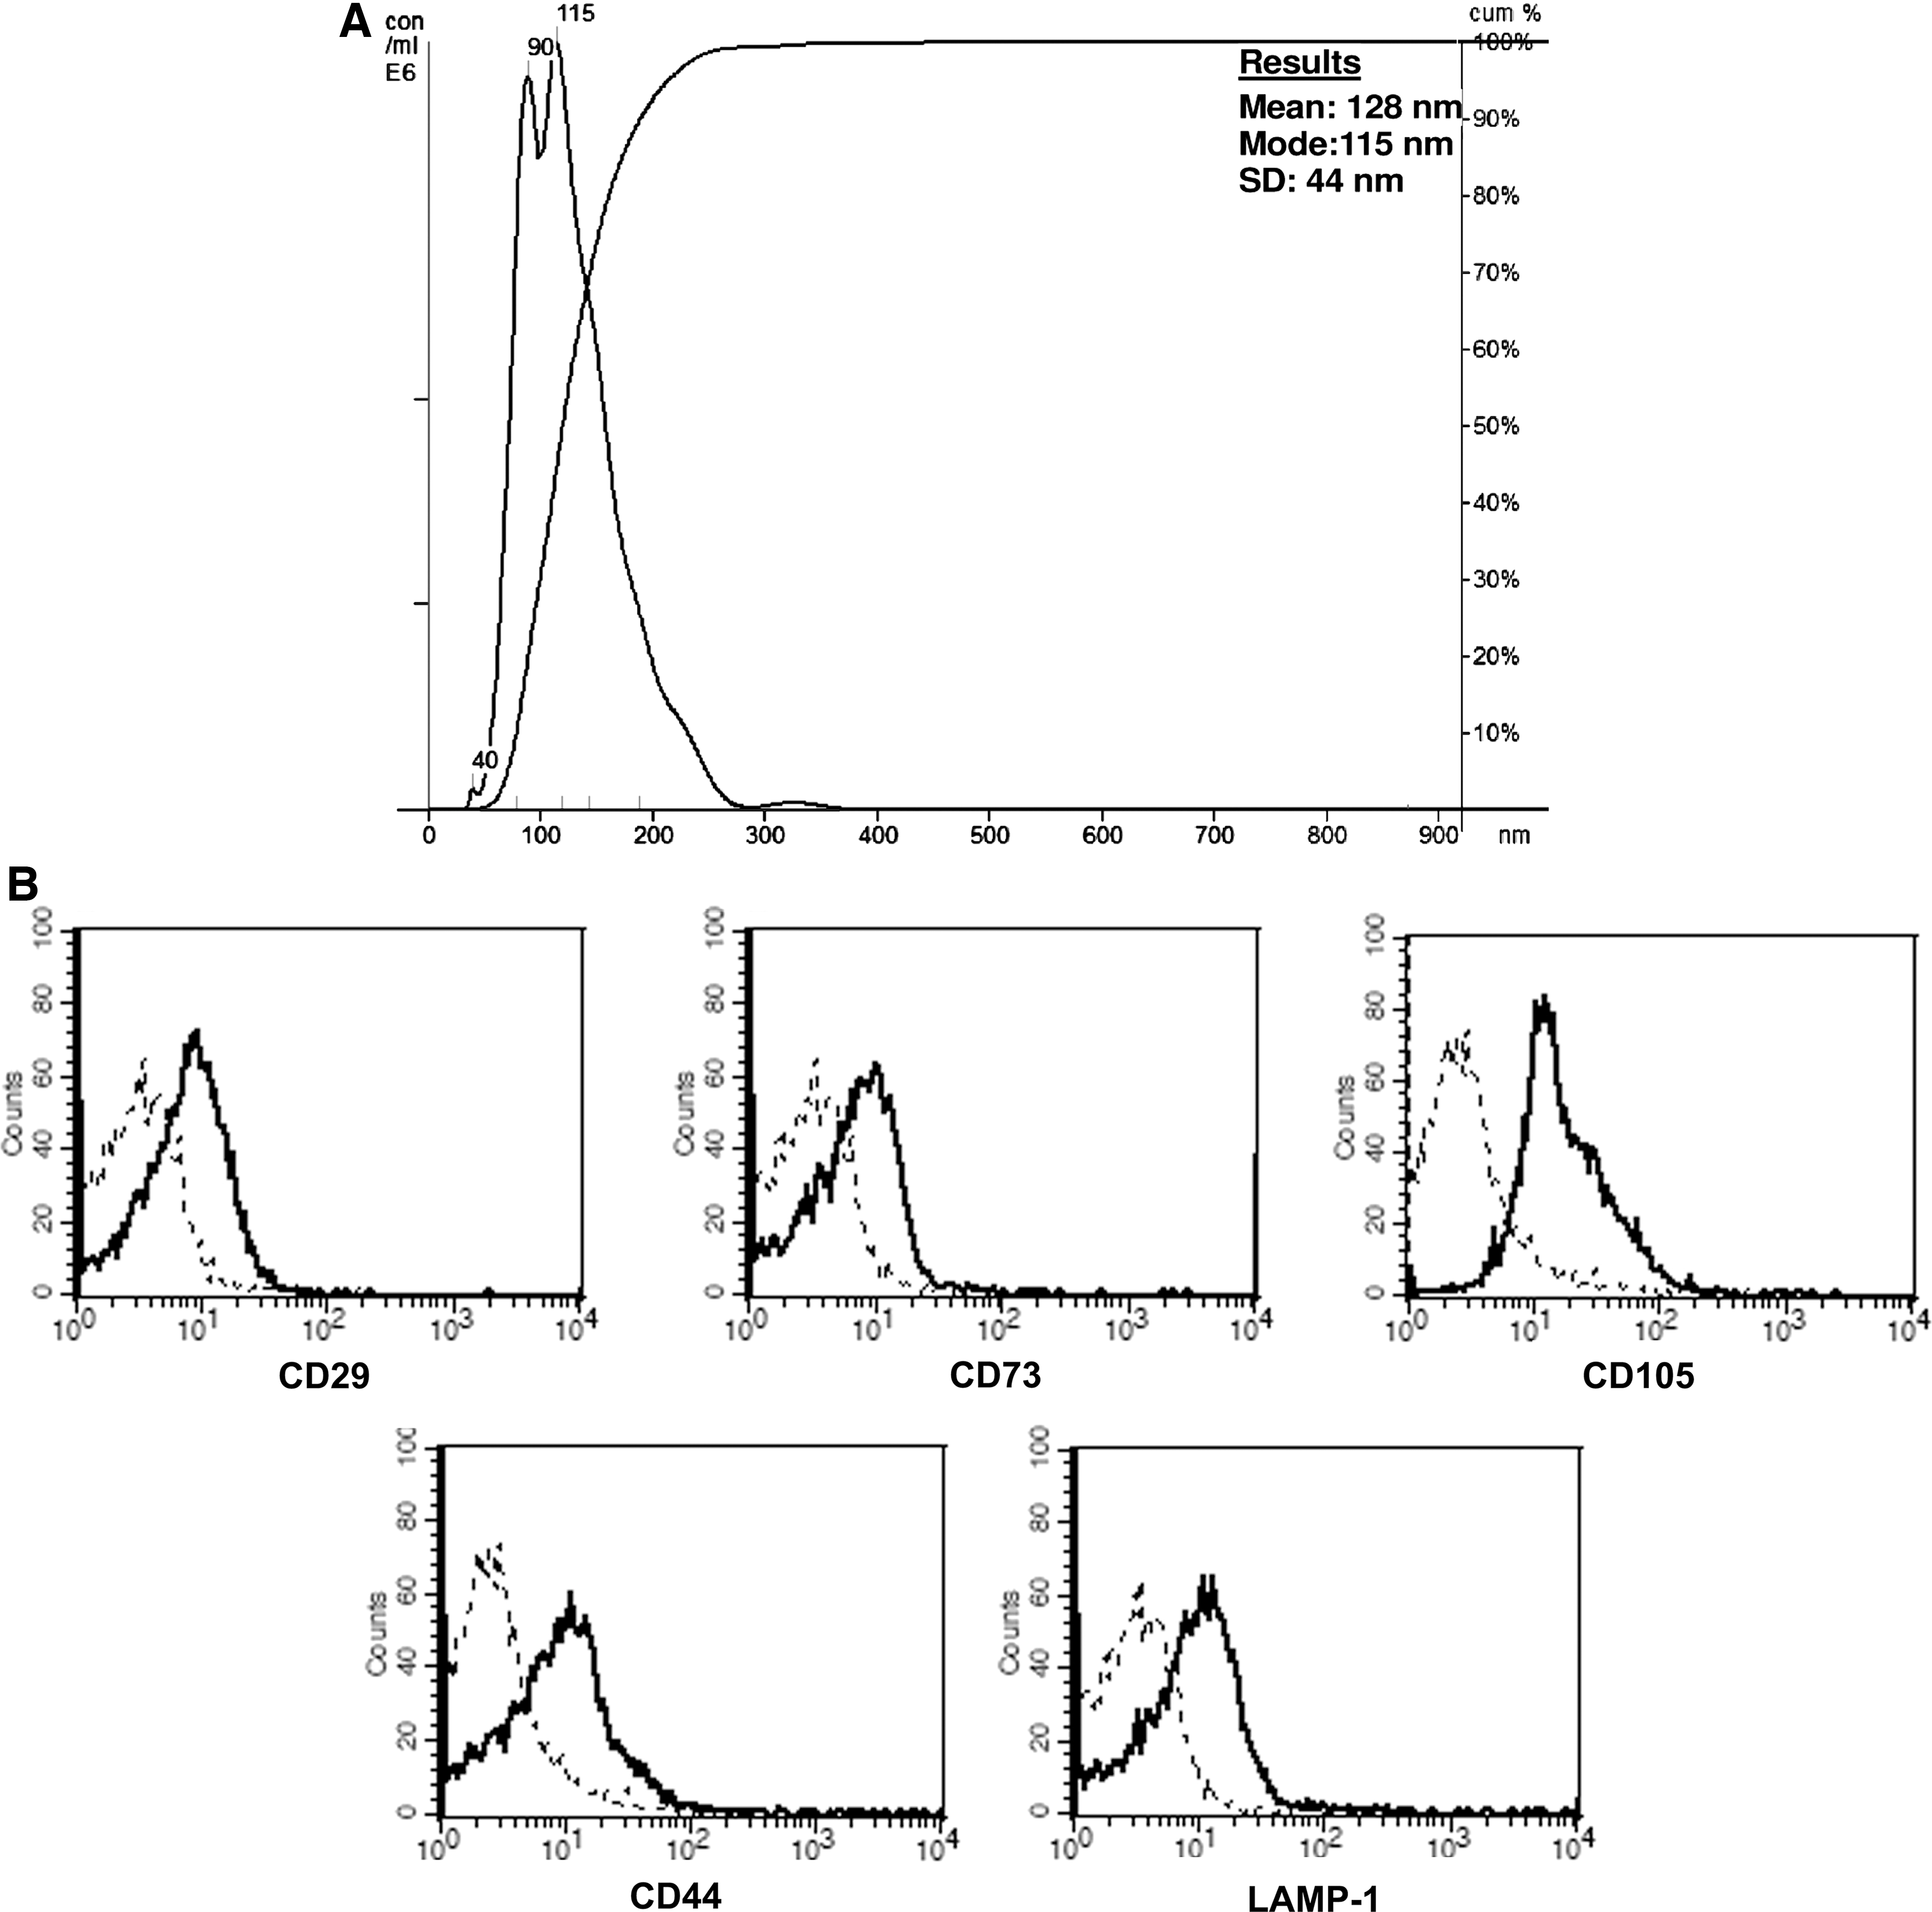
Cytofluorimetric characterization of mesenchymal stem cell (MSC)-derived microvesicles (MVs).
Flow cytometry was used to characterize the isolated MVs. Briefly, MVs (20 μg) were incubated for 30 min at room temperature, followed by additional 30 min at 4°C, with 5 μL of latex beads (Aldehyde/sulfate latex 4% w/v 4 μm, Molecular Probes), then washed in 0.5% BSA in PBS and incubated for 30 min with different antibodies or with appropriate isotype controls IgG. After washing, the MV-coated beads were immediately evaluated for expression of different markers using the FACSCalibur cytometer (Becton Dickinson). Cytofluorimetric analyses showed the presence of several antigens typically expressed by MSCs, such as CD29, CD73, CD105, CD44, and of a classical exosomal marker LAMP-1 (Fig. 1).
To trace MVs by fluorescence microscopy, MSCs were labeled with the SYTO® RNASelect™ green fluorescent cell stain (Molecular Probes, Life Tecnhology) that specifically stain RNA, in accordance with the manufacturer's instructions.
Cell proliferation
Cancer cells were seeded at 2,000 or 4,000 cells/well into 96-well plates in 100 μL/well of DMEM low glucose with 3% FCS and in the presence of different concentrations of CM, CM deprived of MVs (dCM), and of MVs (10 and 30 μg/mL). The concentrations of CM and of dCM used in cell proliferation experiments were calculated in respect to the different ratio of MSCs utilized in coculture experiments (1:1, 1:3, and 1:6). DNA synthesis was detected as incorporation of 5-bromo-2′-deoxy-uridine (BrdU) into the cellular DNA after 48 h of culture. Cells were then fixed with 0.5 M ethanol/HCl and incubated with nuclease to digest the DNA. BrdU incorporated into the DNA was detected using an anti-BrdU peroxidase-conjugated monoclonal antibody and visualized with a soluble chromogenic substrate (Roche Applied Science). The optical density was measured with an ELISA reader at 405 nm.
Cell cycle analyses
For cell cycle analyses, different cancer cell lines were cultured in DMEM low glucose supplemented with 3% FCS in the presence of different concentrations of MSCs, in the coculture system as described above, or with 30 μg/mL (that correspond to 150,000 MSCs) of different preparations of MVs in T25 flasks. After 1, 2, 3, or 4 days of culture, tumor cells were collected by trypsin treatment and fixed with 70% ice-cold ethanol. Cells were maintained for at least 24 h at −20°C, then washed in PBS with 0.5% Triton. Thereafter, cells were incubated for 4 h in ice with 50 μg/mL of propidium iodide (PI; Sigma) to stain the DNA in a solution containing RNase (20 μg/mL; Ambion, Life Technology) and 0.1% Triton (Sigma). Cell samples were then analyzed on FACSCalibur flow cytometry. The experiments were repeated 3 times to ensure reproducibility.
ApoTox-Glo™ Triplex assay
Cancer cells (5,000 for Skov-3 and Kaposi and 8,000 for HepG2) were seeded into 96-well black plates with a clear bottom in DMEM and 10% FCS in the presence of doxorubicin (100 ng/mL) (positive controls for apoptotic signal) or different concentrations of MVs for 48 h. H2O2, at the concentration of 0.5 or 1 μM were used as a positive control for necrosis signal and was added 4 h before the end of the experiments. Viability, cytotoxicity, and caspase activation were simultaneously evaluated within a single assay well [24], using the ApoTox-Glo Triplex assay (Promega Corporation). The first part of the test simultaneously measured 2 protease activities:
(1) the live cell protease activity was measured using a fluorigenic, cell-permeant, peptide substrate [glycyl-phenylalanyl-aminofluorocoumarin (GF-AFC)], that enters intact cells, where it is cleaved by the live-cell protease activity to generate a fluorescent signal proportional to the number of living cells;
(2) a second fluorigenic cell-impermeant peptide substrate [bis-alanylalanyl-phenylalanyl-rhodamine 110 (bis-AAF-R110)] was used to measure dead cell-protease activity.
The live- and dead-cell proteases generated different products (AFC and R110), with different excitation and emission spectra.
The second part of the assay provided a luminogenic caspase 3/7 substrate. Luminescence was proportional to the amount of caspase activities present.
Tunel assay
Cancer cells (5,000 for Skov-3 and Kaposi and 8,000 for HepG2) were seeded into 96-well plated in 100 μL/well of DMEM with 10% FCS in the presence of doxorubicin (100 ng/mL; Sigma) or different concentrations of MVs (10 and 30 μg/mL). Apoptosis was evaluated using terminal transferase-mediated dUTP nick-end labeling (Tunel) assay (ApopTag Apoptosis Detection Kit; Millipore, Inc.). After 24 or 48 h of treatment, cells were washed with PBS, fixed in 1% paraformaldehyde pH 7.4 for 15 min at 4°C, washed twice in PBS, and then postfixed in precooled ethanol-acetic acid 2:1 for 5 min at −20°C. Samples were treated with the terminal deoxynucleotidyl transferase enzyme. Cells were then treated with warmed anti-digoxigenin conjugate with fluorescein and incubated for 30 min at room temperature. Samples were put in a medium containing 1 μg/mL of PI and the cells analyzed by immunofluorescence. Results are expressed as percentage of green fluorescence emitting cells (apoptotic cells) versus red fluorescence emitting cells (total cells).
Assays for caspase activity
To study the caspase activity, cancer cells were seeded into T25 flasks at 80% of confluence, starved for 5 h, and stimulated for 24 or 48 h in DMEM with 10% FCS in the presence of doxorubicin (100 ng/mL), utilized as positive controls for apoptosis, or with different preparations of MVs (30 μg/mL). Caspase activation was evaluated using the Vybrant FAM Caspase-8 assay kit (Molecular Probes).
Cell cycle gene array analysis
To study the modulation of genes involved in cell cycle progression by MV treatments, cell cycle gene arrays were performed (SABioscience). Cancer cells were seeded into T75 flasks at 80% of confluence, starved for 5 h, and stimulated for 24 h with MVs (30 μg/mL) in DMEM 3% FCS. Cells cultured in the basal medium (DMEM 3% FCS) were used as control. Two different preparations of MVs were tested.
Total RNA was then isolated from different cell preparations using the TRI Reagent® Solution isolation kit (Ambion) according to the manufacturer's protocol. RNA was then quantified spectrophotometrically (Nanodrop ND-1000). RNA from cancer cells (500 ng for each sample) was analyzed by quantitative real-time polymerase chain reaction (qRT-PCR) using a 96-well array for the expression of about 90 genes involved in the cell cycle processes according to the manufacturer's instruction (SA Bioscience, Qiagen). Data analyses were performed using the online SA bioscience software. Data derived from gene expression profile were expressed as scatter plot comparing the normalized expression of every gene on the array between MV-treated cells and control-untreated cells by plotting them against one another to visualize gene expression changes. The boundary (fold regulation cutoff) was set to 2-fold change between the different groups.
Quantitative real-time PCR
To confirm the gene array analyses, qRT-PCR was performed as previously described [25]. Briefly, first-strand cDNA was produced from 200 ng of total RNA using the High-Capacity cDNA Reverse Transcription Kit (Applied Biosystems). Real-time PCR experiments were performed in 20 μL reaction mixture containing 5 ng of cDNA template, the sequence-specific oligonucleotide primers (purchased from MWG-Biotech AG) (Table 1), and the Power SYBR® Green PCR Master Mix (Applied Biosystems). GAPDH mRNA was used to normalize RNA inputs. Fold-change expression in MV-treated cells with respect to control cancer cells was calculated for all samples.
In selected experiments, to distinguish between gene expression induced de novo by MV treatment and transcripts shuttled by MVs, HepG2 and Kaposi's cells were pretreated for 30 min with 10 μg/mL of the transcription inhibitor actinomycin D (ActD; Sigma) [26]. Cancer cells were then incubated with 30 μg/mL of MVs for 24 h or with vehicle alone (DMED 3% FCS). After 24 h of incubation, cancer cells were washed, to eliminate any residue of MVs, and total RNA was then isolated and qRT-PCR was performed, as described above.
In vivo tumor formation and MV treatment
Animal studies were conducted in accordance with the National Institute of Health Guide for the Care and Use of Laboratory Animals. The protocol was approved by the Committee on the Bioethics of the University of Torino.
3×10⁶ of HepG2 and Skov-3 cells or 1.5×10⁶ of Kaposi cells were collected and implanted subcutaneously into SCID mice (Charles River, Jackson Laboratories). Cultured cells, harvested using trypsin-EDTA were washed with PBS, counted in a microcytometer chamber and resuspended in 100 μL of DMEM and 100 μL of Matrigel Matrix (Becton Dickinson). Cells were chilled on ice, and injected subcutaneously into the left back of SCID mice via a 26-gauge needle using a 1-mL syringe. The animals were monitored for activity and physical conditions every day, and the determination of body weight and measurement of tumor mass were done every 3 days. Tumor mass was determined by a caliper measurement in 2 perpendicular diameters of the implant and calculated using the formula 1/2a×b 2, where a stands for the long diameter and b in the short diameter [27]. When the implanted tumors rinse the volume of ∼15 mm3 (1 week for HepG2 tumors and 2 weeks for Skov-3 and Kaposi tumors from Matrigel injection), we started the weekly intra-tumor injection of MVs. The first treatment was of 100 μg of MVs; the following intra-tumor injections were of 50 μg of MVs, in a volume of 20 μL of PBS (vehicle). In control mice, we injected intra-tumor the same volume of vehicle alone. Mice were randomized into 2 treatment groups: (1) the group that received intra-tumor injections of MVs (n=8/cell line), and (2) the control group injected with the same volume of vehicle alone (n=6/cell line). After 3 weeks from injection for HepG2 tumors and 4 weeks for Skov-3 and Kaposi tumors, mice were sacrificed and tumors recovered and processed for histology. For histological evaluation, subcutaneous tumors were collected, fixed in 10% formalin, and embedded in paraffin. Sections of 4 μm thickness were stained with Hematoxylin and Eosin for conventional histology. Apoptosis was measured in paraffin-embedded tumor sections, by Tunel assay (ApopTag Apoptosis Detection Kit; Millipore, Inc.) according to the manufacturer's protocol.
Statistical analysis
All data were expressed as mean±SD. Statistical analysis was performed by analysis of variance with the Newman–Keuls multicomparison or Dunnett's post hoc tests or by the Student t-test as appropriate. The two-tailed P value<0.05 was considered statistically significant.
Results
Effect of MSC-derived MVs on in vitro proliferation of HepG2, Kaposi, and Skov-3 cell lines
Coculture of MSCs with HepG2, Kaposi, and Skov-3 in transwells significantly inhibited tumor cell proliferation (Fig. 2A). Consistently, we observed an increase of cancer cells in the G0/G1 phase (Fig. 2B) after 48 h incubation of HepG2, Kaposi's, and Skov-3 cancer cell lines with different concentrations of MSCs (ratio of cancer cells to MSCs: 1:1, 1:3, and 1:6). To evaluate the effect of paracrine factors released by MSCs in the CM, BrdU incorporation assay was performed incubating cancer cells with different concentrations of CM for 48 h. As shown in Fig. 2C, CM induced a significant inhibition of cancer cell proliferation in a dose-dependent manner. When CM was deprived of MVs (dCM), the inhibitory effect on proliferation was abrogated (Fig. 2C). Therefore, we tested the effect of purified MVs on cancer cell proliferation. Incubation of tumor cells with different doses of MVs for 48 h, significantly inhibited proliferation, evaluated by BrdU incorporation, in respect to tumor cells incubated with vehicle alone or with MVs derived from human fibroblasts, used as control (Fig. 3A).
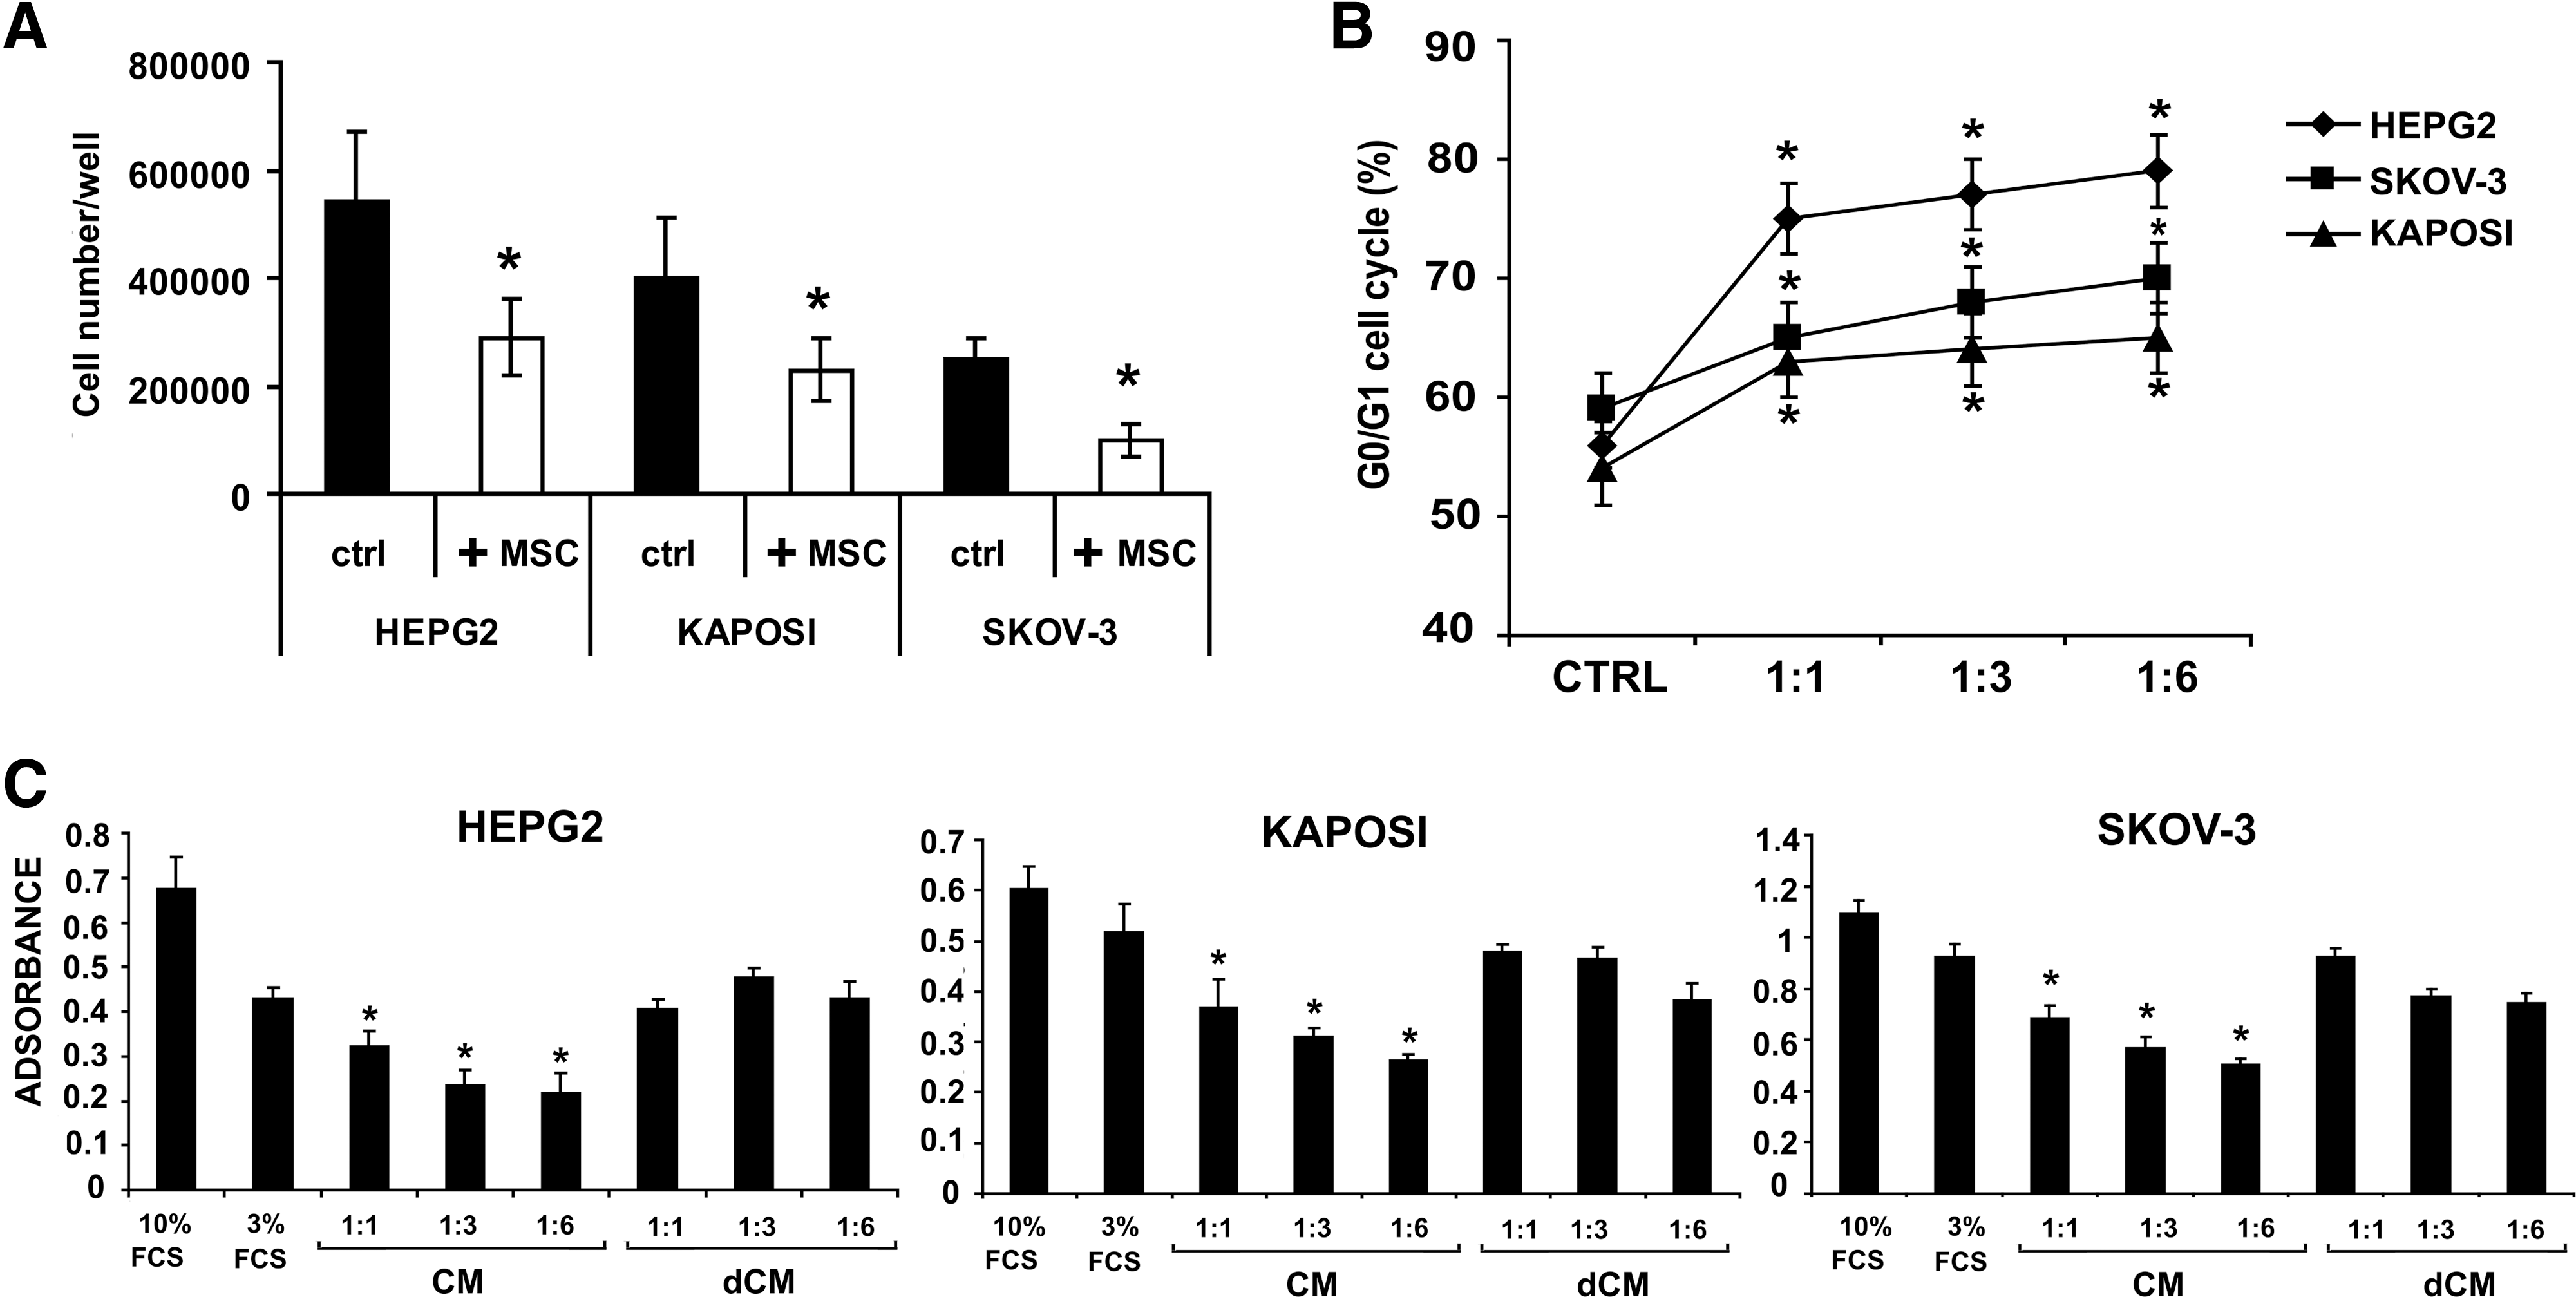
Effect of MSCs and of MSC-derived conditioned medium (CM) on cancer cell proliferation.
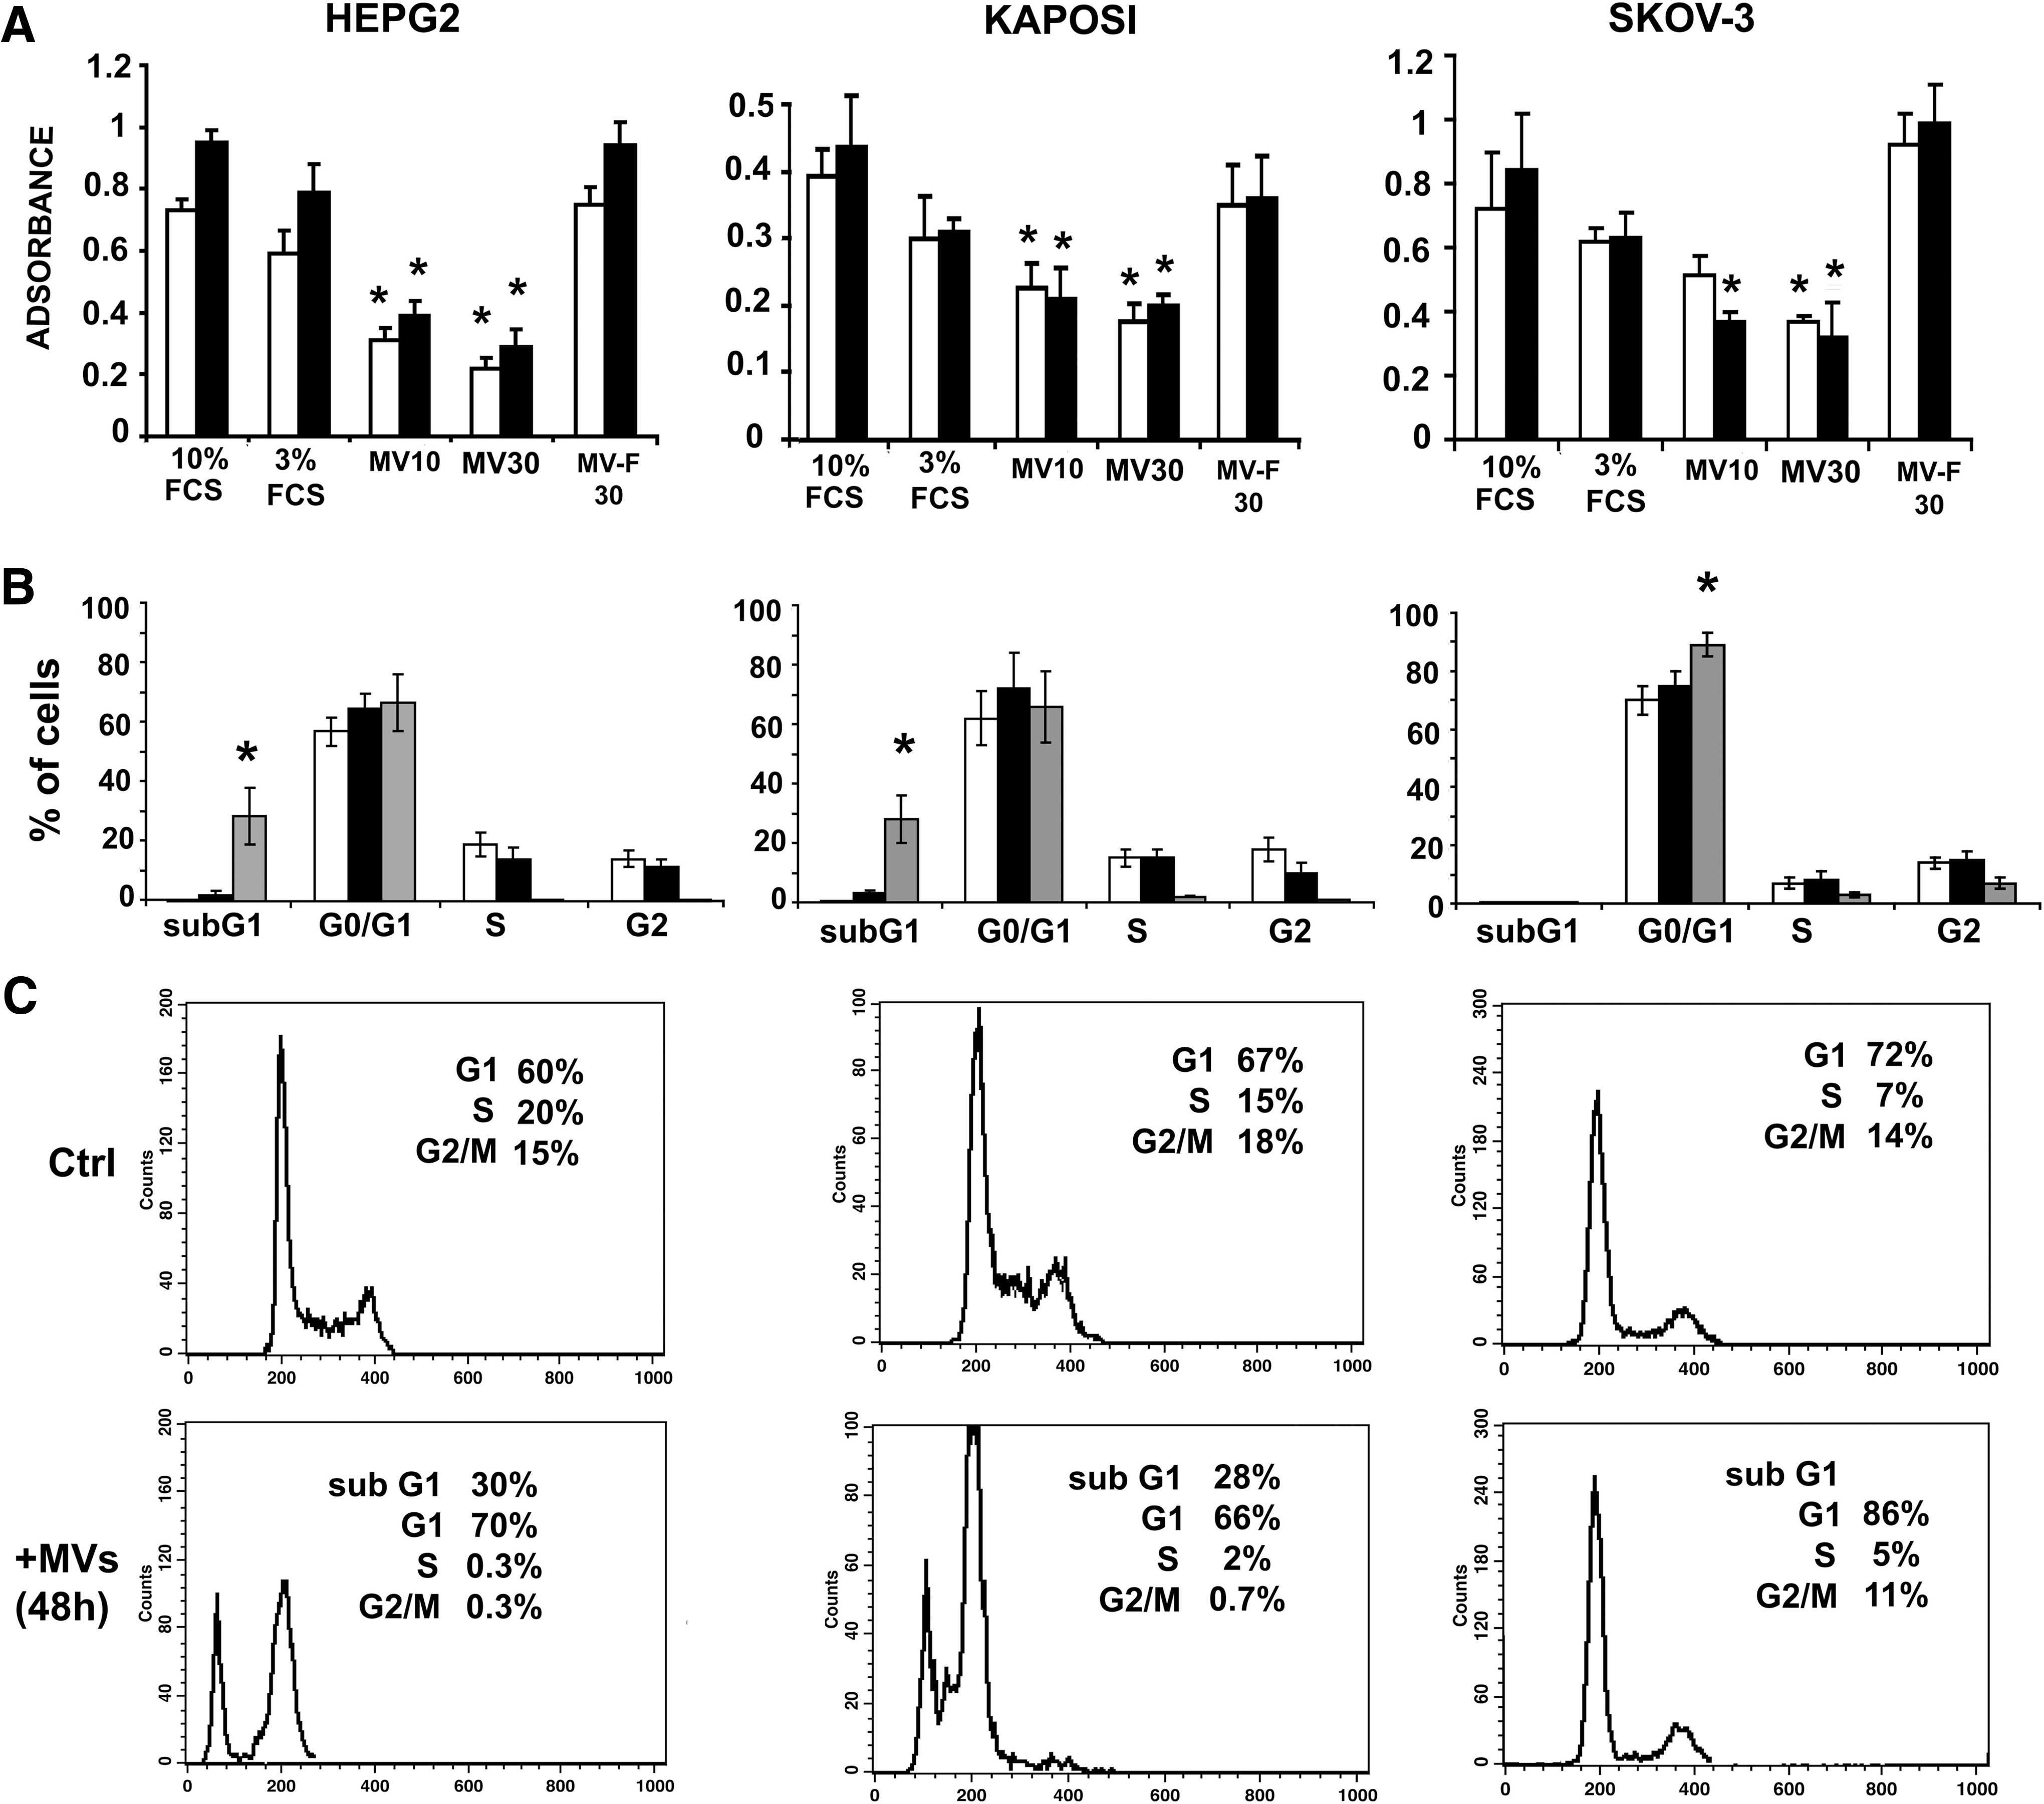
Antiproliferative effect of MSC-derived MVs.
The effect of the MVs on cell cycle was evaluated (Fig. 3B, C). After 24 h incubation with MVs of both HepG2 and Kaposi's sarcoma cell lines, a sub-G1-peak was observed that increased further after 48 h. In Kaposi's cells, an increased percentage of cells in the G0/G1 phase was also observed. At variance, in the Skov-3 cell line, MVs did not induce a sub-G1-peak even after 5 days of culture (not shown), but significantly increased the percentage of cells in the G0/G1 phase (Fig. 3B, C). This increase in the number of G0/G1 cells persisted until day 5 of incubation (not shown).
The incorporation of MVs in cancer cells was also evaluated. MVs isolated from MSCs labeled with SytoRNA, were incubated for 24 h with tumor cells. As shown in Fig. 4, MV-SytoRNA was incorporated in HepG2 cells, after 24 h of incubation. Similar results were observed with the other cell lines (not shown).
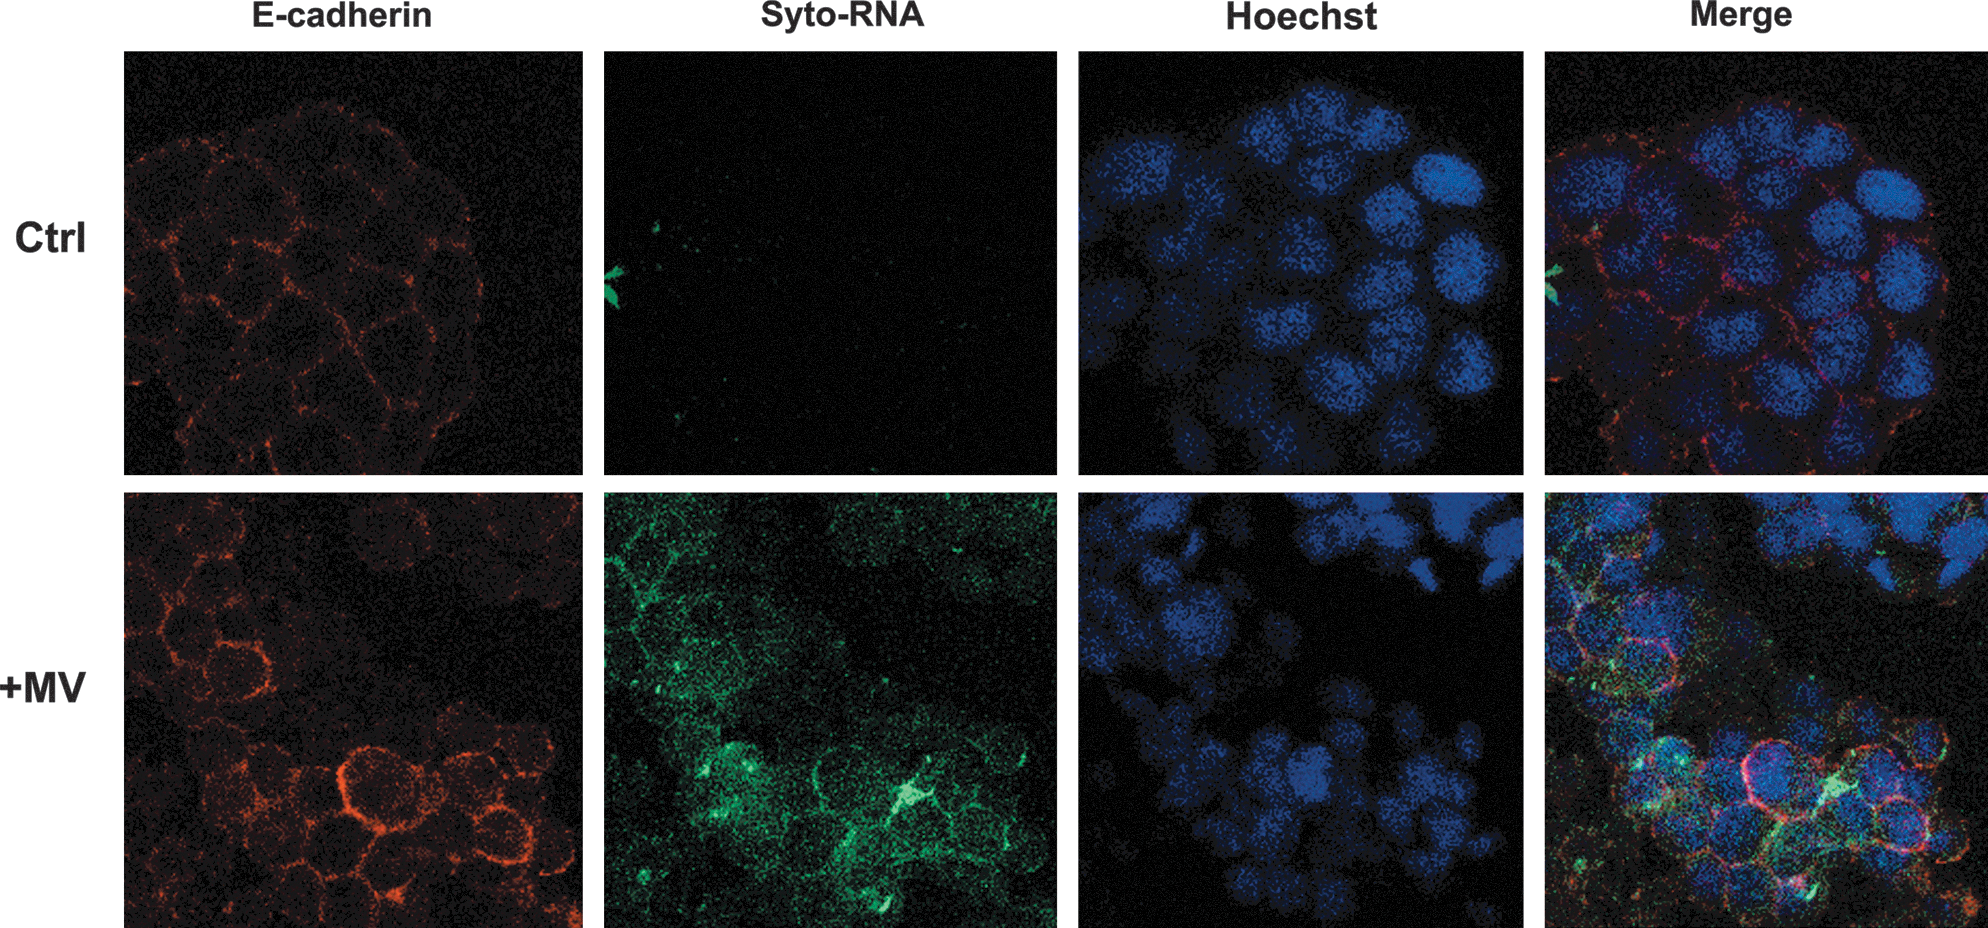
Incorporation of MVs in cancer cells. Representative micrographs of internalization by HepG2 cells (24 h at 37°C) of MVs labeled with Syto-RNA (green); in red: e-cadherin. Nuclei were counterstained with Hoechst dye. Three experiments were performed with similar results using the different cancer cell lines. Original magnification:×630.
Molecular changes in different cancer cell lines induced by MVs
Cancer cell lines were stimulated for 24 h in the presence of 2 different preparations of MVs or vehicle alone, and gene array profiles were then performed. The results of the gene array profiles are shown in Fig. 5. MV treatment of different cancer cell lines induced the modulation of different genes involved in cell cycle progression.
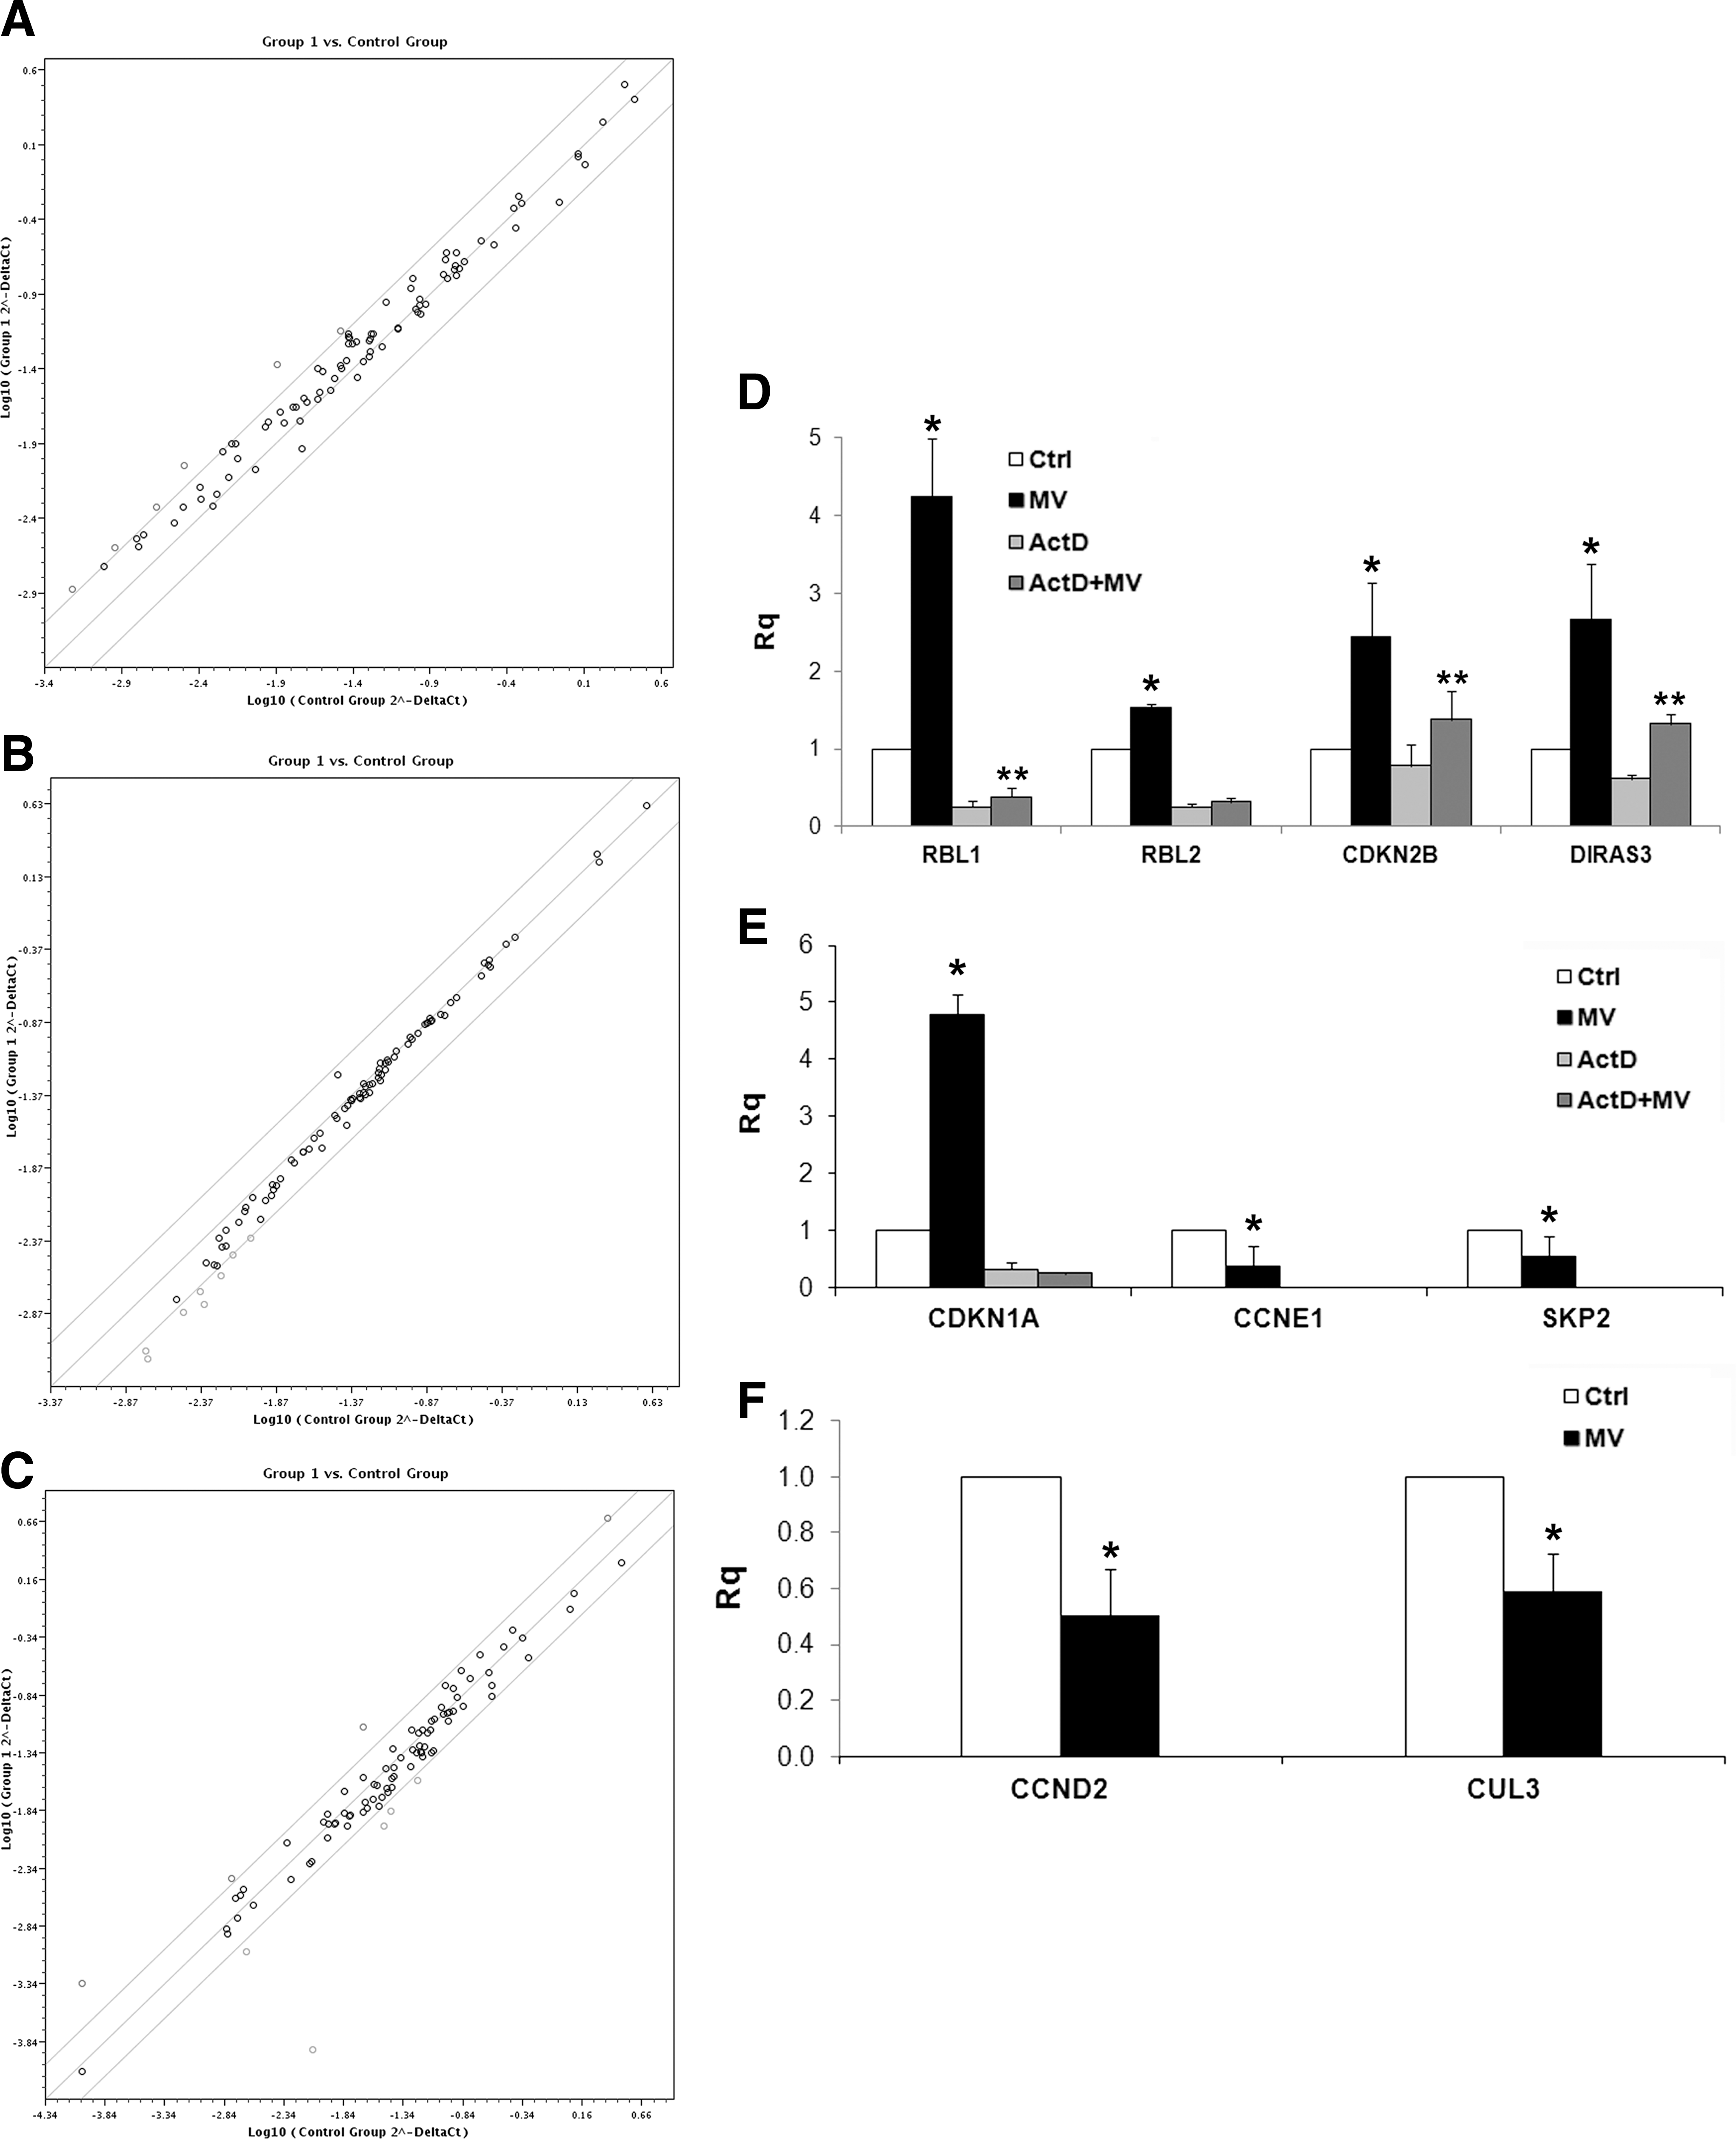
Molecular changes in genes related to cell cycle in different cancer cell lines induced by MV treatment.
In the microarray experiments on HepG2, 6 of the 96 cDNAs on the membrane showed greater than 2-fold changes in the MV-treated HepG2 compared to control (Fig. 5A). The GTP-binding RAS-like 3 (DIRAS3), retinoblastoma-like 1 (Rbl-1), cyclin-dependent kinase inhibitor 2B transcript (CDKN2B), which are related to the anti-proliferative pathway, were upregulated. Moreover, the cell cycle-negative regulator, Rbl-2, showed a significant increase in one of the MV-treated HepG2 samples. The gene array profile of MV-treated cells showed also the enhancement of the following transcripts, the Baculoviral IAP repeat containing 5 (BIRC5), DDX11 DEAD/H box helicase 11 (DDX11), and Minichromosome maintenance complex component 5 (MCM5).
The gene array profile conducted on Kaposi cells, showed a significant increase of cyclin-dependent kinase inhibitor 1A transcript (CDKN1A), BIRC5, Cyclin D1 (CCND1), and cell division cycle 20 homolog (CDC20) in Kaposi treated with MVs (Fig. 5B). Moreover, we observed the downregulation of 2 cyclins, CCNE1 and CCND2, both involved in cell cycle G1/S transition, Cullin 3 (CUL3), Retinoblastoma 1 (Rb1), and of S-phase kinase-associated protein 2 (SKP2) (Fig. 5B).
In the microarray experiments conducted on Skov-3, 8 of the 96 cDNAs on the gene array membrane showed more than 2-fold downregulation in the MV-treated Skov-3 in respect to control Skov-3 (Fig. 5C). Among the downregulated transcripts, 2 genes involved in cell cycle progression showed a relevant reduction after MV treatment in Skov-3: CCND2, that functions as a regulatory subunit of CDK kinases; CUL3, that encodes for a component of ubiquitin E3 ligase, which is essential for the mitotic division (Fig. 5C). In contrast to HepG2 and Kaposi's cells, in Skov-3 cells treated with MVs, no genes resulted upregulated. qRT-PCR was conducted to confirm the modulation of different genes by MV treatment in the cancer cell lines (Fig. 5D, F). In HepG2 and Kaposi cells, where we observed an upregulation of different transcripts, to distinguish between gene expression induced de novo by MV treatment and transcripts shuttled by MVs, cancer cells were pretreated with a transcription inhibitor, ActD. As shown in Fig. 5D and E, for the most part, the revealed transcripts were due to de novo gene expression induced by MVs incorporation. In HepG2 cells, some of the transcripts tested (RBL1, CDKN2B, and DIRAS3) showed a significant difference between the ActD-treated cells in the presence or absence of MVs, supporting also a functional transfer of transcripts by MVs in the biological effects observed.
Effect of MSC-derived MVs on HepG2, Kaposi, and Skov-3 cell viability
The presence of a sub-G1 peak in HepG2 and Kaposi's sarcoma cells suggested cell apoptosis. To discriminate whether cancer cells undergo apoptosis or necrosis, we used the kit ApoTox-Glo Triplex assay, that allows to evaluate simultaneously within a single assay well viability, cytotoxicity (necrosis) and caspase 3 and 7 activation (apoptosis) [24]. Using this assay, after 48 h of incubation with different MV concentrations, a decrease of viability was observed in all the cell lines tested (Fig. 6A). In the same wells, the apoptotic signal was clearly detectable in HepG2 and Kaposi cells in the presence of MVs or doxorubicin used as control (Fig. 6B). At variance, in the Skov-3 cell line, the apoptotic signal was not detectable, but the necrosis signal was evident at the concentration of 10 μg/mL of MVs (Fig. 6B).
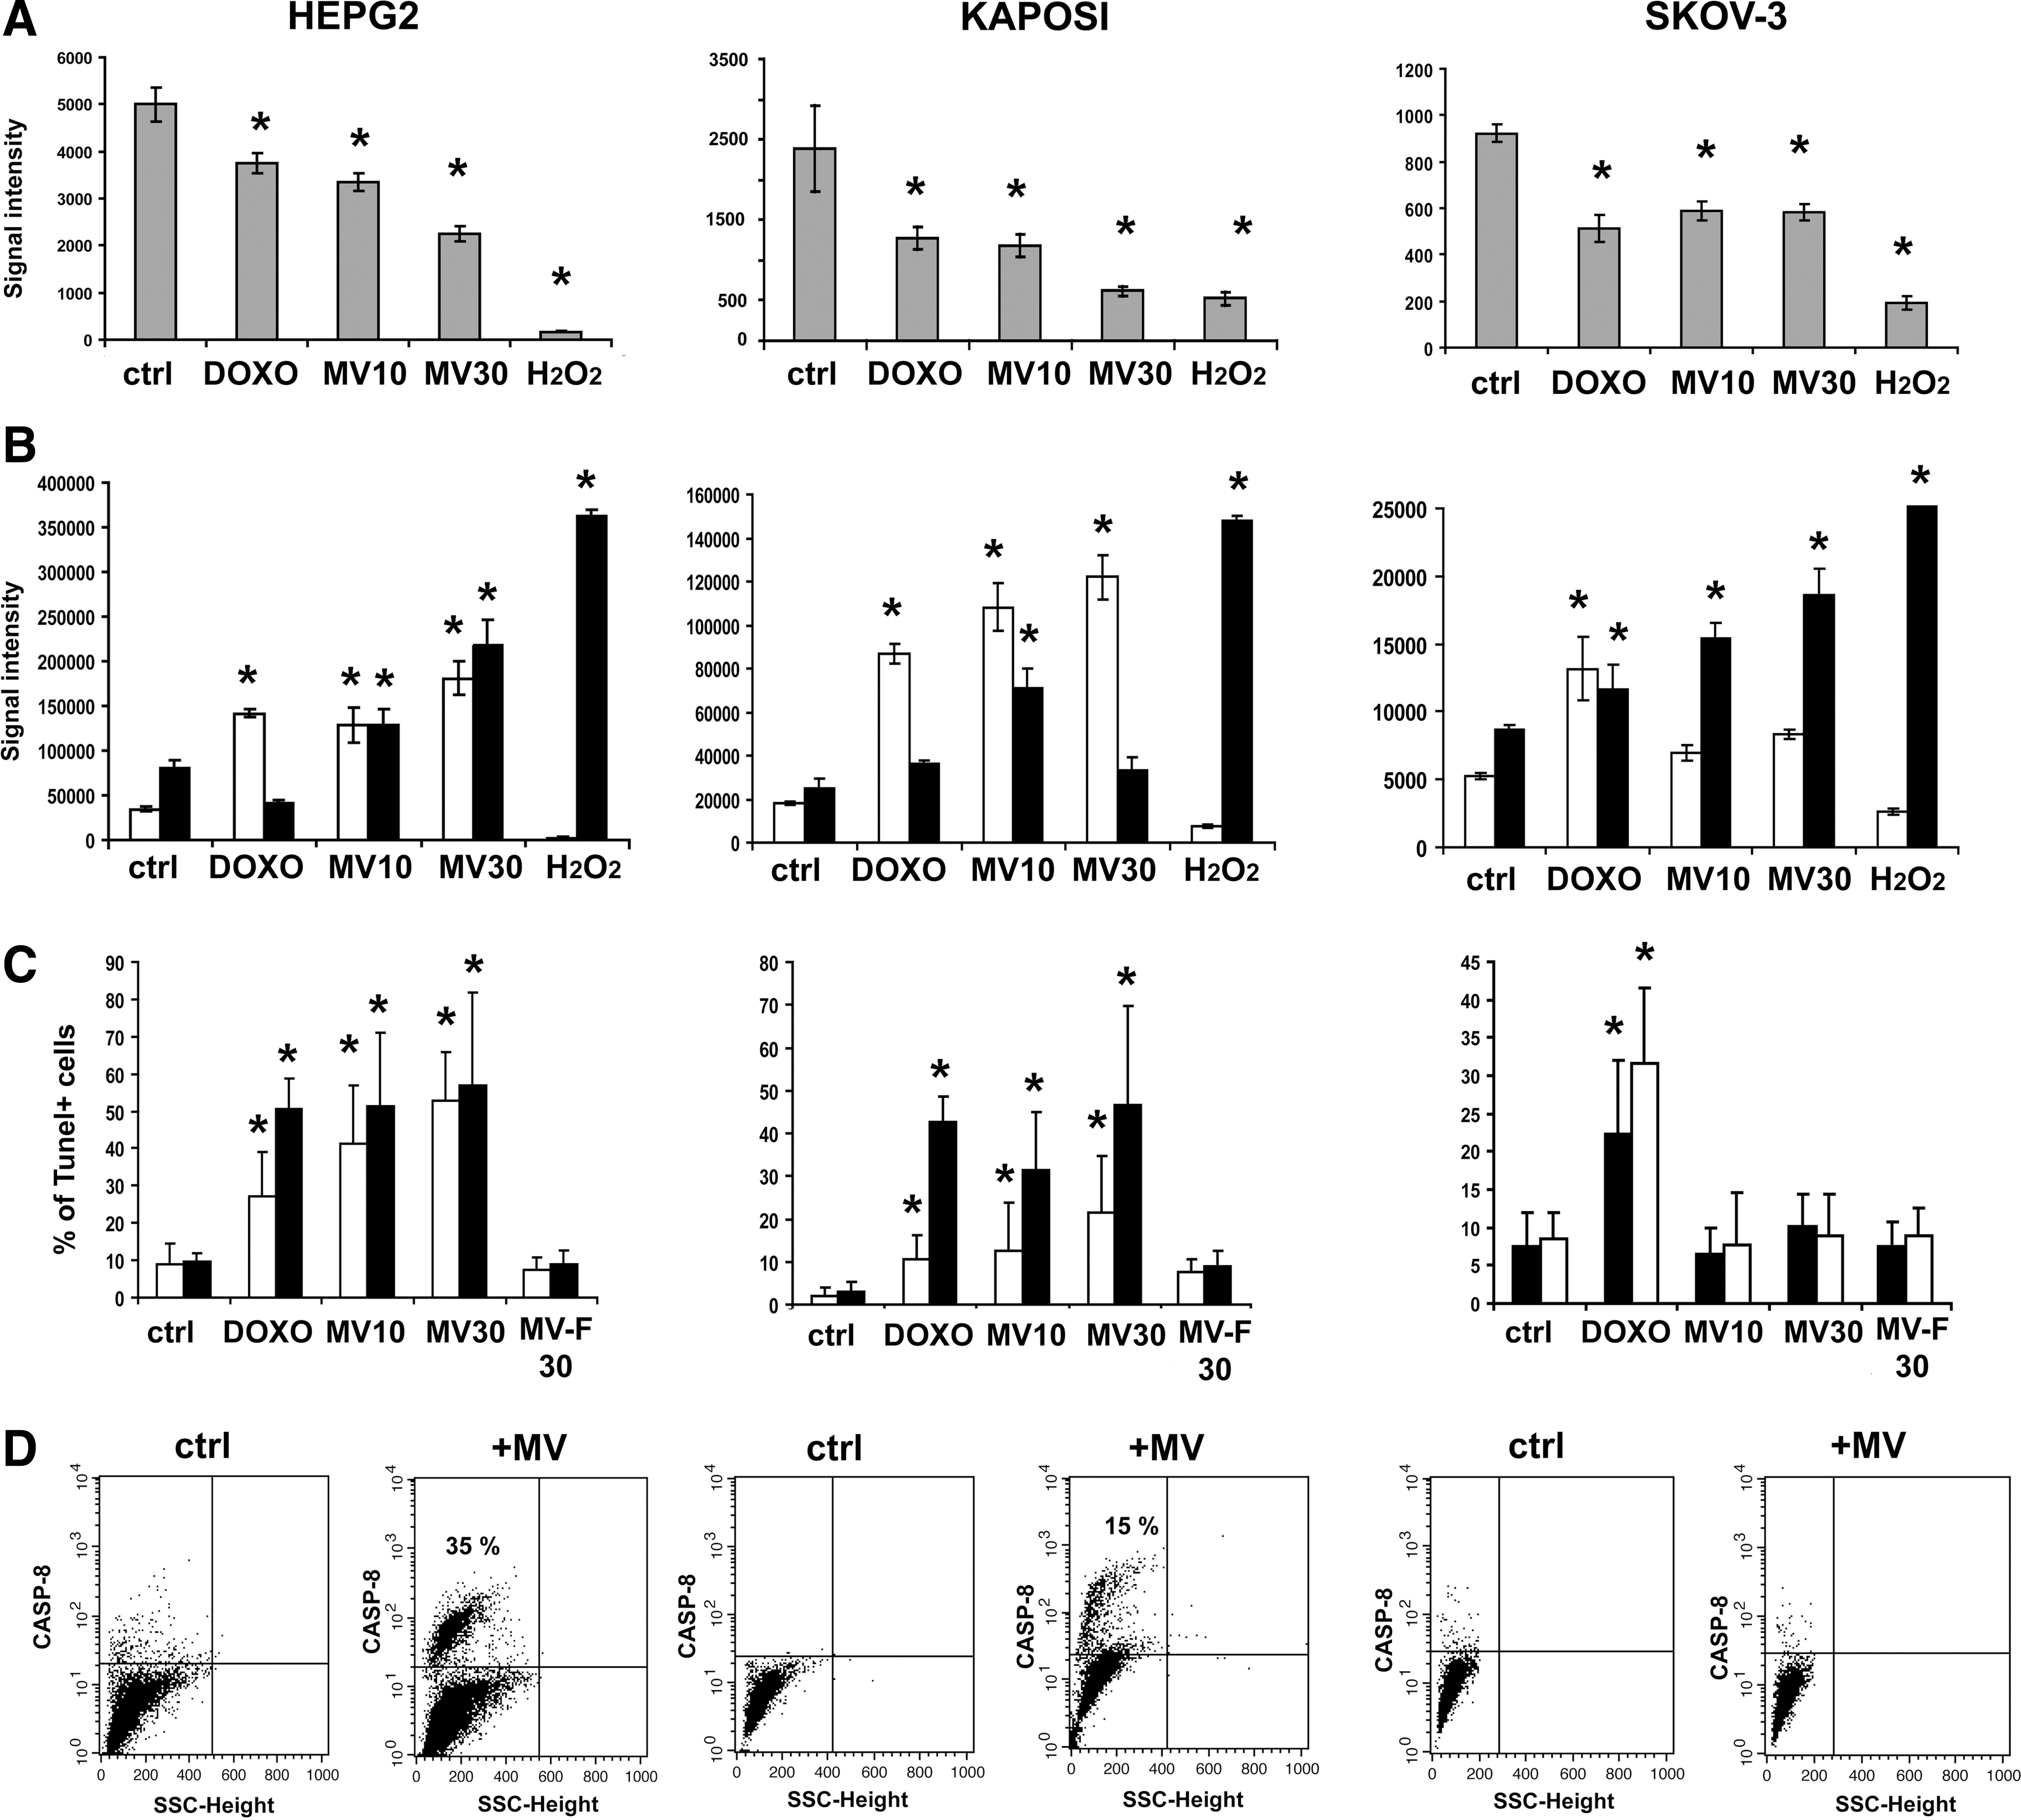
Effect of MVs on cancer cell line viability.
The presence of MV-induced apoptosis in HepG2 and Kaposi cells, but not in Skov-3 was confirmed by the Tunel technique. MVs derived from human fibroblasts, used as control, did not induce apoptosis (Fig. 6C). The activation of caspase 8, a marker of the extrinsic apoptotic pathway, was observed by FACS analyses both in HepG2 and in Kaposi cells (Fig. 6D) after MV treatment. On the contrary, Skov-3 cells did not show activation of caspase 8.
Effect of MVs on HepG2, Kaposi, and Skov-3 tumor growth in vivo
To determine the effect of MVs on tumor growth in vivo, SCID mice were injected subcutaneously with HepG2, Kaposi, and Skov-3 cells within Matrigel. When the implanted tumors raise the volume of ∼15 mm3, we started the weekly intra-tumor injection of MVs.
Intra-tumor injection of MSC-derived MVs significantly inhibited the tumor growth of all the cell lines (Fig. 7A). At sacrifice, the tumor weight was significantly smaller in SCID mice treated with MSC-derived MVs (Fig. 7B) than in controls injected with vehicle alone or with MV from fibroblasts. The histological analyses showed extensive areas of necrosis in tumors treated with MVs derived from MSCs (Fig. 8A). Moreover, histological evaluation, by the Tunel technique, of tumor sections indicated the presence of apoptotic cells in HepG2 and Kaposi's tumors, but not in Skov-3 tumors (Fig. 8B), confirming the in vitro data.
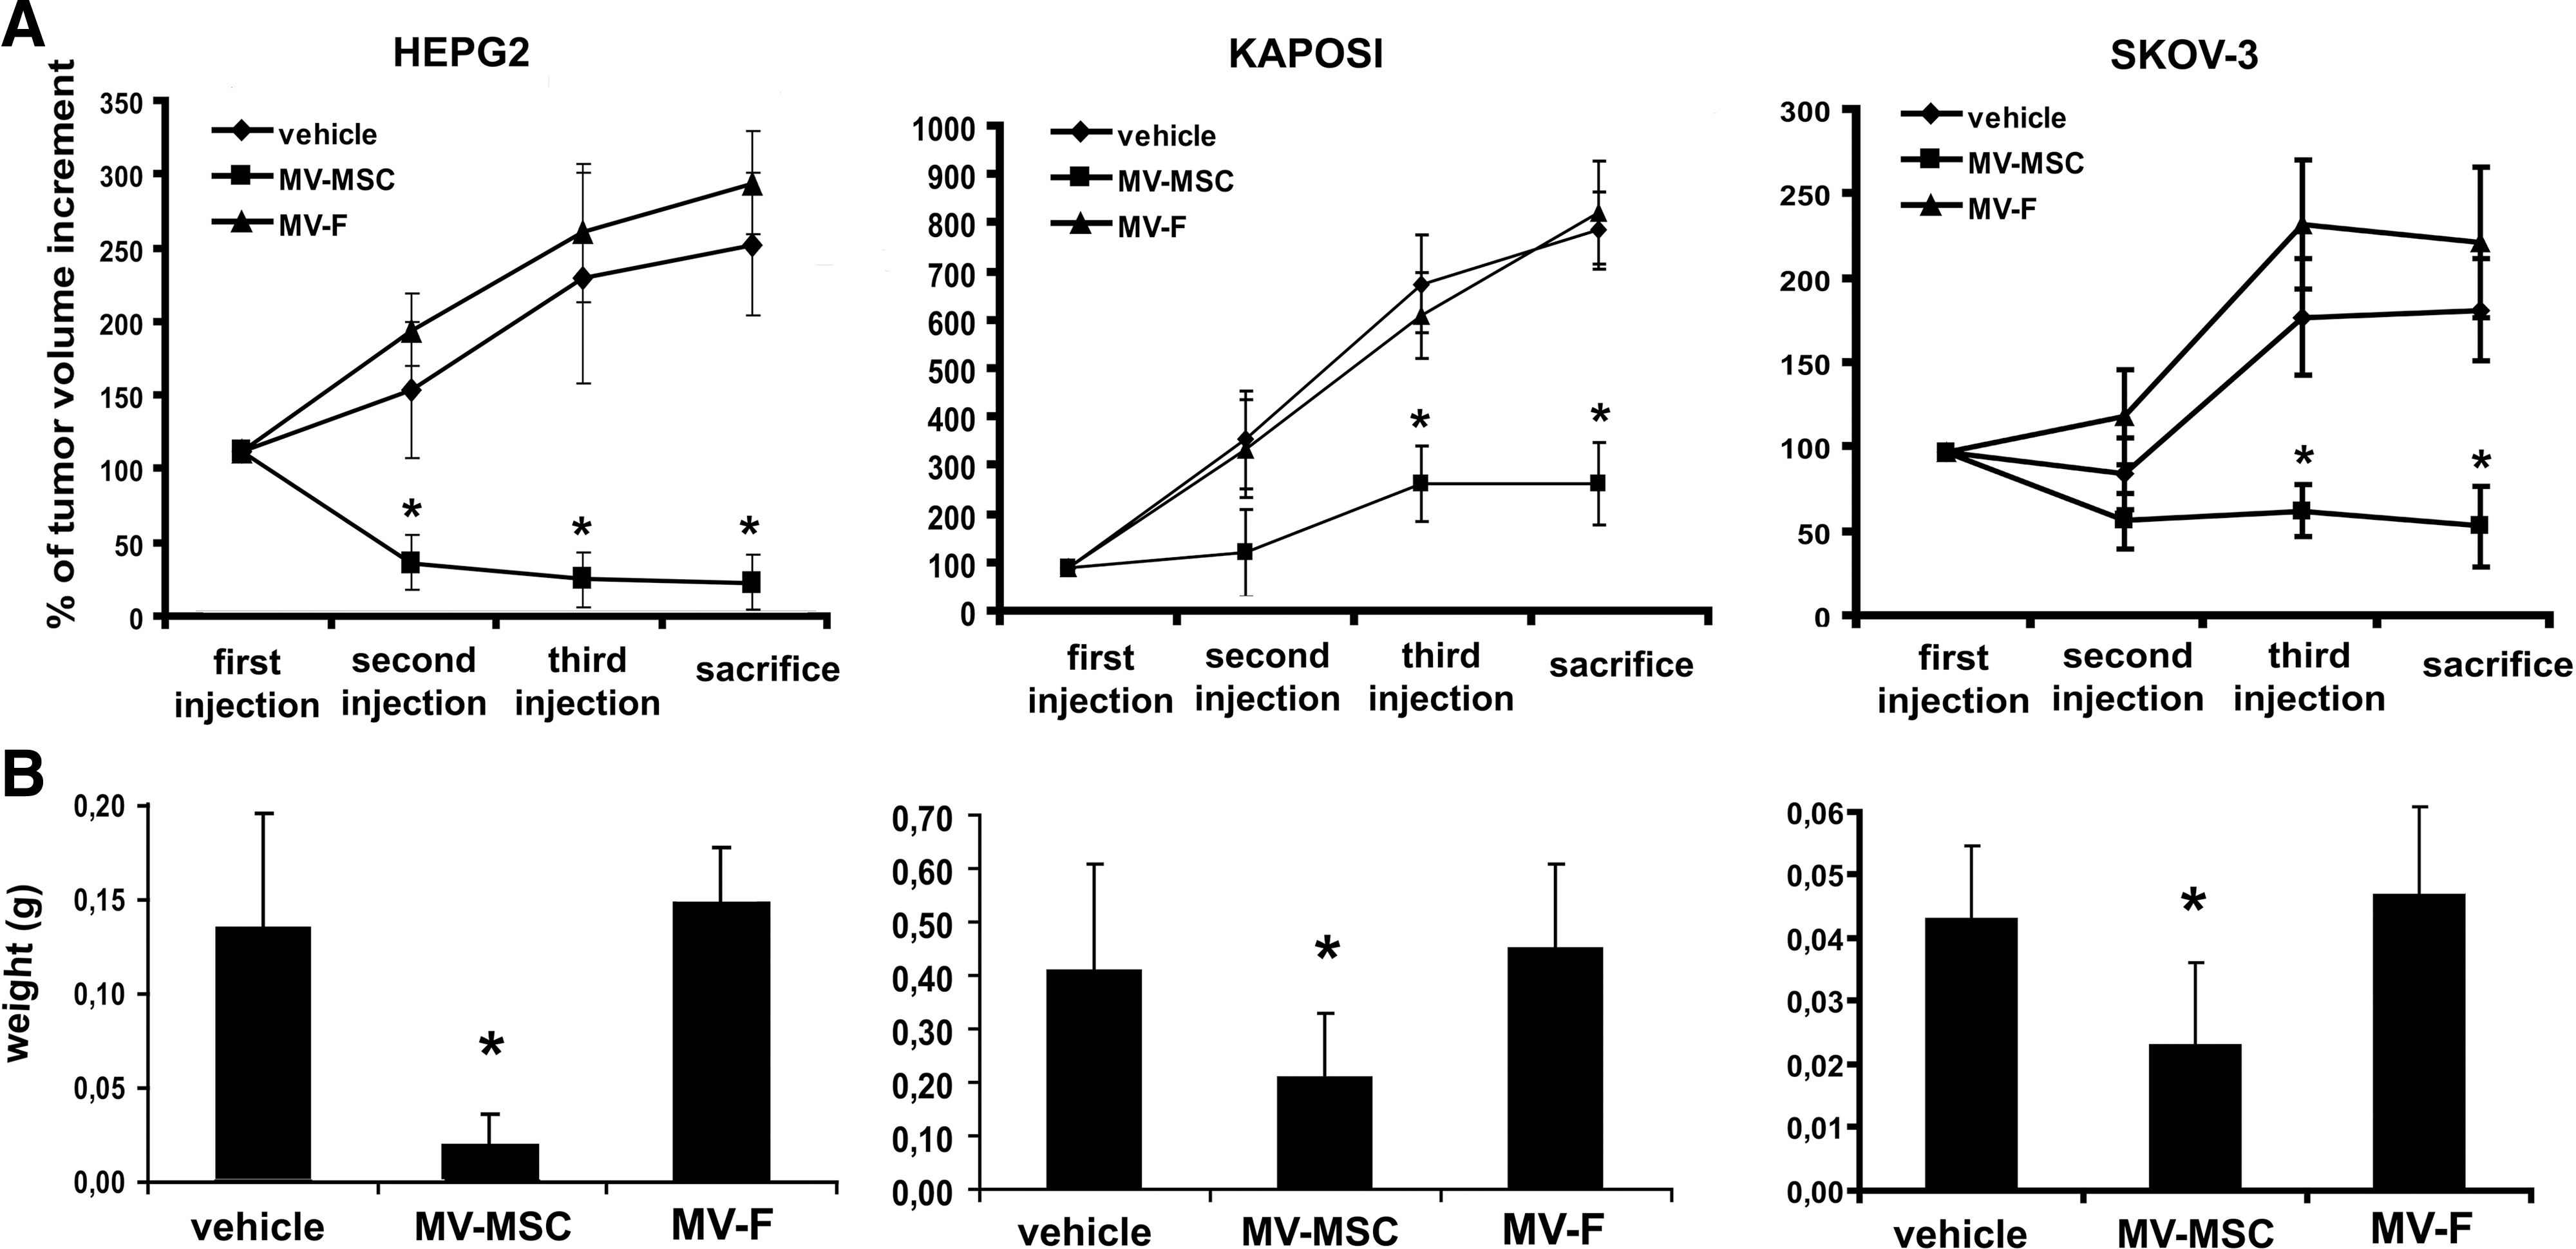
In vivo effect of MVs on tumor growth.
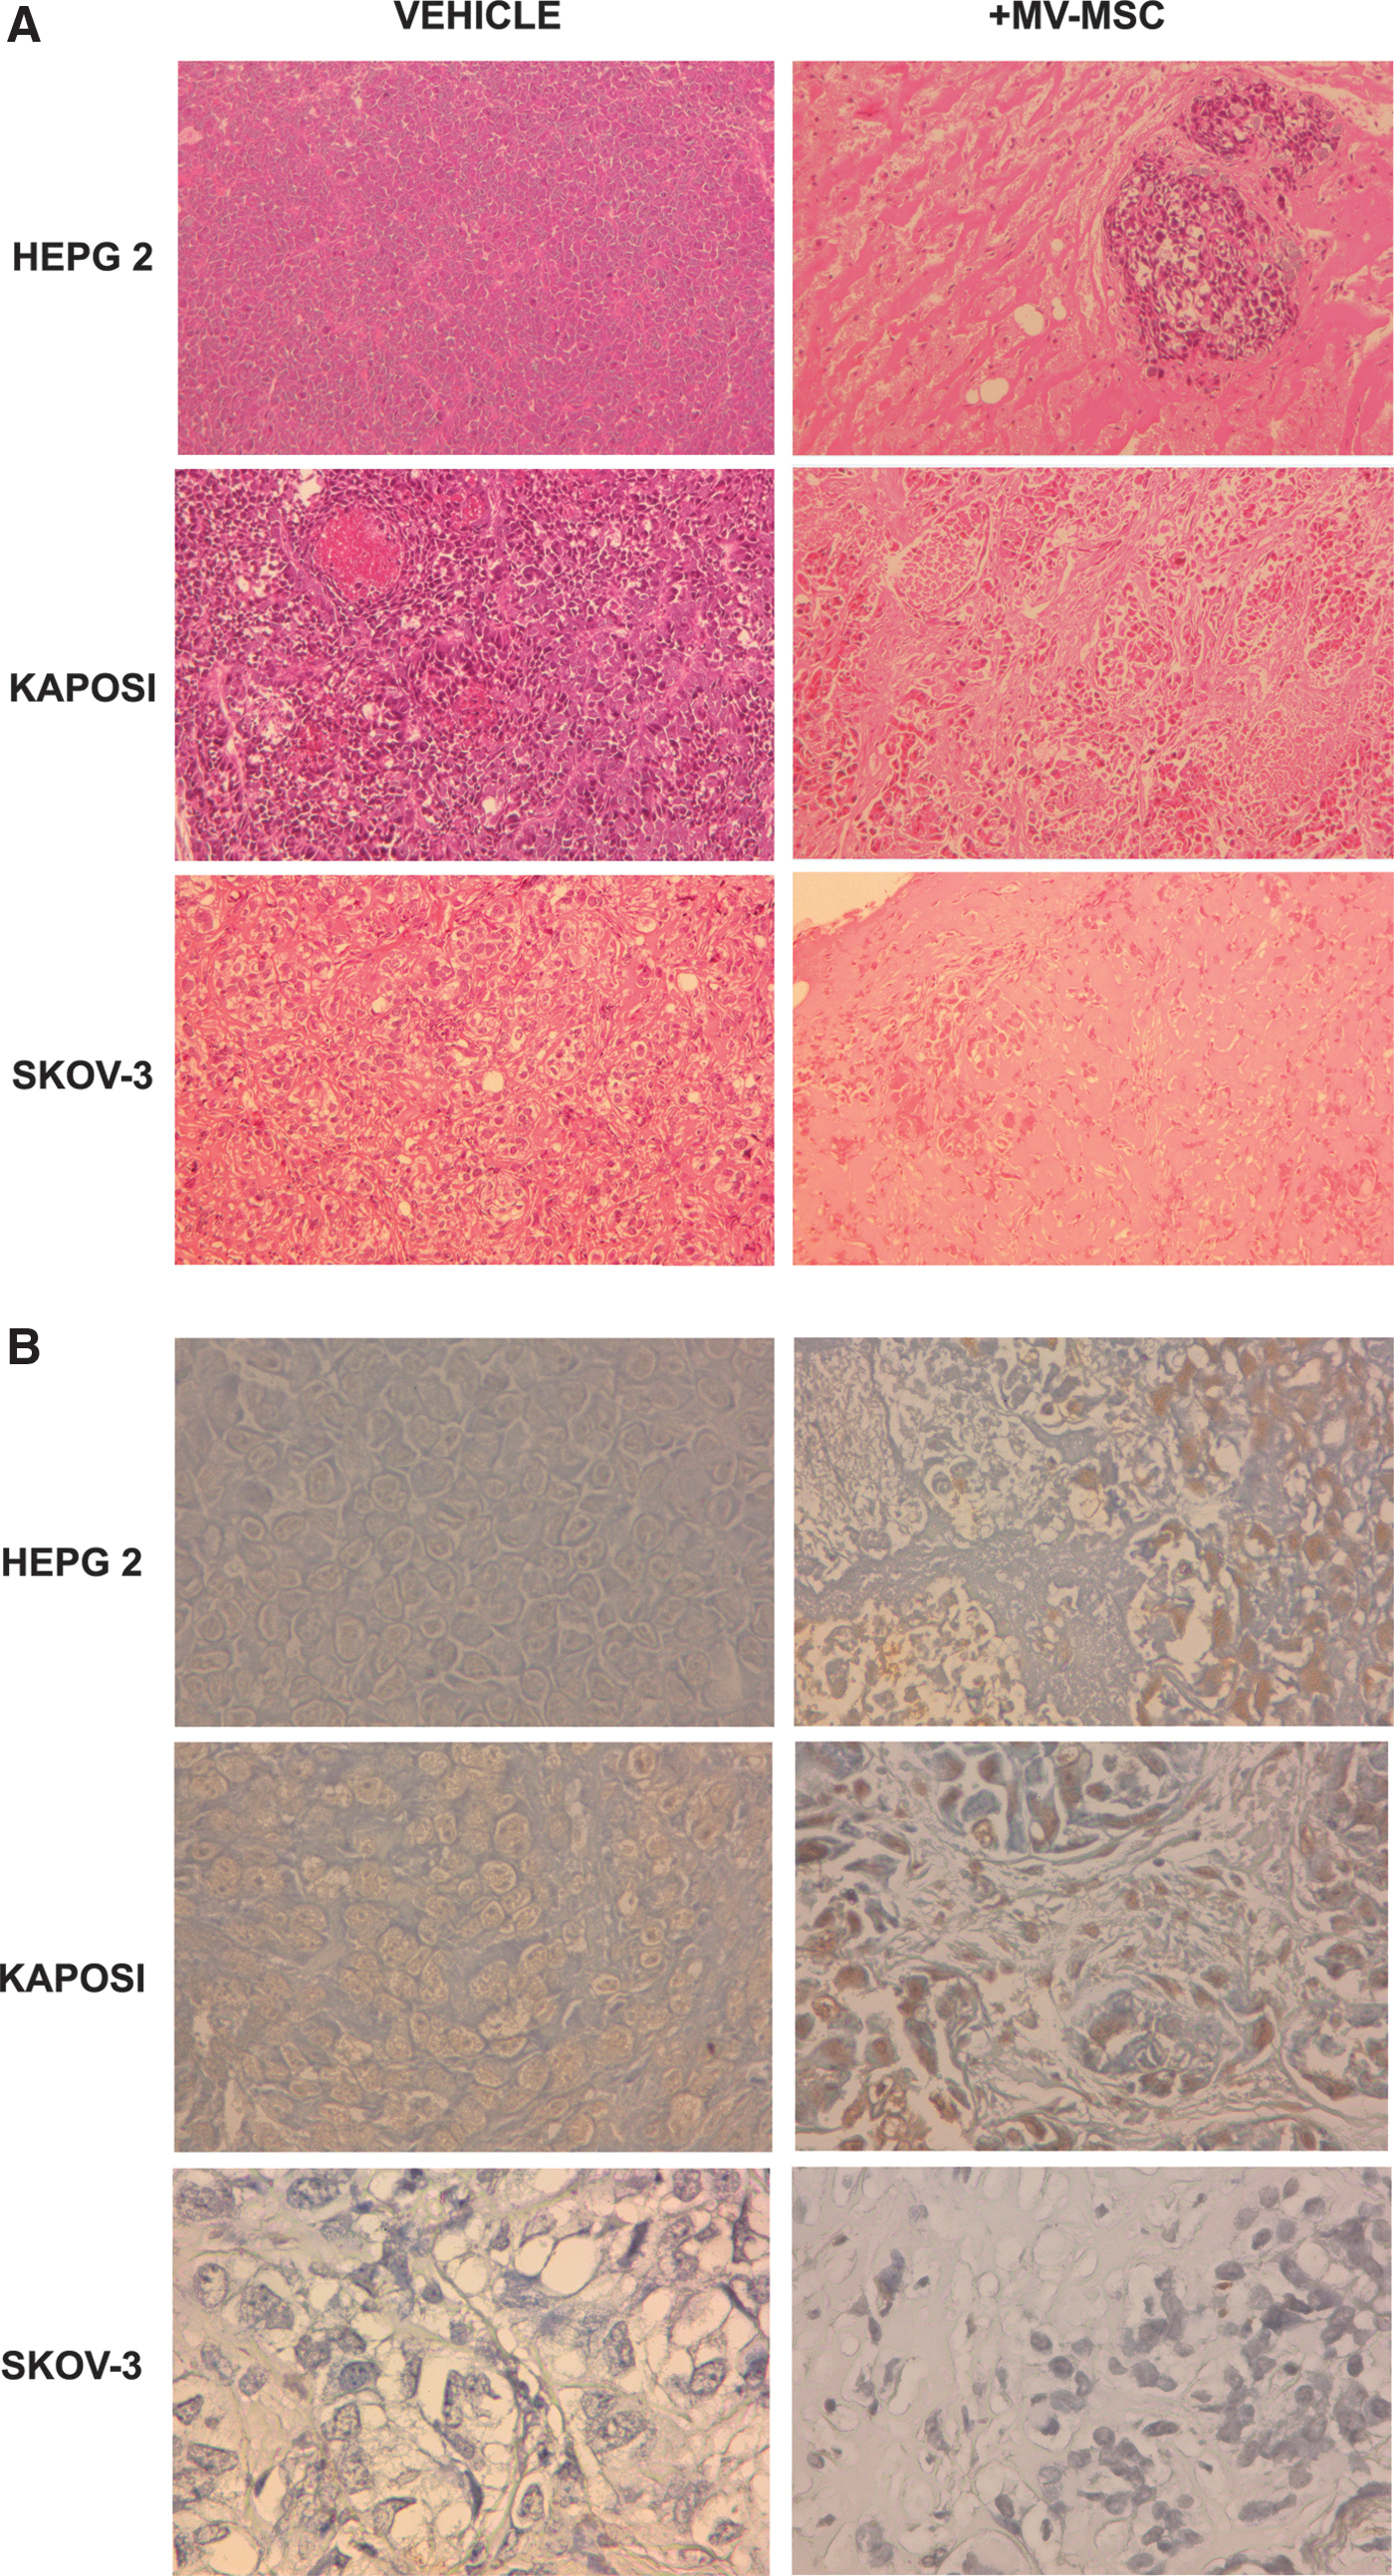
In vivo antitumor effect of MSC-derived MVs.
Discussion
The results of the present study demonstrated that MVs derived from human bone marrow MSCs inhibited both in vitro and in vivo growth of HepG2, Kaposi, and Skov-3 cancer cell lines. The specificity of MSC-derived MVs was indicated by the absence of anti-tumor effect of MVs derived from human fibroblasts.
Extracellular particles (exosomes and shedding MVs) have been recently described as new mediators of cell-to-cell communication that may reprogram target cells through the active transfer of proteins, functional mRNAs, and miRNAs [13,28] and are involved in the genetic exchange among cells [15 –18,29]. Moreover, it has been reported that MVs, released by cancer cells may alter the genetic phenotype of normal cells favoring tumor progression [30]. Similarly, MVs released by injured cells were shown to influence gene expression and protein production of target cells, by direct delivery of RNA and induction of transcription [31,32].
In the present study, we found that MVs derived from human bone marrow MSCs significantly affected cell cycle of HepG2, Kaposi, and Skov-3 cancer cell lines. An increase of cells in the G0-G1 phase was observed suggesting a block in cell cycle progression. In HepG2 and Kaposi cells, MVs induced the appearance of a sub-G1-peak associated with a decrease of viability due to an enhanced apoptosis. At variance, in Skov-3 cells, MVs did not induce apoptosis, but rather necrosis. In addition, an inhibition of cell proliferation was observed in all cell lines. Different genes, involved in the control of cell cycle, were modulated in the diverse cancer cell lines. The observed activation of negative regulators of cell cycle progression in cells treated with MVs may explain their biological effects. These results indicate that MV incorporation in different cancer cell lines caused a de-regulation of cell cycle progression, halted proliferation, thus leading to cell death by apoptosis or necrosis. Similar results have been reported also for MSCs that can inhibit in vitro cancer cell proliferation, causing a transient arrest in the G1 phase of cell cycle [4,33]. The cell-to-cell contact was not necessary for this effect, as the antiproliferative effect was also observed with MSC-CM [11,33]. The ability of MSCs to interfere with the cell cycle has been also described for stromal cells derived from human adipose tissue [8], from normal breast tissue [34] and from palatine tonsil [35].
Our results differ from those of Zhu et al., who observed that exosomes produced by MSCs increased tumor incidence and growth, when tumor cells were mixed with exosomes before the injection in nude mice [36]. The mechanism was ascribed to an enhancement of tumor cell proliferation and of angiogenesis that favors tumor engraftment. In our experimental setting, MVs were injected weekly in an established tumor inducing tumor regression. A similar discrepancy has been described for MSCs that promote tumor growth when coinjected with tumor cells [1 –4], but inhibited the tumor progression when administered to established tumors [6 –10].
Therefore, the timing of MSC or MV injection is critical as suggested by Klopp et al. [12]. In all studies reporting tumor growth promotion, MSCs were mixed with tumor cells and coinjected [1 –5,37]. The presence of MSCs during the early phase of tumor growth may facilitate the angiogenic shift of tumor that is required for tumor initiation. In fact, an increase in vessel density was observed when MSCs were coinjected with different tumor cell lines [29,38]. By contrast, MSCs induced endothelial cell apoptosis in established Matrigel capillaries inducing regression of melanoma xenografts [39]. The inhibitory effect of MSCs, when iv injected in a experimental model of established tumors, has been attributed not only to an antiangiogenic effect, but also to an inhibition of tumor growth [6,7].
MV administration may have some advantages in respect to MSCs, as MVs inhibit cell cycle progression of tumor cells without the risk of MSCs to differentiate into stromal fibroblasts that may favor tumor growth [40,41].
In conclusion, the present study demonstrated that MVs from human bone marrow MSCs induce in vitro cell cycle arrest and apoptosis or necrosis of different tumor cell lines and in vivo inhibit growth of established tumors.
Footnotes
Acknowledgments
This study was supported by Associazione Italiana per la Ricerca sul Cancro (A.I.R.C.), project IG8912, by the Italian Ministry of University and Research (MIUR) Prin08 and by Regione Piemonte, Project Oncoprot and Piattaforme Biotecnologiche, Pi-Stem project.
The technical assistance of Federica Antico is gratefully acknowledged.
Author Disclosure Statement
C.T. (Fresenius Medical Care) is employed by commercial companies and contributed to the study as researchers. S.B., C.T. and G.C. are named inventors in related patents.